DOI:10.32604/biocell.2021.010119
www.techscience.com/journal/biocell
| Biocell DOI:10.32604/biocell.2021.010119 | www.techscience.com/journal/biocell |
| Article |
The F5 gene predicts poor prognosis of patients with gastric cancer by promoting cell migration identified using a weighted gene co-expression network analysis
1Department of Medical Oncology, The First Hospital of China Medical University, Shenyang, China
2Key Laboratory of Anticancer Drugs and Biotherapy of Liaoning Province, The First Hospital of China Medical University, Shenyang, China
3Liaoning Province Clinical Research Center for Cancer, Shenyang, China
4Key Laboratory of Precision Diagnosis and Treatment of Gastrointestinal Tumors, Ministry of Education, Shenyang, China
*Address correspondence to: Zhi Li, zli@cmu.edu.cn; Xiujuan Qu, xiujuanqu@yahoo.com
Received: 12 February 2020; Accepted: 18 May 2020
Abstract: Distal gastric cancer (DGC) is a subgroup of gastric cancer (GC), which has different molecular characteristics from proximal gastric cancer (PGC). These differences result in different overall survival (OS) rates; however, data pertaining to the survival rate in PGC or DGC are contradictory. This suggests that the location of GC is not the unique cause of the different survival rates, while the molecular characteristics might be more important factors determining the prognosis of DGC. Therefore, the aim of this study was to discover key prognostic factors in DGC using bioinformatic methods and to explore the potential molecular mechanism. The Cancer Genome Atlas (TCGA) public database was employed to screen data relating to DGC, and we conducted a weighted gene co-expression network analysis (WGCNA) on DGC patient samples to establish co-expression modules. High-weight genes (hub genes) in a dominant color module were identified. In vitro experiments and gene set enrichment analyses (GSEA) were carried out to elucidate the potential molecular mechanism. In this study, 139 DGC samples were enrolled to perform a co-expression analysis. According to the correlation between gene modules and clinical characteristics, the royal blue module related to stage M of DGC was screened, and a survival analysis was conducted to show that high-coagulation-factor V (F5) expression was related to the short OS of patients with GC. In vitro experiments confirmed that F5 could promote the migration of GC cells. GSEA suggested that F5 might have affected the prognosis of GC by modulating the activities of the Wnt and/or the TGF-β signaling pathways. Our results indicated that high F5 expression predicts poor prognosis of patients with DGC, and it functions probably by promoting cell migration through the Wnt and/or the TGF-β signaling pathways.
Keywords: Distal gastric cancer; WGCNA; F5; Cell migration; Poor prognosis
Gastric cancer (GC) is a high-risk tumor with the highest mortality and morbidity rates worldwide. GC is often diagnosed at an advanced stage when patients have a median overall survival (mOS) of about 10–12 months. According to the location of the disease, GC can be divided into proximal gastric cancer (PGC), middle stomach cancer, and distal gastric cancer (DGC). Epidemiological studies have shown that the biological and pathological characteristics of DGC are different from PGC (Devesa et al., 1998). For example, DGC tends to have poorly differentiated tumors compared with PGC, and DGC is associated with more advanced tumor stage and older age compared with PGC (Wang et al., 2019). Different biological and pathological characteristics result in different overall survival (OS) rates. However, the data pertaining to rates of survival of DGC or PGC are contradictory. A study (Higuchi et al., 2004) has reported shorter survival in patients with DGC compared to those with PGC, while some reports (Pacelli et al., 2001; Petrelli et al., 2017; Yu et al., 2018) have shown longer overall survival (OS) in DGC patients. Even though, another study (Costa et al., 2016) has shown no obvious difference in the prognosis of DGC and PGC. Therefore, the location of GC is not the unique cause of the different survival rates. Investigation of the molecular characteristics might be more important, which may be one of the decisive factors determining clinical biological behavior and prognosis of DGC.
Currently, the molecular mechanism that underlies the development of GC remains to be fully elucidated. A study has shown that cell invasion and migration in GC can be promoted by homeobox C10 (HOXC10) through the upregulation of pro-inflammatory cytokines (Li et al., 2020). Moreover, proliferation and migration in GC could be promoted via activation of the Wnt signaling pathway by LncRNA HLA complex group 11 (HCG11) (Zhang et al., 2019). However, there are no reports on the biomarkers related to DGC.
Weighted gene co-expression network analysis (WGCNA) is an approach used in the co-expression module correlation analysis from microarray samples (Langfelder and Horvath, 2008). WGCNA has been used in various biological scenarios and is useful in the exploration of therapeutic targets or potential biomarkers (Ivliev et al., 2010).
In this study, we aimed to reveal potential molecular mechanisms leading to the development of DGC using WGCNA. Our results suggested that high-coagulation-factor V (F5) expression results in a poor prognosis of patients with DGC by promoting cell migration, and which might function by regulating the Wnt and/or the TGF-β signaling pathways.
Data source and data processing
RNA-sequencing data of gastric cancer samples and relevant clinical data were downloaded from the database of TCGA (http://cancergenome.nih.gov/). It was used as data to perform our study.
Data inclusion and exclusion criteria
(1) Data which was at least 18 years of age were eligible for enrollment; (2) The sample must have been pathologically confirmed as gastric cancer; (3) The gastric cancer data in TCGA contains six aspects: Gastroesophageal Junction, Cardia/Proximal, Fundus/Body, Antrum/Distal, Stomach (NOS) and Other (please specify). We chose the “Antrum/Distal” part as DGC to perform our study.
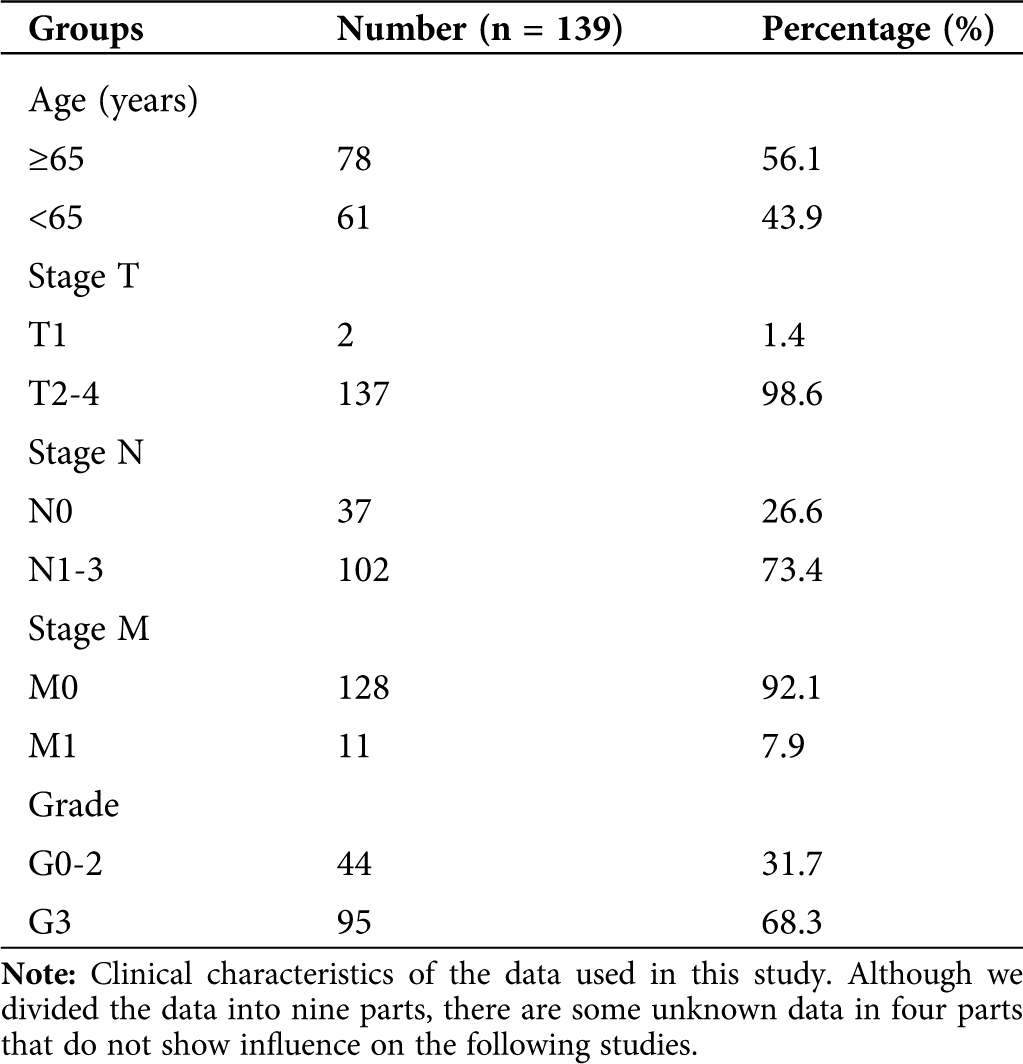
For the selected distal gastric cancer data, the genes were sorted by the median absolute deviation variance size, and the front 3600 genes were extracted. The clinical characteristics of the sample contained nine aspects: histological grade, stage T, stage N, stage M, gender, race, tumor stage, age, and morphology.
Construction of co-expression network
WGCNA package was used to build a co-expression network (139 samples of DGC were used) in R after the 3600 most variant genes were tested. The adjacency matrix Amn was defined, and the soft-thresholding parameter β = 4 was chosen. Then, we constructed the topological overlap matrix (TOM) to counter the effects of missing or spurious connections between network nodes.
Next, the average linkage hierarchical clustering was conducted to classify genes into gene modules with high absolute correlations. The minimum size was 30.
Correlation between clinical characteristics and different modules
With the purpose to identify modules associated with clinical characteristics (distal gastric cancer), the correlation between clinical characteristics and module eigengenes was calculated by the Spearman correlation analysis and a p-value of <0.05 as statistically significant. Meanwhile, we tested the module significance defined as the average gene significance of each gene in the linear regression between the clinical characteristics and gene expression. In general, the correlation between clinical characteristics and module eigengenes tended to be related to the module significance.
Genes within the co-expression module are highly connected and have similar effects. The hub genes we filtered in each module based on the connectivity within the module and the correlation with the module’s characteristic genes. The cytoHubba plugin was used to extract the hub genes in every module with the purpose of obtaining a balance between the core genes and avoid missing any key gene based on Cytoscape (Chin et al., 2014).
With the purpose to evaluate each hub gene as a prognostic marker of distal gastric cancer, we conducted survival analyses. We divided DGC samples into 2 groups based on the median expression values of the gene. The R package “survival” was used to create K-M survival curves to assess the prognostic value, and the log-rank test was used to evaluate differences between groups. After this, the p-values were produced. On the other hand, the prognostic value of hub gene expression in GC was analyzed again by using Kaplan–Meier Plotter on-line database (https://kmplot.com/analysis/).
Differential expression of hub genes and PPI network constructions
The on-line database Gene Expression Profiling Interactive Analysis (GEPIA) (http://gepia.cancer-pku.cn) was used to identify the differential expression of target molecules between the gastric cancer tissue and gastric tissue. GEPIA is an interactive web that includes 8587 normal and 9736 tumors samples from TCGA and the GTEx projects (Tang et al., 2017). Besides, the Protein-Protein Interaction (PPI) Network Construction was performed using the STRING web (https://string-db.org/cgi/input.pl) method to analyze the function of the protein encoded by the target gene.
Cytological experiments verify the effect of selected hub genes on gastric cancer cells
We obtained GC cells lines MGC803, BGC823, SGC7901 and HGC27 from the Type Culture Collection of the Chinese Academy of Sciences (Shanghai, China), which were cultured with RPMI-1640 medium containing 10% heat-inactivated fetal bovine serum (FBS) and 1% penicillin-streptomycin. They were cultured in a humidified incubator at 37°C containing 5% CO2, digested, and passaged with 0.25% trypsin digest, and passaged once every 2–3 days. We used logarithmic growth phase cells in all experiments.
The specific siRNAs targeted to F5 and corresponding negative control (NC), were compounded by RiboBio (Guangzhou, China). SGC7901 cells (2 × 10⁵) were transfected with siRNAs Lipofectamine 2000 reagent (Invitrogen) Transfection Reagent based on the manufacturer’s instructions.
RT-qPCR detection of mRNA expression levels
Total RNA was isolated with Trizol reagent (Invitrogen, USA) and quantified by measuring the absorbance at 260 nm by nanodrop 2000 (Thermo Fisher Scientific, USA). For mRNA detection, we used the One Step PrimeScript mRNA cDNA Synthesis Kit (Takara, Japan) to carry out reverse transcription. SYBR Premix EX TaqTM II (Perfect Real Time) (Takara, Japan) was used to generate cDNA from 1000 ng total RNA. The Applied Biosystems 7500 Real-Time PCR Systems (Thermo Fisher Scientific, Waltham, MA, USA) was used to run the RT-qPCR. The conditions of PCR were 30 s at 95°C, followed by 45 cycles at 95°C for 5 s, and at 58°C for 25 s. The Applied Biosystems 7500 software program (version 2.3) was used to analyze the data. The fold change of the RNA expression was calculated by the 2−ΔΔCt method.
The PCR primers used are as follows:
F5: Forward (5’-ACCACAATCTACCATTTCAGGAC-3’) and Reverse (5’-CTTCTCCGCAGGGAATGTGT-3’).
18S: Forward (5’-CCCGGGGAGGTAGTGACGAAAAAT-3’) and Reverse (5’-CGCCCGCCCGCTCCCAAGAT-3’).
Cell viability was determined using MTT assay. Briefly, the 96-well plates with a cell density of 4 × 10³ cells/well for 72 h were used to incubate SGC7901 cells, which were transfected with the F5 siRNA or NC siRNA. After treatment of cells with various conditions, the medium was removed, and 20 μL of MTT (5 mg/mL; Sigma Chemical Co., St Louis, MO, USA) was added to each well for 4 h incubation at 37°C. Then 200 μL of DMSO was added to each well. After shaking for 5 min, a microplate reader (model 550; Bio-Rad Laboratories, Inc., Hercules, CA, USA) was used to measure the absorbance at 570 nm.
We carried out the migration assays in a 24-well chamber and used 8-μm pore size membranes (Corning, USA) to inserted polycarbonate. For migration assay, 3 × 10⁴ cells were plated within 200 μL serum-free medium onto the upper chamber, and 500 μL medium with 2.5% FBS was added to the lower chamber. After incubating for 24 h, the chambers were fixed with methanol and then stained with 0.1% Wright-Giemsa dye. We captured 5 different fields and counted at 20X magnification per well. Fluorescence microscopy (BX53, Olympus, Japan) was used to visualize the cells. Each experiment was carried out at least three times.
Gene Set Enrichment Analysis (GSEA) was exploited to study the interpretation and analysis of the long lists of genes generated from high-throughput transcriptomic experiments (Mootha et al., 2003; Subramanian et al., 2005). Each hub genes of 443 GC samples in TCGA were divided into two groups according to the median expression values. We performed GSEA using the Java GSEA implementation to seek the potential function of targeted genes. We selected annotated gene set c2.cp.kegg.v5.0.symbols.gmt (Version 5.0 of the Molecular Signatures Database) as the reference gene set. The information on the signaling pathways was found by on-line web analysis (https://www.kegg.jp/kegg/pathway.html).
For continuous variables, mean ± SD was used to express the normal distribution, and the median (range) was used to express the non-normal, whereas count (percentage) was applied to the categorical variables. We chose a p-value of <0.05 as statistically significant (two-tailed). We used SPSS Version 22.0 and R (version 3.5.3) to carry out these statistical analyses.
We obtained 139 tissue sample raw files from TCGA (Tab. 1). All selected expression datasets were log2-transformed, then standardized.
Table 1: Clinical characteristics of DGC samples from TCGA
Construction of co-expression networks
A network was constructed from the filtered probes which identified 21 modules. The soft-thresholding power 4 was selected to specify the adjacency matrix based on the standard of approximate scale-free topology (Fig. 1). We chose the module detection sensitivity deepSplit2, minimum module size 30, and cut height for merging of modules 0.25, which implied that the modules with an eigengene that has a correlation with different clinical characteristics of DGC higher than 0.75 have to be merged (Fig. 2).
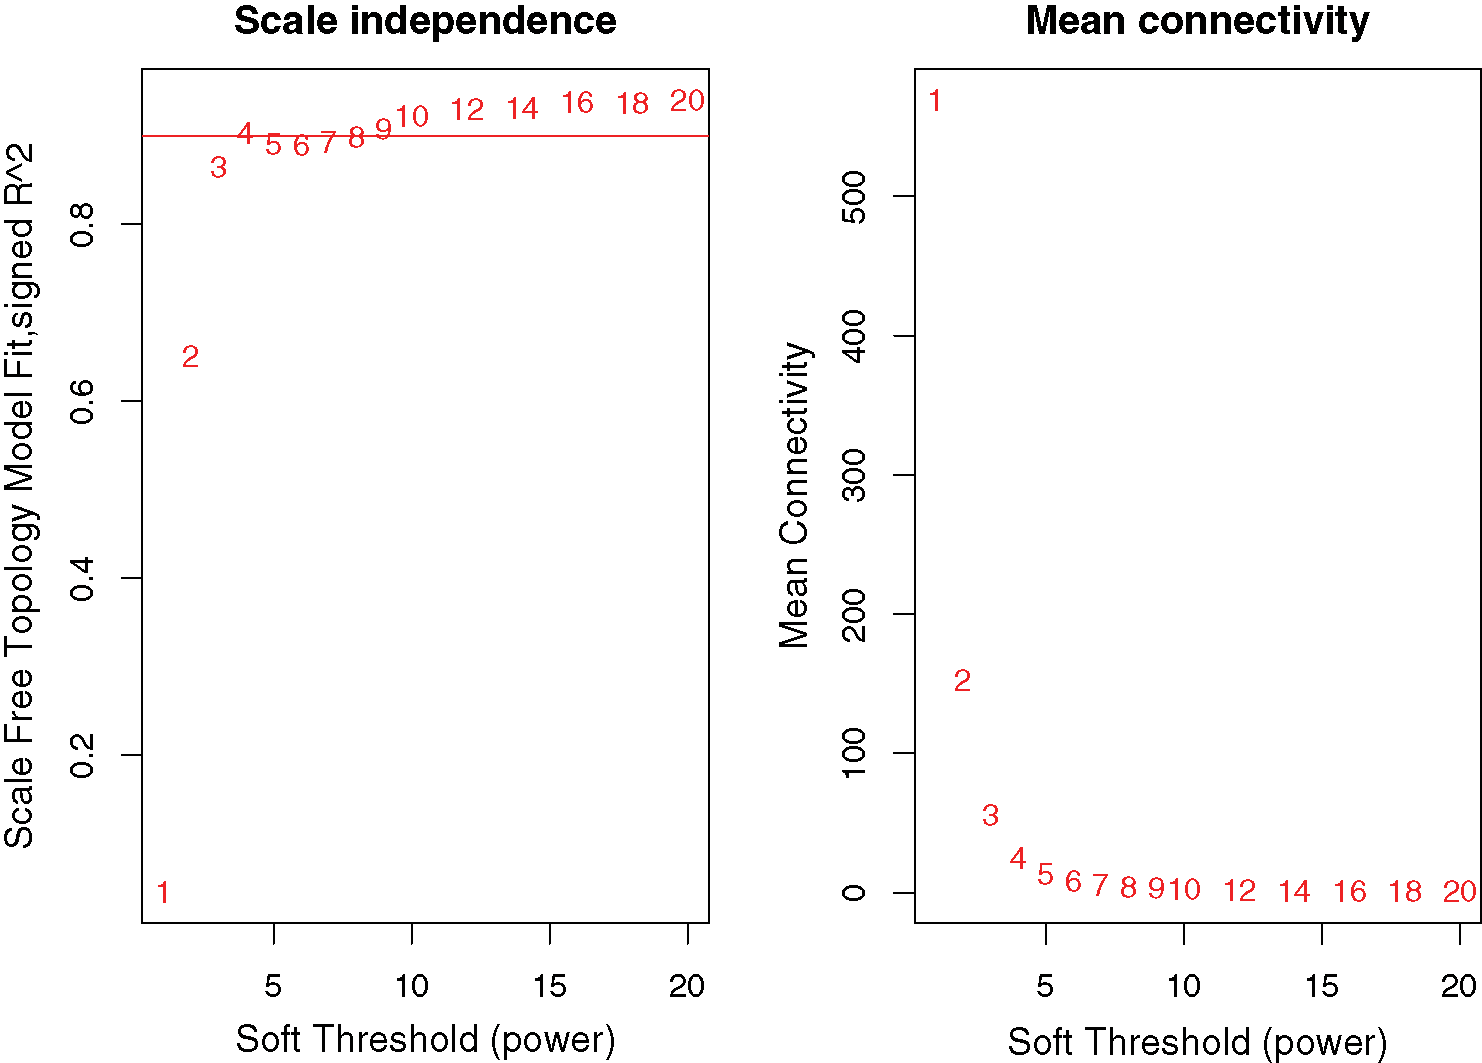
Figure 1: Network topology for different soft-thresholding powers.
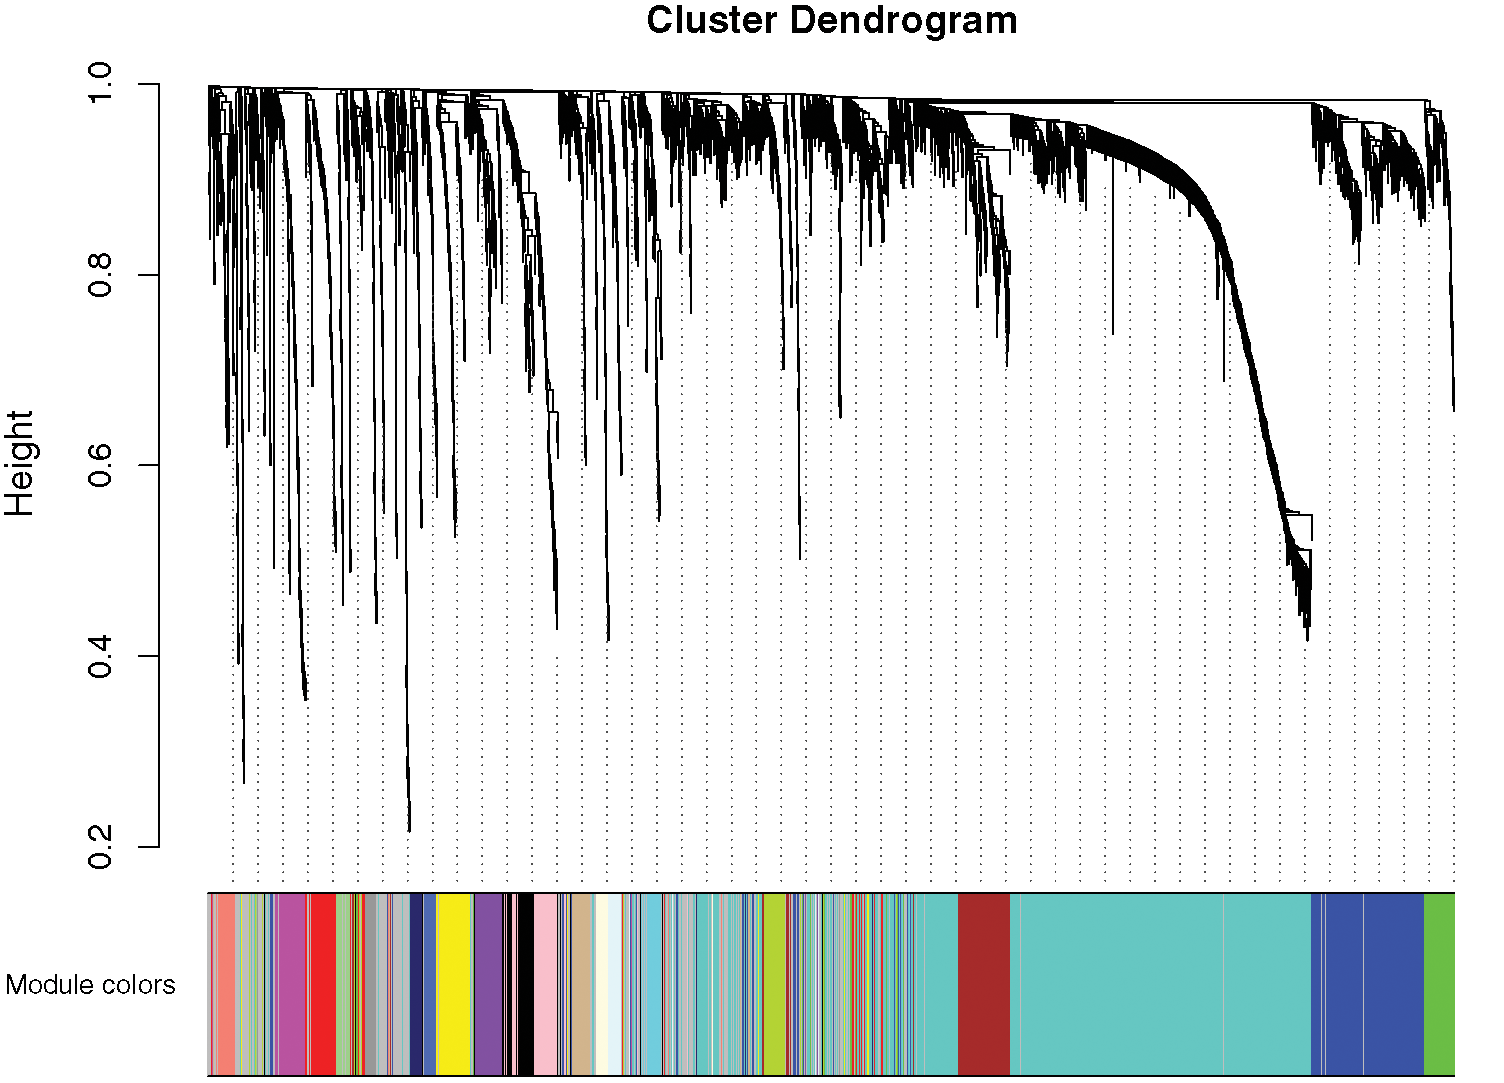
Figure 2: Gene modules identified by WGCNA.
Correlation between different modules and clinical characteristics of DGC
Similar expression profiles in some modules were found in the analysis. We analyzed the connectivity of eigengenes to understand interactions amongst the 21 co-expressed modules and performed a cluster analysis. In conjunction with Fig. 3, significant differences were detected amongst the 21 modules, which may be due to different clinical parameters in the development of GC. For example, royal blue and green-yellow patches may be associated with the stage M of DGC, black and pink patches may be associated with tumor grade, and yellow patches may be negatively correlated with tumor grade.
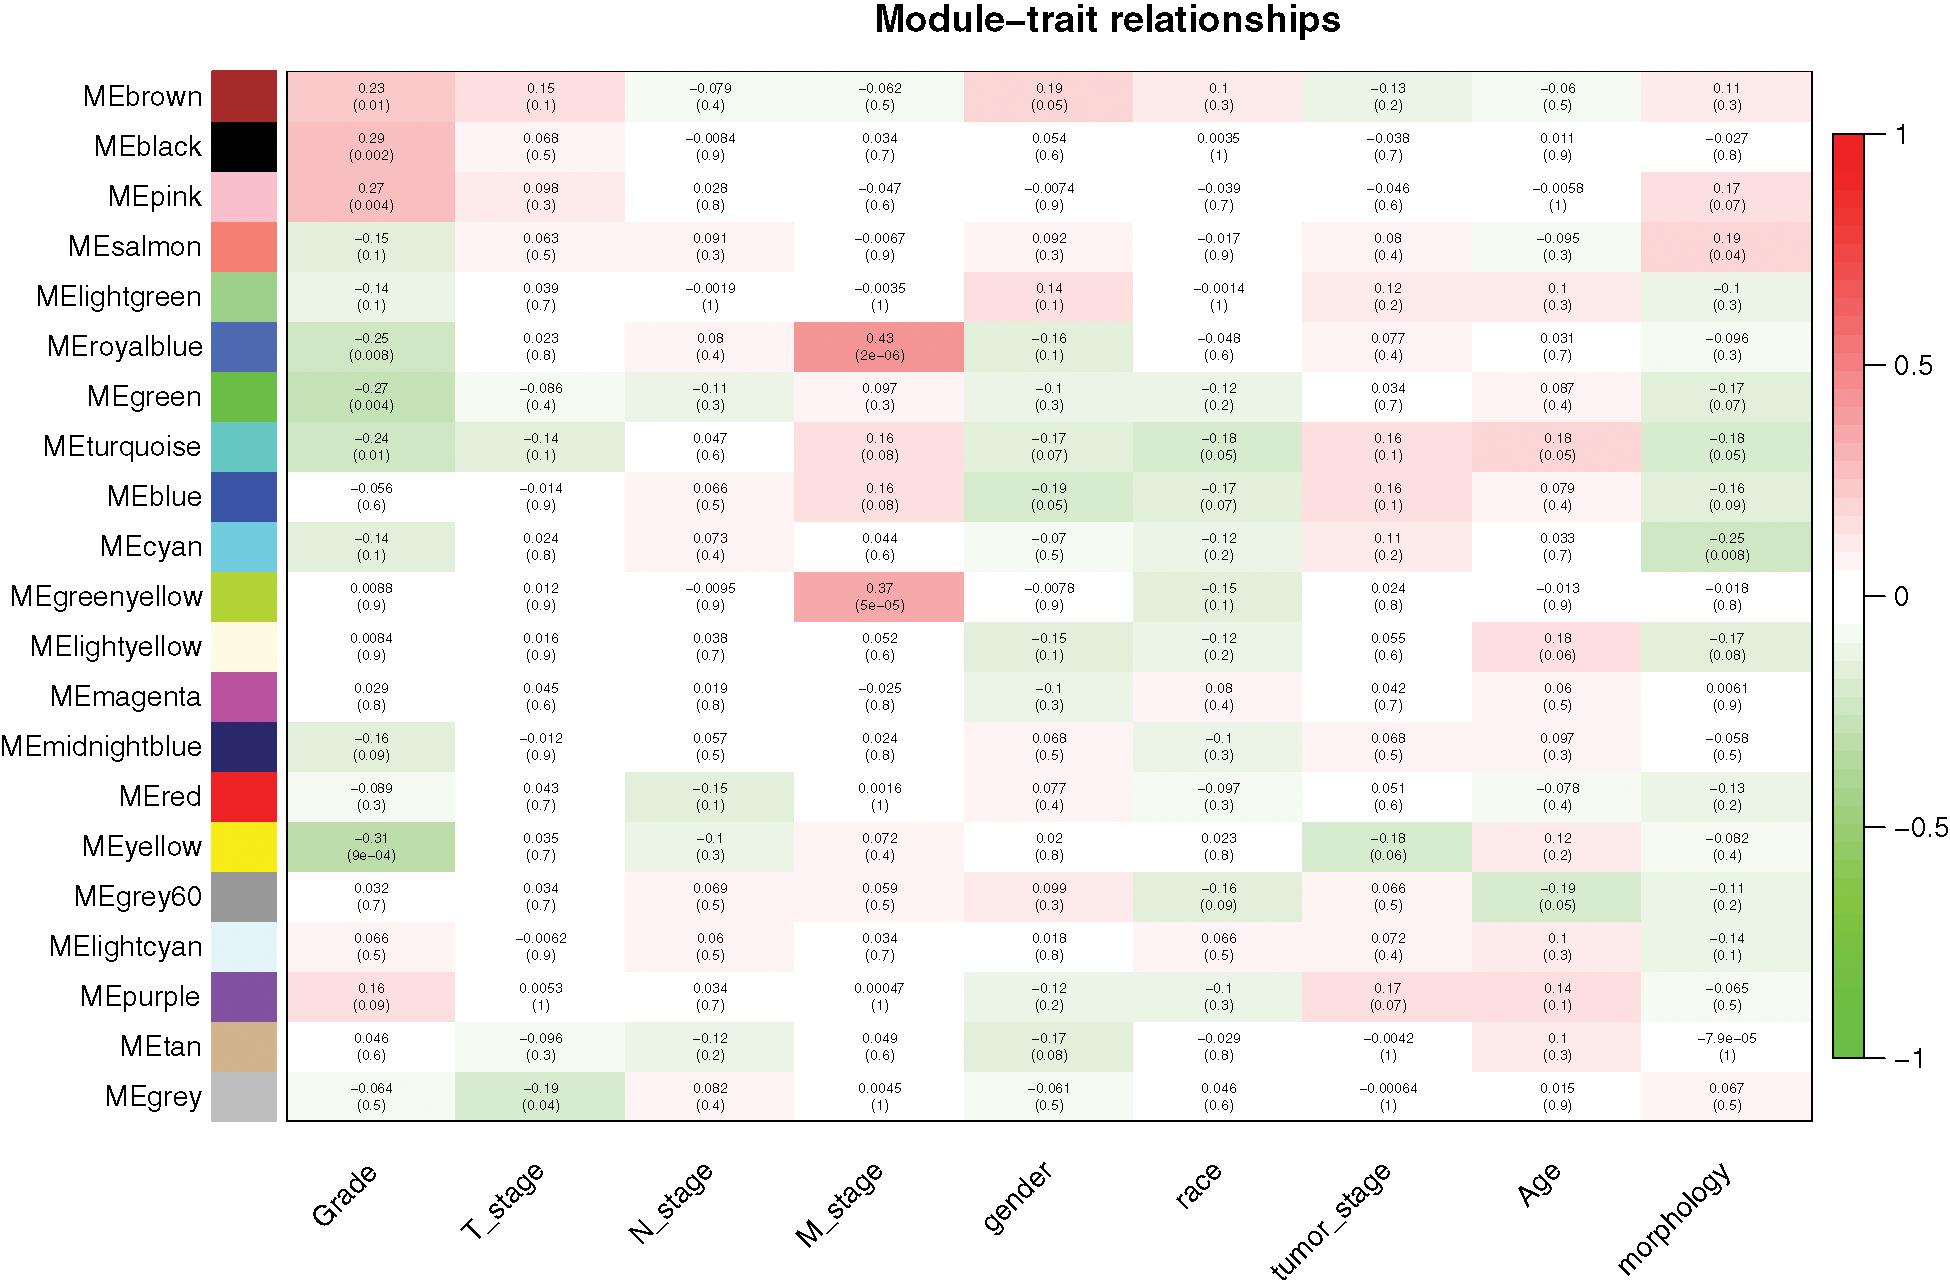
Figure 3: Relationships between consensus module eigengenes and different clinical characteristics of DGC.
We found a significant correlation between module membership and clinical characteristics in the royal blue module (Fig. 4(A)) and established a co-expression network of the hub genes, as shown in Fig. 4(B). The identification of 25 genes, which included F5, Wnt family member 11 (Wnt11), and testis associated actin remodeling kinase 1 (TESK1) in the royal blue module, may have a significant function in stage M of DGC.
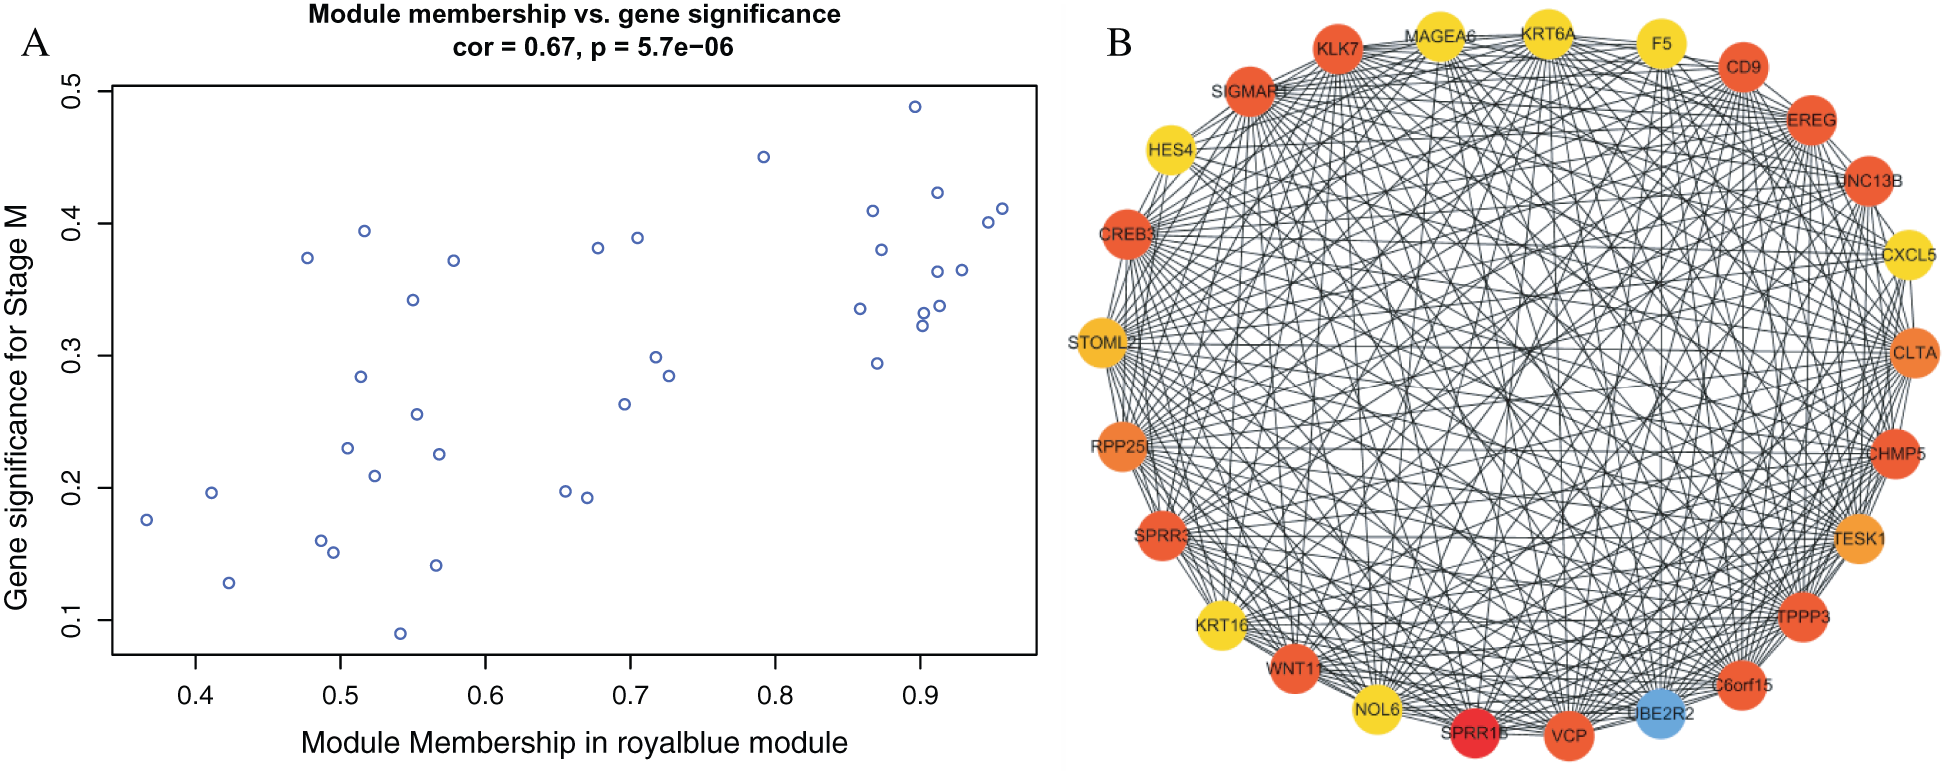
Figure 4: Identification of hub genes in the royal blue module.
Survival analysis was conducted to verify the correlation between the expression of hub genes and the survival time of patients with DGC: high F5 expression was found to be significantly related to a short OS of DGC (p < 0.05, [HR 95%CI]: 1.466 (1.056–2.034), Fig. 5(A)). The Kaplan–Meier Plotter on-line database showed that overexpression of F5 was related to poor prognosis in GC (p < 0.05, HR = 1.66 (1.11–2.49), Fig. 5(B)).
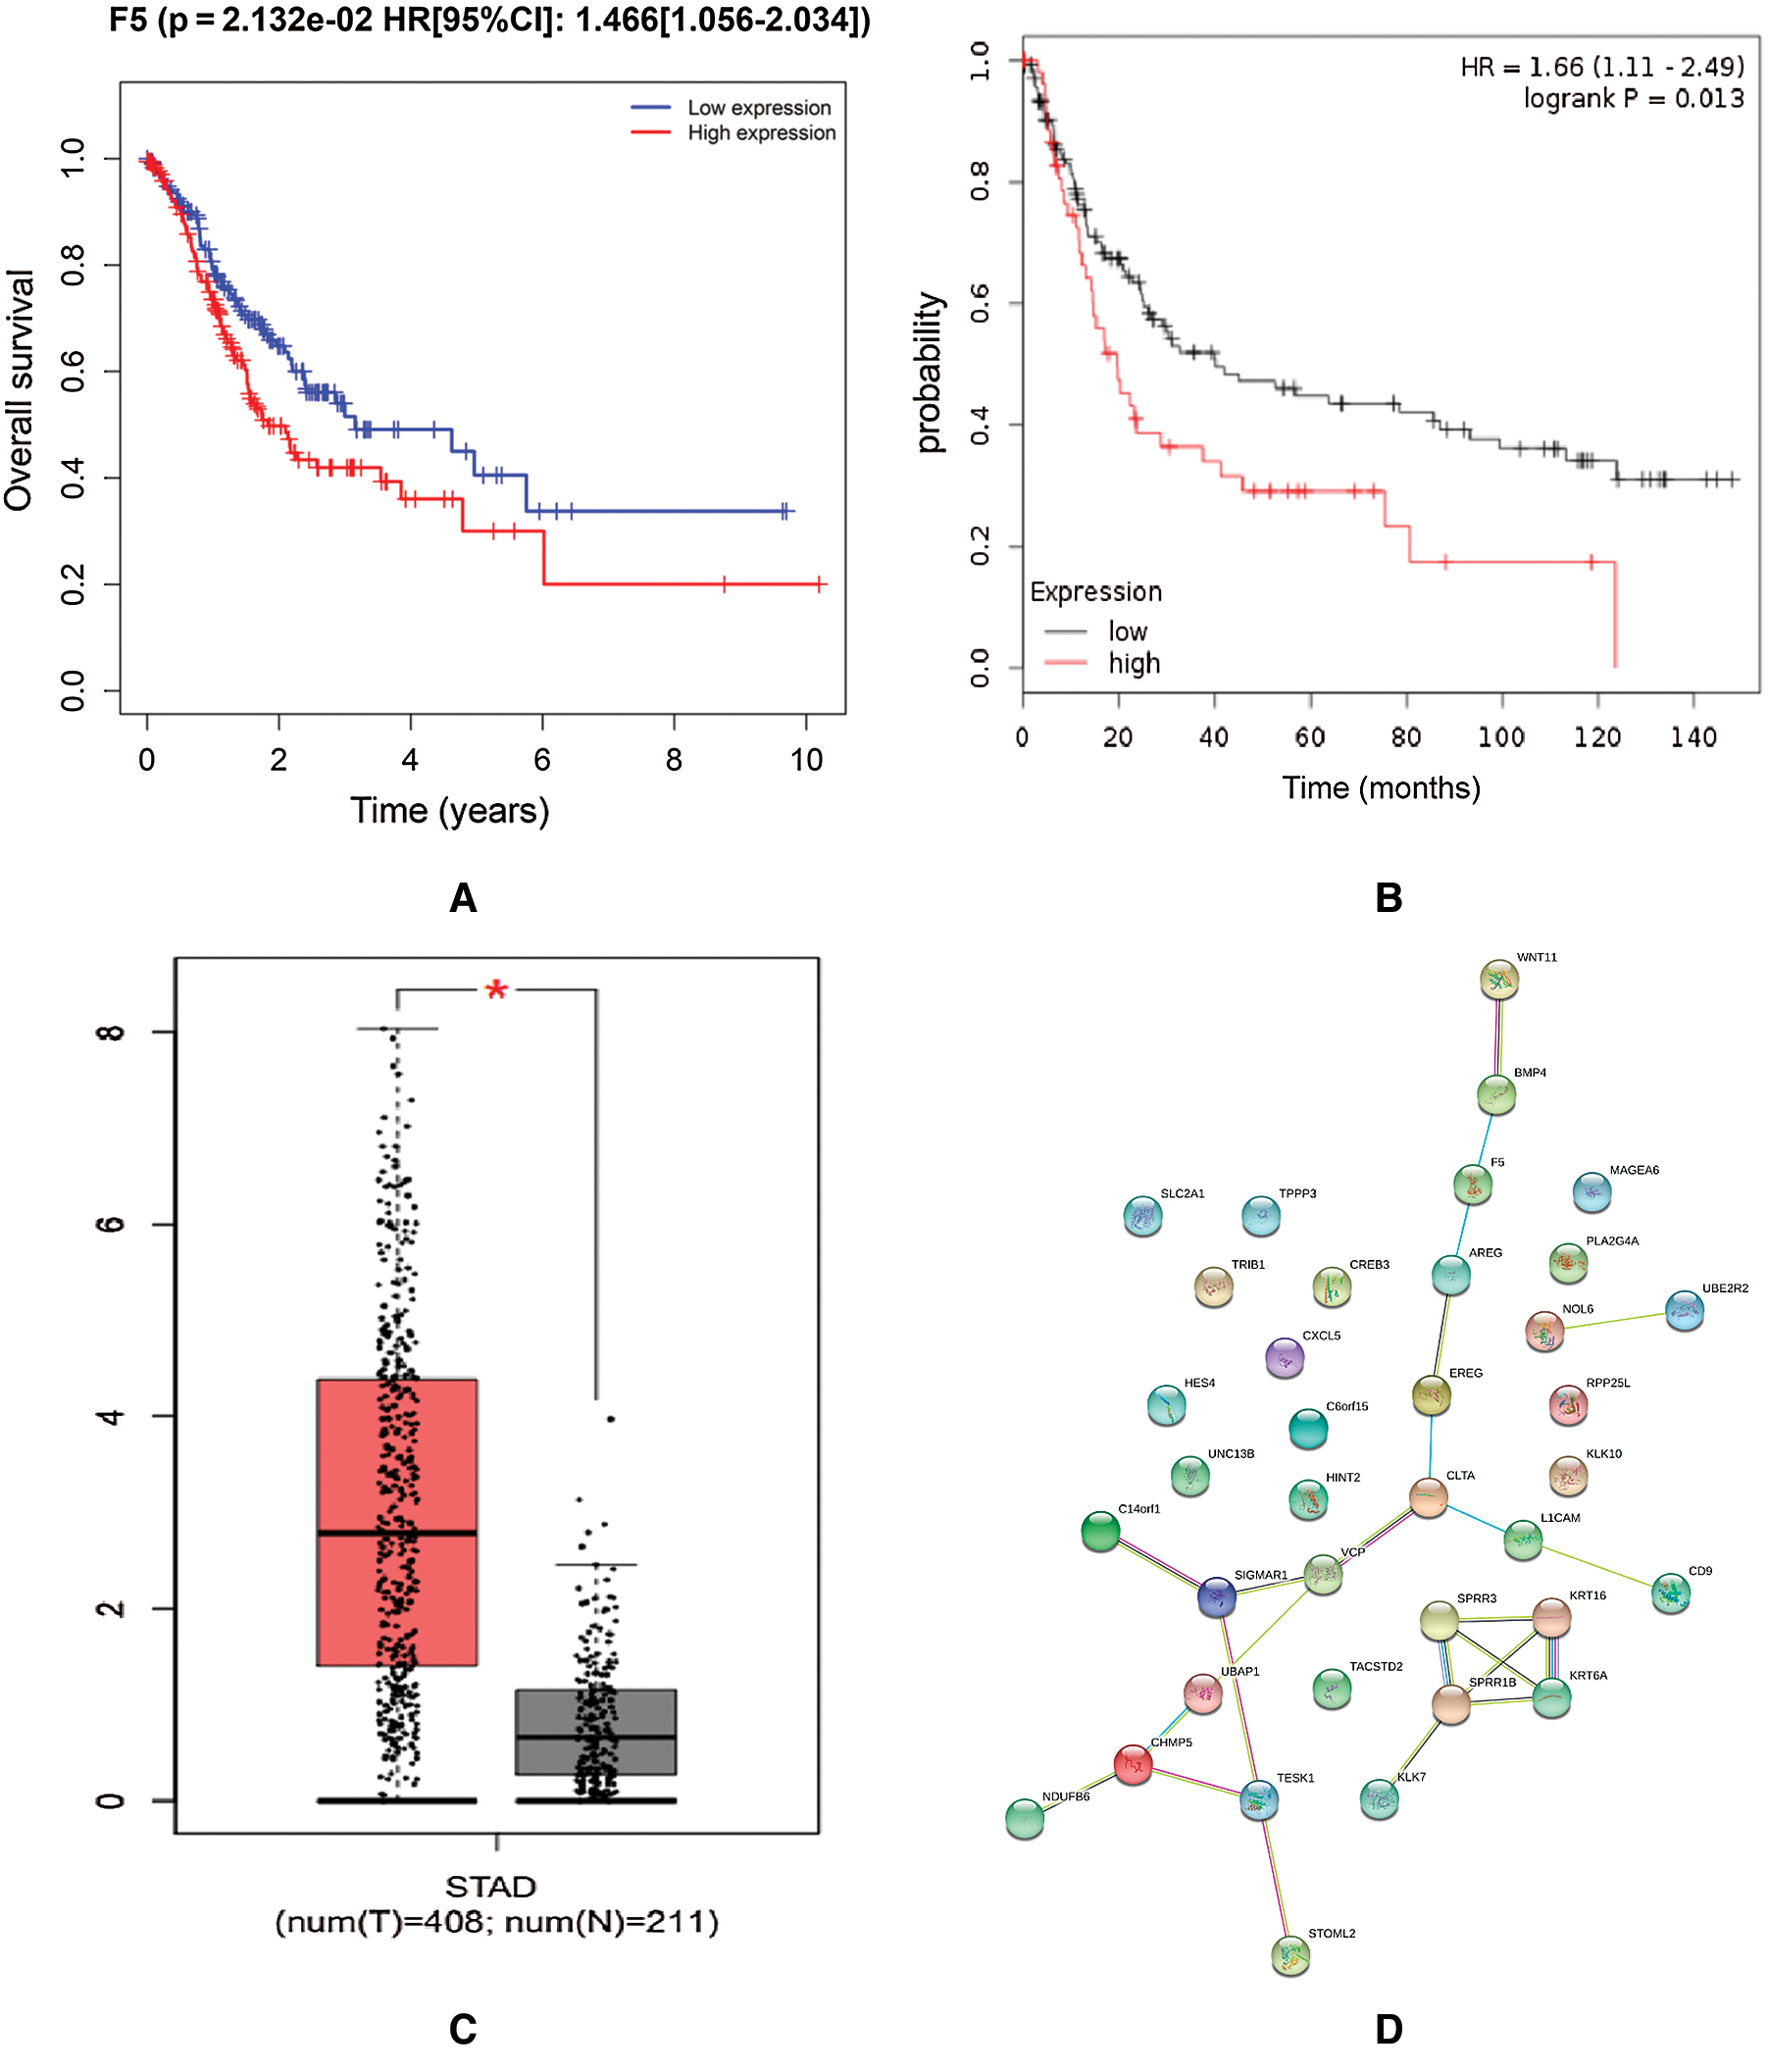
Figure 5: Survival analysis and PPI network construction of F5.
Differential expression of hub genes and PPI network constructions
The encoded product of the F5 gene is a coagulation factor V, which is a basic cofactor in the coagulation cascade. It has been reported (Vossen et al., 2011) that polymorphisms in F5, such as F5 Leiden, were related to increased risk of colorectal cancer. On-line data analysis revealed a significant overexpression level of F5 in GC tissues compared to gastric tissues (Fig. 5(C)). The PPI network indicated that the protein encoded by F5 interacted with bone morphogenetic protein 4 (BMP4) and amphiregulin (AREG) and interacted indirectly with Wnt11 (Fig. 5(D)).
Cytological experiments to verify the effect of selected hub genes on GC cells
We verified F5 mRNA expression levels in four GC cell lines including MGC803, BGC823, HGC27, and SGC7901. Fig. 6(A) shows that F5 was expressed to varying degrees in the four GC cell lines. The SGC7901 cell line was used to further test the function of F5. Fig. 6(B) illustrates the efficiency of F5 knockdown in the SGC7901 cell line. MTT assays confirmed that inhibition of F5 slightly suppressed the proliferation of GC cells to 25% (p < 0.01, Fig. 6(C)). At 24-h, a Transwell migration assay indicated that when the F5 gene was silenced, the migration of GC cells was significantly inhibited from 383 to 19 (cell number/field, p < 0.001, Figs. 6(D)–6(E)).
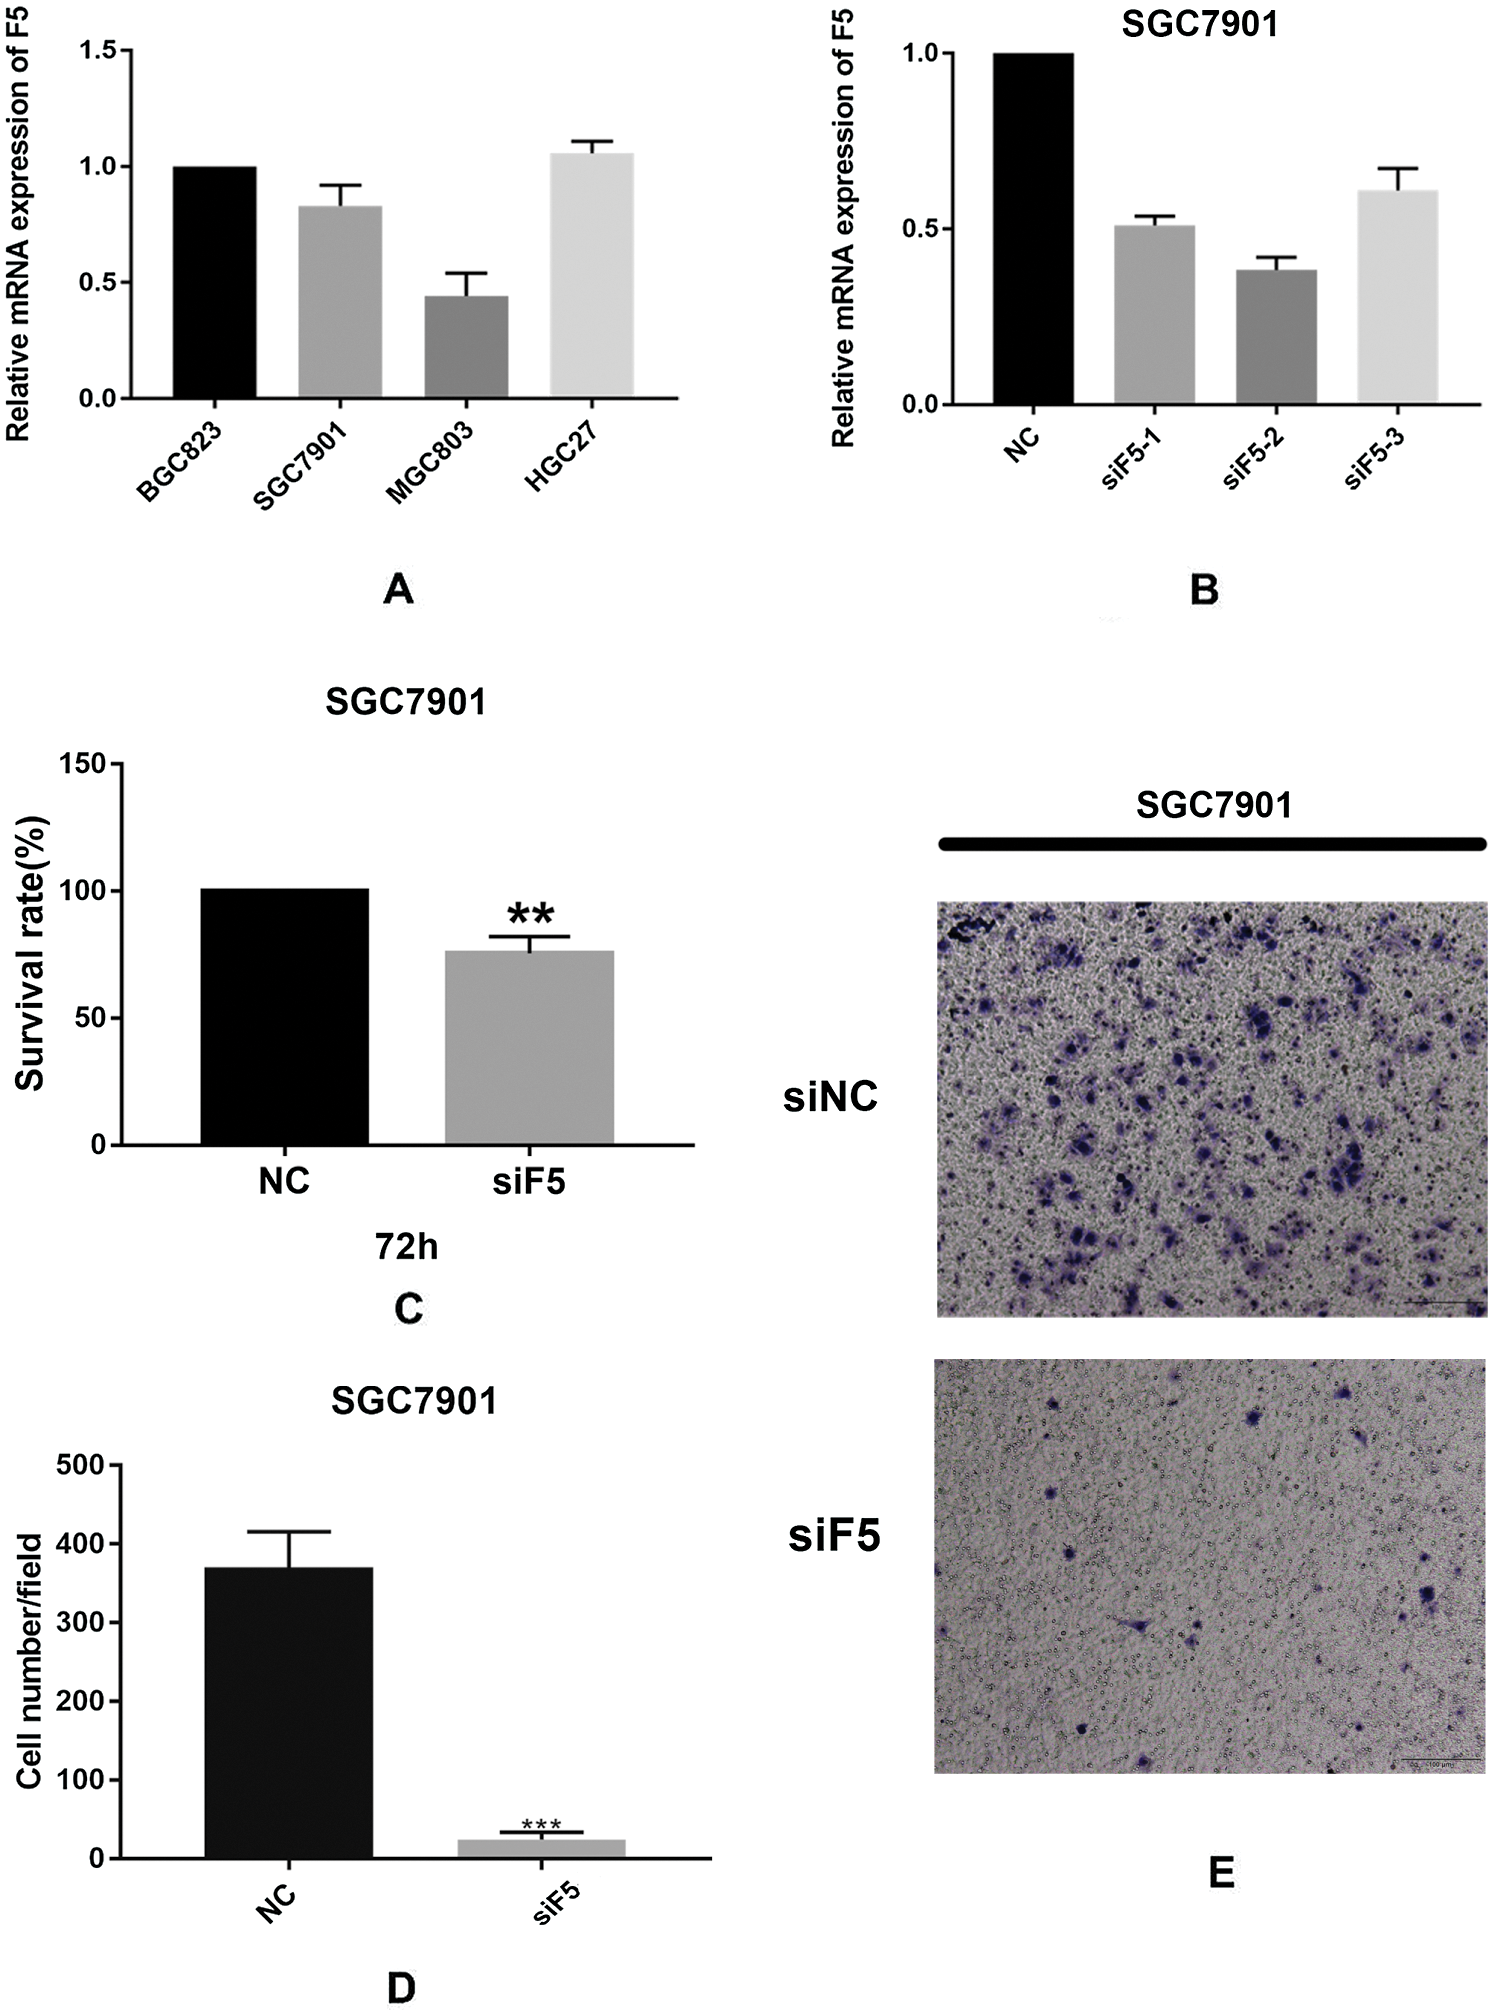
Figure 6: In vitro experiments.
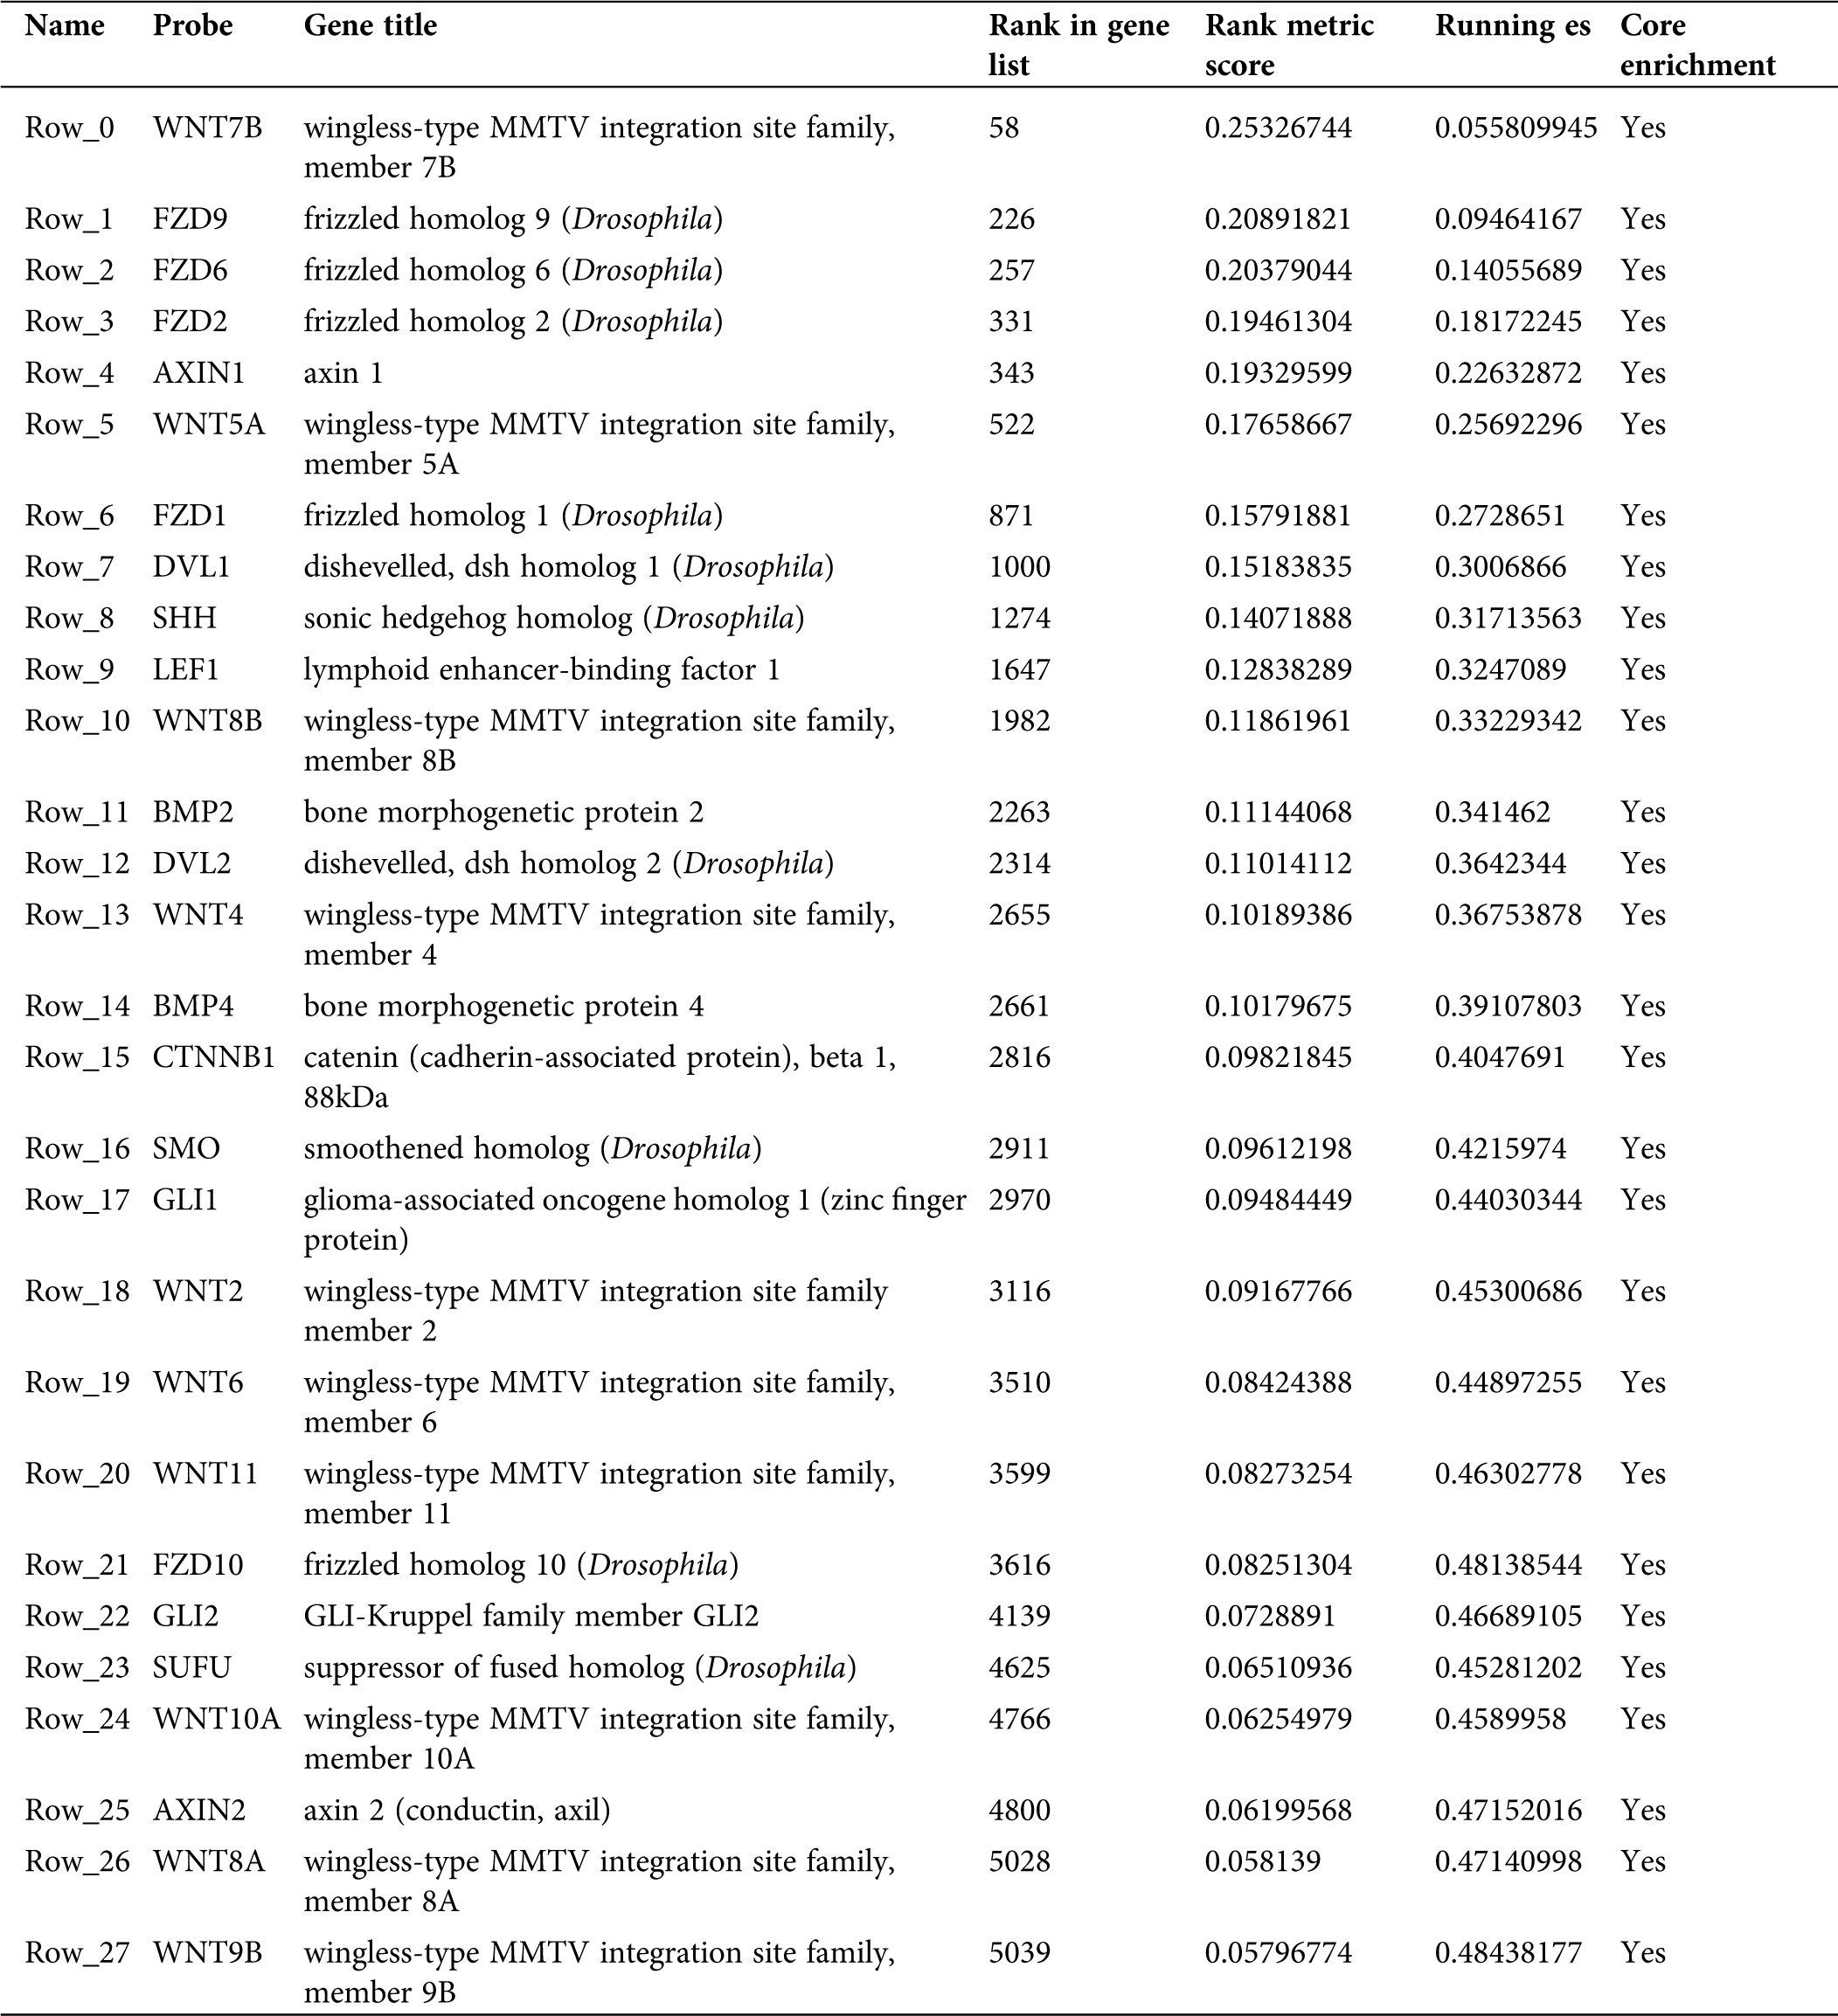
In this study, GSEA was used to explore the possible molecular mechanism of F5 in the prognosis of GC using 443 samples from the TCGA database. We identified two pathways that were clearly associated with the development of GC which were “basal cell carcinoma” (NES = 1.72, NOM p = 0.002) (Fig. 7(A)) and “TGF-β signaling pathway” (NES = 1.51, NOM p = 0.044) (Fig. 7(B)). Information pertaining to the basal cell carcinoma signaling pathway was shown in Fig. 8 and Tab. 2. The impact of F5 on the survival and prognosis of DGC may be mediated through a link with the above pathways.
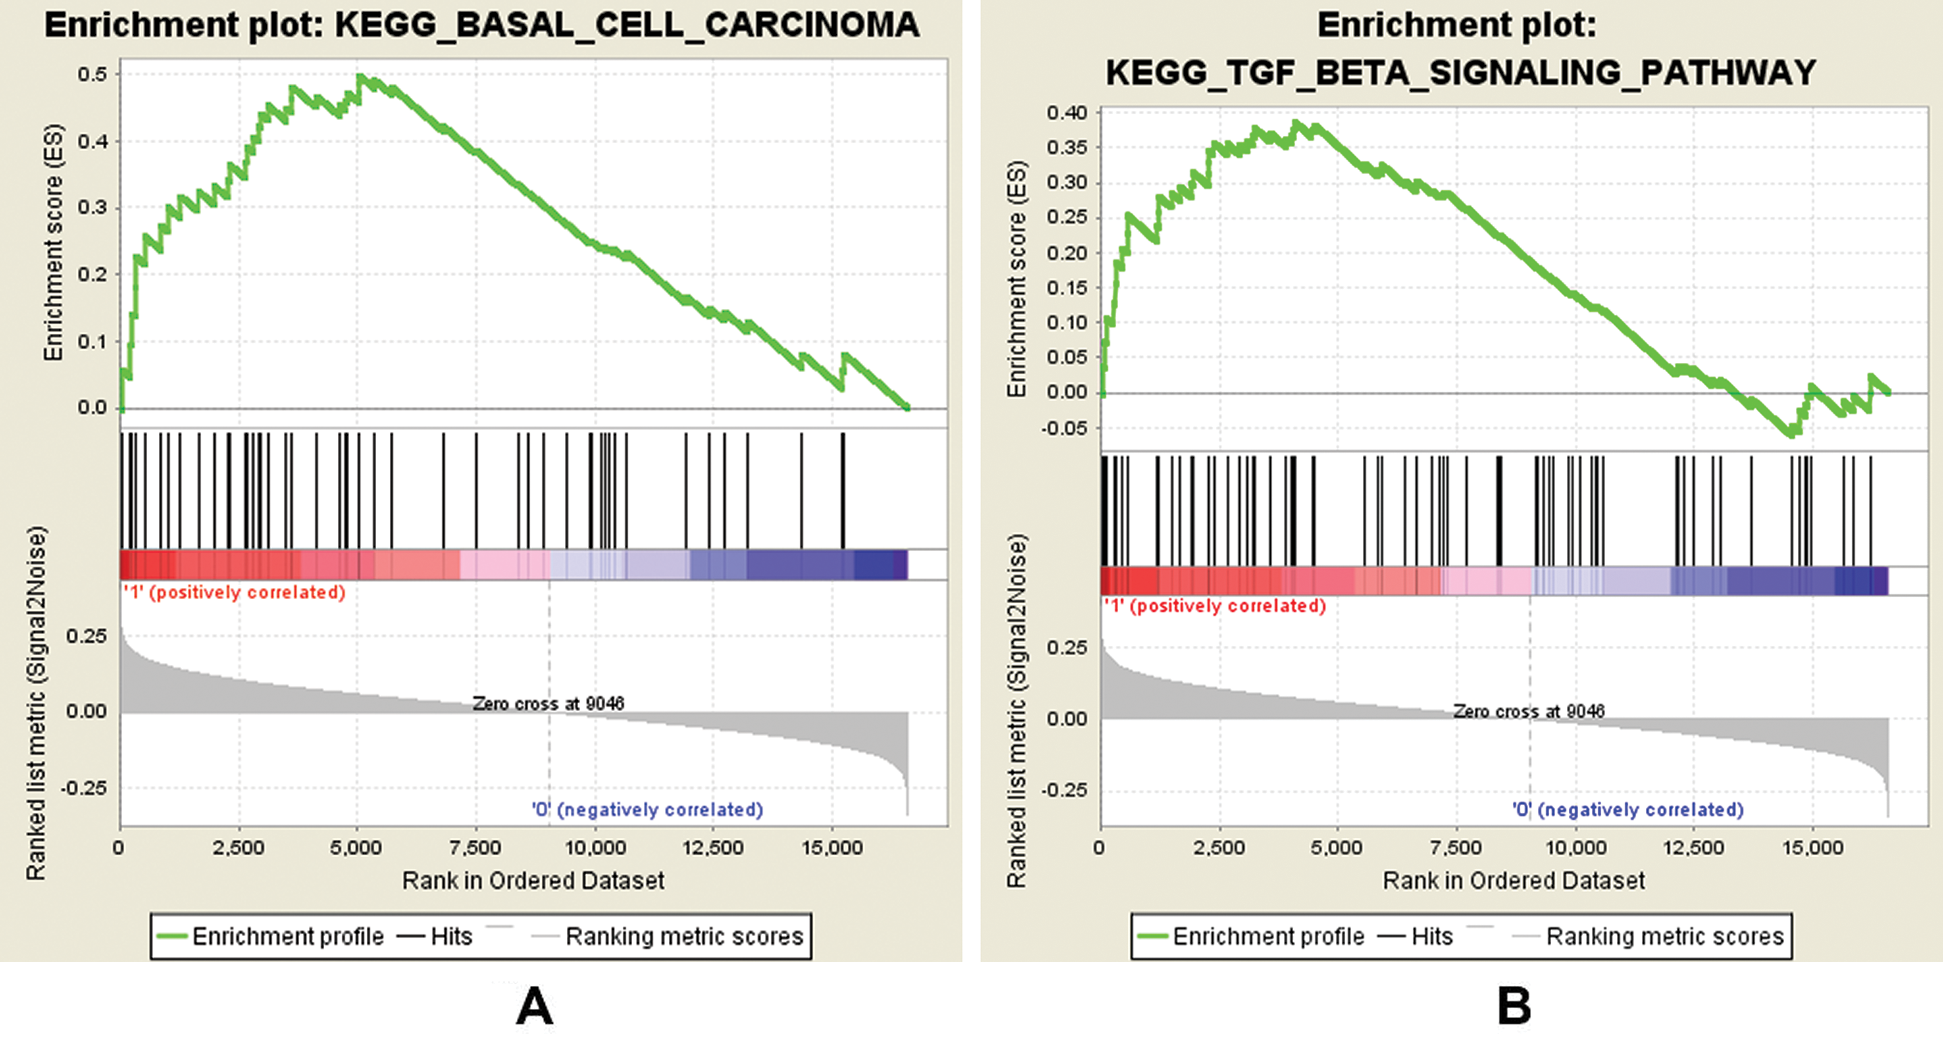
Figure 7: GSEA analysis of F5 in gastric cancer patients using the TCGA database.
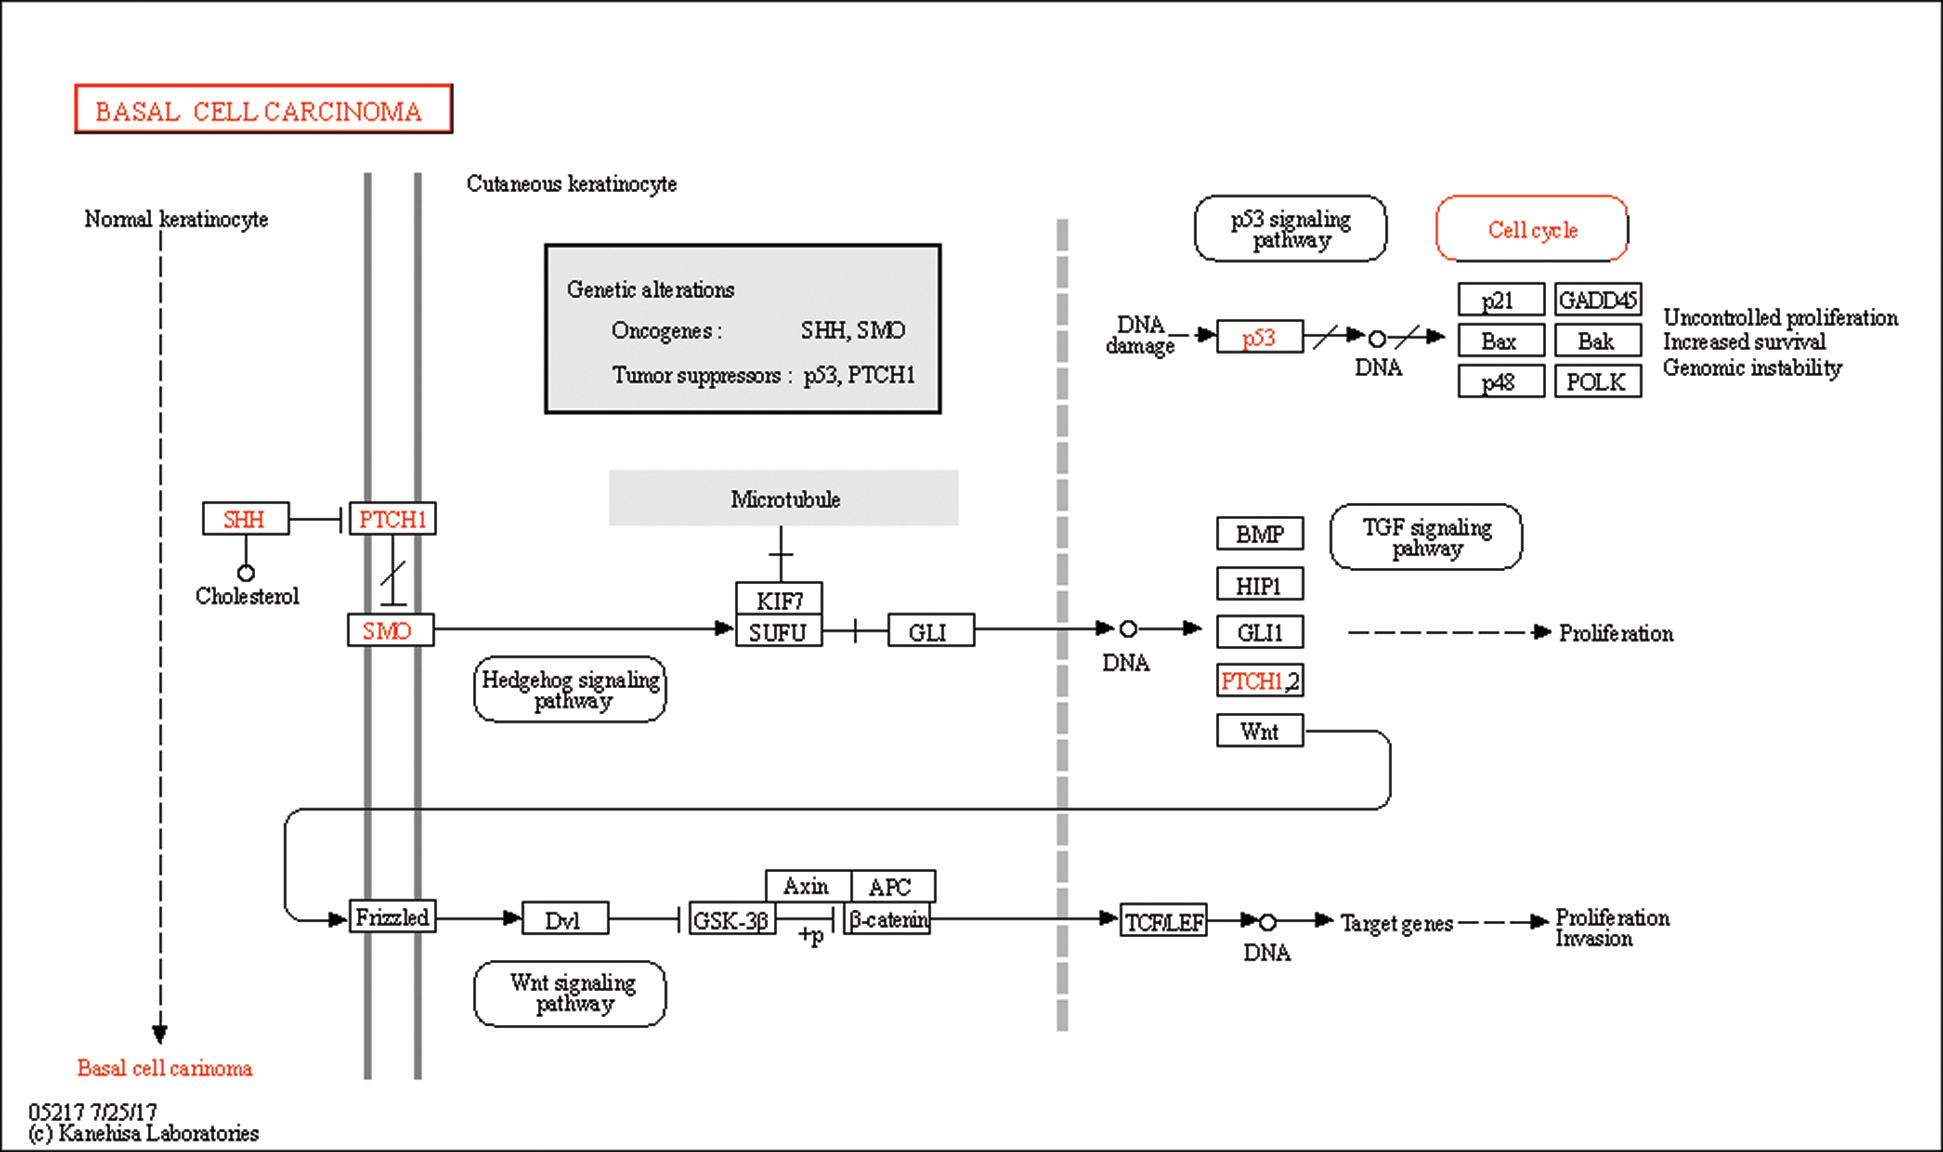
Figure 8: Information pertaining to the basal cell carcinoma pathway from the KEGG on-line database.
Table 2: Information of basal cell carcinoma signaling pathway
The molecular mechanism involved in the development of DGC remains unclear. In this study, we attempted to identify a possible molecular mechanism through WGCNA and found that F5 may be related to stage M of DGC. GSEA indicated that F5 may not only have an effect on the development of DGC but may also be important in all GCs. The cytological experiments in this study confirmed that F5 can significantly affect cell migration of GC.
The encoded product of the F5 is the coagulation factor V, which is known as ‘clotting factor’. The protein circulates in plasma and participates in thrombin activation with factor Xa. Most existing reports focus on the coagulation function of F5, including the role of F5 and its protein in thrombosis (Zhang et al., 2018a; Zhang et al., 2018b), and DIC (Kou et al., 2019) in patients with hematological malignancies.
F5 has been reported in various tumor types as a marker. In breast cancer, the expression of F5 may inform clinical treatment decisions and prognosis of invasive breast cancer, indicating F5 as a potential biomarker of invasive breast cancer (Tinholt et al., 2018). However, another study (Ivancic et al., 2014) revealed that the increased risk of developing colorectal cancer is associated with F5 in ApcPirc/+ rats. Analysis using on-line databases showed significant over-expression level of F5 in GC tissues, and that high F5 expression can predict poor prognosis in both DGC and GC.
This study showed that the two pathways obtained from GSEA were closely related to F5. The basal cell carcinoma pathway includes the Wnt and TGF-β pathways. As these pathways were screened based on data of GC, the function of F5 in GC may be similar to basal cell carcinoma. According to GSEA analysis, we found that the core molecules which may have interaction with F5 in the basal cell carcinoma signaling pathway belong to the Wnt signaling pathway. In previous PPI analysis, we found that F5 is indirectly related to Wnt11. Furthermore, a study (Katoh and Katoh, 2009) also indicated that the canonical Wnt-to-Wnt11 signaling pathway is involved in cellular migration in tumor invasion during carcinogenesis. Therefore, F5 may participate in interactions with the Wnt signaling pathway.
Numerous studies have reported that the TGF-β and Wnt signaling pathways exert effects on the development of GC. Epithelial to mesenchymal transition (EMT) is a central biological process in which tumor cells lose epithelial characteristics and acquire mesenchymal features that make cancer cells more migratory and invasive (Thiery et al., 2009). Gastric epithelial cells acquire mesenchymal markers, become more invasive, and show stemness and metastasis during EMT (Thiery, 2002; Ye and Weinberg, 2015). The process of EMT is associated with certain signaling pathways, including the Wnt and TGF-β pathways. A study (Huang et al., 2015) revealed that Wnt signaling can promote progression in GC cells by EMT. Activation of the TGF-β/Smad signaling pathway can also induce EMT and then promote the metastasis in GC (Zhang et al., 2018c).
Previous studies (Luo et al., 2019) have suggested that GC patients have higher TGF-β levels in serum compared to healthy individuals. Elevated TGF-β levels are closely related to poor prognosis and shorter OS in GC patients (Hu et al., 2014). Furthermore, it has been confirmed (Chiurillo, 2015) that specific mechanisms up-regulate components of the Wnt signaling pathway. Also, the inactivation of inhibitors of Wnt signaling plays an important role in GC. Other studies (Boussioutas et al., 2003; Kurayoshi et al., 2006) have found that Wnt-5a (a molecule on the Wnt signaling pathway) was up-regulated in all types of GC and acted to promote invasion, migration and poor prognosis of patients with GC. Furthermore, suppression of the Wnt signaling pathway can inhibit the growth and migration of GC (Gao et al., 2018; Liu et al., 2018). The above studies are consistent with our cytological experiments and bioinformatics analysis. Based on this evidence, we hypothesize that the effect of F5 on the survival and prognosis of DGC might be through a link with the Wnt and/or the TGF-β signaling pathways.
In this study, the F5 gene was screened from samples of DGC. We found that F5 not only has an effect on DGC but also on GC based on PPI networks, cytological experiments, and GSEA studies. Cytological experiments confirmed that F5 significantly affected the migration of GC cells, which is consistent with our discovery by WGCNA. F5 is associated with stage M of DGC. There are many unsolved problems concerning the mechanism of F5 in GC, which warrant further investigation through cytological and zoological experiments.
This study suggested that high F5 expression was related to poor prognosis in patients with DGC and GC by promoting cell migration and this might participate in the regulation of the Wnt and/or the TGF-β signaling pathways. This provides a basis for further analysis of the prognosis and treatment of DGC and GC.
Acknowledgement: We would like to acknowledge the provider of the space and equipment for conducting the experiments. They were the Ministry of Education (China Medical University, Shenyang, China), Key Laboratory of Precision Diagnosis and Treatment of Gastrointestinal Tumors.
Availability of Data and Materials: The datasets analyzed during the current study are available from the corresponding author on reasonable request.
Author Contribution: The authors confirm contribution to the paper as follows: Study conception and design: Mengyi Tang, Bowen Yang, Yunpeng Liu, Zhi Li, Xiujuan Qu; data collection: Mengyi Tang, Bowen Yang, Chuang Zhang, Chaoxu Zhang, Dan Zang; analysis and interpretation of results: Mengyi Tang, Bowen Yang, Zhi Li, Xiujuan Qu; draft manuscript preparation: Mengyi Tang, Bowen Yang, Libao Gong. All authors reviewed the results and approved the final version of the manuscript.
Funding Statement: We would also like to thank these funds, including the National Natural Science Foundation of China (Nos. 81972331, 81972751, 81572374), The National Key Research and Development Program of China (2017YFC1308900), Technological Special Project of Liaoning Province of China (2019020176-JH1/103), Science and Technology Plan Project of Liaoning Province (NO. 2013225585) and The General Projects of Liaoning Province Colleges and Universities (LFWK201706).
Conflicts of Interest: In respect of the authorship, research, and/or publication of this article, all the authors declared no potential conflicts of interest.
Boussioutas A, Li H, Liu J, Waring P, Lade S, Holloway AJ, Taupin D, Gorringe K, Haviv I, Desmond PV, Bowtell DD (2003). Distinctive patterns of gene expression in premalignant gastric mucosa and gastric cancer. Cancer Research 63: 2569–2577. [Google Scholar]
Chin CH, Chen SH, Wu HH, Ho CW, Ko MT, Lin CY (2014). cytoHubba: identifying hub objects and sub-networks from complex interactome. BMC Systems Biology 8: S11. DOI 10.1186/1752-0509-8-S4-S11. [Google Scholar] [CrossRef]
Chiurillo MA (2015). Role of the Wnt/β-catenin pathway in gastric cancer: an in-depth literature review. World Journal of Experimental Medicine 5: 84–102. DOI 10.5493/wjem.v5.i2.84. [Google Scholar] [CrossRef]
Costa LB, Toneto MG, Moreira LF (2016). Do proximal and distal gastric tumours behave differently? Arquivos Brasileiros de Cirugia Digestiva 29: 232–235. DOI 10.1590/0102-6720201600040005. [Google Scholar] [CrossRef]
Gao J, Zhao C, Liu Q, Hou X, Li S, Xing X, Yang C, Luo Y (2018). Cyclin G2 suppresses Wnt/beta-catenin signaling and inhibits gastric cancer cell growth and migration through Dapper1. Journal of Experimental & Clinical Cancer Research 37: 317. DOI 10.1186/s13046-018-0973-2. [Google Scholar] [CrossRef]
Devesa SS, Blot WJ, Fraumeni JF Jr. (1998). Changing patterns in the incidence of esophageal and gastric carcinoma in the United States. Cancer 83: 2049–2053. [Google Scholar]
Higuchi K, Koizumi W, Tanabe S, Saigenji K, Ajani JA (2004). Chemotherapy is more active against proximal than distal gastric carcinoma. Oncology 66: 269–274. DOI 10.1159/000078326. [Google Scholar] [CrossRef]
Hu WQ, Wang LW, Yuan JP, Yan SG, Li JD, Zhao HL, Peng CW, Yang GF, Li Y (2014). High expression of transform growth factor beta 1 in gastric cancer confers worse outcome: results of a cohort study on 184 patients. Hepatogastroenterology 61: 245–250. [Google Scholar]
Huang L, Wu RL, Xu AM (2015). Epithelial-mesenchymal transition in gastric cancer. American Journal of Translational Research 7: 2141–2158. [Google Scholar]
Ivancic MM, Irving AA, Jonakin KG, Dove WF, Sussman MR (2014). The concentrations of EGFR, LRG1, ITIH4, and F5 in serum correlate with the number of colonic adenomas in ApcPirc/+ rats. Cancer Prevention Research 7: 1160–1169. DOI 10.1158/1940-6207.CAPR-14-0056. [Google Scholar] [CrossRef]
Ivliev AE, 't Hoen PAC, Sergeeva MG (2010). Coexpression network analysis identifies transcriptional modules related to proastrocytic differentiation and sprouty signaling in glioma. Cancer Research 70: 10060–10070. DOI 10.1158/0008-5472.CAN-10-2465. [Google Scholar] [CrossRef]
Katoh M, Katoh M (2009). Integrative genomic analyses of WNT11: transcriptional mechanisms based on canonical WNT signals and GATA transcription factors signaling. International Journal of Molecular Medicine 24: 247–251. DOI 10.3892/ijmm_00000227. [Google Scholar] [CrossRef]
Kou HM, Zhang XP, Wang MZ, Deng J, Mei H, Hu Y (2019). Diagnostic and prognostic value of plasma factor V activity and parameters in thrombin generation for disseminated intravascular coagulation in patients with hematological malignancies. Current Medical Science 39: 546–550. DOI 10.1007/s11596-019-2072-9. [Google Scholar] [CrossRef]
Kurayoshi M, Oue N, Yamamoto H, Kishida M, Inoue A, Asahara T, Yasui W, Kikuchi A (2006). Expression of Wnt-5a is correlated with aggressiveness of gastric cancer by stimulating cell migration and invasion. Cancer Research 66: 10439–10448. DOI 10.1158/0008-5472.CAN-06-2359. [Google Scholar] [CrossRef]
Langfelder P, Horvath S (2008). WGCNA: an R package for weighted correlation network analysis. BMC Bioinformatics 9: 559. DOI 10.1186/1471-2105-9-559. [Google Scholar] [CrossRef]
Li J, Tong G, Huang C, Luo Y, Wang S, Zhang Y, Cheng B, Zhang Z, Wu X, Liu Q, Li M, Li L, Ni B (2020). HOXC10 promotes cell migration, invasion, and tumor growth in gastric carcinoma cells through upregulating proinflammatory cytokines. Journal of Cellular Physiology 235: 3579–3591. DOI 10.1002/jcp.29246. [Google Scholar] [CrossRef]
Liu W, Chen Y, Xie H, Guo Y, Ren D, Li Y, Jing X, Li D, Wang X, Zhao M, Zhu T, Wang Z, Wei X, Gao F, Wang X, Liu S, Zhang Y, Yi F (2018). TIPE1 suppresses invasion and migration through down-regulating Wnt/beta-catenin pathway in gastric cancer. Journal of Cellular and Molecular Medicine 22: 1103–1117. [Google Scholar]
Luo J, Chen XQ, Li P (2019). The role of TGF-β and its receptors in gastrointestinal cancers. Translational Oncology 12: 475–484. DOI 10.1016/j.tranon.2018.11.010. [Google Scholar] [CrossRef]
Mootha VK, Lindgren CM, Eriksson KF, Subramanian A, Sihag S, Lehar J, Puigserver P, Carlsson E, Ridderstrale M, Laurila E, Houstis N, Daly MJ, Patterson N, Mesirov JP, Golub TR, Tamayo P, Spiegelman B, Lander ES, Hirschhorn JN, Altshuler D, Groop LC (2003). PGC-1α-responsive genes involved in oxidative phosphorylation are coordinately downregulated in human diabetes. Nature Genetics 34: 267–273. DOI 10.1038/ng1180. [Google Scholar] [CrossRef]
Pacelli F, Papa V, Caprino P, Sgadari A, Bossola M, Doglietto GB (2001). Proximal compared with distal gastric cancer: multivariate analysis of prognostic factors. American Surgeon 67: 697–703. [Google Scholar]
Petrelli F, Ghidini M, Barni S, Steccanella F, Sgroi G, Passalacqua R, Tomasello G (2017). Prognostic role of primary tumor location in non-metastatic gastric cancer: a systematic review and meta-analysis of 50 studies. Annals of Surgical Oncology 24: 2655–2668. DOI 10.1245/s10434-017-5832-4. [Google Scholar] [CrossRef]
Subramanian A, Tamayo P, Mootha VK, Mukherjee S, Ebert BL, Gillette MA, Paulovich A, Pomeroy SL, Golub TR, Lander ES, Mesirov JP (2005). Gene set enrichment analysis: a knowledge-based approach for interpreting genome-wide expression profiles. Proceedings of the National Academy of Sciences of the United States of America 102: 15545–15550. DOI 10.1073/pnas.0506580102. [Google Scholar] [CrossRef]
Tang Z, Li C, Kang B, Gao G, Li C, Zhang Z (2017). GEPIA: a web server for cancer and normal gene expression profiling and interactive analyses. Nucleic Acids Research 45: W98–W102. DOI 10.1093/nar/gkx247. [Google Scholar] [CrossRef]
Thiery JP (2002). Epithelial-mesenchymal transitions in tumour progression. Nature Reviews Cancer 2: 442–454. DOI 10.1038/nrc822. [Google Scholar] [CrossRef]
Thiery JP, Acloque H, Huang RY, Nieto MA (2009). Epithelial-mesenchymal transitions in development and disease. Cell 139: 871–890. DOI 10.1016/j.cell.2009.11.007. [Google Scholar] [CrossRef]
Tinholt M, Garred O, Borgen E, Beraki E, Schlichting E, Kristensen V, Sahlberg KK, Iversen N (2018). Subtype-specific clinical and prognostic relevance of tumor-expressed F5 and regulatory F5 variants in breast cancer: the CoCaV study. Journal of Thrombosisand Haemostasis 16: 1347–1356. DOI 10.1111/jth.14151. [Google Scholar] [CrossRef]
Vossen CY, Hoffmeister M, Chang-Claude JC, Rosendaal FR, Brenner H (2011). Clotting factor gene polymorphisms and colorectal cancer risk. Journal of Clinical Oncology 29: 1722–1727. DOI 10.1200/JCO.2010.31.8873. [Google Scholar] [CrossRef]
Wang X, Liu F, Li Y, Tang S, Zhang Y, Chen Y, Khan SA (2019). Comparison on clinicopathological features, treatments and prognosis between proximal gastric cancer and distal gastric cancer: a national cancer data base analysis. Journal of Cancer 10: 3145–3153. DOI 10.7150/jca.30371. [Google Scholar] [CrossRef]
Ye X, Weinberg RA (2015). Epithelial-mesenchymal plasticity: a central regulator of cancer progression. Trends in Cell Biology 25: 675–686. DOI 10.1016/j.tcb.2015.07.012. [Google Scholar] [CrossRef]
Yu X, Hu F, Li C, Yao Q, Zhang H, Xue Y (2018). Clinicopathologic characteristics and prognosis of proximal and distal gastric cancer. Onco Targets and Therapy 11: 1037–1044. DOI 10.2147/OTT.S157378. [Google Scholar] [CrossRef]
Zhang H, Huang H, Xu X, Wang H, Wang J, Yao Z, Xu X, Wu Q, Xu F (2019). LncRNA HCG11 promotes proliferation and migration in gastric cancer via targeting miR-1276/CTNNB1 and activating Wnt signaling pathway. Cancer Cell International 19: 350. DOI 10.1186/s12935-019-1046-0. [Google Scholar] [CrossRef]
Zhang CL, Li ZM, Song ZH, Song T (2018a). Coagulation factor V gene 1691G>A polymorphism as an indicator for risk and prognosis of lower extremity deep venous thrombosis in Chinese Han population. Medicine 97: e10885. DOI 10.1097/MD.0000000000010885. [Google Scholar] [CrossRef]
Zhang S, Taylor AK, Huang X, Luo B, Spector EB, Fang P, Richards CS (2018b). Venous thromboembolism laboratory testing (factor V Leiden and factor II c.*97G>A2018 update: a technical standard of the American College of Medical Genetics and Genomics (ACMG). Genetics in Medicine 20: 1489–1498. DOI 10.1038/s41436-018-0322-z. [Google Scholar] [CrossRef]
Zhang X, Zhang P, Shao M, Zang X, Zhang J, Mao F, Qian H, Xu W (2018c). SALL4 activates TGF-β/SMAD signaling pathway to induce EMT and promote gastric cancer metastasis. Cancer Management and Research 10: 4459–4470. DOI 10.2147/CMAR.S177373. [Google Scholar] [CrossRef]
 | This work is licensed under a Creative Commons Attribution 4.0 International License, which permits unrestricted use, distribution, and reproduction in any medium, provided the original work is properly cited. |