DOI:10.32604/biocell.2021.015321
| BIOCELL DOI:10.32604/biocell.2021.015321 | |
| Article |
Genetic diversity in eggplant (Solanum melongena L.) germplasm from three secondary geographical origins of diversity using SSR markers
1Institute of Tropical Agriculture and Food Security, Universiti Putra Malaysia, Serdang, Selangor, 43400, Malaysia
2Department of Crop Science, Faculty of Agriculture, Universiti Putra Malaysia, Serdang, Selangor, 43400, Malaysia
*Address correspondence to: Mohd Rafii Yusop, mrafii@upm.edu.my
Received: 10 December 2020; Accepted: 18 February 2021
Abstract: Indo-Burmese region was the primary center of eggplant diversity from where the crop extended to several secondary origins of diversity. In this study, the genetic diversity among fifty-six eggplant accessions collected from three countries was assessed using sixteen polymorphic SSR markers to determine suitable parents for heterotic hybridization. The estimation of genetic diversity among the population of three countries (Bangladesh, Malaysia, and Thailand) varied from 0.57 to 0.74, with Shannon’s index value of 0.65. The mean value of expected heterozygosity and Nei’s index was 0.49, with an average PIC value of 0.83. A dendrogram was constructed based on UPGMA (unweighted pair group method with arithmetic mean), and the dendrogram categorized all accessions into six groups. The AMOVA (analysis of molecular variance) revealed a 77% total variation within the population from three different countries and 23% total variation among the populations. The result revealed a high genetic differentiation among the eggplant germplasms while the accessions that are farther from each other show a high level of diversity; thus, they can be recommended as parental in breeding programs. Hence, accessions, EB12, ET11, ET13, ET15, ET16, and ET17 could be crossed with accessions EM3, EB34, and EB3 for improvement in the future breeding program.
Keywords: Solanum melongena; Molecular diversity; Genomic-SSR; EST-SSR
Solanum melongena L., also known as eggplant, belongs to the family Solanaceae and is ranked as one of the beneficial vegetables worldwide. The crop ranks among high-valued vegetables with the highest antioxidant activity and nutritional value (Liu et al., 2018). The Indo-Burma region is considered the primary origin and center of eggplant’s domestication, where the highest diversity of this crop is found (Augustinos et al., 2016). The crop enjoys extensive cultivation throughout the tropics and warm temperate regions, especially in Southern USA and Mediterranean regions (Liu et al., 2018). Despite its profitability and nutritional value, the breeding attempts for this vegetable are limited compared to other members of the Solanaceae family, such as potato and tomato (Hurtado et al., 2012). The study of genetic diversity is vital in breeding programs because it provides useful utilization of germplasm in the advancement of closely related species (Jasim et al., 2018). It is essential to assess polymorphisms among existing cultivars and select parents for hybridization. Generally, morphological characterization is considered the first step towards exploring genetic variation in eggplant (Sulaiman et al., 2020). However, morphological characters have particular limitations in distinguishing homozygous from heterozygous. Aside from this, morphological characters cannot define the exact level of diversity among existing germplasm due to additive gene action of disclosure of economically important traits (Jasim et al., 2018). Molecular markers are not environmentally controlled and can reveal the genotypic difference at the DNA level.
Hence, molecular markers play a crucial role in analyzing plant genealogy, gene mapping, construction of genetic maps, evolution, germplasm characterization, selection for characters, diversity study, and the determination of genome organization (Zuki et al., 2020; Sarif et al., 2020).Microsatellites, also known as simple sequence repeats (SSR), have become one of the most prevalent genetic markers due to their co-dominance inheritance, multi-allelic nature, reproducibility, high genome coverage, abundance and are polymerase chain reaction (PCR)-based (Demir et al., 2010; Chukwu et al., 2020). The first set SSR marker for eggplant was developed from the screening of small insert of di- and trinucleotide repeats of genomic libraries (Nunome et al., 2003). Subsequently, a set of small SSR markers from genic DNA sequence developed by Stàgel et al. (2008) developed was lodged in public databases. Similarly, over 1,000 SSR markers were identified by Nunome et al. (2009) while screening enriched cDNA and gDNA libraries. Barchi et al. (2011) isolated a wide-range of approximately 2,000 putative eggplant SSRs markers from restriction-site associated DNA tags out of which a subset exhibited polymorphism among the mapping population parents. A wide range of SSR markers is publicly obtainable for eggplant, either from genomic SSRs (genomic libraries of SSR enriched) or EST-SSR (genic libraries). Genomic SSRs are usually related to non-coding parts, but EST-SSRs are derived from expressed regions of the genome (Muñoz-Falcón et al., 2011). Meanwhile, EST-SSRs are less polymorphic compared to genomic SSRs (Muñoz-Falcón et al., 2011). The main objective of this study was to evaluate genetic diversity among collected materials using both genomic SSR and EST-SSR polymorphic markers and examine suitable parents for heterotic hybridization in future breeding programs. This study will be useful in the germplasm conservation and characterization for future breeding programs of eggplant resources.
Fifty-six accessions of eggplant (S. melongena) which formed three populations, of which 33 from Bangladesh (EB), 15 from Thailand (ET), and 8 from Malaysia (EM), were used for this study (Tab. 1). The materials were selected to represent the genetic diversity of local materials for each country (Fig. 1).
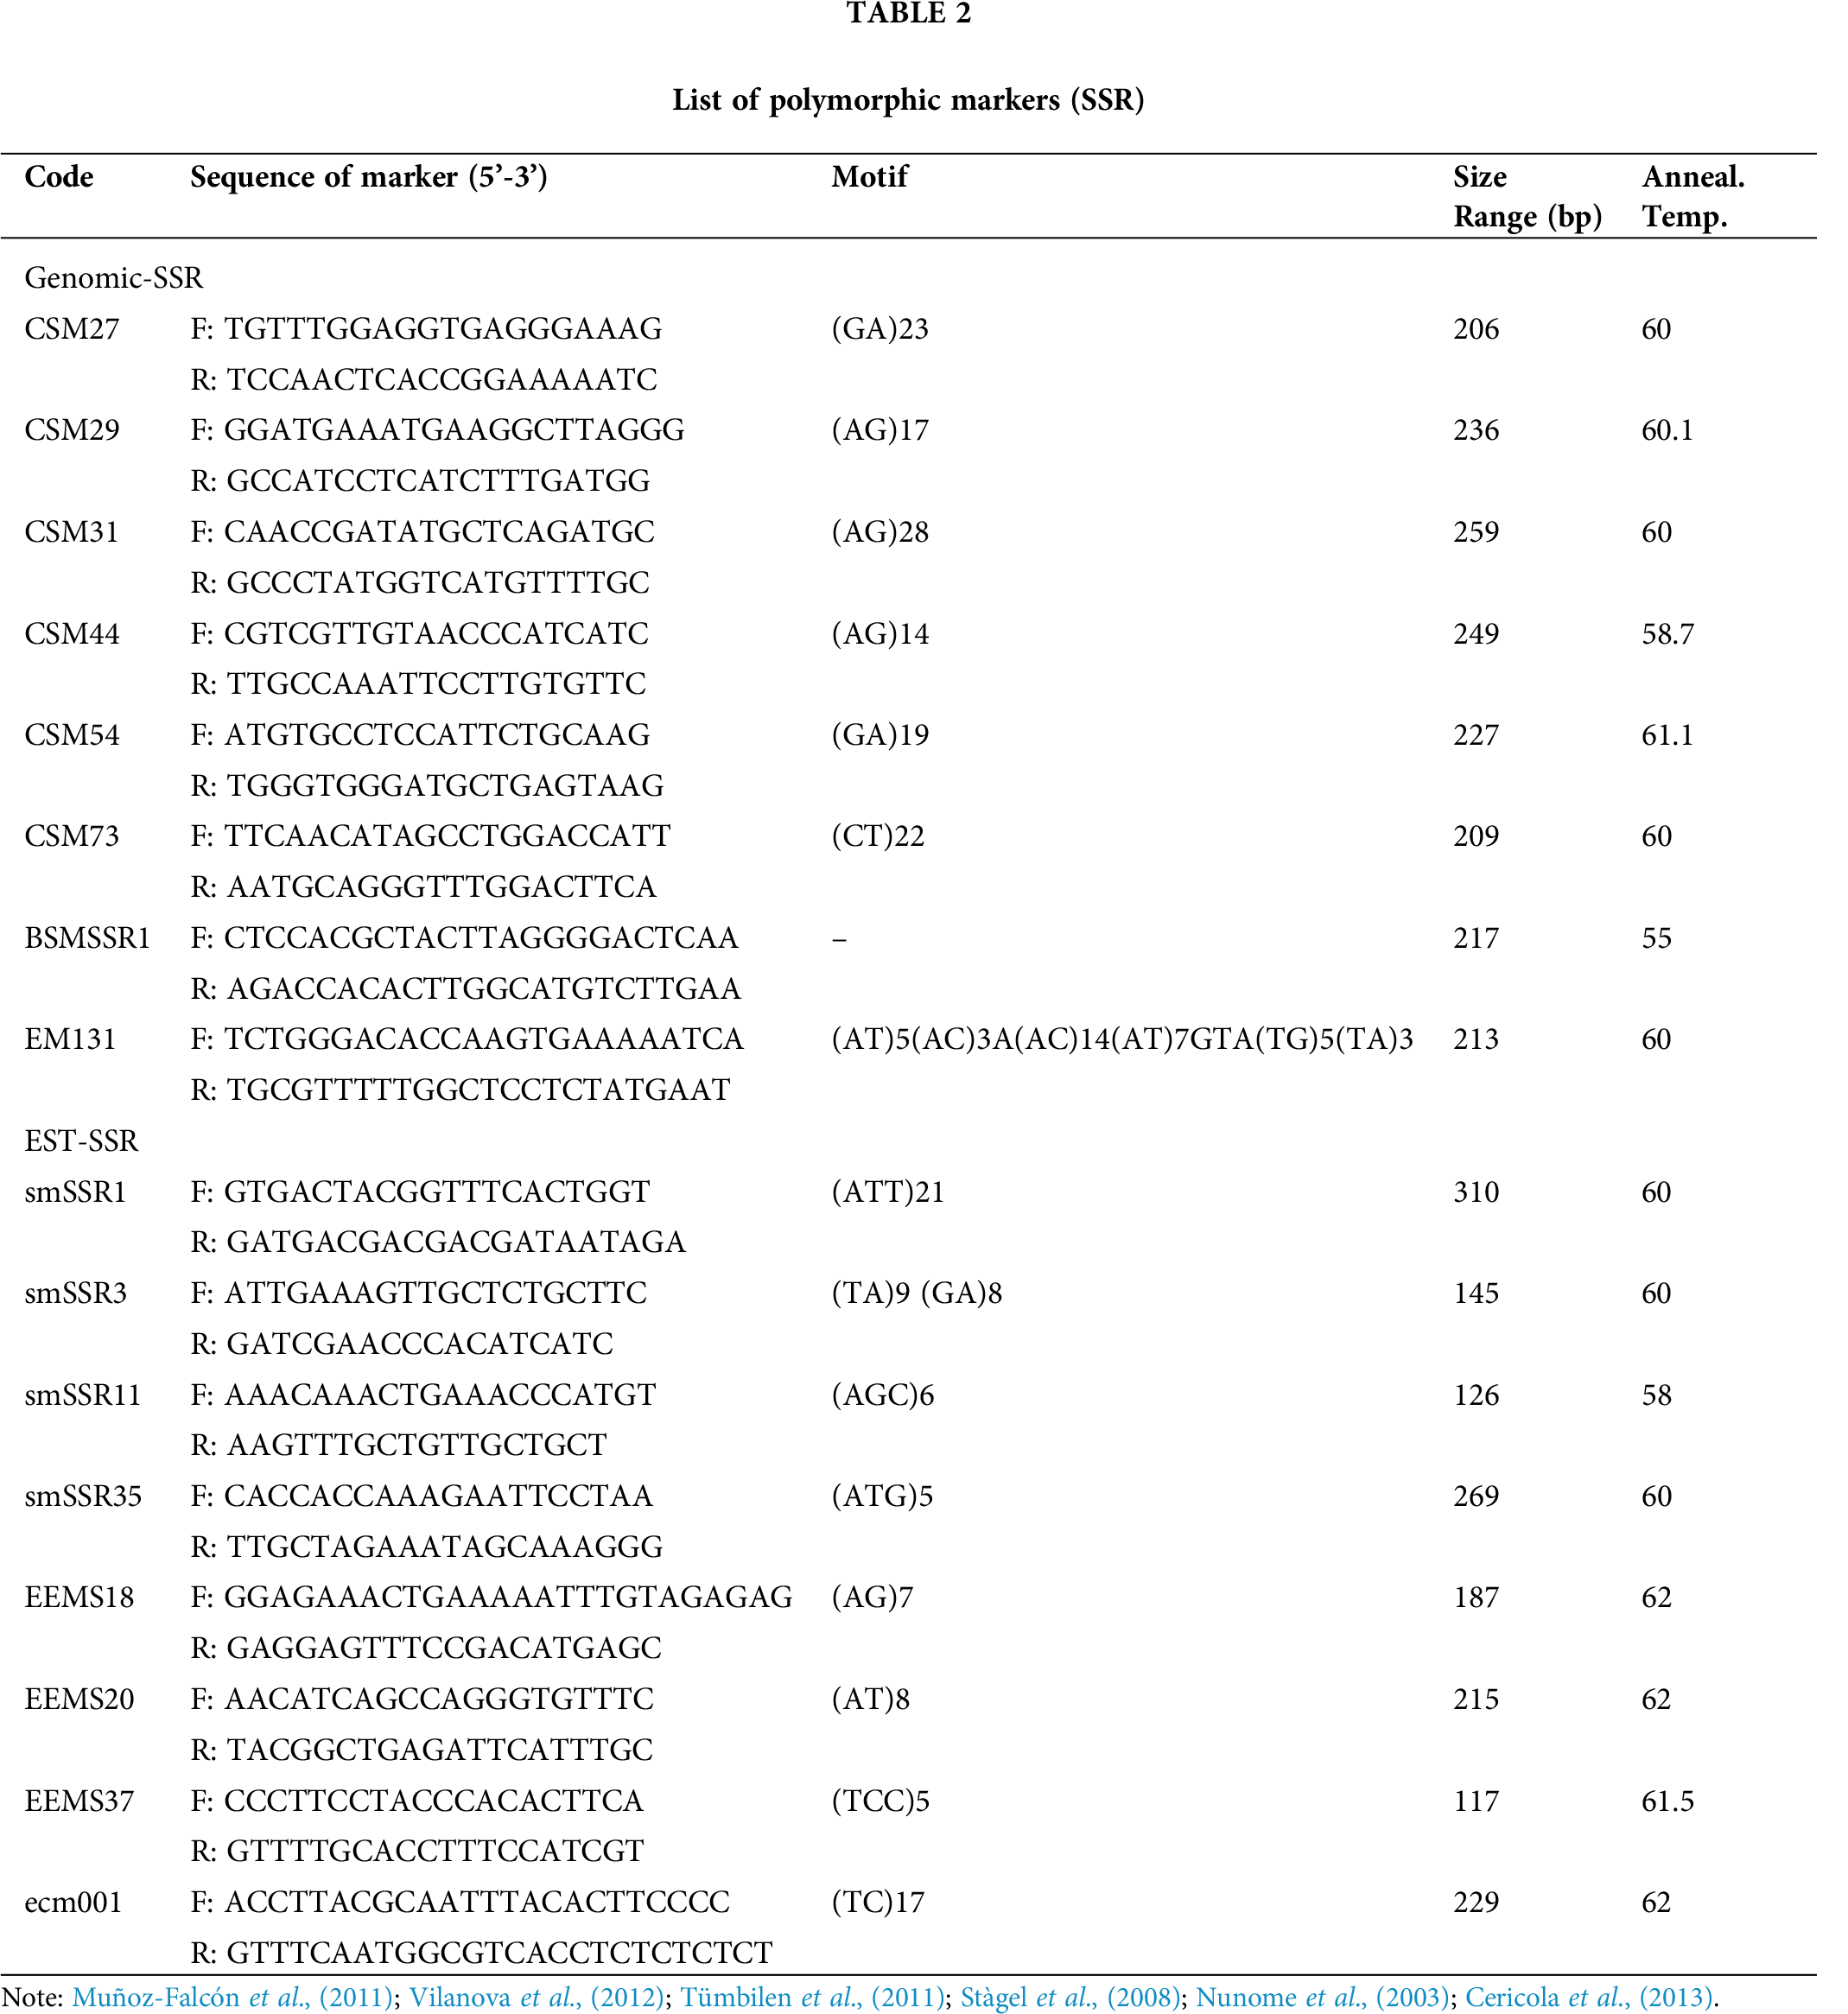
A total of 102 markers were selected for analyzing diversity, among which 16 markers (Nunome et al., 2003; Stàgel et al., 2008; Muñoz-Falcón et al., 2011; Tümbilen et al., 2011; Vilanova et al., 2012; Cericola et al., 2013) were found to be polymorphic with a clear band among the 56 accessions as shown in Tab. 2.
DNA extraction, genotyping and electrophoresis
Young leaves from individual accessions (approximately 100 mg) were used for the extraction of genomic DNA following a slight modification on the CTAB procedure (Oladosu et al., 2015). The DNA extraction was diluted to 50 ng/μL using a TE buffer and stored at −20°C until PCR amplification. The DNA concentration and purity were quantified using a Nanodrop 2000 spectrophotometer machine (ND 1000). The extracted DNA purity for individual samples was measured at an absorbance ratio from 1.95 to 2.0 of 260 nm divided by 280 nm. The PCR was conducted using a 15 μL-reagent containing: 7.5 μL 2× Taq DNA polymerase master mix (Thermo Scientific, USA), 4.5 μL nucleus free water, 1 μL forward primer (10 μM), 1 μL reverse primer (10 μM), and 1 μL DNA template (50 ng/μL). The PCR was run on a PCR machine using a touchdown protocol which was optimized for eggplant with initial denaturation of 94°C for 3 min followed by 10 cycles at 94°C for 30 s (decrease 1°C per cycle for denaturation), 55–65°C for 1 min and 72°C for 30 s followed by 30 cycles at 94°C for 30 s, annealing at 55°C for 1 min, 72°C for 1 min and final extension at 72°C for 5 min, followed by rapid cooling at 4°C prior to analysis. Annealing temperature depends on primers. For the DNA fragments amplification, 5 µL of PCR product loaded on the on 2% MetaPhor™ agarose (Lonza Rockland, Inc., USA) with 1X TBE buffer (0.05 M Tris, 0.05 M boric acid, 1 mM EDTA; pH 8.0) that was pre-stained with Midori Green Nucleic Acid Staining Solution (1:100,000) and run at 80 V for 60 min. Then the gels were documented using Molecular Imager® (GelDocTM XR, Bio-Rad). Exactly 100 bp (GeneDirex) DNA ladder was utilized to score the band.
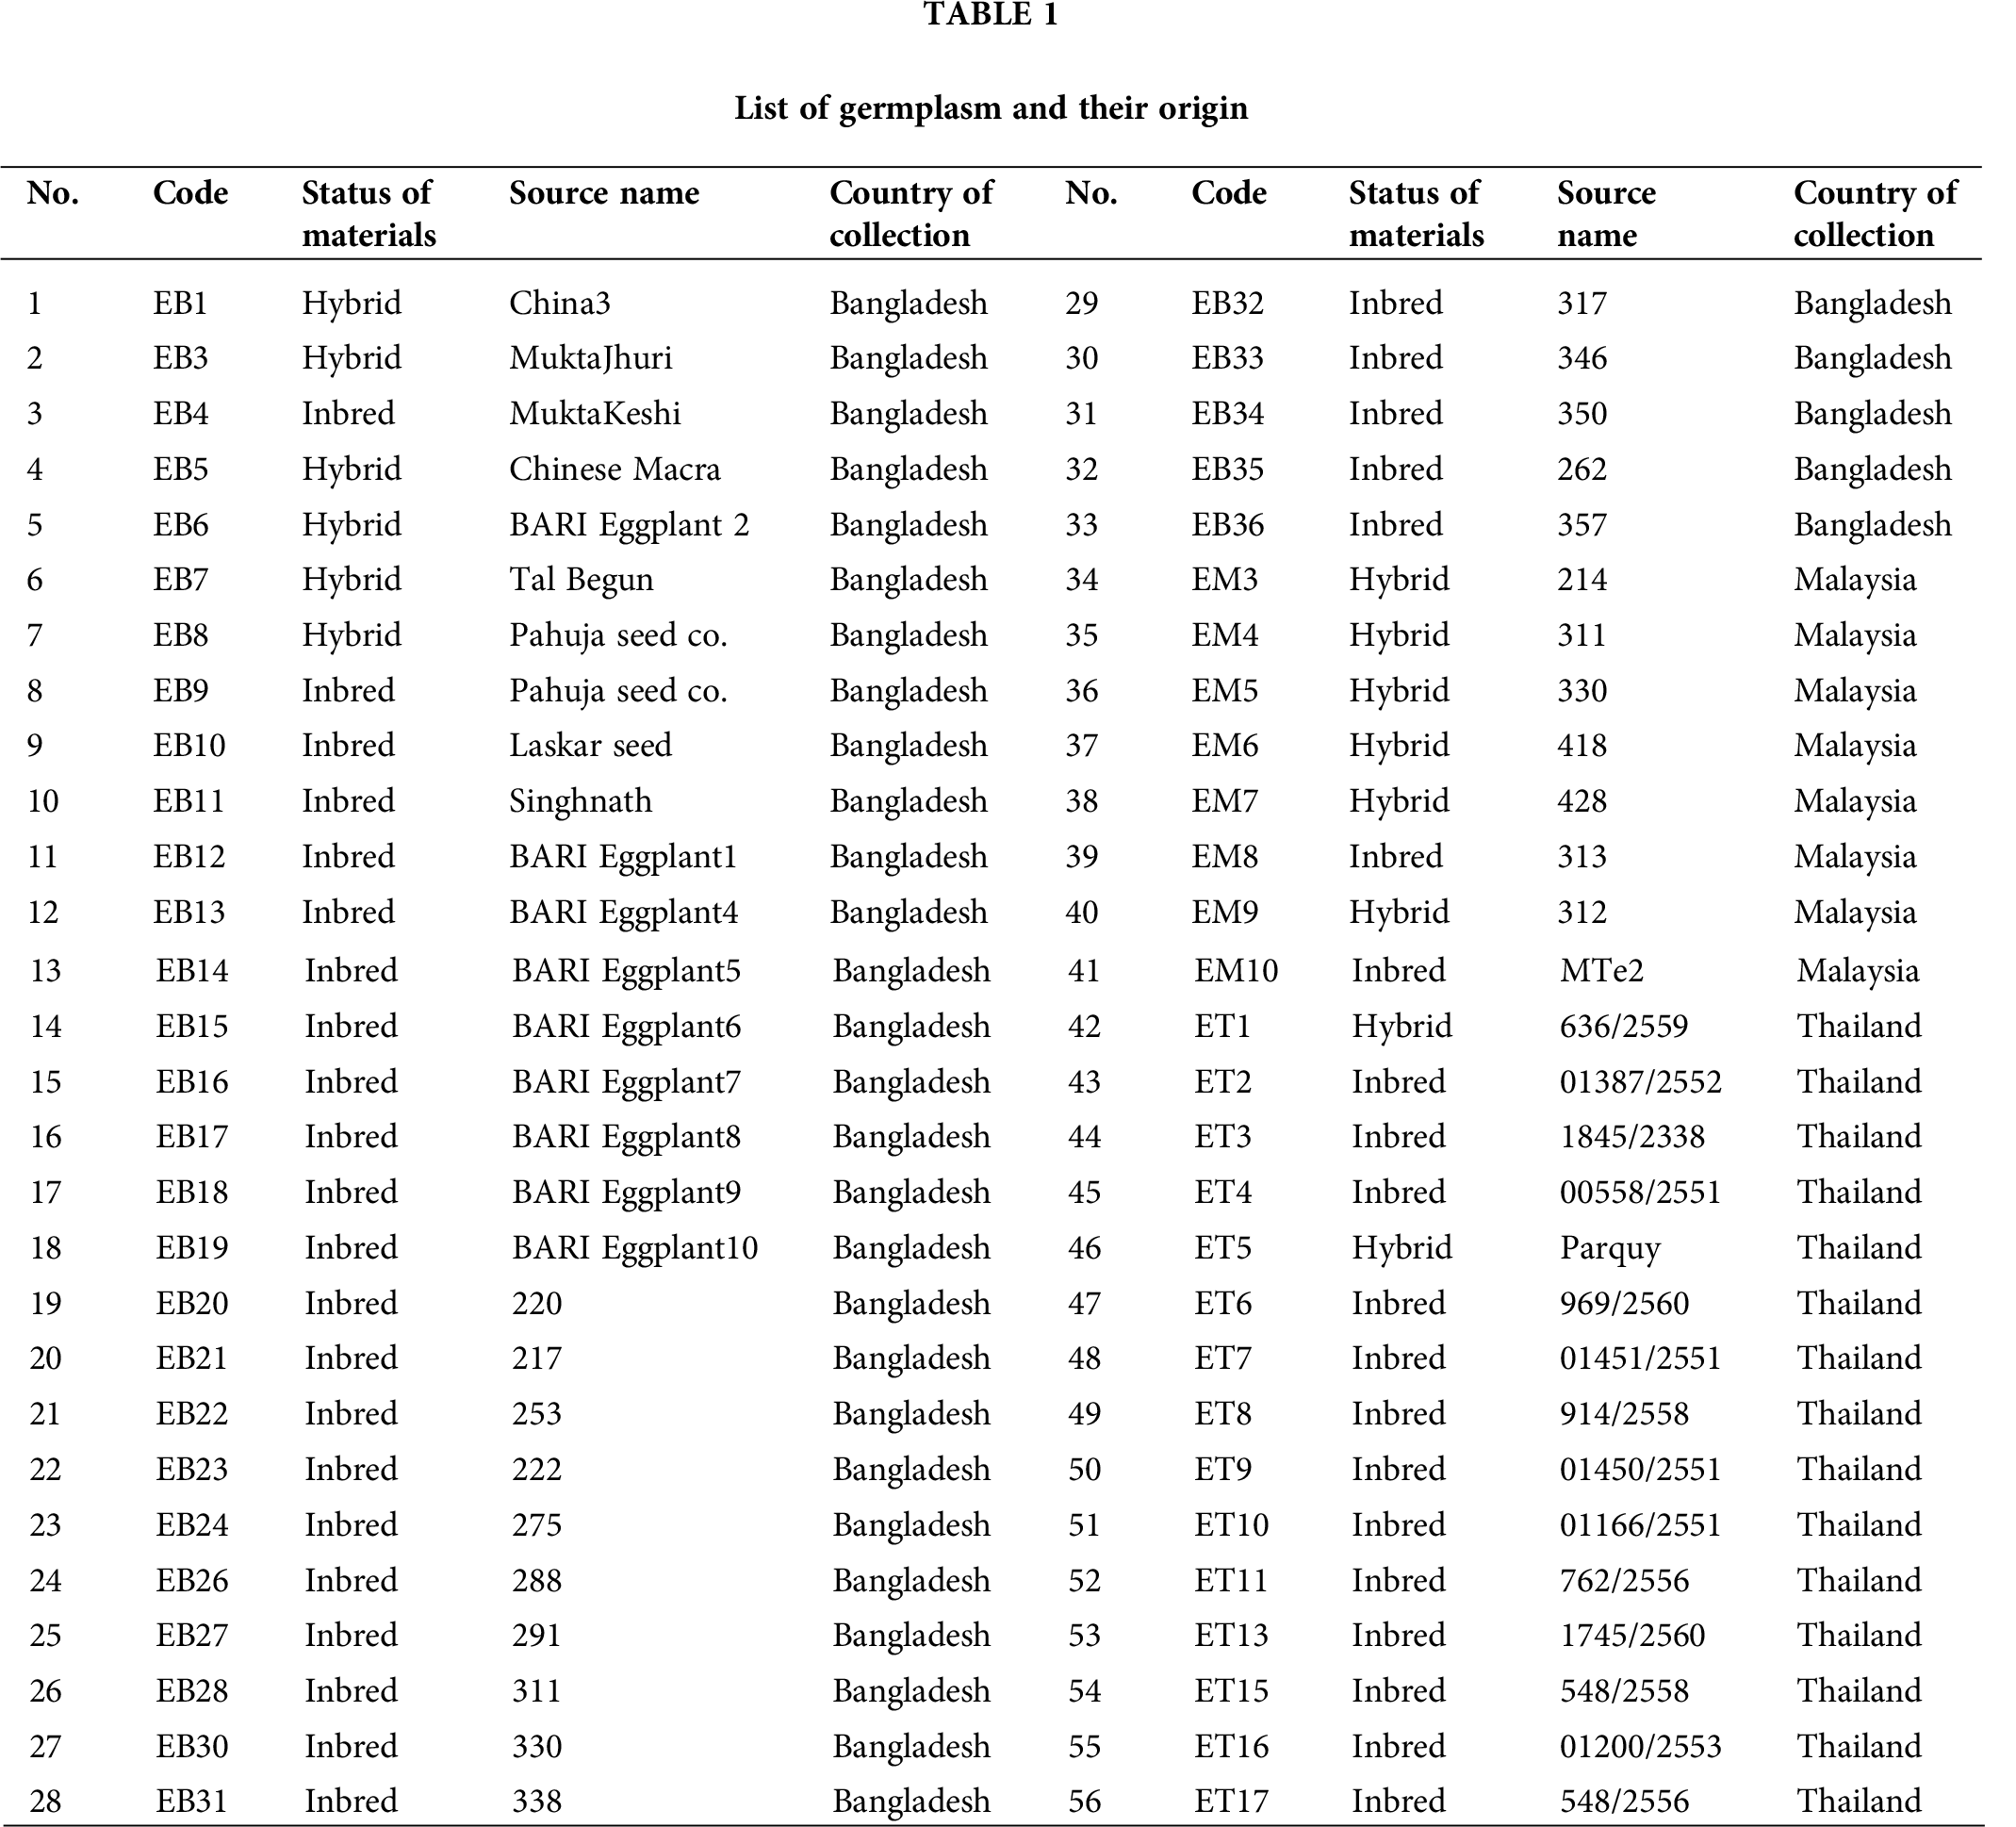
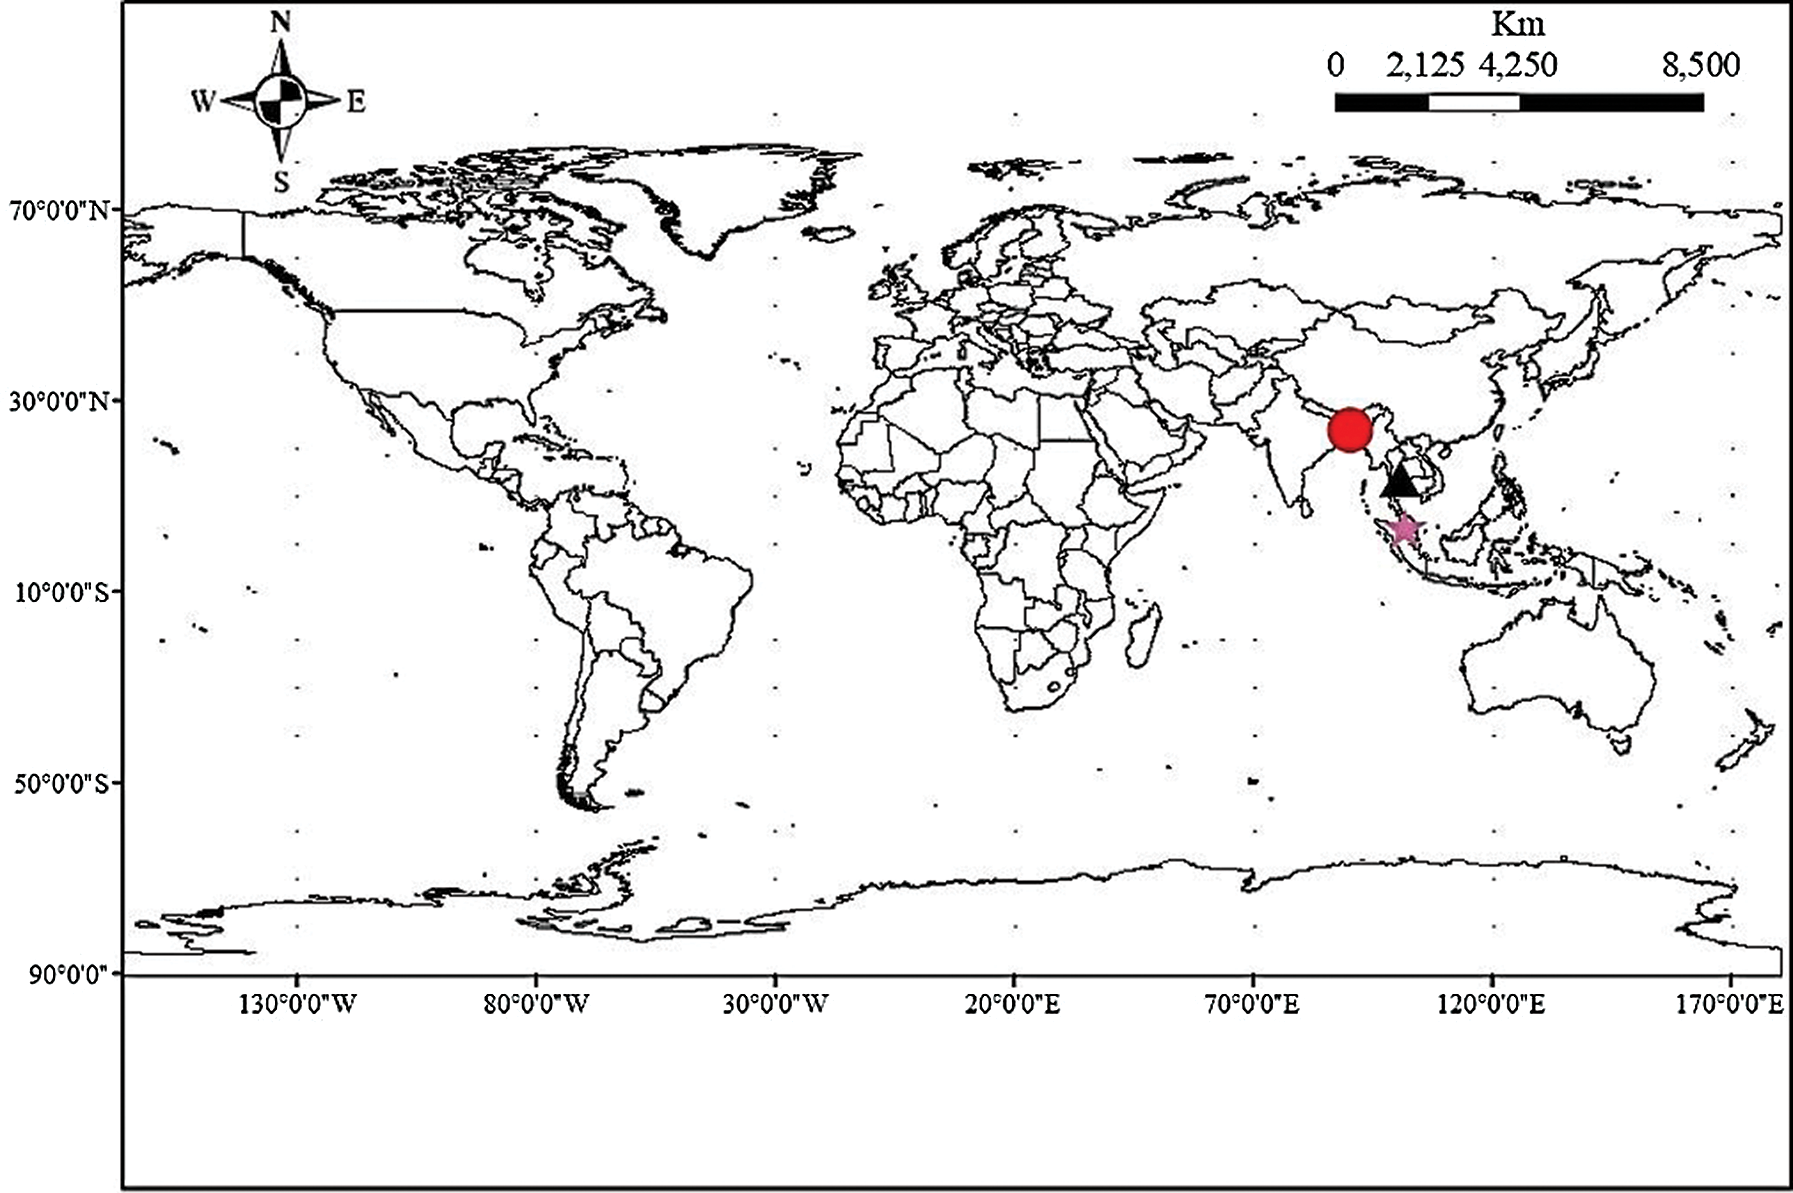
Figure 1: Map showing sample collection site (Circular mark = Gazipur, Bangladesh; Triangle = Bangkok, Thailand and Star = Selangor, Malaysia).
The data were transformed into binary data using the UVIDoc software. NTSys software was used for clustering and PCA, with number 1 indicating present, and 0 showing (0) for each locus. The data was then analyzed using the Popgen software Version 1.32, reported by Yeh (1997). Polymorphic Information Content (PIC) values were computed using the following formula:
Here, pij is the frequency of the j-th allele for the i-th marker and summed over N alleles (Anderson et al., 1993). All the data were analyzed using the NTSYS Pc software Version 2.20 for multivariate analysis. First, the data were standardized to remove the effects of different measurements using the STAND function. The distance coefficient was then worked out using the DICE similarity index by utilizing the transformed data and the information was exemplified in dendrogram following unweighted pair group method with arithmetic average (UPGMA), and SHAN (sequential, hierarchical, and nested clustering) methods in NTSYS Pc. 2.20. The adjustment between the dendrogram and dissimilarity matrix was estimated by the cophenetic correlation coefficient (r) according to Rohlf (1998). The average genetic distance was then used as a cut-off value to define genotype clusters. Principal component analysis (PCA) was calculated using DECENTRE, EIGEN, and GRAPHICS as described by Rohlf (1998) to complement cluster analysis. The distribution of genetic variation within and between families from different countries was determined using the analysis of molecular variance (AMOVA) was calculated using the Gene Alex 6.502 software (Peakall and Smouse, 2006). The test for significance of the estimated parameters was conducted based on 10,000 bootstrap resamples.
Polymorphism analysis with SSR (Simple Sequence Marker)
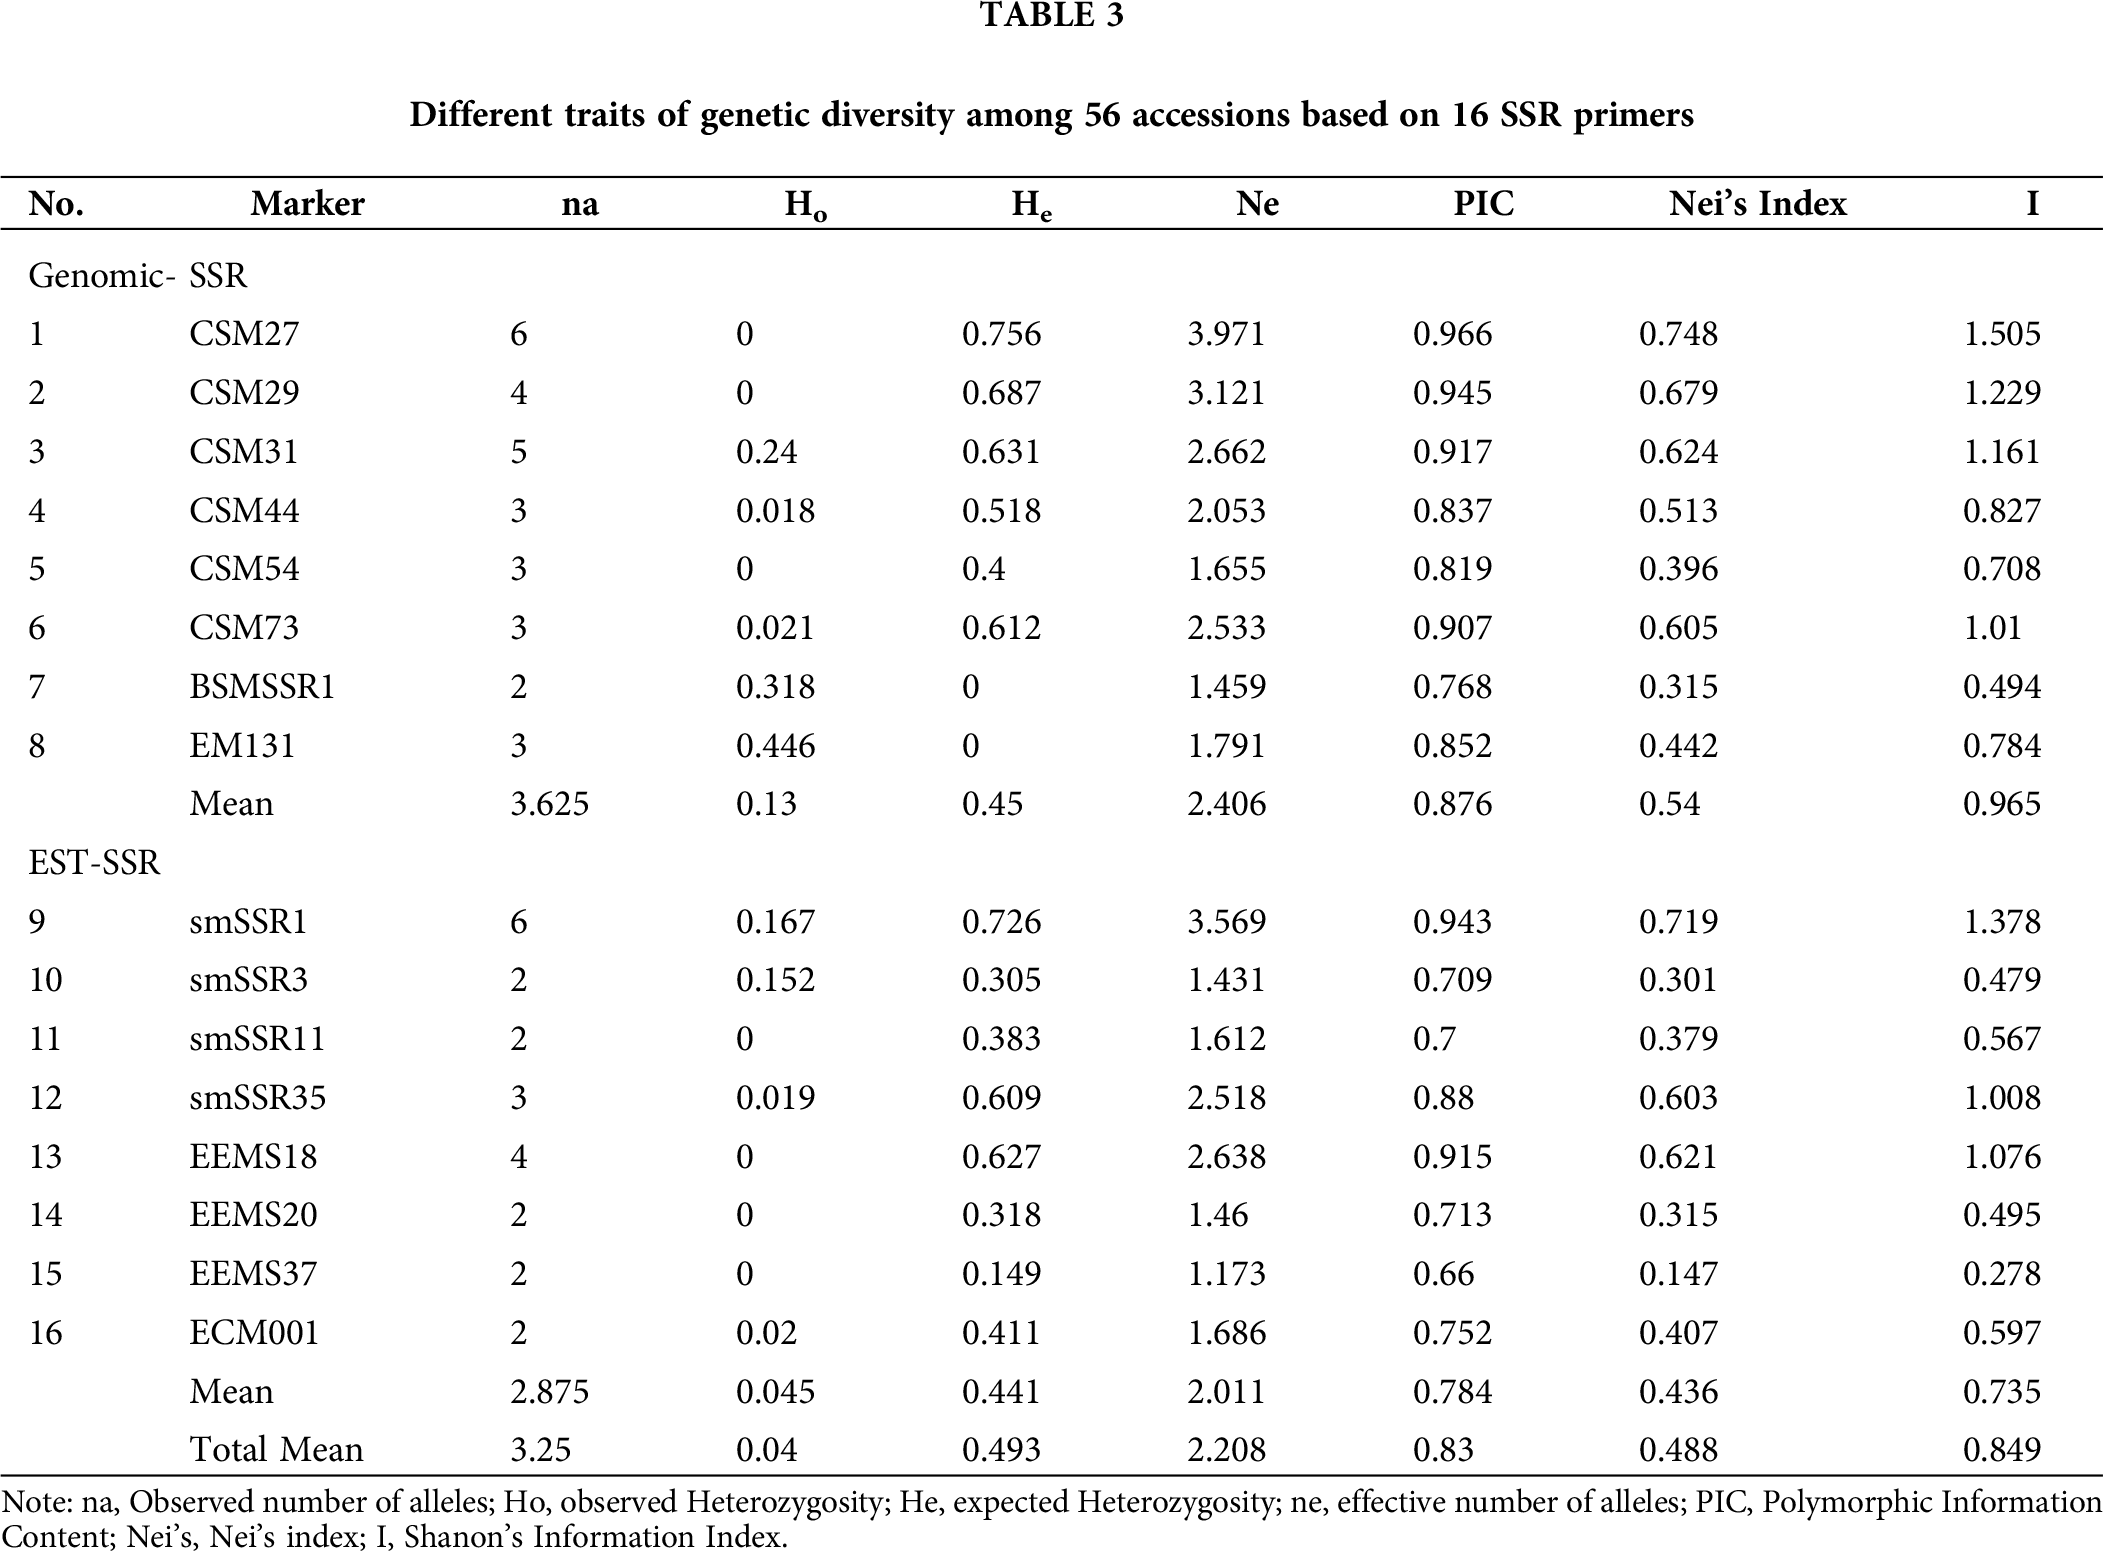
From the studied 102 markers, the 16 which showed polymorphism bands were selected for genetic diversity analysis. The expected heterozygosity ranged from 0 to 0.756, with an average of 0.493 (Tab. 3). The observed heterozygosity was zero (0) for seven markers to 0.446 for marker EM131, with an average value of 0.040. The PIC value ranged from 0.660 (EEMS 37) to 0.966 for CSM 27, with an average value of 0.830. This indicates that the most informative marker was CSM27, which differentiated the highest number of accessions; whereas, the least informative marker was EEMS 37, which separated the least number of accessions. The effective number of alleles ranged from 0.609 (SMSSR 35) to 3.971 (CSM27), with an average of 2.208. The highest numbers of alleles (6) were observed from ‘marker CSM27 and smSSR1’, while the lowest numbers of alleles (2) were observed from ‘markers BSMSSR1, smSSR3, smSSR11, EEMS20, EEMS37, and ECM001 with an average value of 3.250. The Nei’s index varied from 0.147 (EEMS 37) to 0.748 for CSM 27 with a mean value of 0.488. The observed Shanon’s index varied from 0.278 to 1.505, with an average value of 0.849. The summary of the SSR marker with their genetic diversity-related traits is presented in Tab. 3. The observed heterozygosity (Ho) estimate values were exhibited at 0.040 (average value).
Genetic diversity within populations
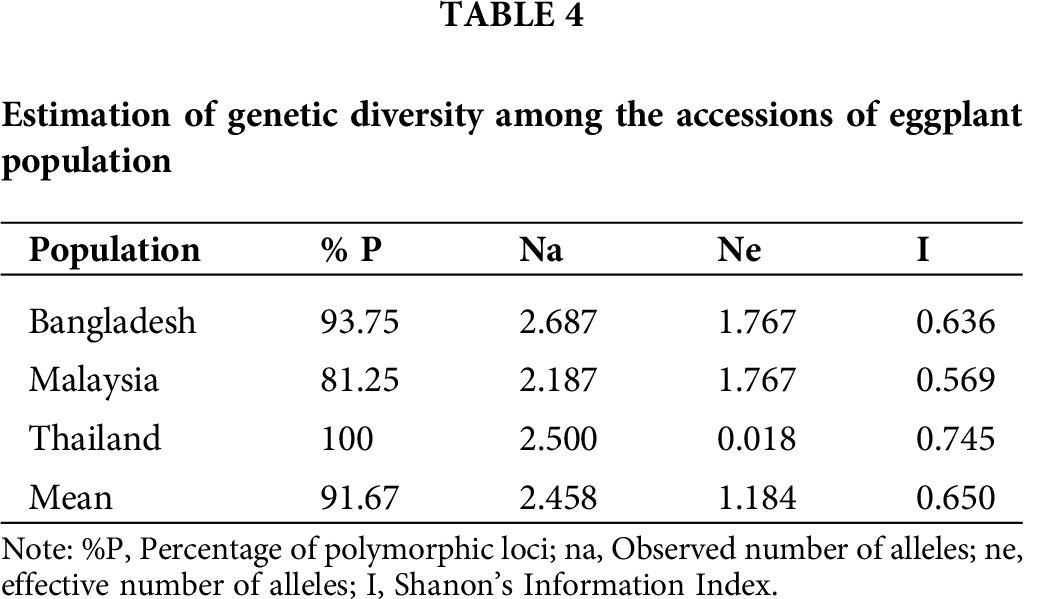
The percentage of average polymorphic loci was 91.67% among populations (Tab. 4). Thailand’s accessions exhibited the highest genetic diversity, i.e., 100%, whereas Malaysia’s accessions showed 81.25%, which was the lowest, while Bangladesh revealed a 93.75% level of diversity. Moreover, among these populations, the observed number of alleles ranged from 2.187 (Malaysia) to 2.687 (Bangladesh), with a mean value of 2.458. The effective number of alleles (ne) varied from 0.018 (Thailand) to 1.767 (Bangladesh), with an average value of 1.184. Shanon’s information index varied from 0.569 (Malaysia) to 0.745 (Thailand), with an average value of 0.650.
The selected sixteen SSR marker data were analyzed for clustering using the NTSYS software. Clustering was conducted to group all accessions into the dendrogram. The similarity coefficient is ranged from 0.23 to 0.88. All accessions were classified into six groups, with a threshold level of 0.33 (Fig. 2). The first cluster consisted of 31 accessions (30 from Bangladesh and one from Malaysia). In contrast, the second Cluster had 5 accessions from Thailand and Bangladesh, while Cluster III consisted of only one accession from Bangladesh, Clusters IV and V had 6 accessions each, and Cluster VI consisted of seven accessions from Thailand. The result of the PCA is presented in Fig. 3. Accessions such as EB12, ET11, ET13, ET15, ET16, and ET17 were farthest from the center. Meanwhile, accessions like EM3, EB34, and EB3 were located near the center.
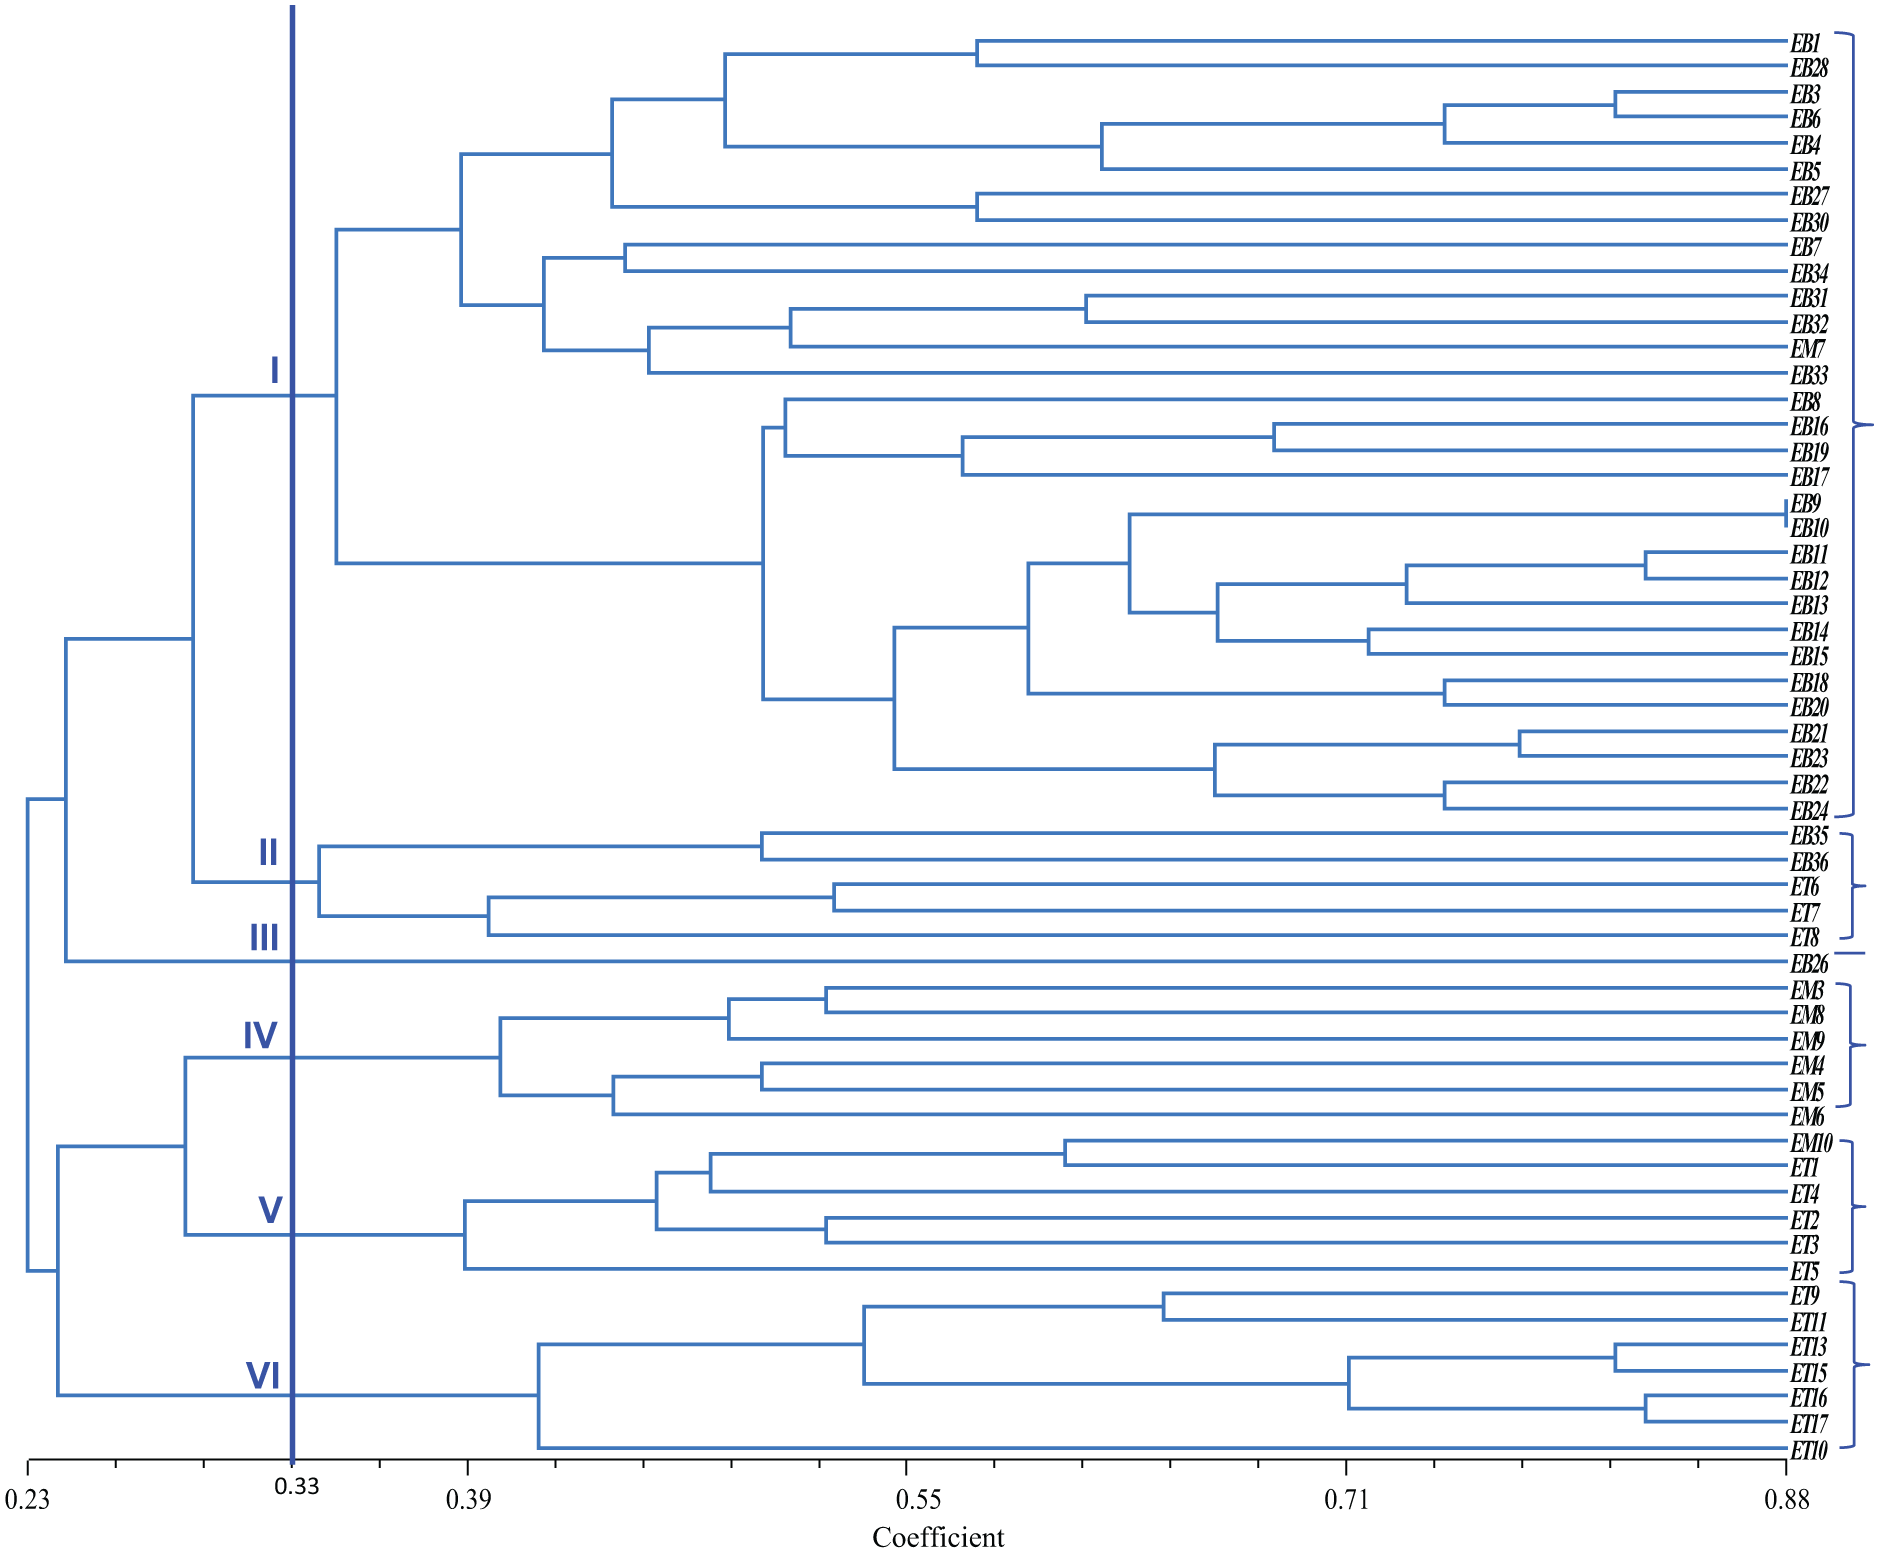
Figure 2: Clustering of 56 eggplant genotypes based on polymorphic SSR markers regardless of origin using Jaccard’s coefficient of similarity and UPGMA clustering.
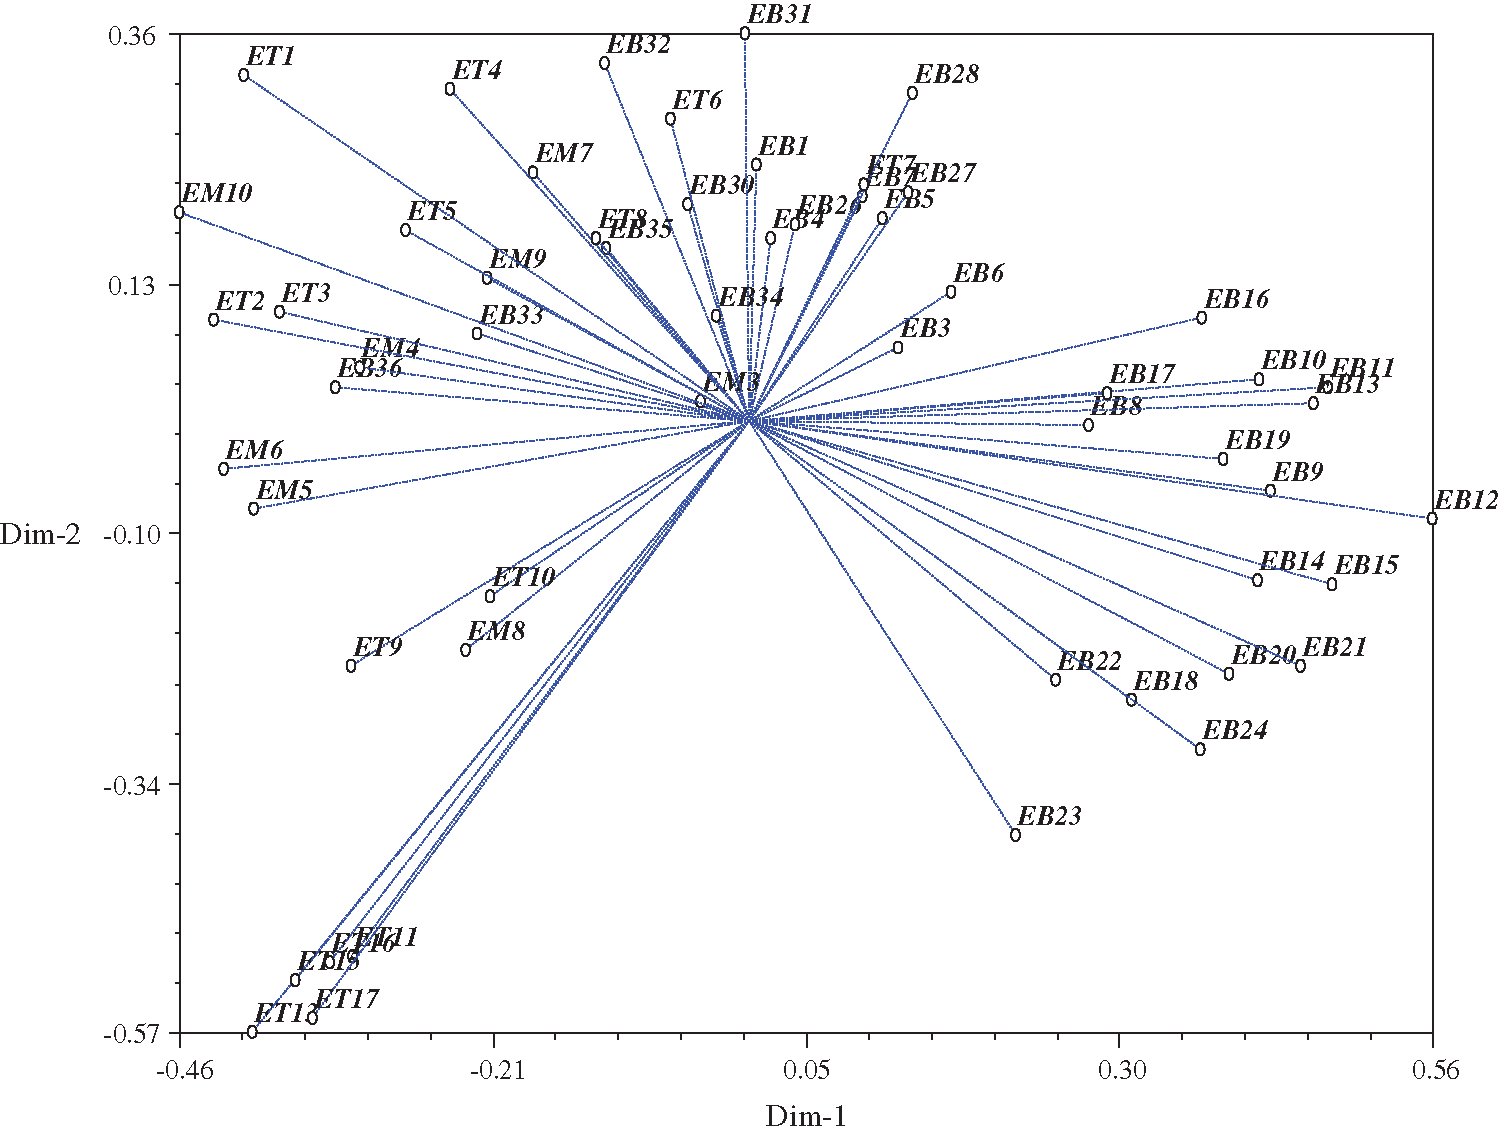
Figure 3: Principal Component analysis (PCA) of relationship among all accessions in two dimensional graph.
Analysis of molecular variance (AMOVA) using SSR markers
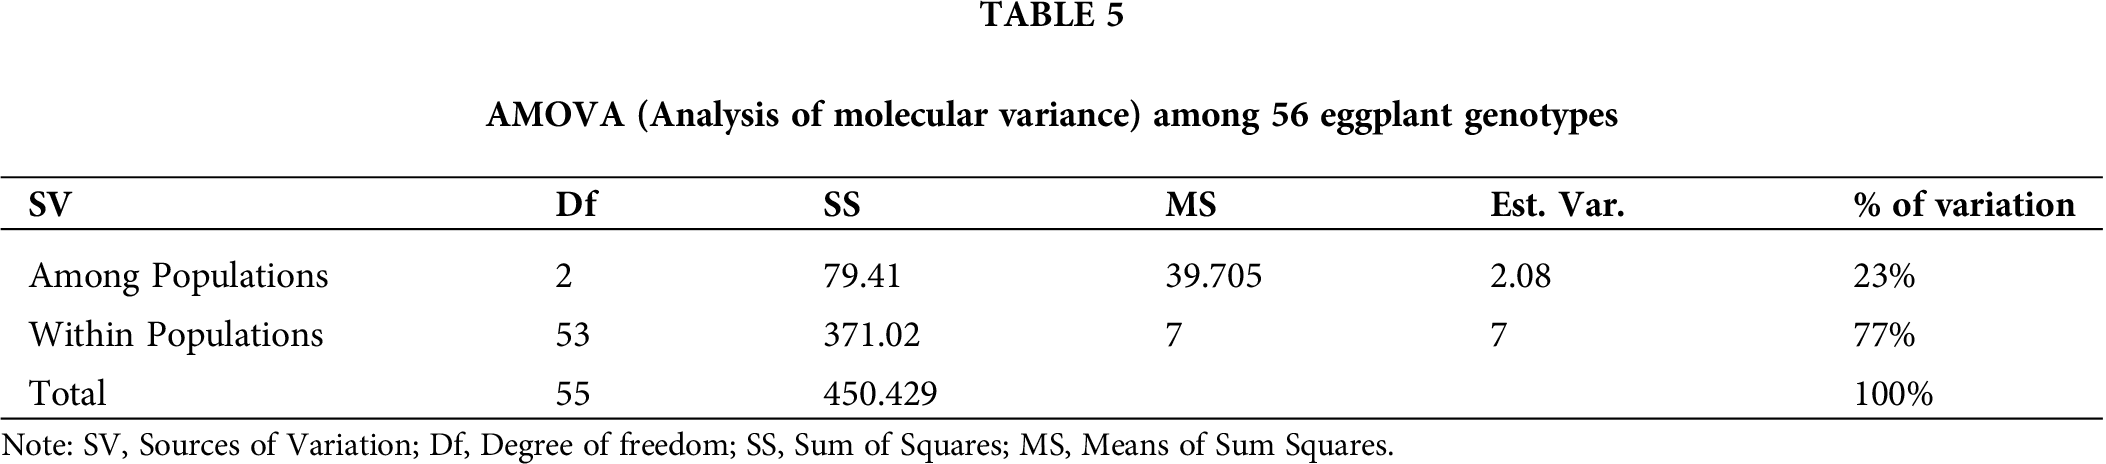
The SSR profiles of the eggplant genotypes in this research were analyzed using AMOVA to determine the inter-population genetic variances. The inter-genetic variances and intra-genetic variances among the populations were 23% and 77%, respectively (Tab. 5). Moreover, the AMOVA analysis showed highly significant (p ≤ 0.01) genetic differences among populations (Bangladesh, Malaysia, and Thailand) and within populations. Total genetic variation within populations was 77% in 56 eggplant genotypes; whereas, genetic variation among populations was 23% in three regions. This indicated that high genetic dissimilarity existed within-population compared to among-population.
This research revealed the level of genetic diversity among the available germplasm of eggplant collected from three different countries using the SSR marker (Fig. 2). The determination of genetic variation among germplasm is vital in the breeding and conservation of genetic resources. It is also important in genetic improvement and exploitation of genes for tolerance against abiotic stress. The detection of polymorphism within germplasm is important in breeding. There are reports (Nunome et al., 2003; Stàgel et al., 2008; Demir et al., 2010) of low polymorphism frequency within intraspecific lines and cultivars among crops of Solanaceae family, and this is possibly due to their autogamous nature. Eggplant is an autogamous crop, and most of the materials are commercial varieties, so low heterozygosity is not unexpected (Cericola et al., 2013). The more or less similar value of Ho (0.038) was also reported by Augustinos et al. (2016). The low value of Ho was also observed by Liu et al. (2018) and Vilanova et al. (2012), who reported 0.03 and 0.06 in their respective study. The high value of homozygosity indicates that pure lines can be found from the selection of individuals among this germplasm (Vilanova et al., 2014; Gramazio et al., 2019). Although molecular diversity depends on the number of markers, types of markers, and the tested accessions (Augustinos et al., 2016; Tümbilen et al., 2011; Gramazio et al., 2019). The high average value of PIC, the high mean number of alleles per locus, and high levels of observed heterozygosity in this research are comparable with other studies, thus indicating that great diversity exists among the collected germplasm. The study reported by Nunome et al. (2003) showed an average value of the observed number of alleles per locus was 3.1, and the expected heterozygosity value was 0.38 when an evaluation was conducted within 11 germplasm of S. melongena using 16 polymorphic dinucleotide genomic microsatellites. Thirty-eight S. melongena accessions were evaluated using 11 EST-SSR polymorphic markers, the mean value of alleles per locus was 3.1 and the average PIC value was 0.38, according to a report by Stàgel et al. (2008). From their study, it was observed that genomic SSR markers are more polymorphic compared to EST-SSRs. This was in tandem with reports by Kalia et al. (2011), Vilanova et al. (2012), and Nunome et al. (2009). Five eggplants SSRs, developed by Nunome et al. (2009), chosen for the high value of PIC, showed an average of 5alleles/locus. Considering the five SSRs with the highest value of PIC, the average number of alleles per locus in this study was 5, which is greater than the value reported by Demir et al. (2010). This indicates a wide diversity exists with different origins and types.
SSR marker is useful for the analysis of genetic diversity in eggplant. For this study, the PIC value range from 0.660 to 0.966, with an average value of 0.830. This value was higher than the mean PIC value of 0.401, 0.47, and 0.507, reported by Vilanova et al. (2012), Muñoz-Falcón et al. (2011), and Liu et al. (2018), respectively. A PIC value greater than 0.5 indicates a highly polymorphic locus. A PIC value of 0.25–0.50 shows an intermediate polymorphic locus, while a PIC of lower than 0.25 indicates a low polymorphic locus (Gramazio et al., 2019; Kalia et al., 2011; Nunome et al., 2009; Ge et al., 2013). In this research, the average value of PIC was 0.830, indicating a high level of polymorphism in the loci. Genetic diversity level measured in eggplants varies in different literature studies. Hurtado et al. (2012) recorded a high genetic diversity study for some Chinese accessions, i.e., He = 0.494, and some Sri Lankan accessions, i.e., He = 0.540, which is similar to that observed in this study (He = 0.493). This research showed Nei’s index and Shanon’s information index values of 0.488 and 0.849, respectively, which were higher than the result recorded by Ge et al. (2013), where Nei’s index value & Shannon’s index value 0.323 and 0.570, respectively. This may be due to different materials, sample sizes, and different types of markers used.
The dendrogram coefficient range varied from 3.51 to 12.89, indicating a high amount of variation present among existing materials. Higher diversity was observed among genotypes of Groups I to VI due to their different morphological characters. The accessions were admixtured from different countries, indicating that these accessions had a common origin or more or less the same morphological characters. On the other hand, the accessions which were distant from one another, meaning that these accessions had different agronomical traits or distinct origin. The accessions from different clusters but different origins suggest an exchange of genetic materials by plant breeders from different geographical locations. Dissimilarities among accessions could be due to environmental influence occurring over a long period of time.
The AMOVA showed highly significant genetic differences within populations. This result indicates that high genetic dissimilarities existed among the accessions within the population (77%), while there are low significant differences among the populations (23%), showing the presence of low genetic dissimilarities among the population. This research results were similar to previous research by Mazid et al. (2013), in which 67% variation was present within groups of 41 rice genotypes while there was 33% variation among the 41 rice genotypes.
The microsatellite markers are valuable tools in determining the genetic relationship among eggplant accessions such as those from three different countries (Bangladesh, Malaysia, and Thailand) used in this study. These markers also helped to reveal a high level of polymorphism within the population and a low polymorphism level among populations. Through the improvement of eggplant accessions and widening of their genetic base, the population which has the least genetic similarities could be selected as parental materials. Therefore, hybridization should be conducted using two distant populations like any accessions of Cluster I with Cluster V. Hence, accessions EB12, ET11, ET13, ET15, ET16, and ET17 could be crossed with accessions EM3, EB34, and EB3 for improvement in the future breeding program. The molecular variance analysis showed that 77% of total genetic variations were due to differences within populations, whereas 23% genetic variation was exhibited among populations.
Acknowledgement: Debi Rani Datta is grateful to the Bangabandhu Science and Technology Fellowship authority for a Ph.D. fellowship at Universiti Putra Malaysia.
Availability of Data and Materials: All data analyzed or generated in this study are included in within the manuscript.
Author Contribution: The authors confirm contribution to the paper as follows: study conception and design: Debi Rani Datta and Mohd Rafii Yusop; data collection: Debi Rani Datta; analysis and interpretation of results: Debi Rani Datta, Mohd Rafii Yusop, Azizah Misran, Mashitah Jusoh and Yusuff Oladosu; draft manuscript preparation, review and editing: Debi Rani Datta, Yusuff Oladosu, Fatai Arolu, Azadul Haque and Nadzirah M. Sulaiman. All authors reviewed the results and approved the final version of the manuscript.
Funding Statement: The authors are thankful to the Malaysia Ministry of Education’s for the Long-Term Research Grant Scheme (LRGS) on Sustainable vegetable production technology for food security in urban agriculture (LRGS/1/2019/UKM/01/5/4).
Conflicts of Interest: The authors declare no conflict of interest as regards to the manuscript.
Anderson A, Churchill GA, Autrique JE, Tanksley SD, Sorrells ME (1993). Optimizing parental selection for genetic linkage maps. Genome 36: 181–186. DOI 10.1139/g93-024. [Google Scholar] [CrossRef]
Augustinos A, Petropoulos C, Karasoulou V, Bletsos F, Papasotiropoulos V (2016). Assessing diversity among traditional Greek and foreign eggplant cultivars using molecular markers and morphometrical descriptors. Spanish Journal of Agricultural Research 14: e0710. DOI 10.5424/sjar/2016144-9020. [Google Scholar] [CrossRef]
Barchi L, Lanteri S, Portis E, Acquadro A, Valè G, Toppino L (2011). Identification of SNP and SSR markers in eggplant using RAD tag sequencing. BMC Genomics 12: 171. DOI 10.1186/1471-2164-12-304. [Google Scholar] [CrossRef]
Cericola F, Portis E, Toppino L, Barchi L, Acciarri N, Ciriaci T, Sala T, Rotino GL, Lanteri S (2013). The population structure and diversity of eggplant from Asia and the Mediterranean basin. PLoS One 8: e73702. DOI 10.1371/journal.pone.0073702. [Google Scholar] [CrossRef]
Chukwu SC, Rafii MY, Ramlee SI, Ismail SI, Oladosu Y, Muhammad I, Nwokwu G (2020). Genetic analysis of microsatellites associated with resistance against bacterial leaf blight and blast diseases of rice (Oryza sativa L.). Biotechnology & Biotechnological Equipment 34: 898–904. DOI 10.1080/13102818.2020.1809520. [Google Scholar] [CrossRef]
Demir K, Bakir M, Sarikamis G, Acunalp S (2010). Genetic diversity of eggplant (Solanum melongena) germplasm from Turkey assessed by SSR and RAPD markers. Genetics and Molecular Research 9: 1568–1576. DOI 10.4238/vol9-3gmr878. [Google Scholar] [CrossRef]
Ge H, Liu Y, Jiang M, Zhang J, Han H, Chen H (2013). Analysis of genetic diversity and structure of eggplant populations (Solanum melongena L.) in China using simple sequence repeat markers. Scientia Horticulturae 162: 71–75. DOI 10.1016/j.scienta.2013.08.004. [Google Scholar] [CrossRef]
Gramazio P, Chatziefstratiou E, Petropoulos C, Chioti V, Mylona P, Kapotis G, Vilanova S, Prohens J, Papasotiropoulos V (2019). Multi-level characterization of eggplant accessions from Greek Islands and the mainland contributes to the enhancement and conservation of this germplasm and reveals a large diversity and signatures of differentiation between both origins. Agronomy 9: 887. DOI 10.3390/agronomy9120887. [Google Scholar] [CrossRef]
Hurtado M, Vilanova S, Plazas M, Gramazio P, Fonseka HH, Fonseka R, Prohens J (2012). Diversity and relationships of eggplants from three geographically distant secondary centers of diversity. PLoS One 7: e41748. DOI 10.1371/journal.pone.0041748. [Google Scholar] [CrossRef]
Jasim Aljumaili S, Rafii MY, Latif MA, Sakimin SZ, Arolu IW, Miah G (2018). Genetic diversity of aromatic rice germplasm revealed by SSR markers. BioMed Research International 2018: 1–11. DOI 10.1155/2018/7658032. [Google Scholar] [CrossRef]
Kalia RK, Rai MK, Kalia S, Singh R, Dhawan AK (2011). Microsatellite markers: an overview of the recent progress in plants. Euphytica 177: 309–334. DOI 10.1007/s10681-010-0286-9. [Google Scholar] [CrossRef]
Liu J, Yang Y, Zhou X, Bao S, Zhuang Y (2018). Genetic diversity and population structure of worldwide eggplant (Solanum melongena L.) germplasm using SSR markers. Genetic Resources and Crop Evolution 65: 1663–1670. DOI 10.1007/s10722-018-0643-4. [Google Scholar] [CrossRef]
Mazid MS, Rafii MY, Hanafi MM, Rahim HA, Latif MA (2013). Genetic variation, heritability, divergence and biomassaccumulation of rice genotypes resistant to bacterial blightrevealed by quantitative traits and ISSR markers. Physiologia Plantarum 149: 432–447. [Google Scholar]
Muñoz-Falcón JE, Vilanova S, Plazas M, Prohens J (2011). Diversity, relationships, and genetic fingerprinting of the Listada de Gandía eggplant landrace using genomic SSRs and EST-SSRs. Scientia Horticulturae 129: 238–246. DOI 10.1016/j.scienta.2011.03.034. [Google Scholar] [CrossRef]
Nunome T, Negoro S, Kono I, Kanamori H, Miyatake K, Yamaguchi H, Ohyama A, Fukuoka H (2009). Development of SSR markers derived from SSR-enriched genomic library of eggplant (Solanum melongena L.). Theoretical and Applied Genetics 119: 1143–1153. DOI 10.1007/s00122-009-1116-0. [Google Scholar] [CrossRef]
Nunome T, Suwabe K, Iketani H, Hirai M, Wricke G (2003). Identification and characterization of microsatellites in eggplant. Plant Breeding 122: 256–262. DOI 10.1046/j.1439-0523.2003.00816.x. [Google Scholar] [CrossRef]
Oladosu Y, Rafii MY, Abdullah N, Malek MA, Rahim HA, Hussin G, Kareem I (2015). Genetic variability and diversity of mutant rice revealed by quantitative traits and molecular markers. Agrociencia 49: 249–266. [Google Scholar]
Peakall ROD, Smouse PE (2006). GENALEX 6: genetic analysis in Excel. Population genetic software for teaching and research. Molecular Ecology Notes 6: 288–295. [Google Scholar]
Rohlf FJ (1998). NTSYSpc: numerical taxonomy and multivariate analysis system, version 2.02 user guide. Applied Biostatistics Inc., Setauket, New York. [Google Scholar]
Sarif HM, Rafii MY, Ramli A, Oladosu Y, Musa HM, Rahim HA, Chukwu SC (2020). Genetic diversity and variability among pigmented rice germplasm using molecular marker and morphological traits. Biotechnology & Biotechnological Equipment 34: 747–762. DOI 10.1080/13102818.2020.1804451. [Google Scholar] [CrossRef]
Stàgel A, Portis E, Toppino L, Rotino GL, Lanteri S (2008). Gene-based microsatellite development for mapping and phylogeny studies in eggplant. BMC Genomics 9: 357. DOI 10.1186/1471-2164-9-357. [Google Scholar] [CrossRef]
Sulaiman NN, Rafii MY, Duangjit J, Ramlee SI, Phumichai C, Oladosu Y, Datta DR, Musa I (2020). Genetic variability of eggplant germplasm evaluated under open field and glasshouse cropping conditions. Agronomy 10: 436. DOI 10.3390/agronomy10030436. [Google Scholar] [CrossRef]
Tümbilen Y, Frary A, Daunay MC, Doğanlar S (2011). Application of EST-SSRs to examine genetic diversity in eggplant and its close relatives. Turkish Journal of Biology 35: 125–136. [Google Scholar]
Vilanova NS, Hurtado RM, Cardona A, Plazas Á, Gramazio P, Herraiz GFJ, Andújar PI, Prohens TJ (2014). Genetic diversity and relationships in local varieties of eggplant from different cultivar groups as assessed by genomic SSR markers. Notulae Botanicae Horti Agrobotanici Cluj-Napoca 42: 59–65. DOI 10.15835/nbha4219414. [Google Scholar] [CrossRef]
Vilanova S, Manzur JP, Prohens J (2012). Development and characterization of genomic simple sequence repeat markers in eggplant and their application to the study of diversity and relationships in a collection of different cultivar types and origins. Molecular Breeding 30: 647–660. DOI 10.1007/s11032-011-9650-2. [Google Scholar] [CrossRef]
Yeh FC (1997). Population genetic analysis of co-dominant and dominant marker and quantitative traits. Belgian Journal of Botany 130: 129–157. [Google Scholar]
Zuki ZM, Rafii MY, Ramli A, Oladosu Y, Latif MA, Sijam K, Sarif HM (2020). Segregation analysis for bacterial leaf blight disease resistance genes in rice ‘MR219’using SSR marker. Chilean Journal of Agricultural Research 80: 227–233. DOI 10.4067/S0718-58392020000200227. [Google Scholar] [CrossRef]
 | This work is licensed under a Creative Commons Attribution 4.0 International License, which permits unrestricted use, distribution, and reproduction in any medium, provided the original work is properly cited. |