DOI:10.32604/biocell.2021.016654
| BIOCELL DOI:10.32604/biocell.2021.016654 | |
| Article |
KIFC1 overexpression promotes prostate cancer cell survival and proliferation in vitro by clustering of amplified centrosomes via interaction with Centrin 2
1The Sperm Laboratory, College of Life Sciences, Zhejiang University, Hangzhou, 310058, China
2The First Affiliated Hospital, College of Medicine, Zhejiang University, Hangzhou, 310003, China
3Department of Biotechnology and Genetic Engineering, Faculty of Biological Sciences, Islamic University, Kushtia, 7003, Bangladesh
*Address correspondence to: Fu-Qing Tan, drtfq@zju.edu.cn; Wan-Xi Yang, wxyang@zju.edu.cn
Received: 12 April 2021; Accepted: 11 May 2021
Abstract: Mitotic kinesin KIFC1 plays critical roles in mitosis by regulating the spindle length, pole formation, and known for clustering extra centrosomes in cancer cells. Centrosome clustering is associated with the survival of cancer cells, but this phenomenon remains obscure in prostate cancer (PCa). The present study demonstrated that PCa cells showed centrosome amplification and clustering during interphase and mitosis, respectively. KIFC1 is highly expressed in PCa cells and tumor tissues of prostatic adenocarcinoma (PAC) patients. Up-regulation of KIFC1 facilitated the PCa cell survival in vitro by ensuring bipolar mitosis through clustering the multiple centrosomes, suggesting centrosome clustering could be a leading cause of prostate carcinogenesis. Conversely, the silencing of KIFC1 resulted in normal centrosome number or multipolar mitosis by inhibiting the clustering of amplified centrosomes in PCa cells. Besides, knockdown of KIFC1 by RNAi in PCa cells reduced cancer cell survival, and proliferation. KIFC1 interacted with centrosome structural protein Centrin 2 in clustering of amplified centrosomes in PCa cells to ensure the bipolar mitotic spindle formation. Knockdown of Centrin 2 in PCa cells inhibited the centrosome amplification and clustering. Moreover, up-regulated KIFC1 promotes PCa cell proliferation via progression of cell cycle possibly through aberrant activation of cyclin dependent kinase 1(Cdk1). Therefore, KIFC1 can be a prognostic marker and therapeutic target of PCa for inhibiting the cancer cell proliferation.
Keywords: KIFC1; Centrosome clustering; Centrosome amplification; Prostate cancer
Prostate cancer (PCa) is a dominant male cancer in blooming countries (van Neste et al., 2012, Yang and Tian, 2019) and ranked 2nd for cancer related deaths of men in the USA (Siegel et al., 2020). Sekino et al. (2017) identified that castration resistant prostate cancer (CRPC) patients with higher expression of KIFC1 show increased resistance to docetaxel. Human KIFC1 has a C-terminal motor domain that arranges their motility towards the minus end of microtubules (Xiao et al., 2017). Elevation of KIFC1 is associated with several types of cancer progression (Pannu et al., 2015; Mittal et al., 2016). KIFC1 has an important role in the arrangement of spindles appropriately, stable pole-focusing, and the viability of cancer cells regardless of normal or amplified centrosomes (Kwon et al., 2008; Kleylein-Sohn et al., 2012). Centrosome acts as a Microtubule Organizing Centre (MTOC) which becomes a key regulator of mitosis and cell cycle progression (Rieder et al., 2001). An aberrant number of centrosomes or amplified centrosomes (>2) within a cell is associated with cancer development (Nigg, 2002; Lingle et al., 2005). Amplified centrosomes can be lethal for cancer cells with missegregation and aneuploidy via multipolar mitosis (Zasadil et al., 2014). But cancer cell evades multipolar mitosis division with clustering of the multiple centrosomes into two spindle poles, thereby ensure pseudo bipolar cell division (Gergely and Basto, 2008; Godinho et al., 2009). The involvement of KIFC1 in centrosome clustering of cancer cells has been elucidated from several studies (Pannu et al., 2015; Choe et al., 2018; Rhys et al., 2018). However, the role of KIFC1 for clustering the extra centrosomes in PCa development remains unknown. Recently, we demonstrated that inhibition of KIFC1 by AZ82 induced multipolar mitosis and apoptosis in PCa cells (Parvin et al., 2020; Parvin et al., 2021). Here, we investigated the centrosome morphology in prostatic stromal and prostate cancer (PCa) cells. PCa cells showed amplified centrosomes in interphase, and clustering of extra centrosomes during mitosis. We evaluated the involvement of KIFC1 in clustering of amplified centrosomes in PCa cells. Up-regulation of KIFC1 induced the clustering of supernumerary centrosomes in PCa cells to ensure the bipolar mitosis and increased the cancer cell survival and proliferation. It has been reported that KIFC1 expression level in the cancer cell is similar to the expression level of Centrin 2 and other proteins (AURKA, STIL, PLK4, and γ-tubulin) which are related to centrosome amplification (CA) (Mittal et al., 2016). Centrin 2 is a centrosome structural protein plays an important role in MTOC structure and function. Several studies demonstrated that Centrin 2 regulates the proper duplication and segregation of the centrosomes during cell cycle (Salisbury et al., 2002; Dahm et al., 2007; Bettencourt-Dias and Glover, 2007). To explore the interaction of KIFC1 with proteins related to CA, we examined the correlations between expression levels of KIFC1 and proteins involved in CA including Centrin 2. Up-regulated KIFC1 clustered the amplified centrosomes in PCa cells by interacting with Centrin 2.
Cancer is the result of uncontrolled cell division, cell cycle and cell proliferation that conducted via aberrant activation of some proteins which regulate normal cell cycle and cell proliferation (Malumbres and Carnero, 2003; Ren and Liang, 2019). Unusual activation of the cell cycle proteins including cyclin-dependent kinases (CDKs; Cdk1/Cdk2) promotes uncontrolled cancer cell proliferation results in cancer development. Cdk1/Cdk2 regulates the cell cycle progression by transmigration of G1 to S and G2 to M phase and also plays an important role to regulate centrosome duplication (Löffler et al., 2011; Chohan et al., 2018). Cdk1 is a catalytic subunit of M-phase promoting factor (MPF) which is indispensable for the transitions of G1-S and G2-M phases of the eukaryotic cell cycle (Jones et al., 2018). Besides, several studies identified that KIFC1 increased the proliferation of cancer cells by enhancing the cell cycle progression (Pannu et al., 2015; Liu et al., 2016; Li et al., 2018). But, whether KIFC1 regulates the cell cycle in PCa cell has not been studied extensively. We identified that higher expression of KIFC1 progress the cell cycle by enhancing the transmigration of G1-S in PCa cell possibly through aberrant activation of Cdk1.
Cell culture and tissue samples
Prostate cancer (PCa) cell line DU145 (ATCC® HTB-81™) and normal prostatic stromal cell line WPMY1 (ATCC® CRL-2854TM) were maintained in MEM, and DMEM Nutrient Mix (Gibco™) cell culture medium with the addition of 10% Fetal Bovine Serum (Gibco™). The incubator was adjusted with 37°C temperature and 5% CO2 to culture the cells. Human prostate (normal and tumor) tissues (Suppl. Tab. S1) collected from surgical resections of 13 prostatic adenocarcinoma patients (receiving treatment for prostate cancer) with permission via the signing of “Patient Consent Form”, as recorded by the First Affiliated Hospital of Zhejiang University. Tissues were dissected on ice, and some were kept in ice cold phosphate buffer saline (PBS, pH 7.3) immediately to extract total RNA and protein.
Knockdown of KIFC1 in PCa cells by RNA interfering
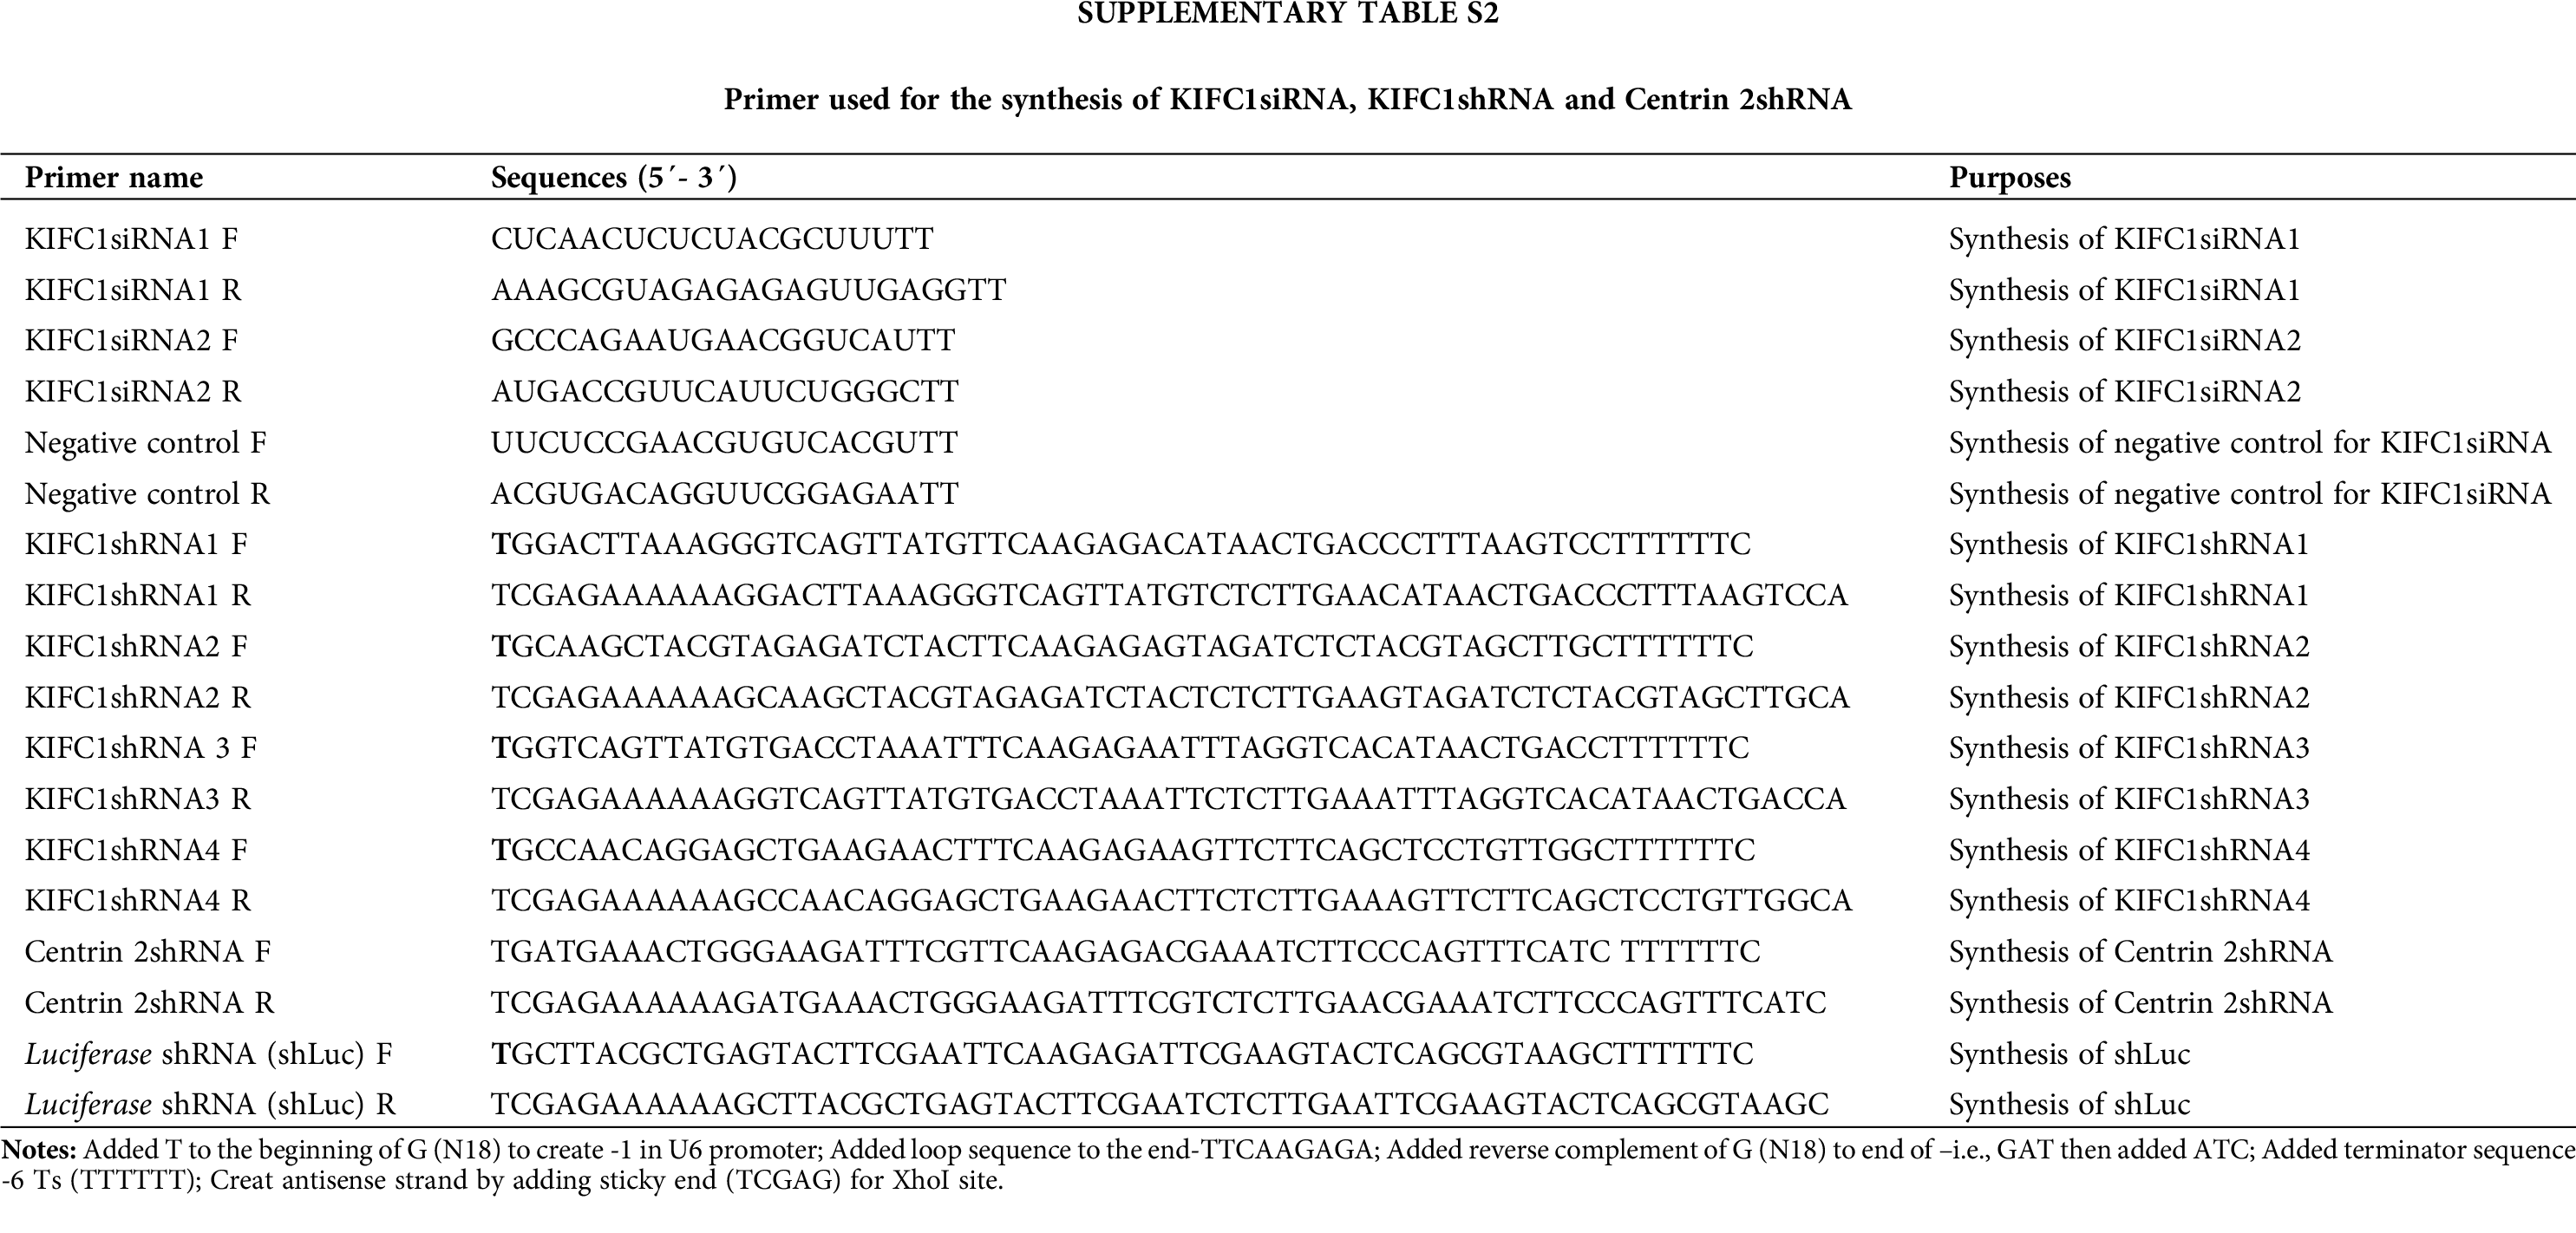
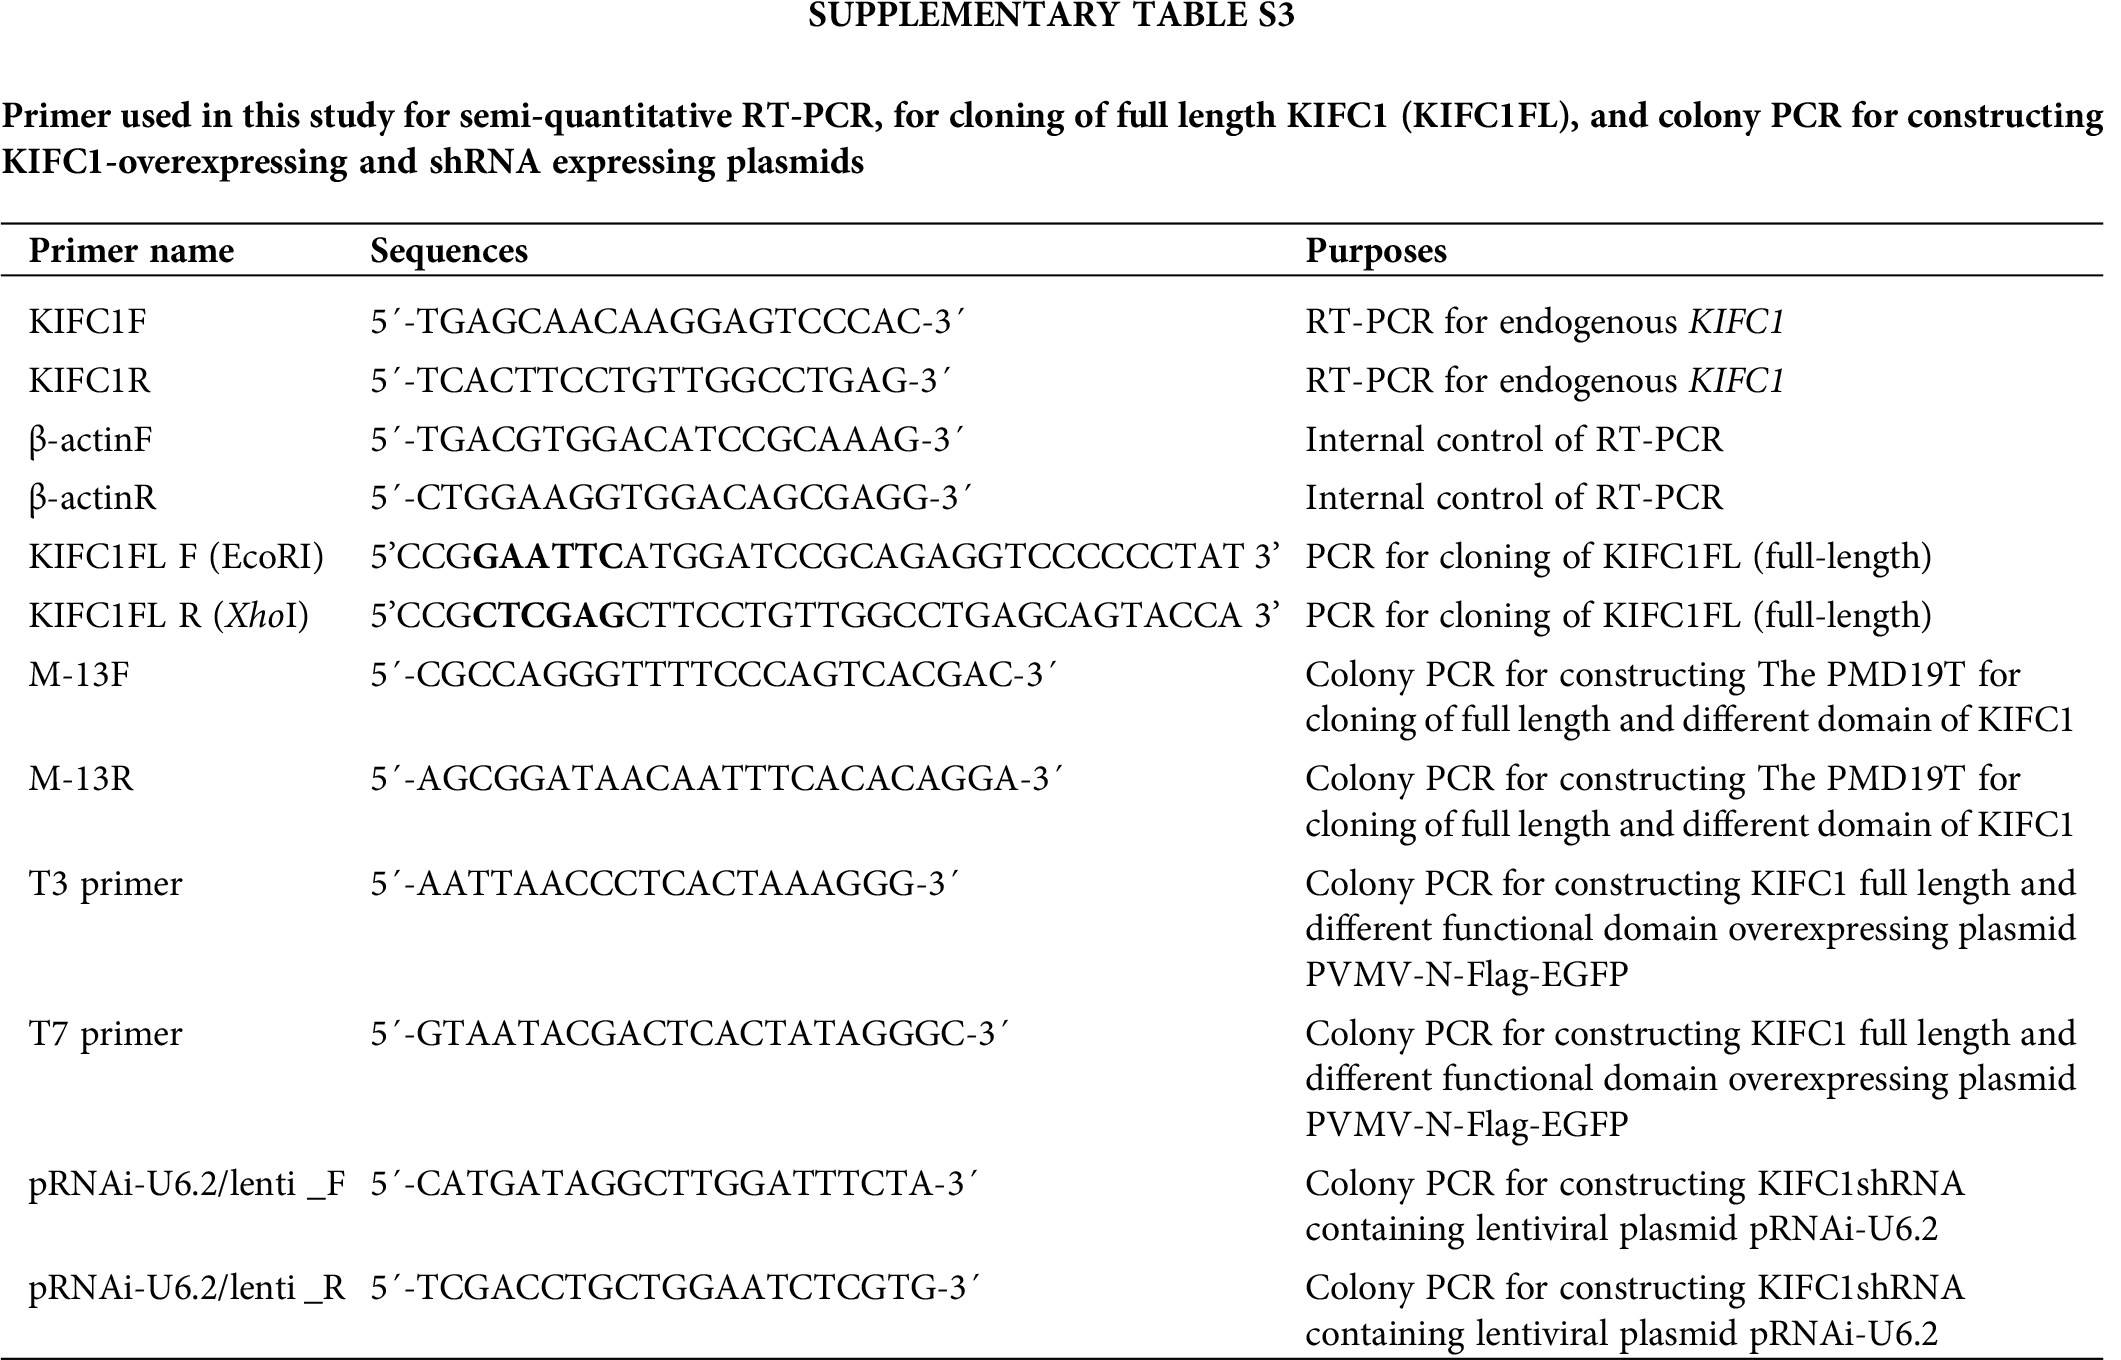
In order to knockdown of KIFC1 in PCa cells (DU145), we used KIFC1siRNA and KIFC1shRNA. We purchased and used two different sets of KIFC1siRNA and one negative control (NC) from Sangon Biotech Co. Ltd., Shanghai, China for silencing of endogenous KIFC1 (Suppl. Tab. S2). Moreover, we used following shRNA target sequences of KIFC1 and Centrin 2 for designing the oligos to synthesize the shRNA using BLOCK-iT™ RNAi Designer (ThermoFisher Scientific). These were: KIFC1shRNA-1, 5’-GGACTTAAAGGGTCAGTTATG-3’; KIFC1shRNA-2, 5’-GCAAGCTACGTAGAGATCTAC-3’; KIFC1shRNA-3, 5’-GGTCAGTTATGTGACCTAAAT-3’; KIFC1shRNA-4, 5’-GCCAACAGGAGCTGAAGAACT-3’; Centrin 2shRNA, 5’- GATGAAACTGGGAAGATTTCG-3’. For negative control, we used the sequence of Luciferase shRNA (shLuc) 5’-GCTTACGCTGAGTACTTCGAA-3’. We purchased the shRNA oligos (Suppl. Tab. S2) from IDT with 5’phosphate and PAGE purification. After synthesizing, all shRNAs were inserted into HpaI/XhoI restriction sites of pRNAi-U6.2/Lenti virus plasmids (Biomics) for cloning. We used specific primers (Tab. S3) for screening the shRNAs expressing pRNAi-U6.2 plasmids by colony PCR and sequenced for validation. We used an E.Z.N.A.® Endo-free Plasmid DNA Mini Kit II (OMEGA, D6950-01) for the preparation of endotoxin-free plasmids.
PCa cells (DU145) were transfected by KIFC1siRNA using a LipofectamineTM 3000 Kit (L3000015, Invitrogen™) following the company’s instructions. We used a Lipo 6000TM cell transfection kit (Beyotime) and followed the manufacturer’s instructions for transfecting the cells by shRNAs and shLuc expressing pRNAiU6.2 plasmids. After 48–72 h of transfection, we used the cells for further experiments.
Construction and transfection of KIFC1 overexpression plasmids into cell
For constructing the KIFC1 overexpression plasmids, we cloned full-length of KIFC1 (KIFC1FL) (NM_002263.3, 1–673 aa) with EcoRI/XhoI restriction sites from the cDNA of WPMY1 cell by PCR reaction with specific primers (Suppl. Tab. S3) designed by the software Primer Premier 5.0. We used TaKaRa Taq™ HS PCR Kit, UNG plus (R013A, TaKaRa, Dalian, China) for PCR, and the program was fixed as following: 33 cycles at 98°C for 10 s, 58°C for 5 s, 72°C for 1 min; and 4°C for α. The PCR product was purified using SanPrep Column PCR Product Purification Kit (B518141, Sangon Biotech), and inserted into a PMD19T cloning vector (Takara, Dalian, China). Ligation was carried out using T4 DNA Ligase (2011B, TaKaRa, Dalian, China), and transformation of Escherichia coli DH5α competent cells (Takara, Dalian, China) were conducted. We selected the positive colony with colony PCR (94°C for 4 min; 30 cycles of 94°C for 30 s, 62°C for 30 s, 72°C for 2 min 20 s; 72°C for 10 min; and 4°C for α) and sequenced the positive plasmids for validation. The full-length sequence of the KIFC1 was assembled and checked by a software Seqman (DNASTAR, Inc., USA). Next, we digested the PMD19T and the pCMV-N-FLAG-EGFP plasmids by EcoRI and XhoI (Takara, Dalian, China), and then ligation and transformation were carried out. T3 and T7 primers (Suppl. Tab. S3) were used for screening the KIFC1FL overexpressing pCMV-N-FLAG-EGFP plasmids by colony PCR and the sequencing was done by Biosune sequencing company.
For the preparation of endotoxin-free plasmids, we used an E.Z.N.A.® Endo-free Plasmid DNA Mini Kit II (OMEGA, D6950-01). KIFC1 overexpressing and empty (control) PCMV-N-Flag-EGFP plasmids were transfected into cells using a Lipo 6000TM (Beyotime Biotechnology) transfection kit according to the manufacturer’s instructions. The cells were incubated for the next 24–48 h and then used for the further experiments.
Total RNA was extracted from cultured cells and human tissue samples (normal and tumor tissues of prostate) using RNAiso Plus (9108, TaKaRa). To synthesize the cDNA from total RNA, reverse-transcription was performed using 5X PrimeScriptTM RT Master Mix (TaKaRa Biotechnology Co., Ltd., Dalian, China). We designed primers of β-actin and KIFC1 via NCBI Primers BLAST (Suppl. Tab. S3). Semi-quantitative RT-PCR was performed by using 2 × Flash HS PCR MasterMix (CWBIO, CW3007S) and by fixing the program as 98°C for 5 s; 35 cycles of 55°C for 10 s; 72° for 15 s; 4°C for α. We detected the intensity of band on 1.5% agarose gel through electrophoresis. The mRNA intensity was quantified via Image J software and the relative mRNA level was measured by normalizing to β-actin mRNA level.
Total protein was extracted from cultured cells and homogenized tissues (crushed by IKA® T10 basic) using RIPA cell lysis buffer (P0013B, Beyotime) contained 1% PMSF (CW2200S, CWBIO). Protein samples were denatured by heating at 100°C after addition of 5X SDS loading buffer. For western blot analysis, 30 μg protein of whole-cell lysate were separated on 10% or 8% SDS-Polyacrylamide gel by SDS-PAGE (sodium dodecyl sulfate-polyacrylamide gel electrophoresis) and then transferred into a polyvinylidene fluoride (PVDF) membrane (IPVH00010, Millipore). Membranes were incubated with primary antibodies for 14 h at 4°C. After washing the membranes using PBST, they were incubated with HRP conjugated secondary antibodies for one hour. The antibodies were diluted with 5% milk dissolved in 0.2% PBST. We visualized the target proteins on the blots using enhanced chemiluminescent (ECL, P0018FFT, Beyotime). We used the following primary antibodies: anti-KIFC1 rabbit monoclonal (1:10,000, ab172620, Abcam), anti-KIFC1 rabbit polyclonal (1:1000, NB100-40844, Novus Biologicals), anti-ACTB rabbit polyclonal (1:2000, D110001, BBI) anti-Cdk1 mouse monoclonal (1:200, A0030, ABclonal), anti-AURKA rabbit polyclonal (1:500, A2276, ABclonal), anti-STIL rabbit polyclonal (1:500, A10350, ABclonal), anti-PLK4 rabbit polyclonal (1:500, A9863, ABclonal), anti-Centrin2 rabbit polyclonal (1:500, A5397, ABclonal), anti-γ-tubulin mouse monoclonal (1:500, SC-17787, Santacruz biotechnology). HRP-conjugated goat anti-rabbit (1:1000 to 1:10,000, A02028, Beyotime) and HRP-conjugated goat-anti-mouse (1: 6,000, D110087, BBI) antibodies were used as secondary antibodies.
Co-Immunoprecipitation (Co-IP) was performed using the pierce Co-immunoprecipitation kit (26149, Thermoscientific) following the company’s instructions. We extracted the whole cell protein by lysis of cells using ice-cold IP Lysis buffer (2 × 50 mL, 0.025 M Tris, 0.15 M NaCl, 0.001 M EDTA, 1% NP-40, 5% glycerol). The cell lysate was pre-cleared using control agarose resin. The whole-cell extract (WCE) protein (1 mg) was then subjected to immunoprecipitation with anti-Centrin 2 (10 μL) antibody or random IgG (control) followed by elution (affinity purification). Beyond elution, samples were prepared for SDS-PAGE analysis by adding 1 × Sample buffer and the protein was then separated by heating at 100°C for 6 min. Finally, we analyzed the results by western blotting.
We prepared the cell slides for immunofluorescence by placing the sterilized round cover glasses (12 mm diameter, FisherbrandTM) into 24-well cell cluster plate, and then prepared for cell culture by treating with gelatin (A609764, Sangon Biotech) at 37°C for 40 min. After reaching the cell confluence of 80%, cell slides were washed using cooled PBS (pH 7.3), and cells were fixed by adding 4% paraformaldehyde (PFA) dissolved in PBS for 25 min. Permeabilization of the cells was done via addition of 0.25% TritonX-100 dissolved in PBS for 15 min.
For preparing tissue slides, human tissues (from normal prostate and prostate tumor) were made into 7 mm3 small pieces. Fixation was conducted by keeping the tissue pieces in 4% paraformaldehyde (dissolved in PBS, pH 7.3), followed by dehydration with 20% sucrose solution for 16 h. The tissue samples were embedded into Optimal Cutting Temperature compound (OCT) and preserved at −40°C. The tissues were cryosectioned by microtome into 10 μm-sections and mounted on Poly-L-Lysine coated Polysine™ Microscope Adhesion Slides (ThermoFisher Scientific). The slides were stored in a −40°C refrigerator until use.
Blocking of slides (cell and tissue) was carried out using PBST (1% BSA and 0.05% Tween-20 dissolved in PBS) for 1 h at room temperature, and incubated with primary antibodies for overnight at 4°C. On the following day, the cell and tissue slides were washed with cold 1 × PBS and 1 × PBST respectively, then incubated the in secondary antibodies for 2 h at room temperature. The antibodies were diluted with 1% BSA-PBST. After washing the secondary antibody, the slides were stained with DAPI (C1005, Beyotime) for 7 min to visualize the nucleus. Anti-fluorescence quenching solution (P0126, Beyotime) were used to mount the slides and watched them on a confocal laser-scanning microscope (Carl Zeiss, CLSM 710, Germany).
For immunostaining, we used anti-KIFC1 rabbit polyclonal (1:300, NB100-40844, Novas Biologicals), anti-γ-tubulin rabbit monoclonal (1:500, ab179503, Abcam), anti-α-tubulin mouse monoclonal (1:500, AT819, Beyotime), Anti-Centrin 2 mouse monoclonal (1:300, 698601, BioLegend) antibodies as the primary antibody. Alexa Fluor 488-conjugated anti-rabbit antibody (1:200, A0423), Alexa Fluor 555-conjugated anti-Rabbit antibody (1:300, A0453, Beyotime), Alexa Fluor 555-conjugated anti-mouse antibody (1:300, A0460, Beyotime), Alexa Fluor 488-conjugated anti-mouse antibody (1:200, A0423, Beyotime), Anti-α-tubulin FITC tracker (1:250, F2168, Sigma-Aldrich) were used as the secondary antibodies. We used DAPI (Beyotime) to visualize the nucleus.
Cells were cultured at a density of 1000 cells/well into 6-well plates. After 24 h, KIFC1-overexpressing, KIFC1shRNAs expressing, and control plasmids were transfected into cells. During incubation for 10 days, the culture media was changed in 3 days interval. After 10 days, we discarded culture media, washed the cells with PBS, and fixed the colonies with 4% paraformaldehyde for 20 min. Cell colonies were stained using 1 mg/mL crystal violet (dissolved in 1% ethanol) and kept at room temperature for 25 min, images were taken after washing the culture plate. The cell colonies were quantified by dissolving the colonies (stained by crystal violet) in 10% acetic acid and added 25–100 μL into each well of 96-well plates. For each sample, 3 replicates were given. The OD measured at 600 nm wavelength with a synergy™H1 Multi-Mode Reader spectrophotometer (Thermo Scientific).
Cell death or proliferation assay
Trypsinized cells (2 × 10³) were cultured into each well of 96-well cell culture plates. WPMY1 cells were transfected with KIFC1 overexpressing and empty (control) pCMV-N-FLAG-EGFP plasmids. DU145 cells were transfected with KIFC1shRNA and shLuc (control) expressing pRNAi-U6.2 plasmids using LipofectamineTM 3000 Kit (L3000015, Invitrogen™). We cultured the cells (5 replicates for each group) for subsequent 48–72 h. We estimated the rate of cell proliferation on 24, 48, 72 and 96 h by measuring the OD value at 450 nm wavelength using synergy™H1 Multi-Mode Reader spectrophotometry (Thermo Scientific). Before measuring the OD value, 10 μL of cell counting kit-8 (CCK-8, C0037, Beyotime) was added directly into culture medium and was incubated for 30 min at 37°C.
The cells were transfected with KIFC1shRNAs expressing, KIFC1-overexpressing and control plasmids, and cultured them for the following 48 h. Trypsinized cells were fixed in cooled 70% ethanol for 16 h at 4°C after washing with precooled PBS. We washed the cells using cooled PBS, stained with 0.5 mL propidium iodide (PI)/RNase (C1052, Beyotime) solution, and then kept for incubation at 37°C for 35 min in the dark. The cell cycle was analyzed by FACS Calibur flow cytometry (CytoFLEX, B49007AD, Beckman Coulter Inc., USA) through screening the single cells. We analyzed the result using the CytExpert software.
Processing and analysis of images
All confocal images were processed using ZEN 2009 software (Zeiss). We quantified the mRNA and protein intensity by Image J software (Image J, NIH). We created the figures using Adobe Illustrator CC 2015 software following the standard instructions.
We collected data from at least three independent experiments. We analyzed the result by paired t-test to detect the significance and constructed graphs by GraphPad Prism 7.0 software. The results are shown in the graphs as mean ± SEM. For statistically significance P-values ≤ 0.05 vs. control were considered.
KIFC1 is highly expressed in prostate cancer (PCa) cells and tumor tissues of prostate cancer patients
To investigate the role of KIFC1 in PCa development we detected mRNA and the protein level of KIFC1 in prostatic stromal (WPMY1) and prostate cancer cell line (DU145) by performing semi-quantitative RT-PCR and western blotting. We observed that the mRNA and protein expression of KIFC1 were higher (4 times greater) in PCa cells compared to the prostatic stromal cell (Figs. 1a–1b).
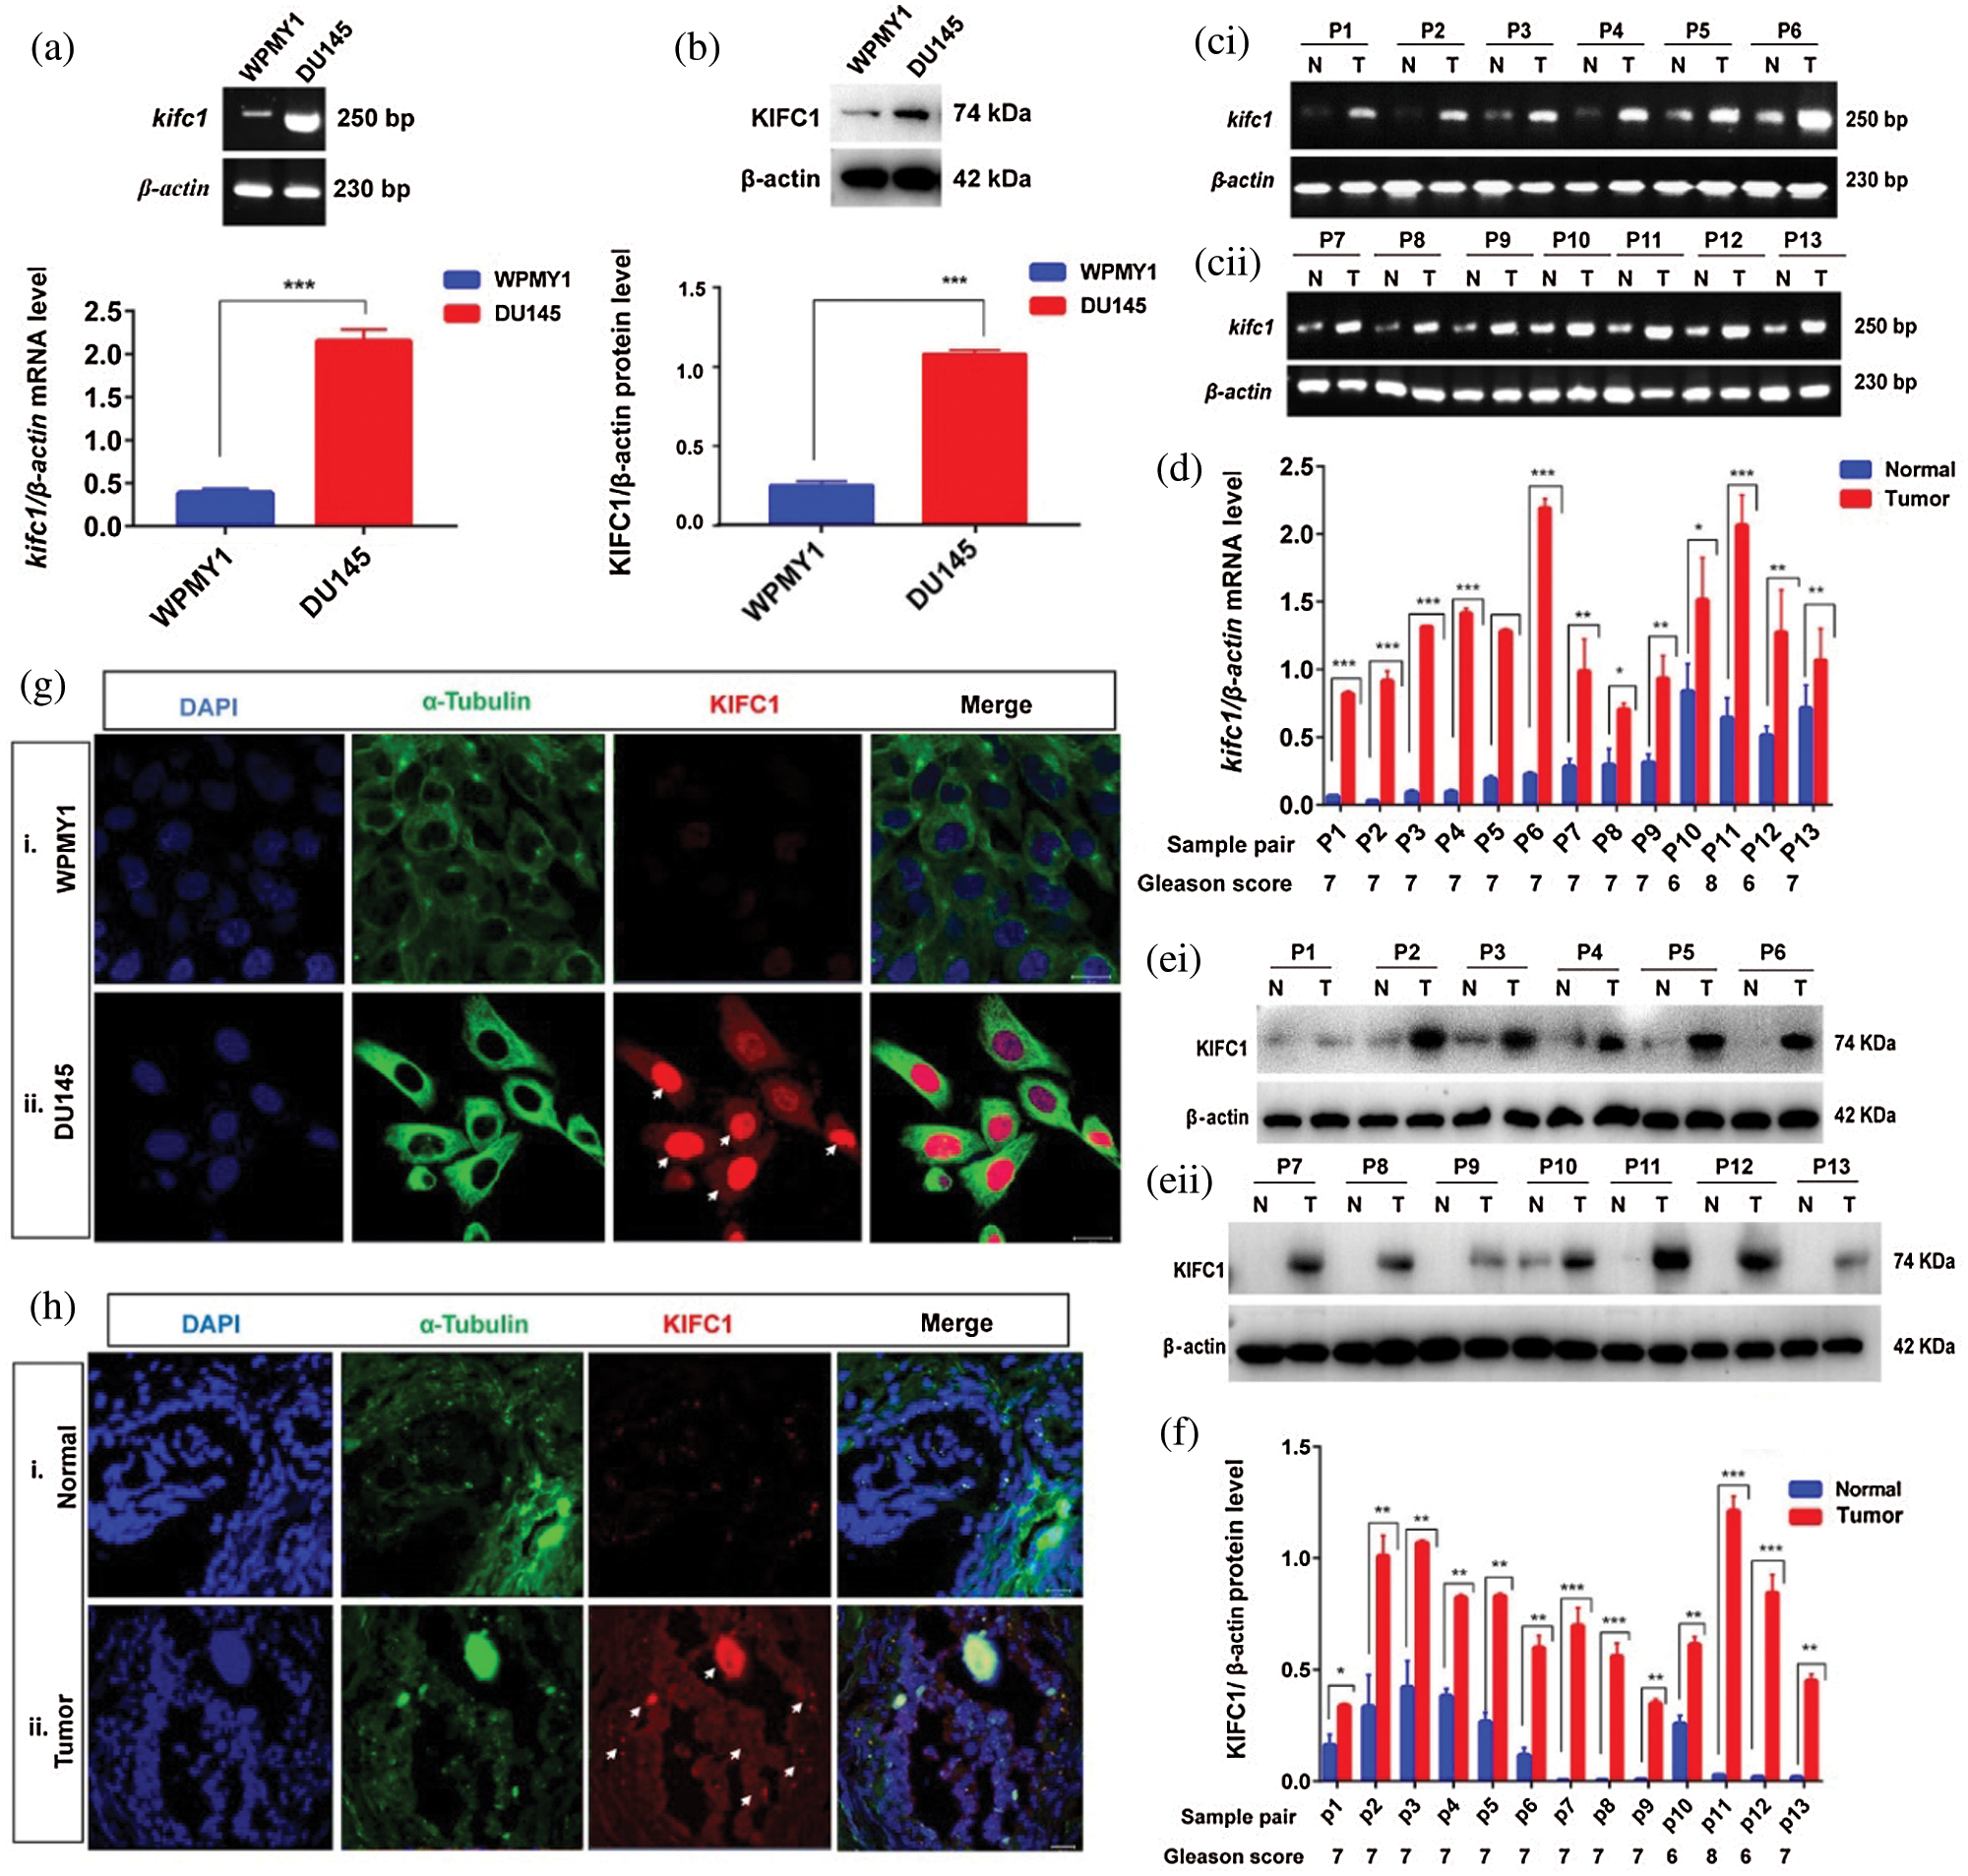
Figure 1: KIFC1 is highly expressed in prostate cancer (PCa) cells and prostate tumor tissues. (a–b) KIFC1mRNA (a) and KIFC1protein (b) level in prostatic stromal (WPMY1) and PCa (DU145) cells were analyzed by semi-quantitative RT-PCR and western blotting. (c–f) KIFC1mRNA (c–d) and KIFC1protein (e–f) in tissues of prostate tumors and their matched normal prostate tissues. Quantified the bands by Image J software and the relative mRNA and protein level were detected by normalizing to β-actin mRNA and β-actin protein levels. Error bars in graph show SEM from three repeated experiments. *P < 0.05, **P < 0.01, ***P < 0.001 obtained by paired t-test. (g) The location and accumulation of KIFC1 in WPMY1 and DU145 cells was detected by immunofluorescence. Scale bars: 20 μm. Cells were stained with DAPI, anti-KIFC1, FITC α-tubulin tracker to observe nucleus (blue), α-tubulin (green), and KIFC1 (red) on a confocal microscope. (h) Location and accumulation of KIFC1 in normal prostate and prostate tumor tissue samples. Scale bars: 20 μm. Arrows indicate the strong signals of KIFC1. DAPI, anti-KIFC1, and a FITC α-tubulin tracker were used for staining the tissue slides to observe the nucleus (blue), α-tubulin (green) and KIFC1 (red) on a confocal microscope.
Furthermore, we validated this result in vivo by analyzing the mRNA and protein expression of KIFC1 in the prostate tumor (n = 13) and their adjacent normal prostate tissues (n = 13) of prostatic adenocarcinoma (PAC) patients by semi-quantitative RT-PCR and immunoblotting. We found significantly higher (P < 0.05, P < 0.01, P < 0.001) levels of KIFC1mRNA and KIFC1protein in tumor tissue samples compared to adjacent normal tissue samples (Figs. 1c–1f), and the increased expression level was showing a high Gleason score (≥6), PSA level and advance metastasis stage (Figs. 1c–1f, Suppl. Tab. S1). On average mRNA and protein expression of KIFC1 in the prostate tumor was 4.5 times more than normal prostate tissue. Next, we explored the location and accumulation of KIFC1 in WPMY1 and DU145 cells by immunofluorescence. We noticed that KIFC1 was mostly localized in nucleus than cytoplasm and observed strong signals in DU145 cells compared to WPMY1 cell (Fig. 1g). We also found the consistent result of a strong KIFC1 signal in prostate tumors compared to adjacent normal prostate tissues by immunofluorescence (Fig. 1h). These results together mean that KIFC1 higher expression is related to the development of advanced or aggressive PCa and largely accumulated on the PCa cell nucleus.
Prostate cancer (PCa) cells show amplified and clustered centrosome
Centrosome clustering has become an important factor in the development of various cancers (Gergely and Basto, 2008). As KIFC1 is associated with the clustering of extra centrosomes (Mittal et al., 2016; Godinho et al., 2009) aiding the survival of the cancer cell, we investigated the centrosome morphology in prostatic stromal (WPMY1) and PCa (DU145) cells on a confocal microscope by immunostaining with γ-tubulin. From analyzing the confocal images, we noticed that the centrosome number and position were normal in WPMY1 cells compared to DU145 cells during interphase and mitosis cell division (Figs. 2bi–ii and 2c). Conversely, DU145 cells (Fig. 2di–iii) showed centrosome aberrations including centrosome amplification during interphase, and clustering of extra centrosomes in mitosis. About 62% of PCa cells (DU145) exhibited amplified centrosomes during interphase (Fig. 2di), and 60% of PCa cells (Figs. 2dii–iii, 2e, and 2f) had clustered centrosomes during mitosis.
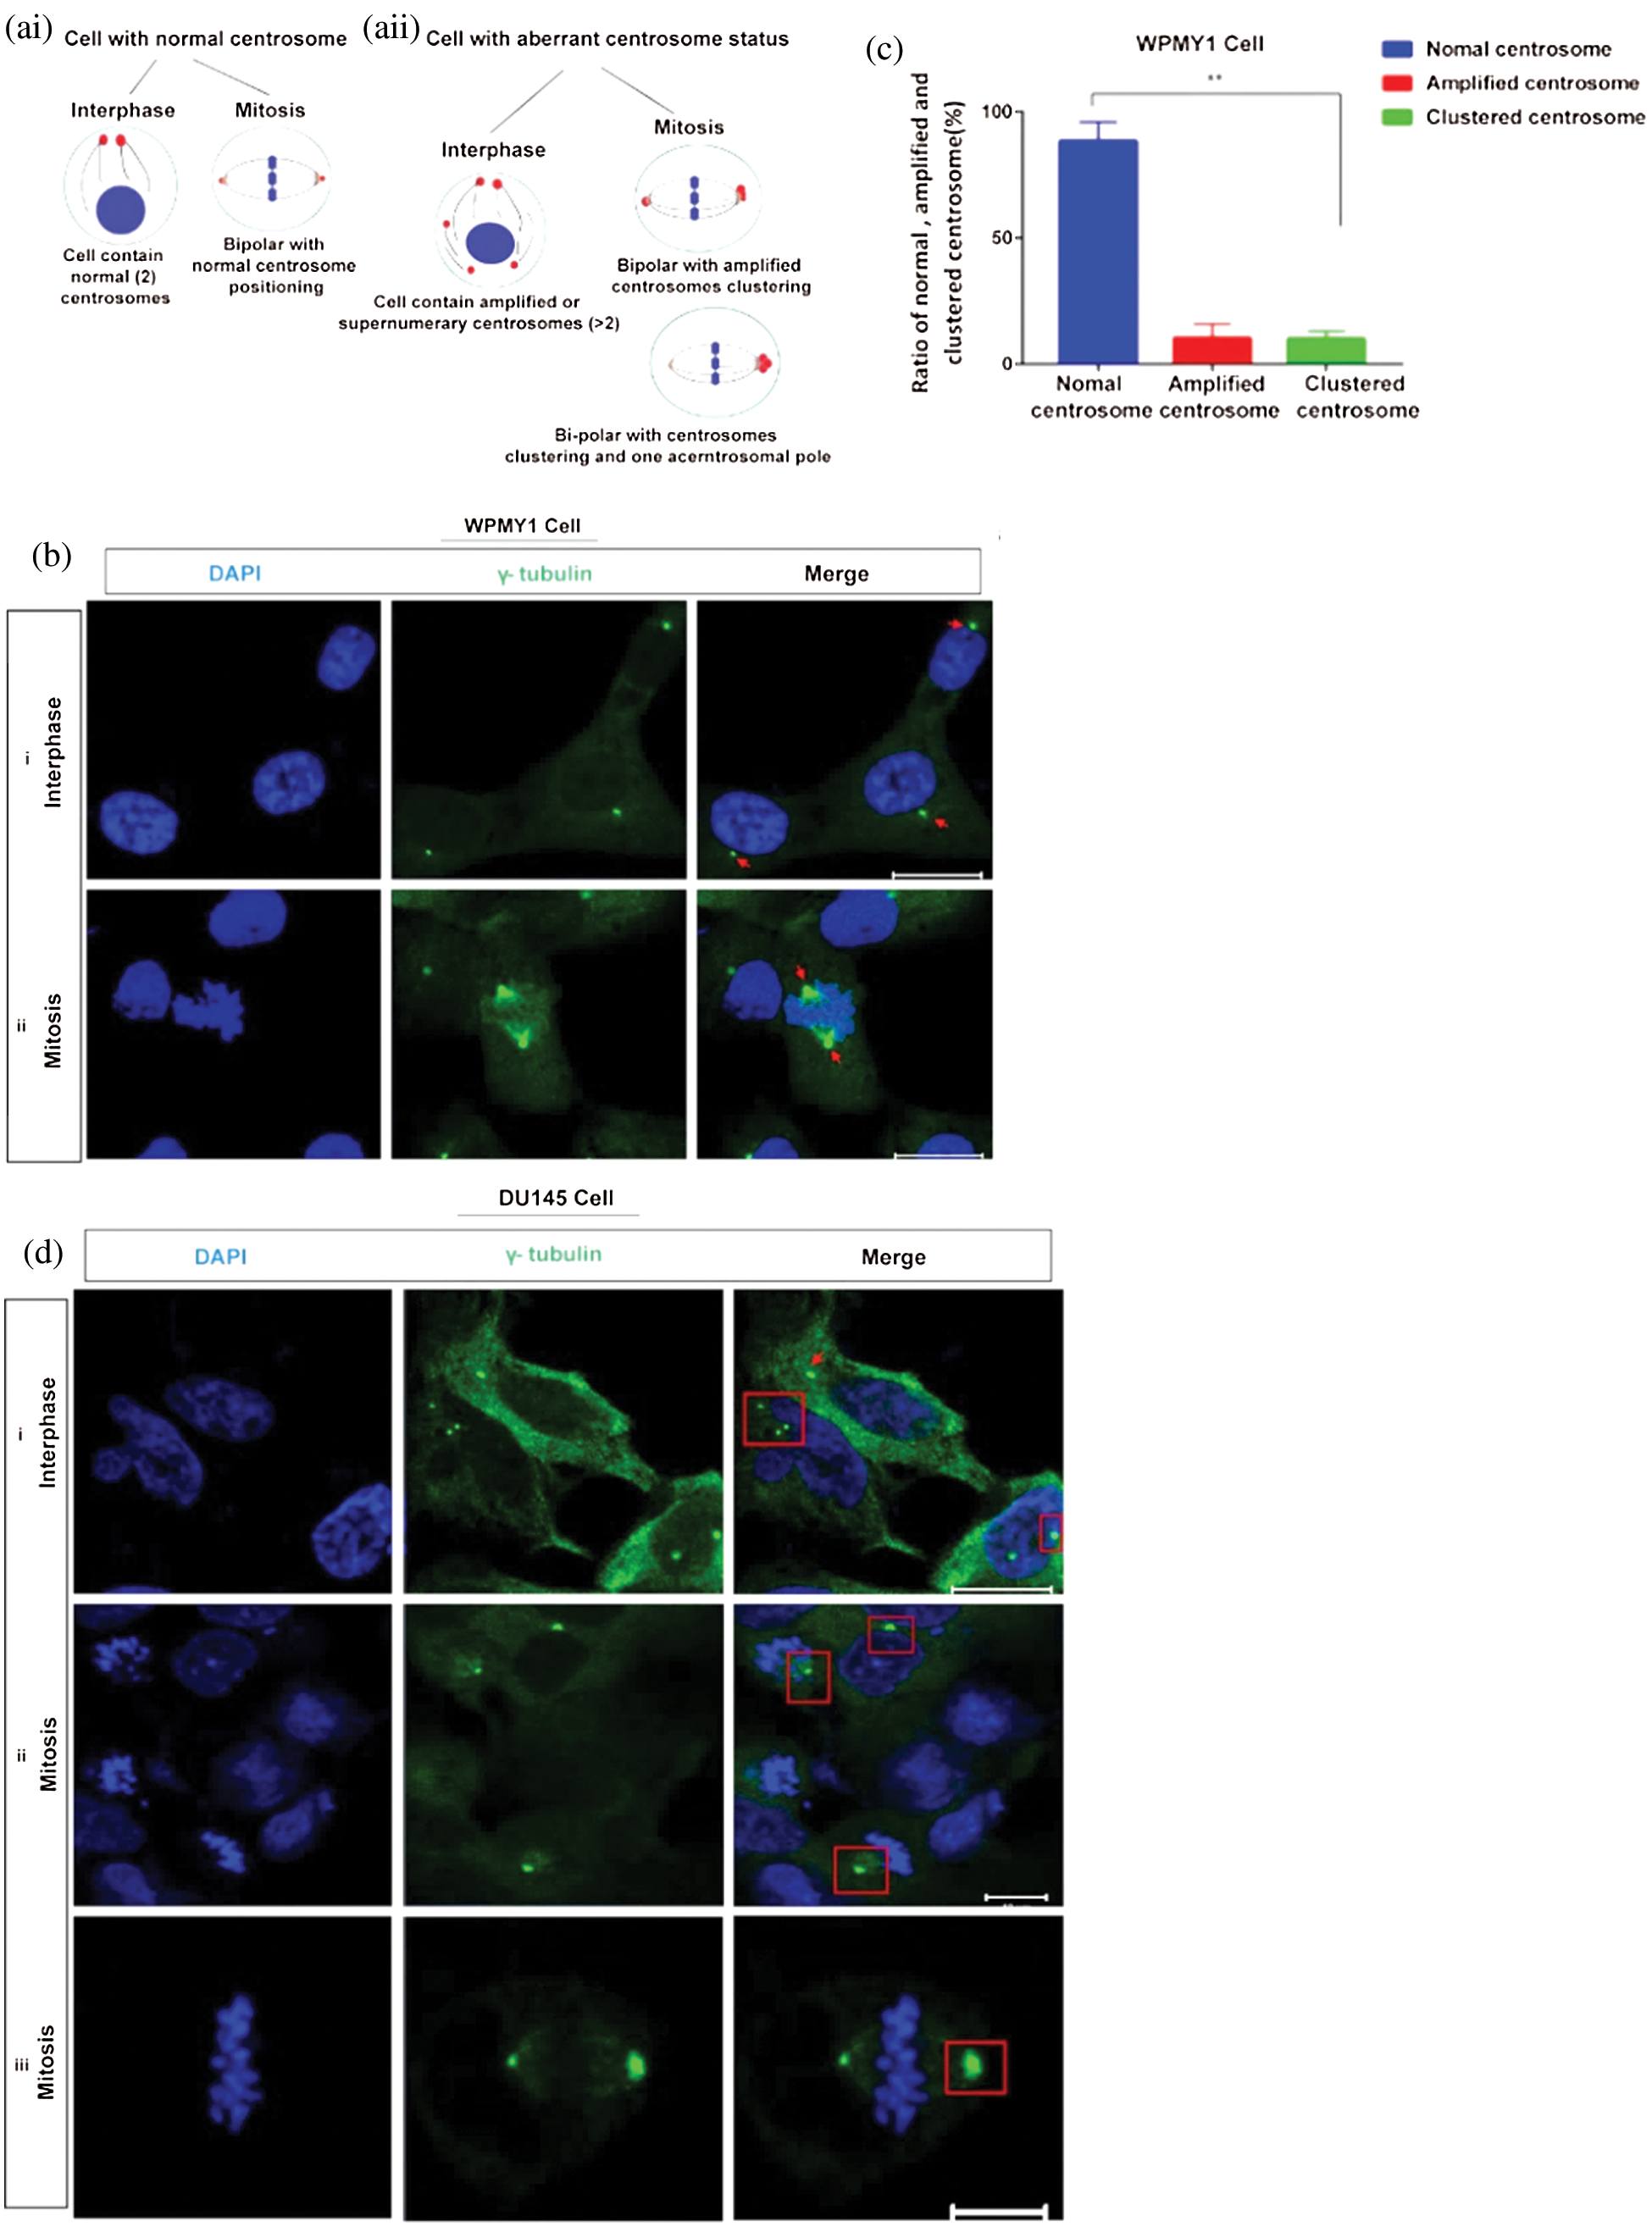
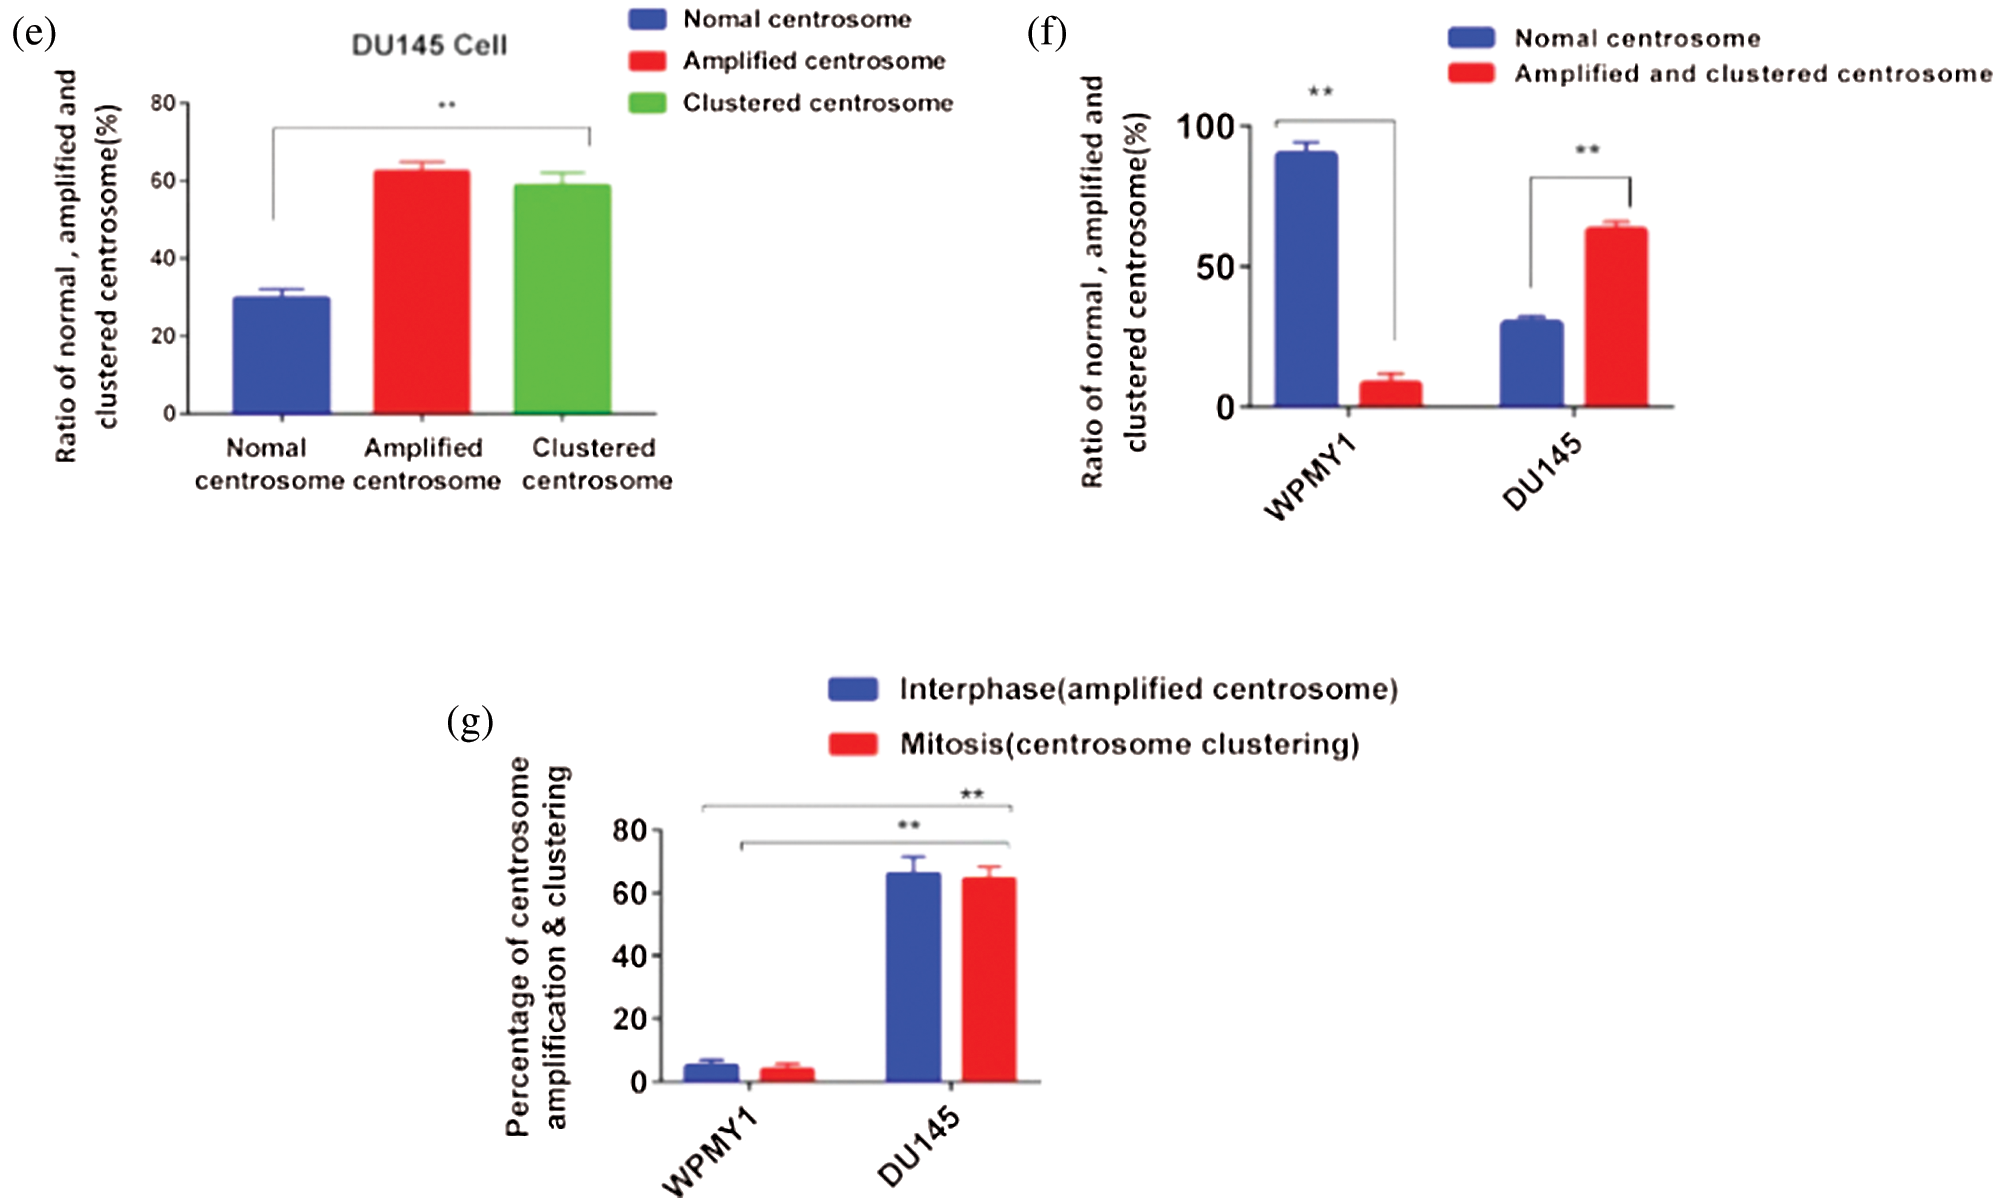
Figure 2: Study of centrosome morphology in prostatic stromal and prostate cancer cell lines. (a) A schematic model displaying the cells with normal (ai), and aberrant (aii) centrosome status. (bi–ii) Centrosome morphology was analyzed in the prostatic stromal cell (WPMY1) during interphase (bi), and mitosis (bii) by immunofluorescence. Scale bars: 10 μm. (c) Ratio of normal, amplified, and clustered centrosome in WPMY1 cells. 100 cells were counted for each case. (di–iii) Confocal images show the centrosome morphology in DU145 cells during interphase (di) and mitosis (dii–iii). Scale bars: 10 μm. (e) Ratio of normal, amplified, and clustered centrosome in DU145 cells. 100 cells were counted for each case. Cells were stained with DAPI and anti-γ-tubulin antibody to observe nucleus (blue) and centrosomes (green) on a confocal microscope. (f) The ratio of normal, amplified, and clustered centrosomes in WPMY1 and DU145 cell lines. (g) Percentage of centrosome amplification and clustering during interphase and mitosis of WPMY1 and DU145 cell lines. 100 cells were counted for each case. Error bars in graphs show SEM from three repeated experiments. **P < 0.01 obtained by paired t-test.
Besides, PCa cells (DU145) showed significantly higher (about 62% cell, P < 0.01) amplified centrosomes and clustering the extra centrosomes during interphase and mitosis, respectively (Figs. 2f–2g). Therefore, these results indicate that PCa cells show aberrant centrosome such as amplified, and clustered centrosomes possibly due to up-regulation of KIFC1.
Up-regulation of KIFC1 enhances PCa cell survival and proliferation via clustering the amplified centrosomes
Since PCa cell (DU145) had elevated KIFC1 expression and showed centrosome amplification and clustering, so we examined the loss of KIFC1 function in PCa (DU145) cells via knockdown of endogenous KIFC1 by KIFC1siRNA and KIFC1shRNA. The semi-quantitative RT-PCR (Suppl. Figs. S1a–S1b), western blotting (Figs. 3a–3b), and confocal images (Suppl. Figs. S2a–S2d) showed that KIFC1siRNA resulted in a significantly decreased the expression of KIFC1 mRNA (P < 0.01, Suppl. Figs. S1a–S1b), and KIFC1 protein (P < 0.001, Figs. 3a–3b).
Figure 3: Study of the centrosome morphology in control and KIFC1-silenced (by KIFC1siRNA) prostate cancer cell during mitosis. (a–b) Western blotting to measure KIFC1siRNA mediated knockdown efficiency of endogenous KIFC1 in DU145 cells. Normalization of the result was to β-actin, and we quantified the protein levels by using Image J. (ci–iv) Confocal images show centrosome morphology during mitosis in KIFC1siRNA (ciii, iv) and control (ci–ii) groups of DU145 cells. Scale bars: 10 μm. Cells were stained with DAPI, α-tubulin, and anti-γ-tubulin to observe the nucleus (blue), mitotic spindles (green), and centrosome (red). Arrows indicate the multipolar spindle formation and rectangles indicate the clustering of amplified centrosomes during mitosis. Cells were transfected by KIFC1siRNA and NC of KIFC1siRNA using Lipofectamine® 2000. (d) The percentage of mitotic cells with bipolar with normal centrosome, or bipolar with clustering the amplified centrosomes, or multipolar with de-clustering the amplified centrosomes in control and KIFC1siRNA groups of DU145 cells. 100 cells were counted for each case. Error bars in graphs show SEM from three repeated experiments. ns, non-significant, **P < 0.01, ***P < 0.001 obtained by paired t-test.
We examined the morphology of centrosome and arrangement of mitotic spindle in the KIFC1siRNA and control groups of PCa cells (DU145) during mitosis by immunostaining with α-tubulin and γ-tubulin. We noticed that about 59% of KIFC1-silenced DU145 (by KIFC1siRNA) cell induced the multi-polar (tri-polar or tetra-polar) spindle formation during mitosis by inhibiting the clustering of amplified centrosomes (Figs. 3ciii–iv and 3d). Moreover, knockdown of KIFC1 by KIFC1siRNA causes multipolar mitosis with fragmentation of mitotic spindle (Fig. 3ciii). Conversely, the control groups of DU145 cells had bipolar spindle during mitosis (62% cell) by clustering the amplified centrosomes in two poles or one pole (Figs. 3ci–ii and 3d). So, knockdown of endogenous KIFC1 by KIFC1siRNA in PCa cells causes multi-polar spindle formation during mitosis by inhibiting the clustering of the multiple centrosomes. Furthermore, we stably silenced the KIFC1 in PCa cells by transfecting with KIFC1shRNA and shLuc (control) expressing pRNAiU6.2 plasmids. Semi-quantitative RT-PCR and western blotting results showed the significantly decreased KIFC1 mRNA (P < 0.01, Suppl. Figs. S1c–S1d) and KIFC1 protein (P < 0.01, Figs. 4a–4b) levels in PCa cells.
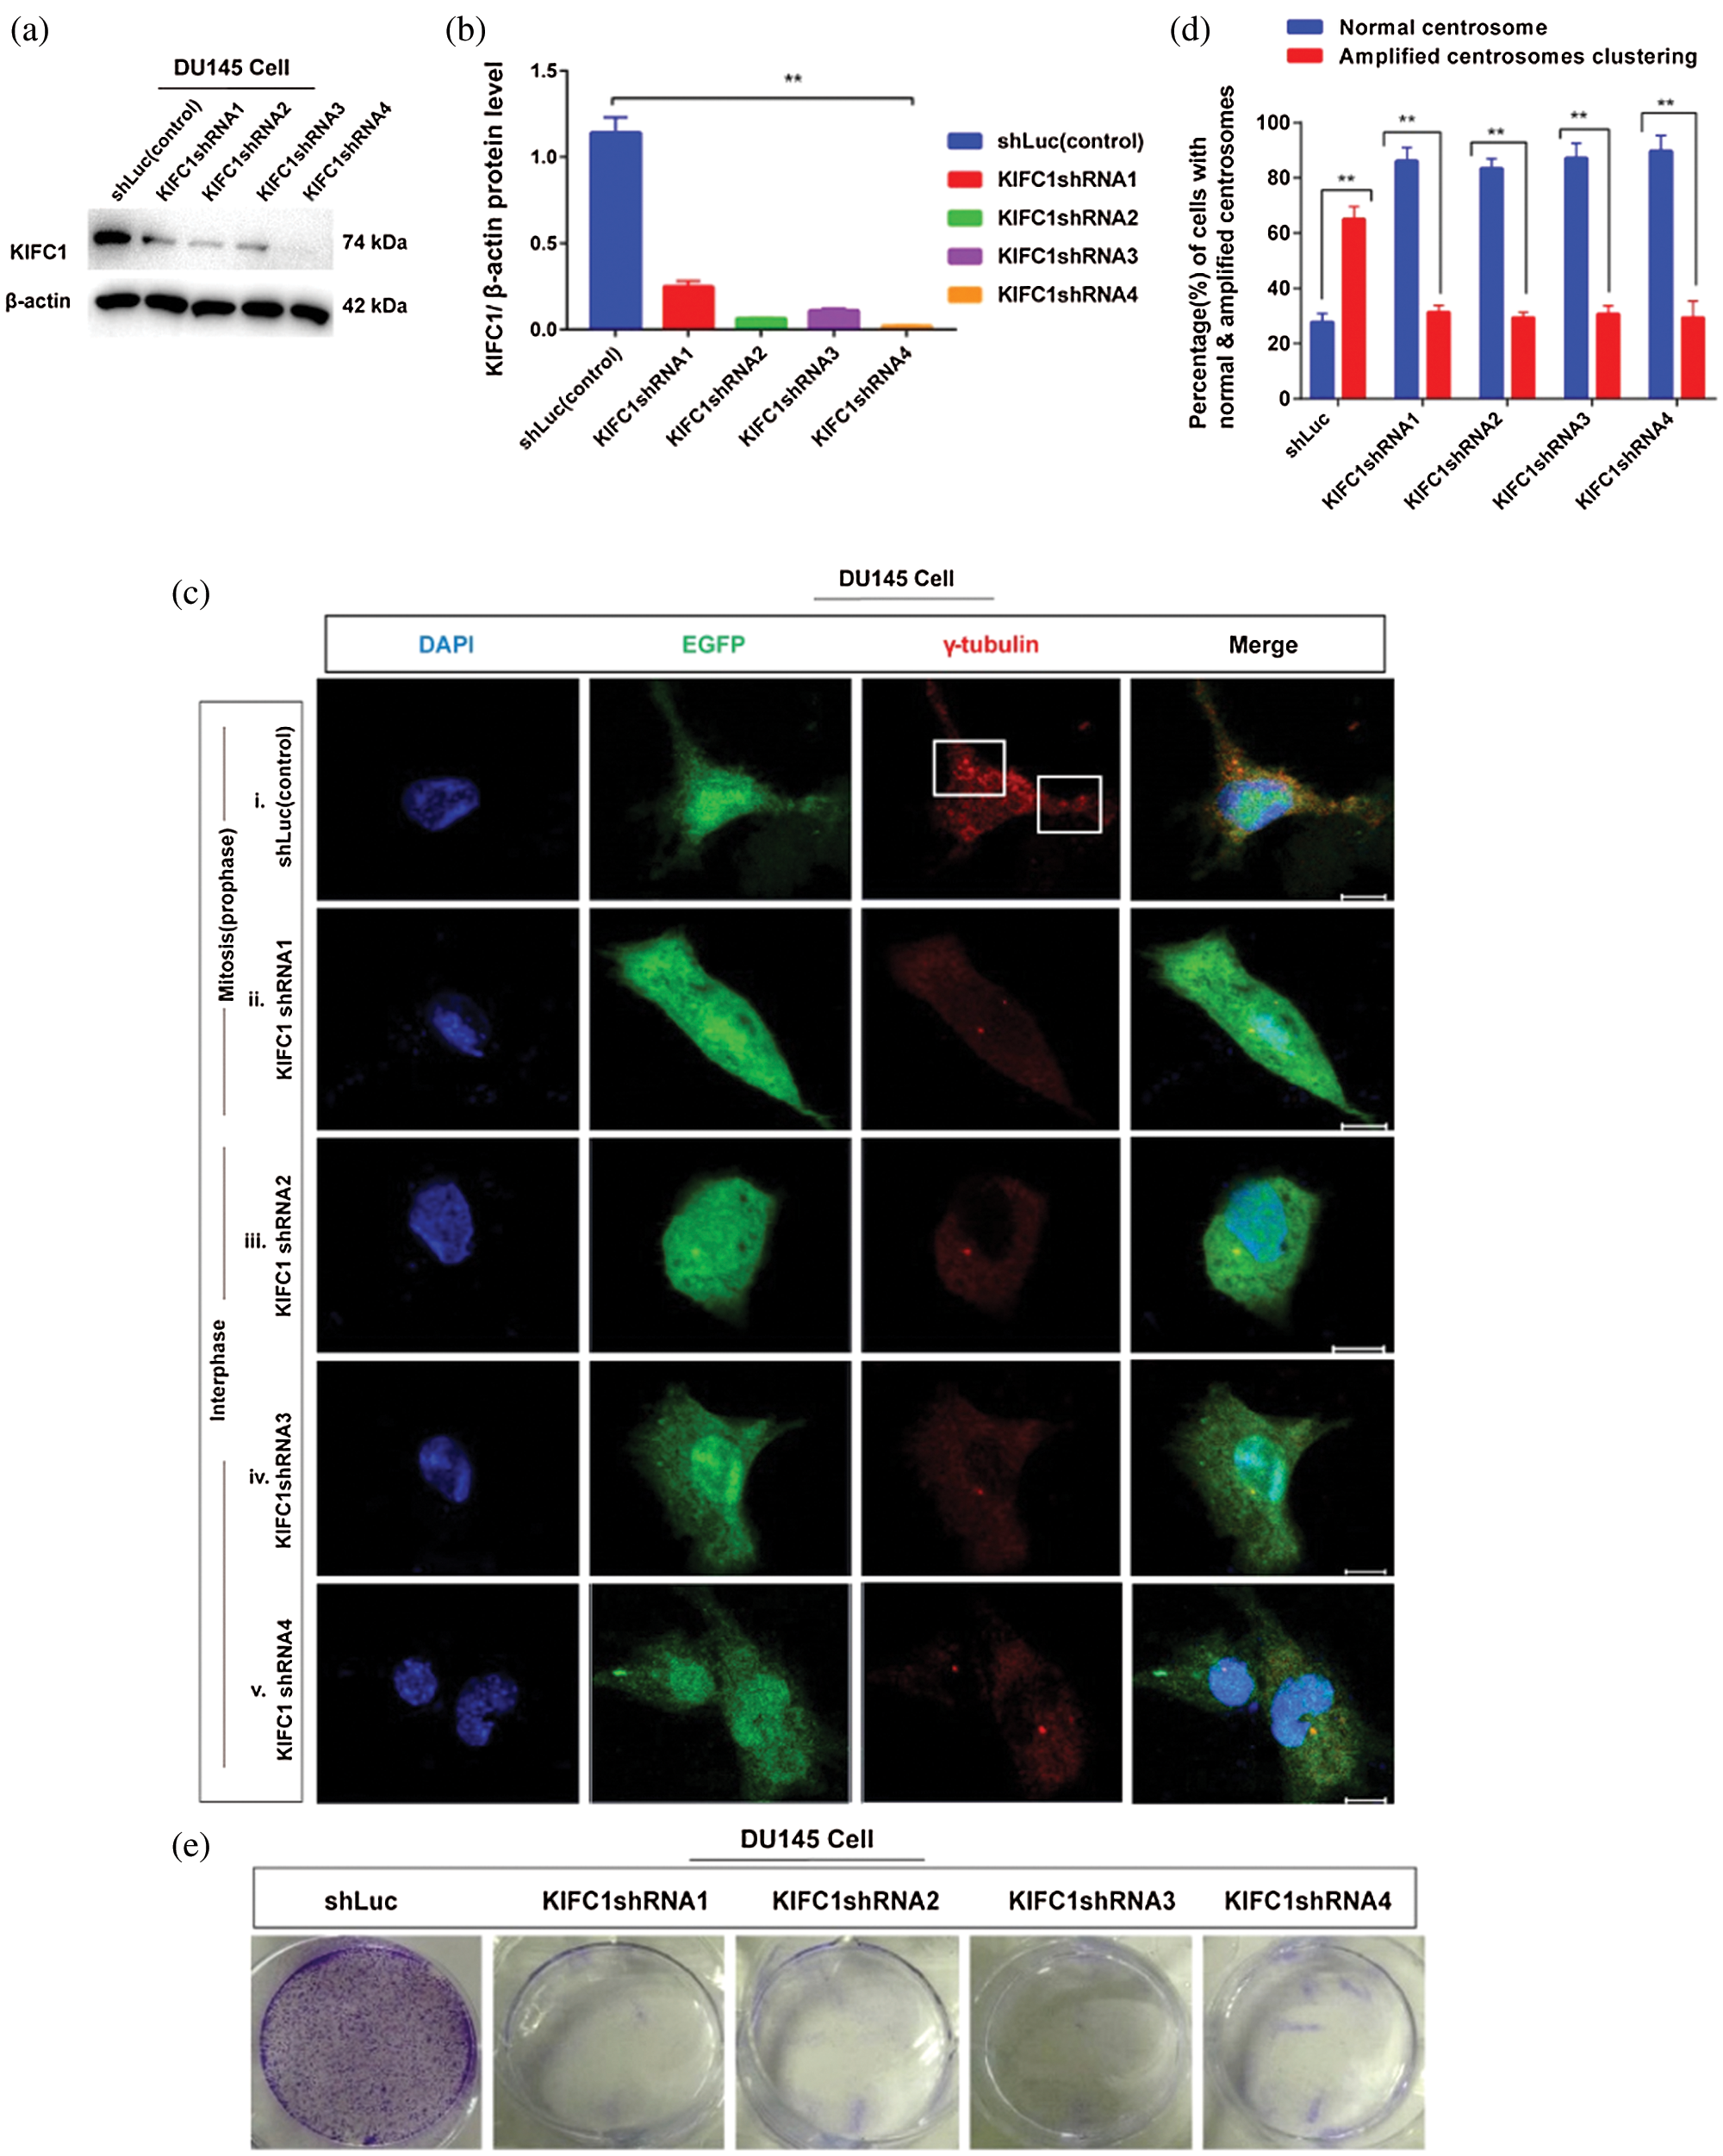
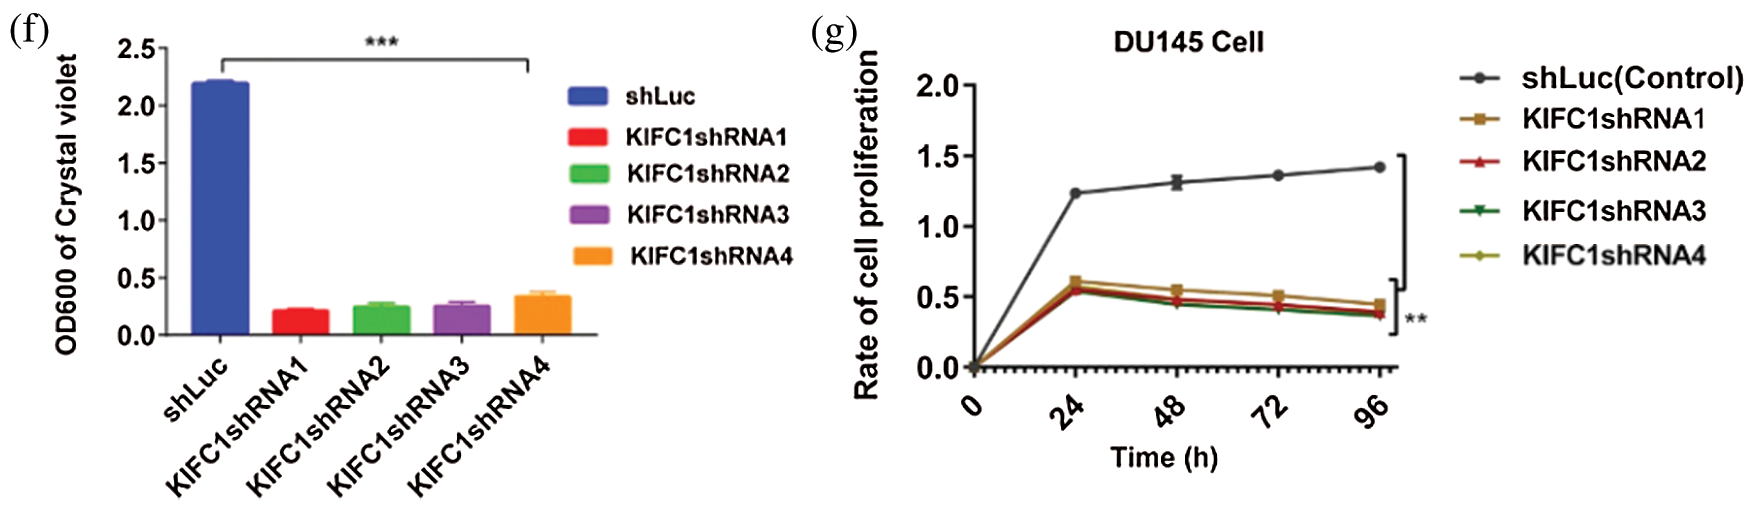
Figure 4: Study of the effect of the loss of KIFC1 (by KIFC1shRNA) on survival, proliferation, and centrosome morphology of prostate cancer cell. (a–b) Analysis of the efficiency of KIFC1shRNAs mediated endogenous KIFC1 silencing in prostate cancer cell (DU145) by western blotting. (ci–v) Confocal images show the centrosome status during interphase and mitosis in control and KIFC1shRNAs groups of DU145 cells. Scale bars: 10 μm. Cells were stained by DAPI for nucleus and anti-γ-tubulin for centrosome (red). The rectangle indicates centrosome amplification and clustering. (d) The percentage of cells with normal centrosome, amplified or clustered centrosomes in control and KIFC1shRNA groups of DU145 cells. 100 cells were counted for each case. (e–f) The colony formation (e), and quantification (f) of control and KIFC1shRNA groups of DU145 cells. (g) The cell growth or proliferation of the control and KIFC1-silenced DU145 cells. Cell proliferation or death was assayed using the CCK-8 kit. The growth rate of the cell was detected by estimating OD value at 450 nm wavelength. Cells were transfected with KIFC1shRNAs and shLuc (control) expressing pRNAiU6.2 plasmids using Lipo 6000TM. Error bars in graphs show SEM from three repeated experiments. **P < 0.01, ***P < 0.001 obtained by paired t-test.
Next, we examined the centrosome morphology in KIFC1shRNA and control groups of DU145 cells by immunofluorescence. We observed that knockdown of KIFC1 by KIFC1shRNAs in DU145 (81% cell, Figs. 4cii–v and 4d) cells showed normal centrosome number and position during interphase and mitosis compared to the control (61% cell, Figs. 4ci and 4d) which showed the clustering of amplified centrosomes during mitosis. By depletion of KIFC1, centrosome amplification and clustering were blocked, indicating up-regulation of KIFC1 is responsible for aberrant centrosome homeostasis in PCa cells. Cells contained amplified centrosomes avoid cell death by conducting bipolar mitosis via clustering the extra centrosomes (Watts et al., 2013). Thus, we hypothesized that overexpression of KIFC1 might increase the cell survival and proliferation and induce the clustering of extra centrosomes. To test this, we measured the cell growth or proliferation and colony number of KIFC1shRNAs and control groups of PCa cells (DU145). Knockdown of KIFC1 by KIFC1shRNA reduced the cell survival and proliferation through significantly decreasing the colony number (P < 0.001, Figs. 4e–4f) and cell growth rate (P < 0.01, Fig. 4g) in DU145 cell compared to the control. So, the above results suggest that higher expression of KIFC1 promotes the clustering of amplified centrosomes in PCa cells that is indispensable for the survival and proliferation of cancer cells to progress tumorigenesis.
Overexpression of KIFC1induces centrosome multiplication and clustering and increases the survival and proliferation of WPMY1 cell
KIFC1 protein has three important functional units, the Tail domain (N-terminal), Stalk domain and Motor domain (C-terminal) (Fig. 5ai–ii). Since silencing of KIFC1 inhibited the clustering of amplified centrosomes and decreased the survival and proliferation of PCa cells, we explored the effect of KIFC1 overexpression on centrosome morphology, survival, and proliferation of normal prostate stromal cell (WPMY1). We cloned full-length KIFC1 and ligated into PCMV-N-Flag-EGFP overexpression plasmids for constructing an EGFP-tagged KIFC1FL (full-length) fusion protein.
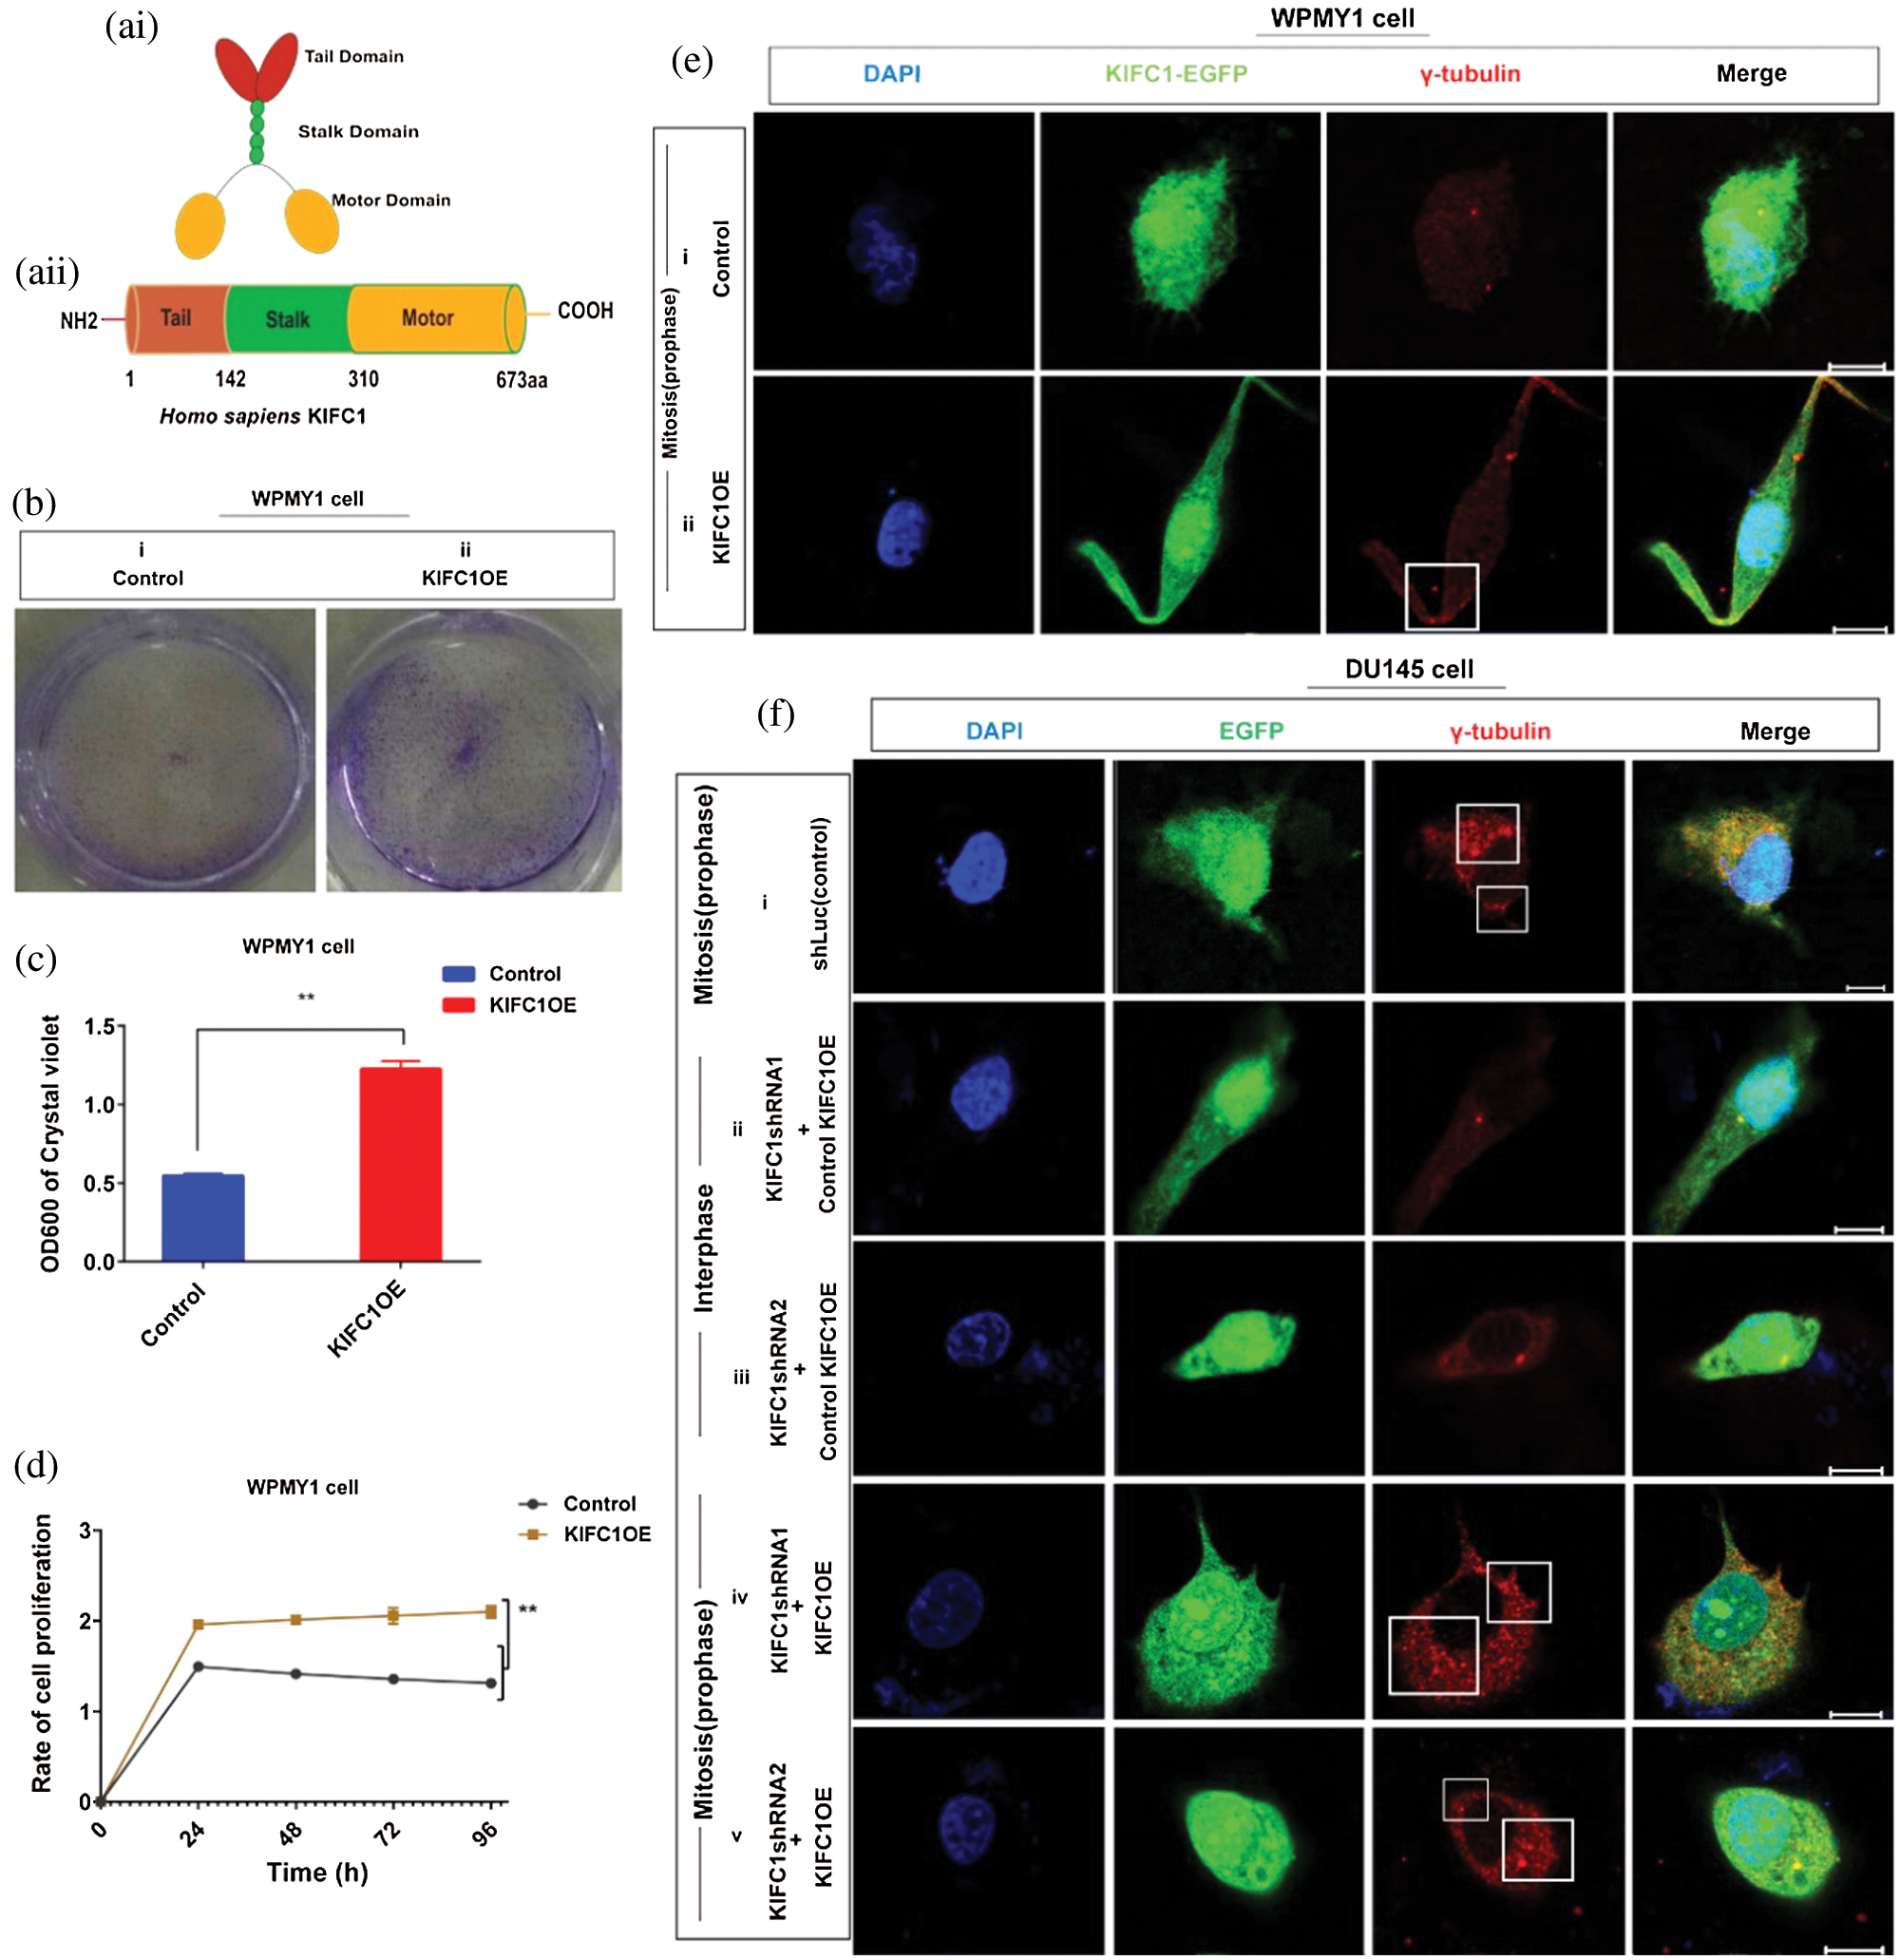
Figure 5: Analysis of the cell survival, proliferation and centrosome status of KIFC1 overexpressing WPMY1 cells. (ai–ii) The functional domains of human KIFC1. (b–c) Analysis of the cell viability by determining the colony numbers (b) and by quantifying (c) the colony of WPMY1 cells which were transfected with empty (control) and KIFC1-overexpressing PCMV-N-Flag-EGFP plasmids. (d) Cell growth curve of WPMY1 cells which were transfected by KIFC1-overexpressing and empty (control) PCMV-N-Flag-EGFP plasmids. The growth rate of the cell was detected by measuring OD value at 450 nm wavelength. Error bars in graphs show SEM from three repeated experiments and **P < 0.01 obtained by paired t-test. (ei–ii) Centrosome morphology in control (i) and KIFC1-overexpressing (ii) WPMY1 cells by immunofluorescence. Cells were transfected with KIFC1-overexpressing and empty (control) PCMV-N-Flag-EGFP plasmids using Lipo 6000TM. The cells were stained with DAPI and anti-γ-Tubulin to observe the nucleus (blue) and centrosome (red) by a confocal microscope. Scale bars: 10 μm. The rectangle indicates centrosome amplification and clustering. (fi–v) The centrosome status of control, KIFC1-silenced, and KIFC1 overexpressing KIFC1-silenced DU145 cells. Scale bars: 10 μm. Cells were stained with DAPI and anti-γ-Tubulin to observe the nucleus (blue) and centrosome (red) on a confocal microscope. The rectangle indicates centrosome amplification and clustering. Cells were co-transfected with KIFC1shRNAs and shLuc (control of KIFC1shRNA) expressing pRNAiU6.2 plasmids, and KIFC1-overexpressing and empty (control of KIFC1OE) PCMV-N-Flag-EGFP plasmids using Lipo 6000TM.
We transfected the plasmids into normal prostate stromal cells (WPMY1) and analyzed the efficiency of KIFC1 overexpression by semi-quantitative RT-PCR and western blotting. We found significantly increased KIFC1mRNA and KIFC1 protein level in KIFC1-overexpressing WPMY1 cell compared to the control increased level of (P < 0.01, Suppl. Figs. S3a–S3d). We performed cell growth or proliferation and colony formation assay to investigate the effect of KIFC1 overexpression on survival and proliferation of KIFC1-overexpressing WPMY1 cells. We observed that KIFC1overexpression significantly increased the WPMY1 cell survival and proliferation rate by rescuing the cells from death (P < 0.01, Fig. 5d) and by increasing the colony number of WPMY1 cells in comparison to control group (P < 0.01, Figs. 5b–5c). Next, we immunostained the control and KIFC1-overexpressing WPMY1 cells with γ-tubulin to observe the centrosome (red) morphology on a confocal microscope. From confocal images, we noticed that KIFC1 overexpression induced the clustering of amplified centrosomes during mitosis in WPMY1 cells (Fig. 5eii). Conversely, the control group of WPMY1 cell showed normal centrosome number and position in mitosis (Fig. 5ei). Furthermore, we did immunofluorescence to examine the centrosome morphology by overexpressing KIFC1 in KIFC1-silenced PCa cells (DU145). KIFC1 overexpression also induced the clustering of amplified centrosomes during mitosis in KIFC1-silenced DU145 (Fig. 5fiv–v) cells. Thus, KIFC1 overexpression reclaimed the centrosome clustering ability of KIFC1-silenced PCa cells. These results together indicate that KIFC1 overexpression might enhance the cell survival and proliferation possibly through inducing the clustering of amplified centrosomes.
Higher expression of KIFC1 might enhance the proliferation of prostate cancer (PCa) cell via acceleration of cell cycle and aberrant activation Cdk1
Previous research provided evidence that KIFC1 higher expression enhances the proliferation of cancer cell by accelerating the cell cycle (Pannu et al., 2015; Liu et al., 2016). To test whether KIFC1 promotes PCa cell proliferation by enhancing the progress of the cell cycle, we analyzed the cell cycle by overexpressing and by silencing of KIFC1 using propidium iodide (PI) staining.
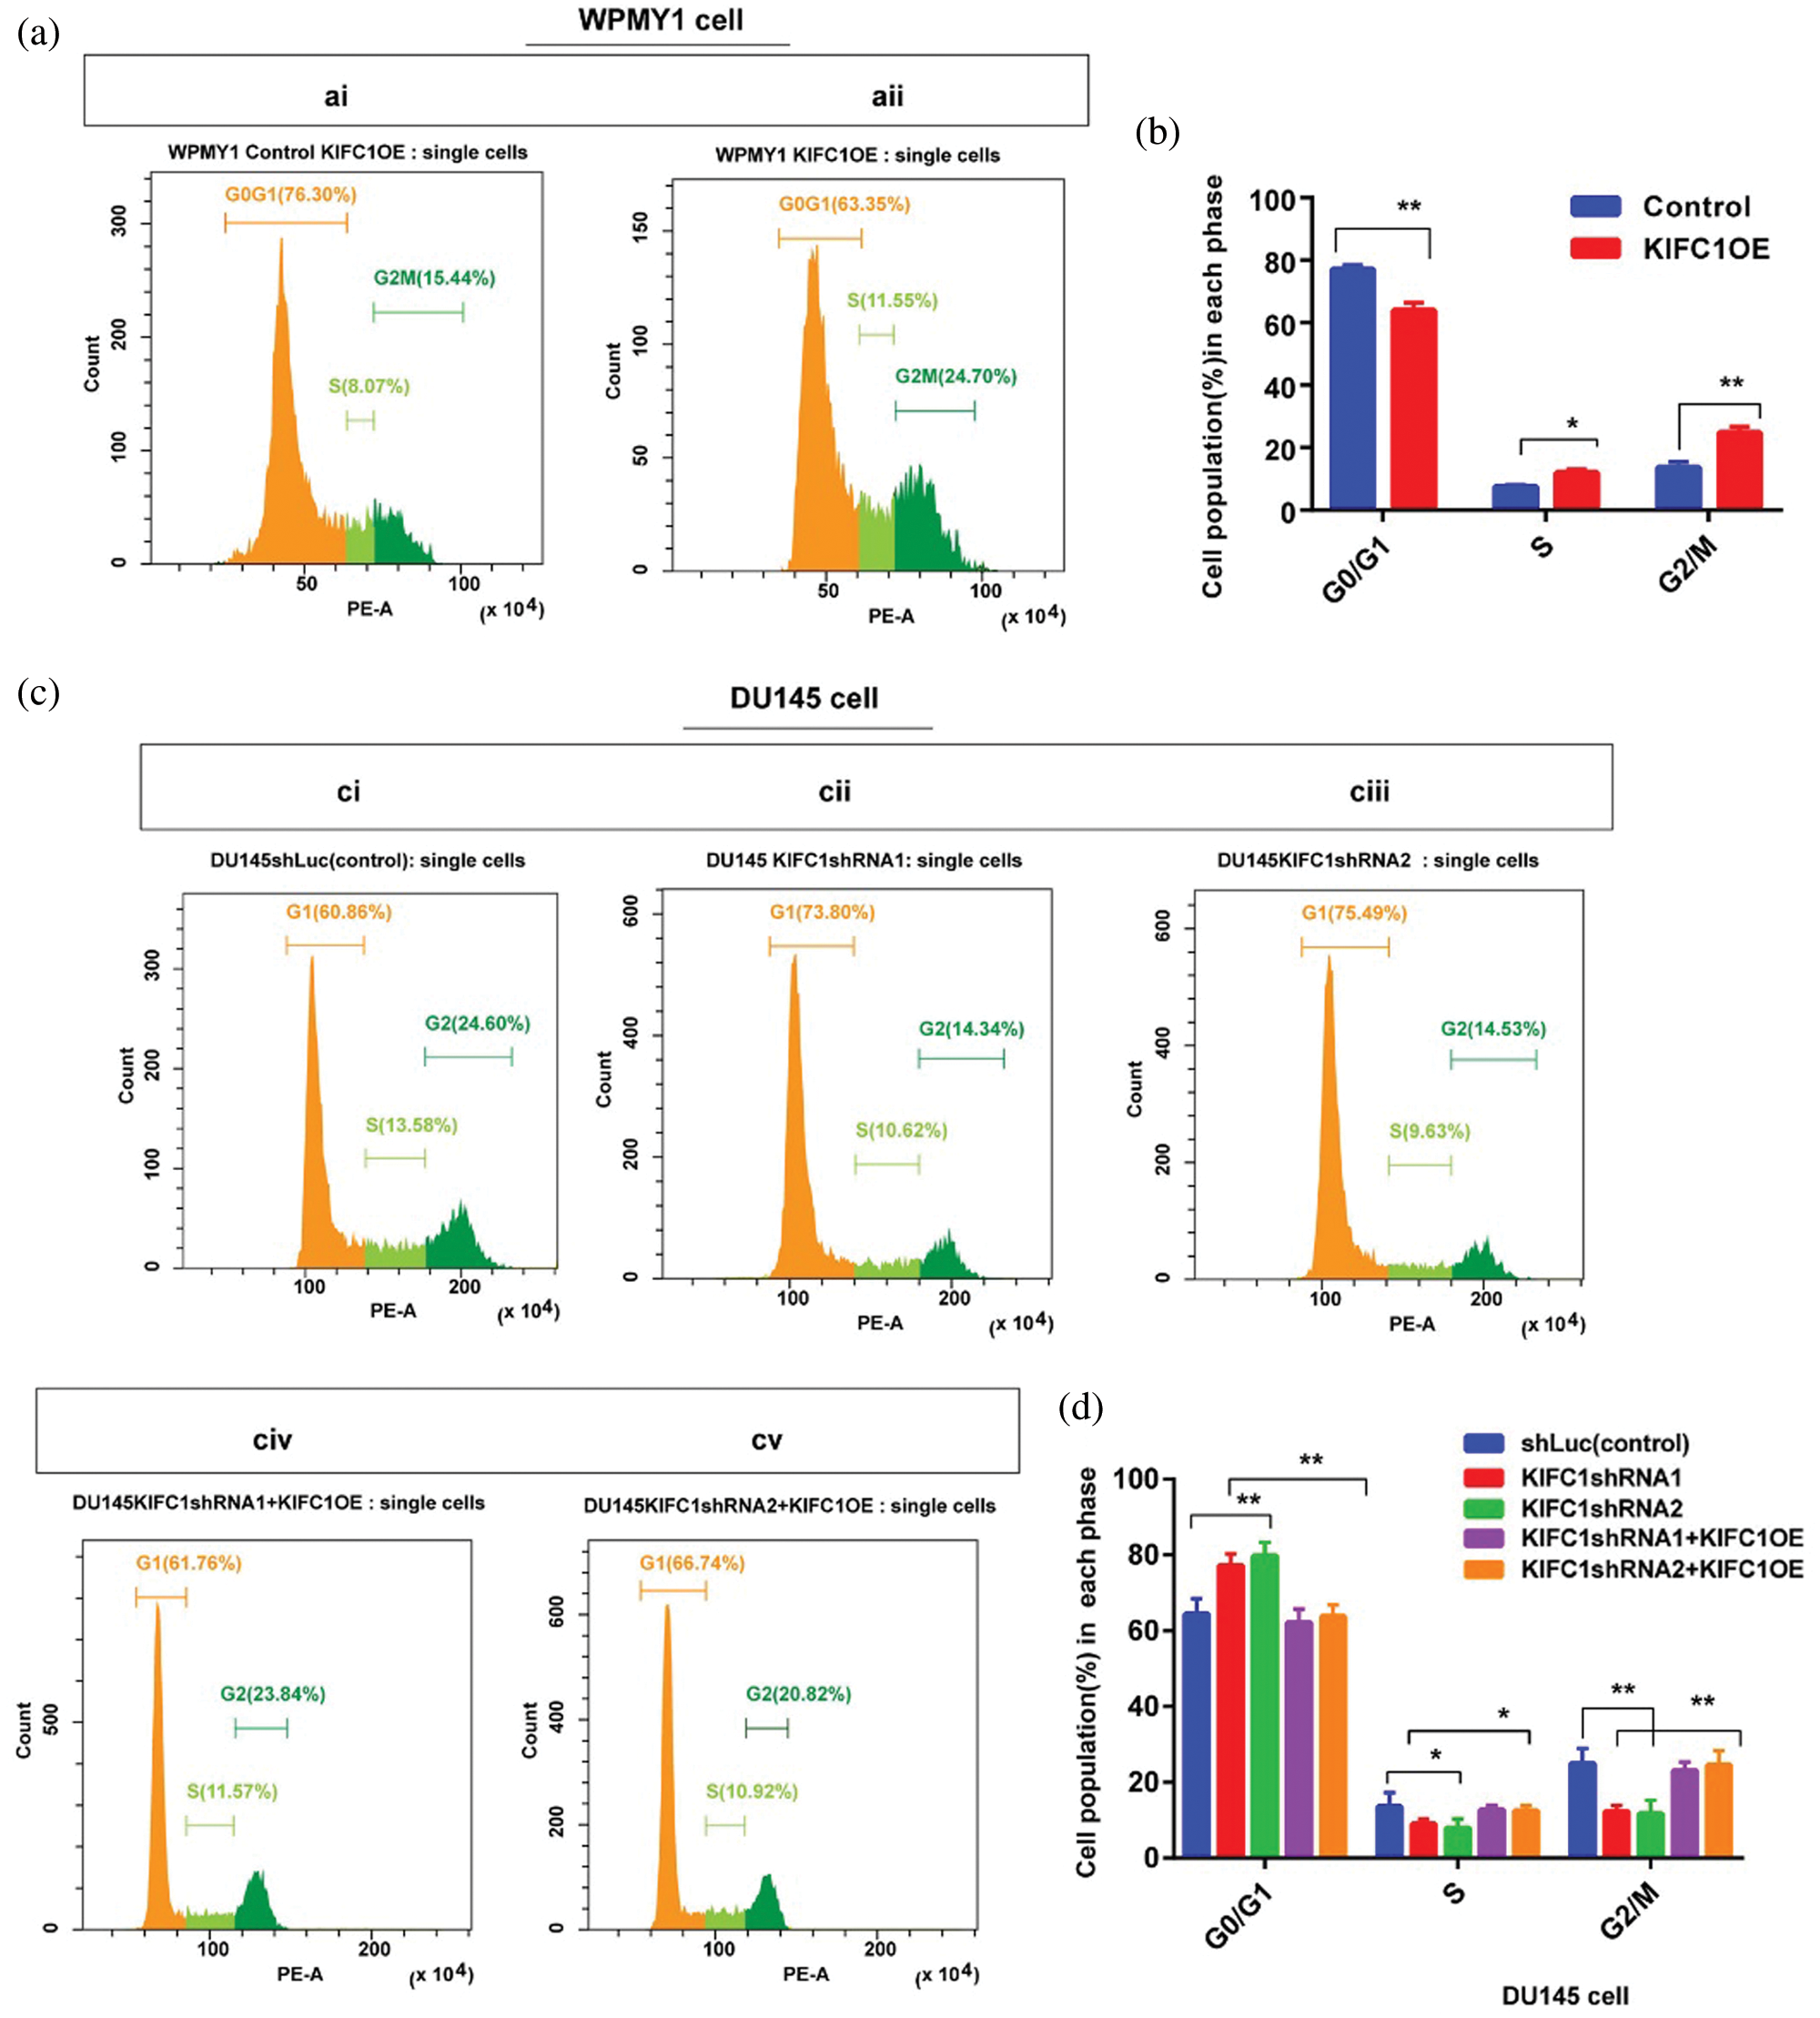
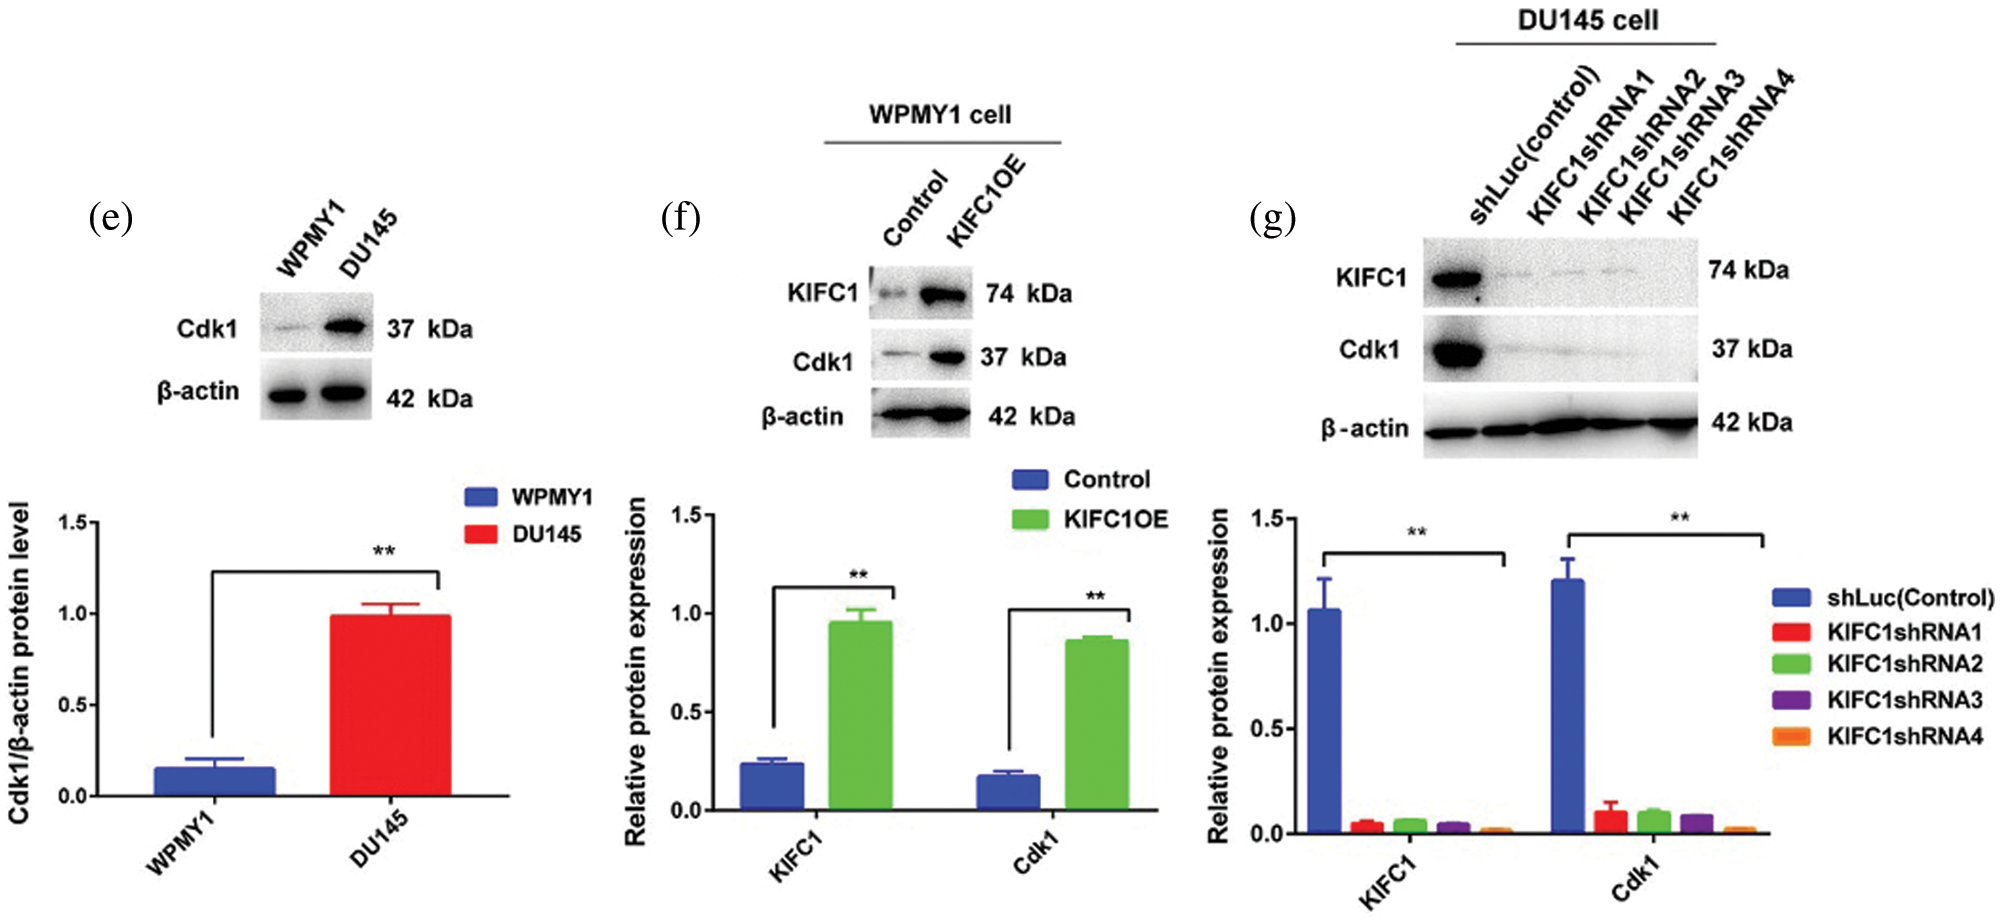
Figure 6: Higher expression of KIFC1 enhanced the cell cycle progression and aberrant activation of Cdk1 in prostate cancer (PCa) cell. (ai–ii) Analysis of different stages of the cell cycle in control and KIFC1-overexpressing WPMY1 by staining with propidium iodide (PI). (b) Percentage of cell population in each stage of cell cycle in control and KIFC1-overexpressing WPMY1 cells. WPMY1 cells were transfected with KIFC1-overexpressing and empty (control) PCMV-N-Flag-EGFP plasmids using Lipo 6000TM. (ci–v) Analysis of different stages of the cell cycle in control (ci), KIFC1-knockdown DU145 (cii–iii), and KIFC1 overexpressing KIFC1-knockdown DU145 cells (civ–v) through propidium iodide (PI) staining. (d) Percentage of cell population in each stages of cell cycle of DU145 cells in varied conditions. DU145 cells were transfected with KIFC1shRNAs and shLuc (control of KIFC1shRNA) expressing pRNAiU6.2 plasmids and then co-transfected with KIFC1-overexpressing and empty (control of KIFC1OE) PCMV-N-Flag-EGFP plasmids using Lipo 6000TM. The distribution of cells in different phases of the cell cycle was analyzed by Flow Cytometry. (e) Western blotting for analyzing and comparing the expression of Cdk1 in prostatic stromal (WPMY1) and PCa (DU145) cells. (f–g) KIFC1 and Cdk1 protein levels in control, KIFC1-overexpressing WPMY1cell (f), and KIFC1-knockdown DU145 (g) cells. Proteins were quantified by Image J software and results were normalized to β-actin. WPMY1 cells were transfected with KIFC1-overexpressing and empty (control) PCMV-N-Flag-EGFP plasmids. DU145 cells were transfected with KIFC1shRNAs and shLuc (control) expressing pRNAiU6.2 plasmids. Error bars in graphs represent SEM of three repeated experimental data. *P < 0.05 and **P < 0.01 by paired t-test.
KIFC1 overexpression in the normal prostate stromal cell (WPMY1) significantly decreased the cell population in G0-G1 (P < 0.01) but increased in S (P < 0.05) and G2-M (P < 0.01) phases compared to control (Figs. 6a–6b). We also analyzed the cell cycle in control and KIFC1shRNAs groups of PCa cells (DU145). The cell population in G0-G1 was significantly raised (P < 0.01) but decreased on S (P < 0.05) and G2-M (P < 0.01) phases in all KIFC1-silenced groups of DU145 cells compared to control (Figs. 6ci–iii and 6d). Conversely, overexpression of KIFC1 significantly decreased the cell population in G0-G1 (P < 0.01) but increased in S (P < 0.05) and G2-M (P < 0.01) phases in KIFC1-silenced DU145 cell (Figs. 6civ–v and 6d). These results strongly suggested that KIFC1 higher expression accelerated the cell cycle in PCa cells and knockdown of KIFC1 arrested the cells in G0–G1 phase. Cyclin-dependent kinase 1 (Cdk1) has roles in controlling centrosome numbers and helps to maintain accurate cell division by regulating the cell cycle through the transmigration of G1-S and G2-M phases (Chohan et al., 2018). As overexpression of KIFC1 enhanced the cell cycle progression by promoting the transmigration of the G1–S phase, we predicted that KIFC1 might enhance the cell cycle progression by aberrant activation of Cdk1. To test this, we analyzed Cdk1 protein expression in prostatic stromal (WPMY1) and PCa (DU145) cells and noticed it was higher expression in PCa cells (P < 0.01, Fig. 6e). Western blotting results of KIFC1-overexpressing WPMY1 (Fig. 6f) and KIFC1-silenced DU145 cells (Fig. 6g) indicate that Cdk1 protein expression is strongly regulated and influenced by KIFC1 expression. Thus, KIFC1 accelerated the cell cycle through KIFC1 dependent aberrant activation of Cdk1. Taken together, these results indicate that up-regulation of KIFC1 might enhance the cell cycle progression resulted in PCa cell proliferation possibly through aberrant activation of Cdk1.
KIFC1 interacts with centrosome protein Centrin 2
Deregulation of proteins including AURKA, STIL, PLK4, Centrin 2, and γ-tubulin has been related to centrosome amplification (CA) and clustering (Leontovich et al., 2013; Montañez-Wiscovich et al., 2010; Marina and Saavedra, 2014). We conducted immunoblotting to detect the interactions between KIFC1 and those proteins by comparing their expression levels. We observed that all the above protein expression were significantly higher (P < 0.01, P < 0.001) in prostate cancer (PCa) cell (DU145) similar to the KIFC1 expression level (Figs. 7a–7b). We then analyzed and compared the expression of those proteins and KIFC1 in KIFC1shRNAs and control (shLuc) groups of DU145 cells. We noticed that only Centrin 2 protein level was mostly influenced and reduced significantly in DU145 cells through silencing of KIFC1 by all KIFC1shRNA (P < 0.001, Figs. 7c–7d). Besides, AURKA expression was increased significantly in KIFC1-silenced DU145 cells (P < 0.05, P < 0.01, Figs. 7c–7d) by KIFC1shRNA1, KIFC1shRNA3 and KIFC1shRNA4. STIL and PLK4 protein level were also significantly increased in KIFC1-silenced DU145 by all KIFC1shRNAs (P < 0.05, P < 0.01, Figs. 7c–7d). The γ-tubulin expression level was significantly reduced in DU145 cell only by KIFC1shRNA3 (P < 0.001) and increased (P < 0.01) by KIFC1shRNA2 (Figs. 7c–7d).
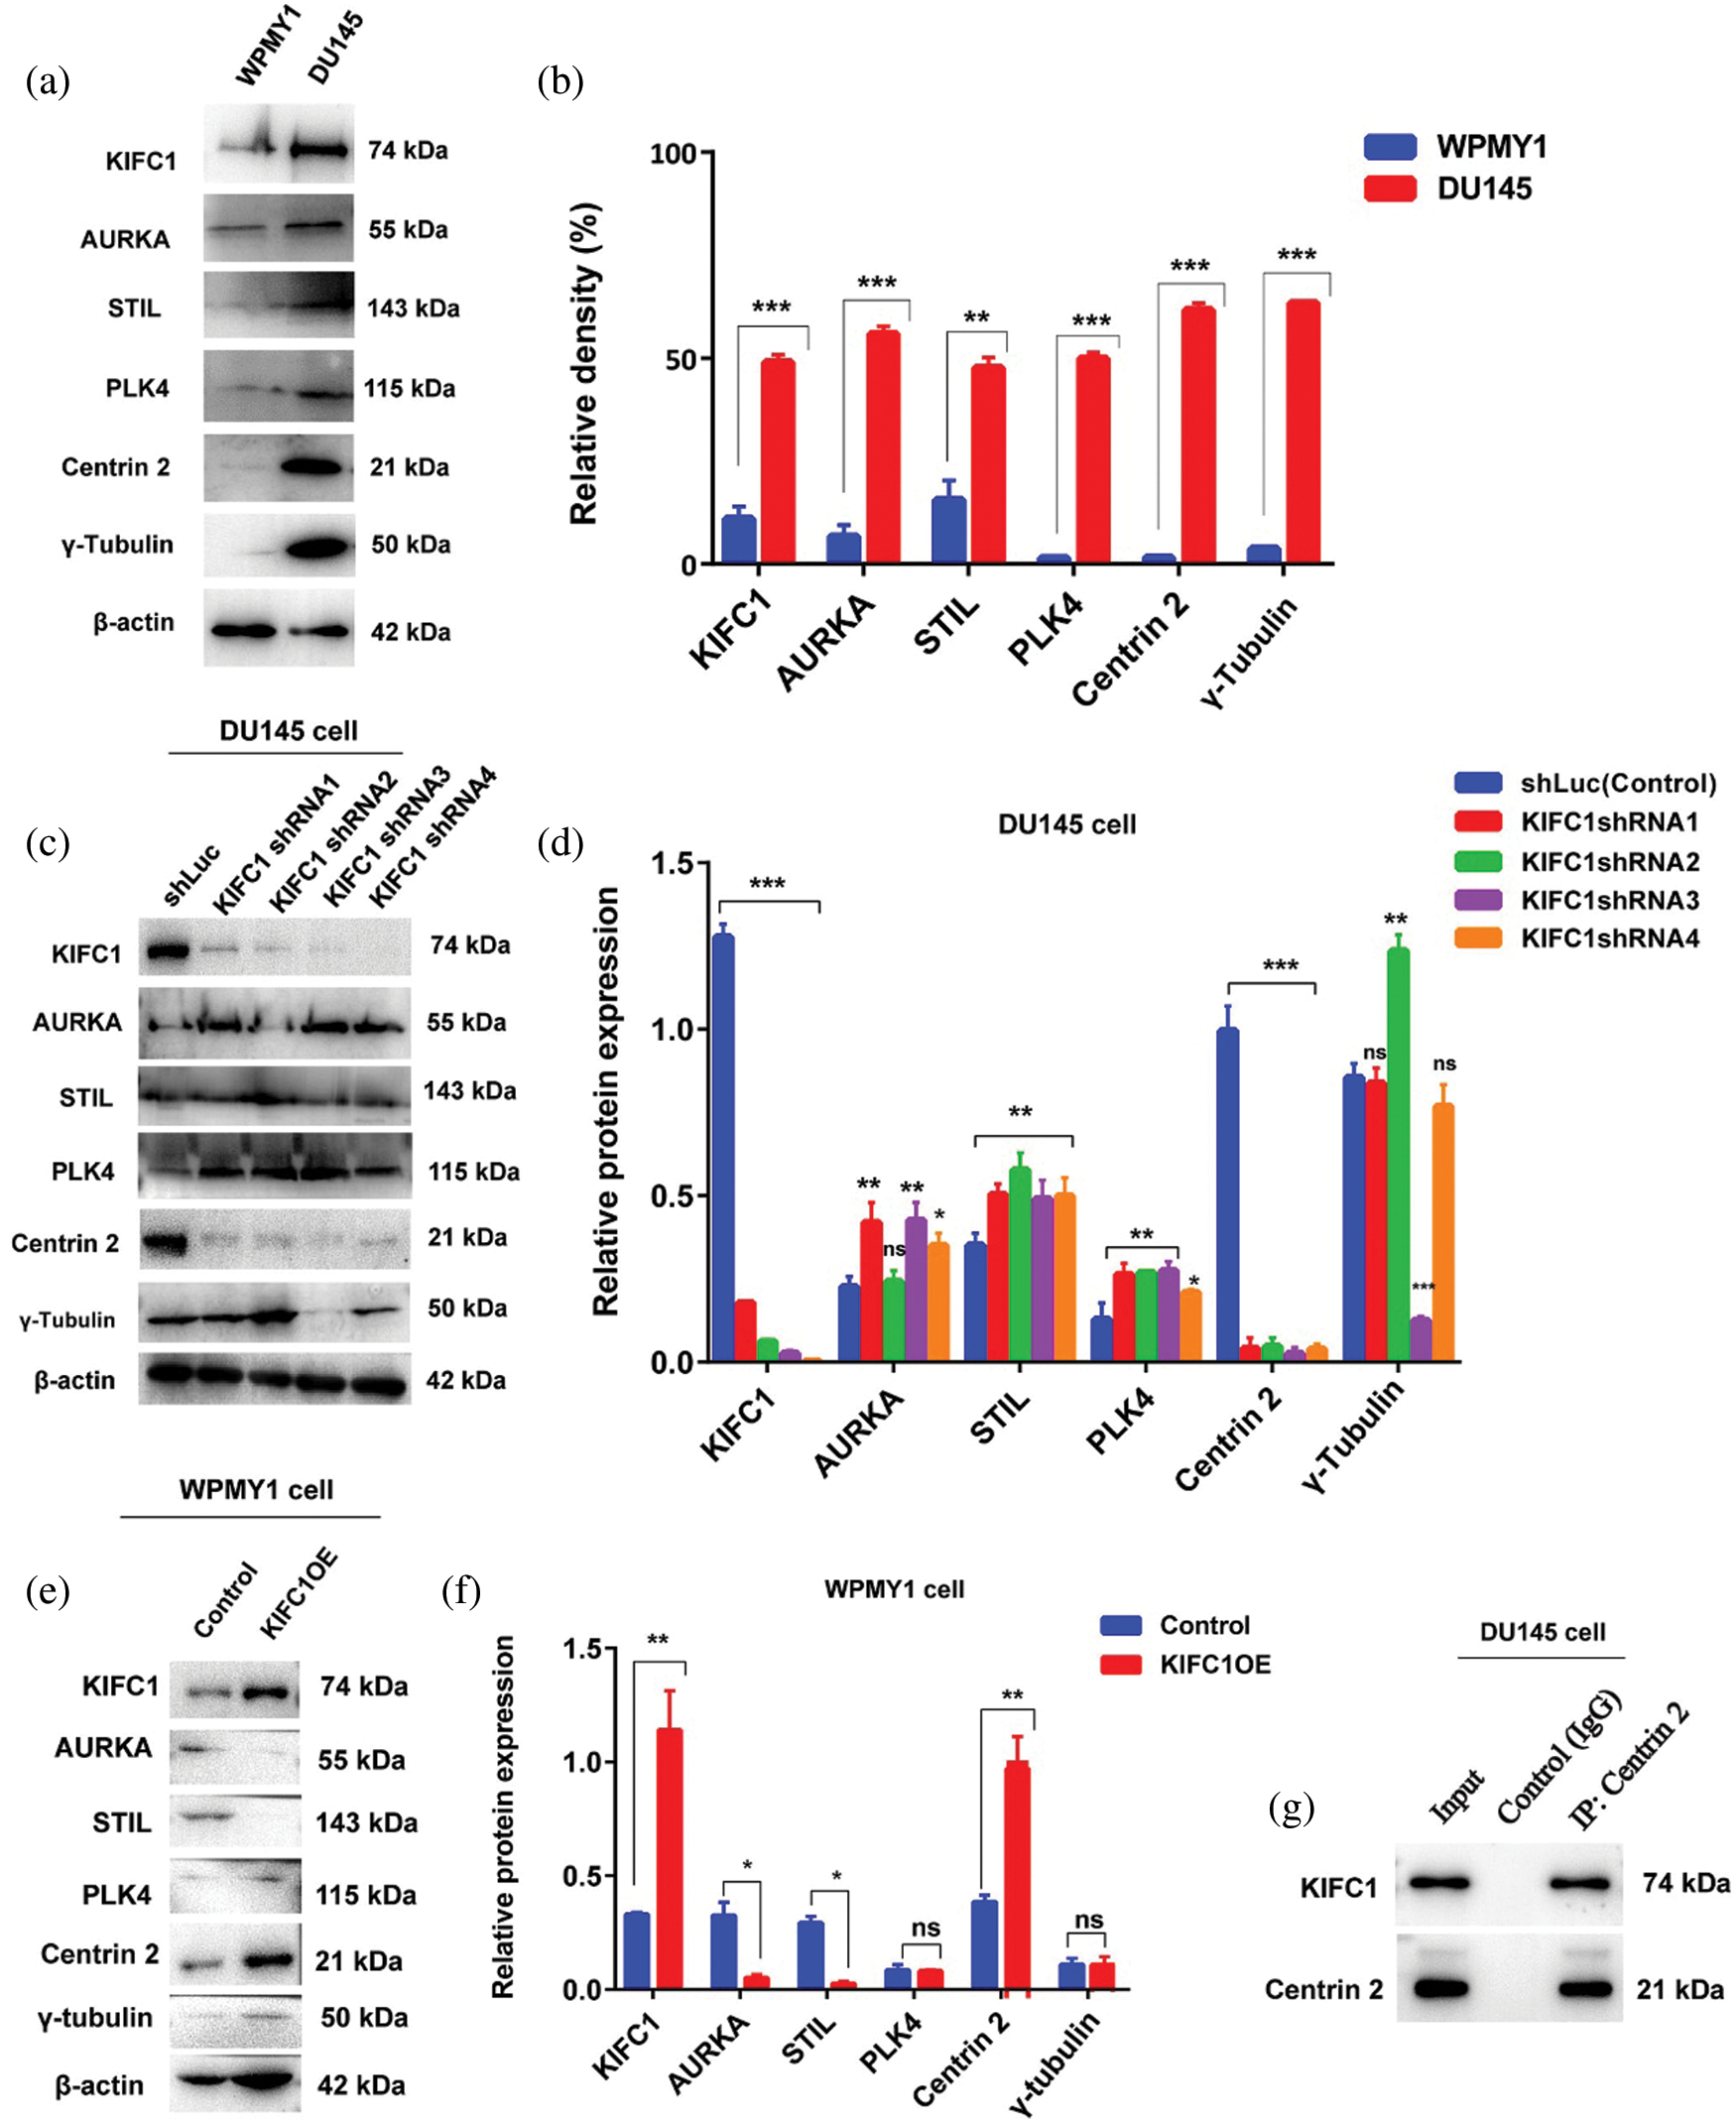
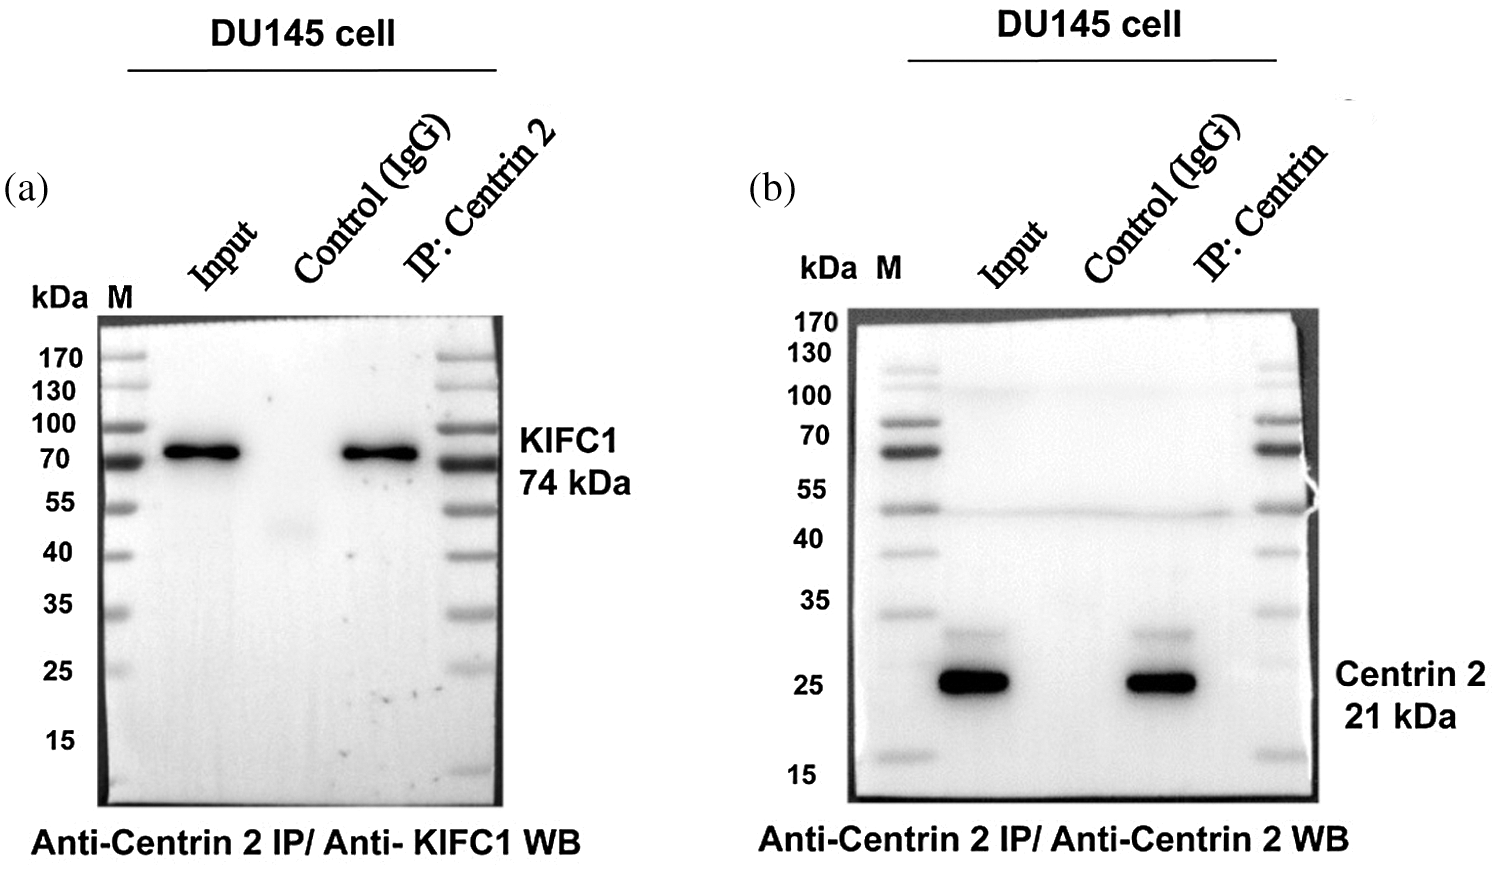
Figure 7: Centrin 2 protein expression is strongly regulated and correlated with the KIFC1 expression in prostate cancer (PCa) cells. (a–b) The relative protein expression level of KIFC1 and genes related to centrosome amplification (CA) and clustering in prostatic stromal (WPMY1) and prostate cancer (DU145) cell. (c–d) Western blotting to analyze the KIFC1 and centrosome amplification (CA) related proteins expression in control and KIFC1-silenced DU145 cells. DU145 cells transfected with KIFC1shRNAs and shLuc (control) expressing pRNAiU6.2. (e–f) The protein expression level of genes related to CA in control and KIFC1-overexpressing WPMY1 cells. Cells were transfected with KIFC1-overexpressing and empty (control) PCMV-N-Flag-EGFP plasmids. Error bars in graphs show SEM from three repeated experiments. *P < 0.05, **P < 0.01, ***P < 0.001 from paired t-test. (g) Interaction between KIFC1 and Centrin 2 was analyzed by Co-immunoprecipitation. The whole-cell extract of DU145 cells was subjected to immunoprecipitation by anti-Centrin 2 antibody or random IgG (control) followed by affinity purification (Elution). The result was analyzed by western blotting with the indicated antibodies. The full blots of Co-IP results have been presented in Suppl. Fig. S4.
To clarify whether KIFC1 overexpression influences or increases the expression of CA-related proteins, we analyzed the expression level of CA-related proteins in control and KIFC1-overexpressing WPMY1 cells. Only Centrin 2 protein level was entirely influenced and increased significantly (P < 0.01) through overexpression of KIFC1 in WPMY1 cell (Figs. 7e–7f). AURKA and STIL protein expression were significantly decreased by overexpressing the KIFC1 in WPMY1 cell compared to control (P < 0.05, Figs 7e–7f). PLK4 and γ-tubulin expression was not influenced through overexpression of KIFC1 in WPMY1 cell in comparison to control (Figs. 7e–7f). These results mean that only Centrin 2 expression level was strongly influenced and correlated with the expression level of KIFC1. Furthermore, to detect the stable interaction between KIFC1 and Centrin 2, we did Co-IP by immunoprecipitating the protein with anti-Centrin 2 antibody and analyzed the result by western blotting after affinity purification. We found an interaction between these two proteins (Fig. 7g and Suppl. Fig. S4). So, these results together mean that KIFC1 interacts with Centrin 2 and influences its expression in PCa cells.
KIFC1 overexpression causes centrosome clustering by associated with Centrin 2
KIFC1 slides towards the minus end of microtubules with their C-terminal motor domain (McDonald et al., 1990), and Centrin 2 has an indispensable function in the structure of microtubule organizing center (MTOC) which anchor and stabilize the minus end of the microtubules and regulates the centrosome duplication or amplification and correct mitotic spindle formation (Bettencourt-Dias and Glover, 2007; Kloc et al., 2014). Since Centrin 2 expression level in prostate cancer (PCa) cells is influenced by KIFC1 expression and has a stable interaction between them, we hypothesized that up-regulated KIFC1 may cluster multiple centrosomes by interacting with Centrin 2. To test this, we examined the centrosome morphology in prostatic stromal (WPMY1) and PCa (DU145) cells by immunostaining with anti-Centrin 2 and observed on a confocal microscope (Fig. 8a). We found that PCa (DU145) cells had significantly higher (P < 0.01, 62% cells) amplified and clustered centrosomes during interphase and mitosis, respectively (Figs. 8aii and 8b). We analyzed the centrosome morphology in control and KIFC1-overexpressing WPMY1 cells by immunostaining with anti-Centrin 2. KIFC1-overexpressing cells showed the clustering of amplified centrosomes during mitosis (Fig. 8cii). Next, we knocked down Centrin 2 in PCa cells (DU145) by Centrin 2shRNA and observed the significant reduction (P < 0.01) of Centrin 2 protein in DU145 cell, but KIFC1 expression was not decreased (Figs. 8d–8e).
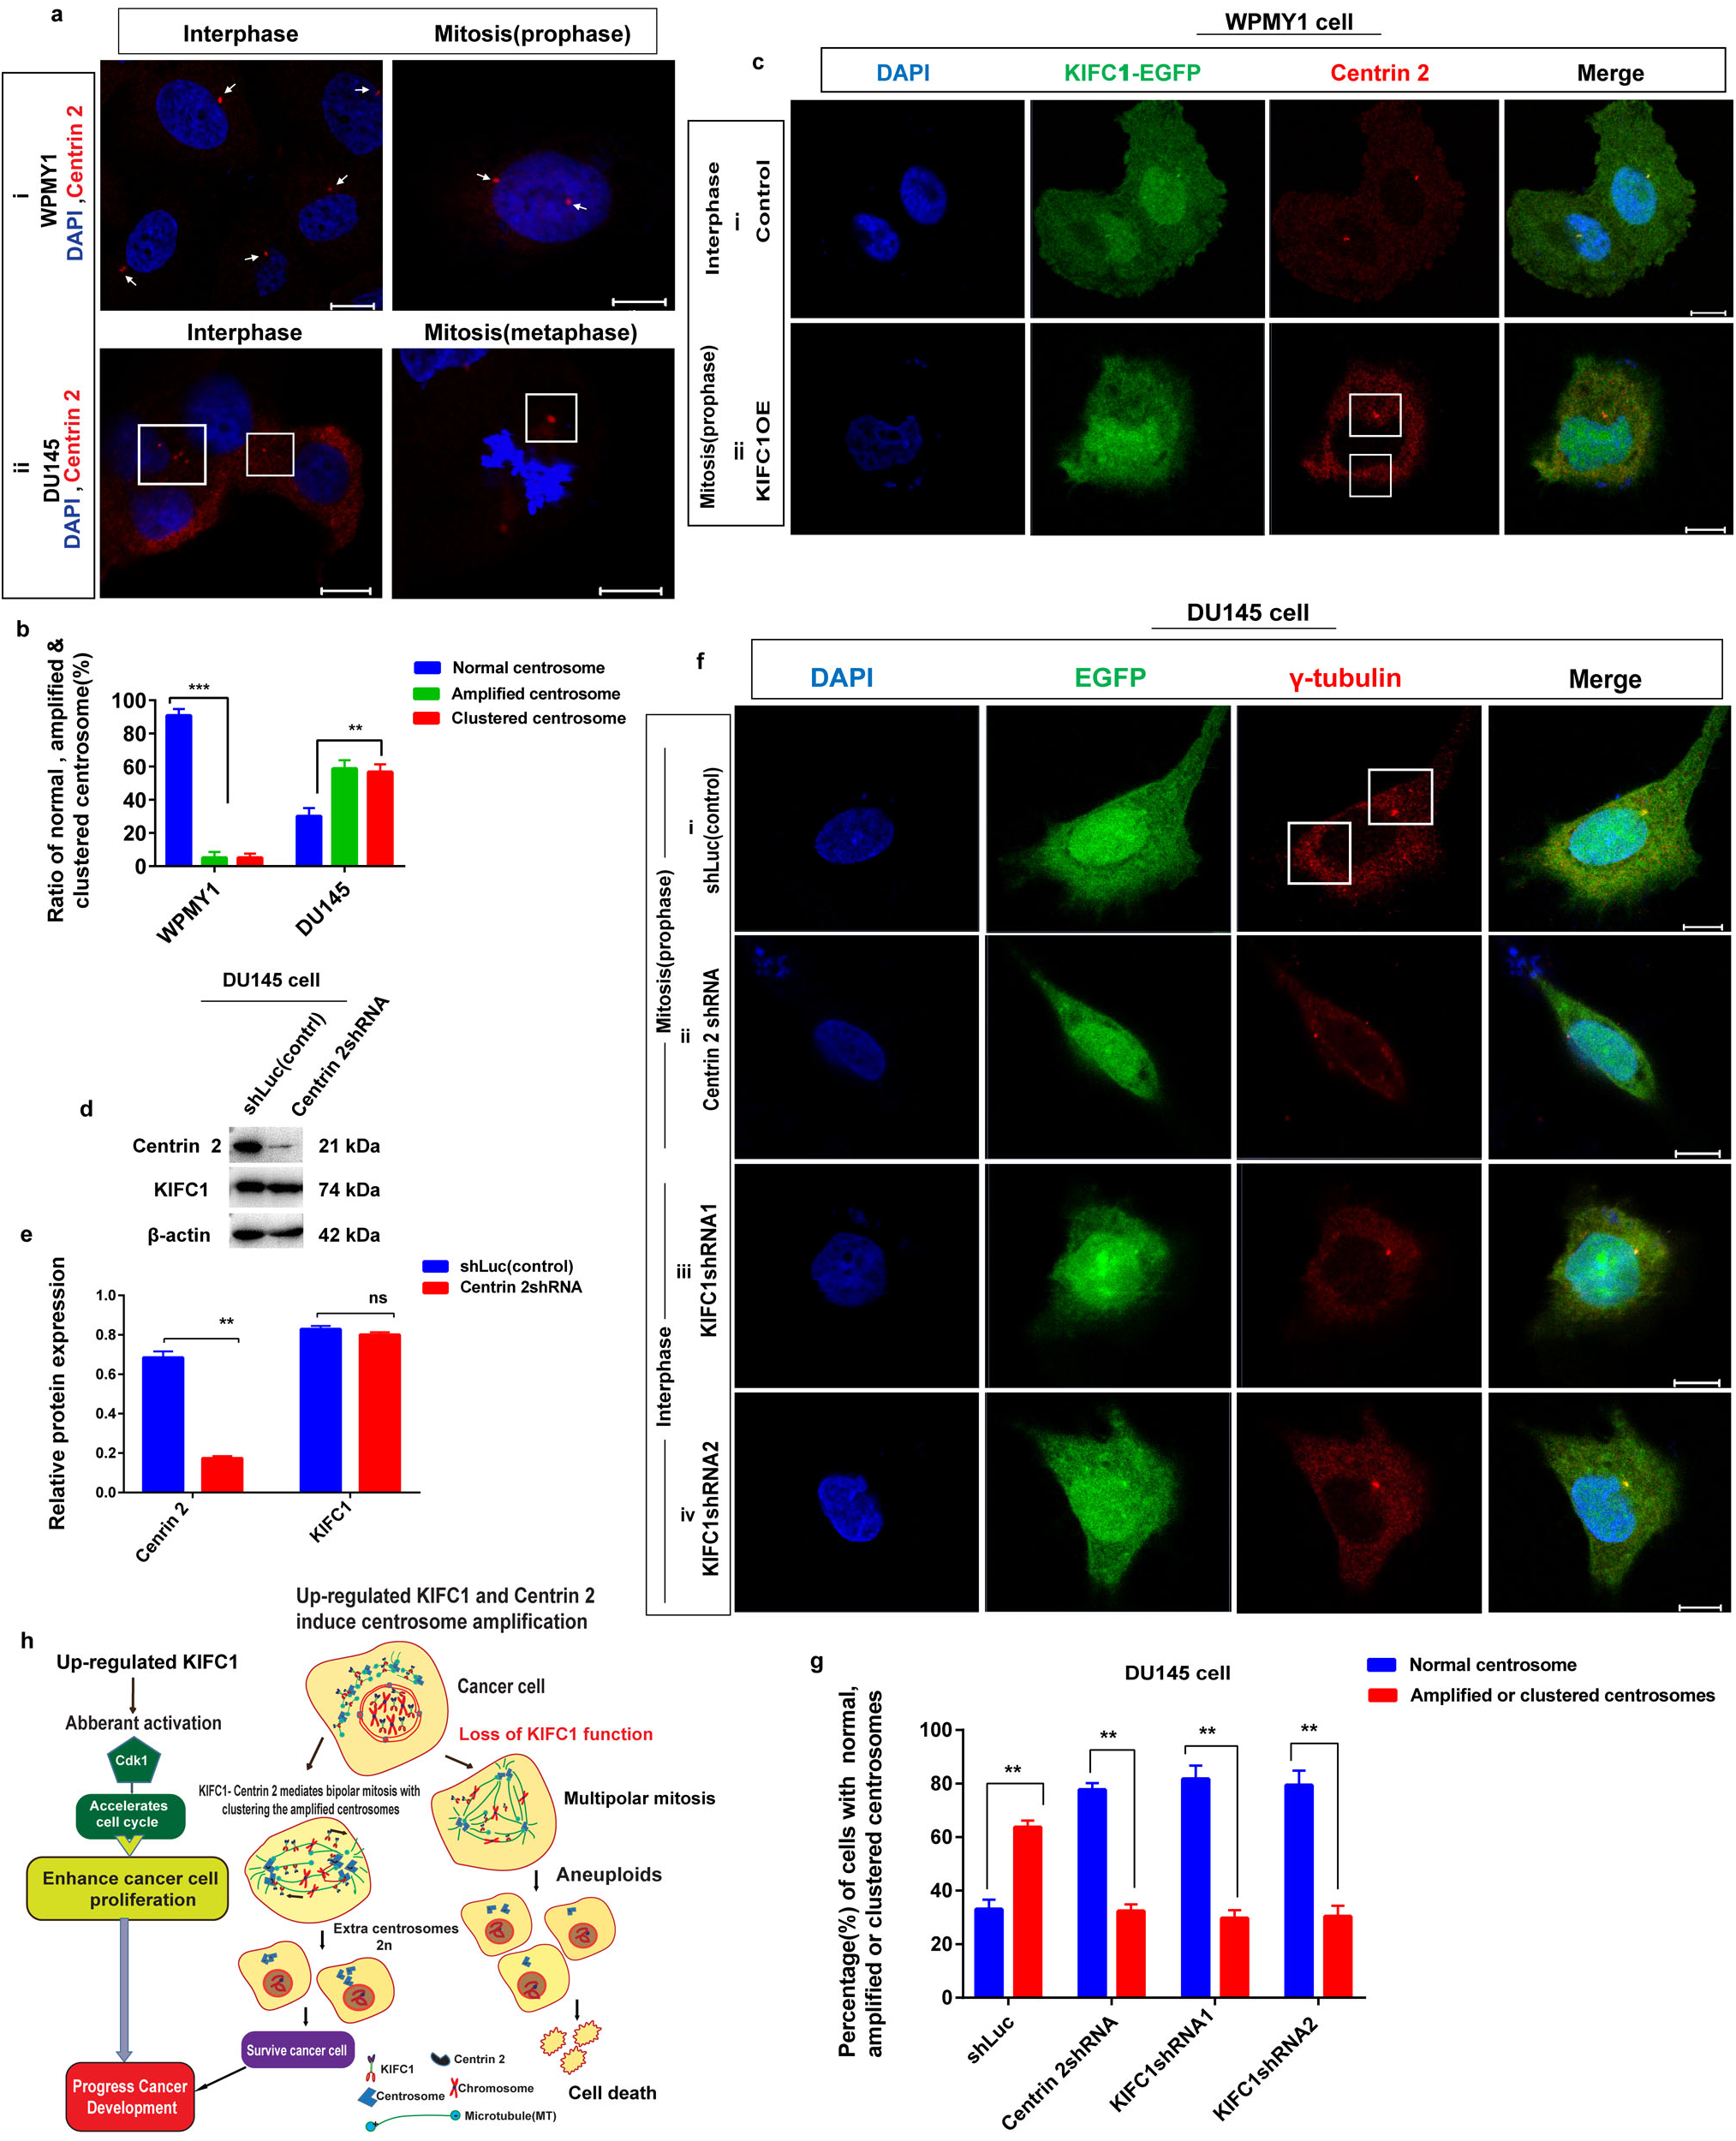
Figure 8: KIFC1 induces the clustering of supernumerary centrosomes in prostate cancer (PCa) cells via association with Centrin 2. (a) Analysis of centrosome status by immunofluorescence in prostatic stromal (WPMY1) and PCa (DU145) cells in interphase and mitosis. Cells were immunostained with DAPI and anti-Centrin 2 to observe nucleus (blue) and centrosome (red) by a confocal microscope. Scale bars: 10 μm. The rectangle indicates centrosome amplification and clustering. (b) The ratio of normal, amplified, and clustered centrosomes in WPMY1 and DU145 cells. 100 cells were counted for each case. (c) Confocal images show centrosome status of WPMY1 cells which were transfected with KIFC1-overexpressing and empty (control) PCMV-N-Flag-EGFP plasmids. Scale bars: 10 μm. The rectangle indicates amplified centrosome clustering during mitosis. Cells were stained with DAPI and anti-Centrin 2 to observe the nucleus (blue) and centrosome (red). (d–e) The knockdown efficiency of Centrin 2 in DU145 cells by Centrin 2shRNA. The result was normalized to β-actin. Cells were transfected with Centrin 2shRNA and shLuc (control) expressing pRNAiU6.2 plasmids. (fi–iv) The centrosome morphology of control (i), Centrin 2-silenced (ii), and KIFC1-silenced (iii, iv) DU145 cells was observed by a confocal microscope. Scale bars: 10 μm. The cells were stained with DAPI, anti-γ-tubulin to observe the nucleus (blue) and centrosome (red). (g) The percentage of normal, amplified, or clustered centrosomes in control, Centrin 2-silenced, and KIFC1-silenced DU145 cells. 100 cells were counted for each case. Error bars in graphs show SEM from three repeated experiments. ns, non-significant, **P < 0.01 and ***P < 0.001 from paired t-test. (h) A schematic model displaying the PCa progression by up-regulated KIFC1 which caused amplified centrosomes clustering via interaction with Centrin 2, and enhanced the proliferation of PCa cell with aberrant activation of Cdk1.
Furthermore, we analyzed the centrosome morphology in control, Centrin 2-silenced, and KIFC1-silenced groups of DU145 cells. We noticed normal centrosome number and position during interphase and mitosis in both Centrin 2-silenced (77% cell, Figs. 8fii and 8g) and KIFC1-silenced (79% cells, Figs. 8fiii–iv and 8g) DU145 cells compared to the control group which had clustering of amplified centrosomes (63% cells, Figs. 8fi and 8g) during mitosis. This result shows that up-regulated Centrin 2 amplifies the centrosomes in PCa cells and KIFC1 clusters that amplified centrosomes via interaction with Centrin 2 to form bipolar mitotic spindle. As KIFC1 slides towards the minus end of microtubules (MTs), and Centrin 2 helps to anchor and stabilize the minus end of MTs at the centrosome to regulate the formation of the mitotic spindle, so KIFC1-Centrin 2 complex possibly helps for the stabilization of the centrosome-spindle pole interface. Moreover, stably silencing of KIFC1 and Centrin 2 not only inhibits the centrosome clustering but also renders the centrosome amplification. Thereby, overexpression of KIFC1 causes centrosome amplification and clustering in PCa cells by interacting with Centrin 2.
The minus end-directed motor protein KIFC1 is usually engaged in spindle pole formation, organization, and length regulation (Walczak et al., 1998). Previous studies proved that KIFC1 overexpression is related to the development of different types of cancer including prostate cancer (PCa) (Fu et al., 2018; Ogden et al., 2017; Pawar et al., 2014; Zhang et al., 2017). We demonstrated that KIFC1 is highly expressed in PCa cells (Figs. 1a, and 1b), tumor tissues of prostatic adenocarcinoma patients (Figs. 1c–1f), and largely located in the nucleus of PCa cells (Fig. 1gii). Centrosome is the key regulator of the cell cycle and is often amplified in cancer cells (Zyss and Gergely, 2009). Supernumerary centrosomes induce the cells for undergoing multipolar mitosis cell division leads to cell death or aneuploidy. However, cancer cells organize bipolar cell division by clustering the amplified centrosomes (Nigg and Raff, 2009). Recently, centrosome clustering has been recognized as a marker for several aspects of cancer development including in breast cancer (Choe et al., 2018), serous ovarian adenocarcinoma (Mittal et al., 2016), and epithelial cancer (Rhys et al., 2018). KIFC1 is familiar with centrosome clustering which leads to the survival of cancer cells with extra centrosomes (Mittal et al., 2016; Nigg, 2002; Kwon et al., 2008). By studying centrosome morphology, we identified that PCa cells showed amplified and clustered centrosomes during interphase and mitosis due to KIFC1 higher expression (Figs. 2d–2g). We demonstrated that the silencing of endogenous KIFC1 by KIFC1shRNA in PCa cells inhibited the centrosome amplification and clustering during interphase and mitosis (Figs. 4cii–v and 4d) and decreased the cancer cells survival and proliferation rate (Figs. 4e–4g). Moreover, silencing of KIFC1 by KIFC1siRNA showed multi-polar mitosis via inhibition of clustering the multiple centrosomes in PCa cells (Figs. 3ciii–iv, and 3d). Conversely, KIFC1 overexpression induced the clustering of amplified centrosomes during mitosis in WPMY1 cells (Fig. 5eii) and increased cell growth and survival rate (Figs. 5b–5d). In addition, KIFC1-silenced PCa cells regained the centrosome clustering competency during mitosis by overexpression of KIFC1 (Fig. 5fiv–v). Thus, prostate cancer cells maintained pseudo-bipolar spindle phenotypes during mitosis for their survival by up-regulated KIFC1 mediated centrosome clustering. It also indicates that KIFC1 is essential for the pseudo-bipolar cell division in cancer cells with clustering the supernumerary centrosomes.
The progression of cancer mostly depends on uncontrolled tumor cell proliferation resulting from the aberrant activation of cell cycle protein including different cyclin-dependent kinases (CDKs) that act by interacting with their cyclin partners (Chohan et al., 2018; Oghabi et al., 2020). We observed increased growth and proliferation of PCa cell with higher expression of KIFC1 (Figs. 4e–4g). Moreover, cell cycle analysis showed that KIFC1 overexpression enhanced the cell cycle in the WPMY1 cell (Figs. 6aii and 6b) and KIFC1-silenced DU145 cell (Figs. 6civ–v and 6d) by reducing the cell population in the Go-G1 phase. Besides, a large number of cells were arrested in G0–G1 phase and a small number of cells were entered into S and G2–M phase by silencing the endogenous KIFC1 in PCa cells compared to control (Figs. 6ci–iii and 6d). So, KIFC1 overexpression accelerated the cell cycle through G1–S phase transmigration. Cdk1 acts as a serine/threonine kinase which regulates the G2–M checkpoint and is inevitable for G1–S and G2–M phase transmigration of the eukaryotic cell cycle (Morgan David, 2007; Qiao et al., 2018; Enserink and Kolodner, 2010). Besides, centrosome acts as a reaction centre to enhance the activation of Cdk1 and transmigration of the cell cycle through G1 to S and G2 to M phase (Löffler et al., 2011; Doxsey et al., 2005). Our study revealed that Cdk1 is overexpressed in PCa cells (Fig. 6e) and regulated by the KIFC1 expression (Figs. 6f–6g). Taken together these results suggest that KIFC1 higher expression promotes the proliferation of PCa cell through the acceleration of cell cycle possibly due to aberrant activation of Cdk1 (Zhang et al., 2017).
Previous study revealed that KIFC1 induced centrosome clustering by interacting with centrosome protein CEP215 (Chavali et al., 2016). Besides, KIFC1 expression level in cancer cells was related to the proteins that are known for centrosome amplification and clustering including AURKA, STIL, PLK4, Centrin 2, and γ-tubulin (Zhou et al., 1998; Ma et al., 2003; Brown et al., 1990; Joukov et al., 2014; Holland and Cleveland, 2014). Here, we demonstrated that all the above proteins expression were higher in PCa cells and similar to KIFC1 (Figs. 7a and 7b). Furthermore, we identified that only Centrin 2 expression was mostly regulated by KIFC1 expression (Figs. 7c–7f). KIFC1 directs the organization of spindle pole throughout the centrosomes and induces the clustering of amplified centrosomes via crosslinking and sliding (Chavali et al., 2016). Microtubule crosslinking appears as a dominant role of KIFC1 in attaching the centrosomes to spindle poles and sliding play role in binding of KIFC1 at centrosomes. We found a stable interaction between KIFC1 and centrosome protein Centrin 2 (Fig. 7g). It indicates that KIFC1 may bind at centrosomes possibly by interaction with centrosome protein Centrin 2. Centrin 2 plays a fundamental role in the function of centrosome and is possibly required for the proper duplication and segregation of centrosome (Rieder et al., 2001; Dahm et al., 2007). Besides, Centrin 2 helps to anchor and stabilize the minus end of microtubules (MTs) to the centrosome, and therefore regulate the correct mitotic spindle formation (Salisbury et al., 2002; Kloc et al., 2014). After analyzing the centrosome morphology in normal and PCa cells by immunostaining with Centrin 2, we found amplified and clustered centrosomes in PCa cells (Figs. 8a–8b). We noticed that KIFC1 overexpression induced the clustering of amplified centrosomes in WPMY1 cells that were immunostained with ant-Centrin 2 (Fig. 8cii). Moreover, knockdown of Centrin 2 in PCa cells showed normal centrosome number and position during mitosis compared to the control which had bipolar spindle with amplified and clustered centrosomes (Figs. 8f–8g). Hence, KIFC1 induces the centrosome amplification and ensures the pseudo bipolar spindle formation by clustering the amplified centrosomes via interaction with Centrin 2 in PCa cells aids their survival. Interaction between Centrin 2 and the motor protein KIFC1 is required for connecting the centrosomes with mitotic spindle poles. The mechanism by which KIFC1-Centrin 2 complex holds centrosomes at spindle pole can be illustrate by a model whereby Centrin 2 captures the KIFC1-bound microtubules, resulting in centrosomal anchoring of interpolar microtubules by KIFC1-Centrin 2 complex. In this way, stabilizing the centrosome-spindle pole connection, KIFC1-Centrin 2 complex may increase the efficiency of centrosome clustering. Moreover, depletion of KIFC1 and Centrin 2 obstructed the centrosome amplification and clustering in PCa cells, suggesting their important role in centrosome aberration. So, up-regulation of KIFC1 derives the clustering of amplified centrosomes in PCa cells for their survival, and enhances the cancer cell proliferation possibly through aberrant activation of Cdk1 (Fig. 8h).
In summary, our study revealed that PCa cells showed amplified and clustered centrosomes during interphase and mitosis, respectively, suggesting centrosome aberrations might be a leading cause of prostate carcinogenesis. Up-regulated KIFC1 promoted the survival of PCa cells in vitro by inducing the bipolar mitosis through clustering the extra centrosomes. KIFC1 mediated the clustering of extra centrosomes in PCa cells to ensure bipolar spindle formation by interacting with Centrin 2. Conversely, depletion of KIFC1 and Centrin 2 in PCa cells inhibited the centrosome amplification and clustering. Besides, silencing of KIFC1 in PCa cells caused multi-polar mitosis via inhibition of clustering the amplified centrosomes, and decreased the cancer cell survival and growth. Moreover, upregulated KIFC1 might enhance the proliferation of PCa cell via acceleration of cell cycle probably through aberrant activation of Cdk1. Thus, KIFC1 can be a prognostic marker and strong chemotherapeutic target for PCa patients as well as CRPC patients.
Acknowledgement: We are grateful to the authority of Zhejiang University First Affiliated Hospital for helping us to collect the tissues from Prostate cancer patients.
Ethics Approval: Informed written consent was obtained from all patients, and study protocols involving human materials were approved by the institutional ethics committee of First Affiliated Hospital of Zhejiang University Hospital.
Funding Statement: This research was funded by Natural Science Foundation of Zhejiang Province, China (No. LY20H040010).
Conflicts of Interest: The authors declare that they have no conflicts of interest to report regarding the present study.
Bettencourt-Dias M, Glover DM (2007). Centrosome biogenesis and function: Centrosomics brings new understanding. Nature Reviews Molecular Cell Biology 8: 451–463. [Google Scholar]
Brown L, Cheng JT, Chen Q, Siciliano MJ, Crist W, Buchanan G, Baer R (1990). Site-specific recombination of the tal-1 gene is a common occurrence in human T cell leukemia. EMBO Journal 9: 3343–3351. [Google Scholar]
Chavali PL, Chandrasekaran G, Barr AR, Tátrai P, Taylor C, Papachristou EK, Woods CG, Chavali S, Gergely F (2016). A CEP215-HSET complex links centrosomes with spindle poles and drives centrosome clustering in cancer. Nature Communications 7: 11005. [Google Scholar]
Choe MH, Kim J, Ahn J, Hwang SG, Oh JS, Kim JS (2018). Centrosome clustering is a tumor-selective target for the improvement of radiotherapy in breast cancer cells. Anticancer Research 38: 3393–3400. [Google Scholar]
Chohan TA, Qayyum A, Rehman K, Tariq M, Akash MSH (2018). An insight into the emerging role of cyclin-dependent kinase inhibitors as potential therapeutic agents for the treatment of advanced cancers. Biomedicine & Pharmacotherapy 107: 1326–1341. [Google Scholar]
Dahm R, Procter JE, Ireland ME, Lo WK, Mogensen MM, Quinlan RA, Prescott AR (2007). Reorganization of centrosomal marker proteins coincides with epithelial cell differentiation in the vertebrate lens. Experimental Eye Research 85: 96–713. [Google Scholar]
Doxsey S, Zimmerman W, Mikule K (2005). Centrosome control of the cell cycle. Trends in Cell Biology 15: 303–311. [Google Scholar]
Enserink JM, Kolodner RD (2010). An overview of Cdk1-controlled targets and processes. Cell Division 5: 11. [Google Scholar]
Fu X, Zhu Y, Zheng B, Zou Y, Wang C et al. (2018). KIFC1, a novel potential prognostic factor and therapeutic target in hepatocellular carcinoma. International Journal of Oncology 52: 1912–1922. [Google Scholar]
Gergely F, Basto R (2008). Multiple centrosomes: Together they stand, divided they fall. Genes & Development 22: 2291–2296. [Google Scholar]
Godinho SA, Kwon M, Pellman D (2009). Centrosomes and cancer: How cancer cells divide with too many centrosomes. Cancer Metastasis Reviews 28: 85–98. [Google Scholar]
Holland AJ, Cleveland DW (2014). Polo-like kinase 4 inhibition: A strategy for cancer therapy? Cancer Cell 26: 151–153. [Google Scholar]
Jones MC, Askari JA, Humphries JD, Humphries MJ (2018). Cell adhesion is regulated by CDK1 during the cell cycle. Journal of Cell Biology 217: 3203–3218. [Google Scholar]
Joukov V, Walter JC, De Nicolo A (2014). The Cep192-organized aurora A-Plk1 cascade is essential for centrosome cycle and bipolar spindle assembly. Molecular Cell 55: 578–591. [Google Scholar]
Kleylein-Sohn J, Pöllinger B, Ohmer M, Hofmann F, Nigg EA, Hemmings BA, Wartmann M (2012). A centrosomal spindle organization renders cancer cells dependent on the kinesin HSET. Journal of Cell Science 125: 5391–5402. [Google Scholar]
Kloc M, Kubiak JZ, Li XC, Ghobrial RM (2014). The newly found functions of MTOC in immunological response. Journal of Leukocyte Biology 95: 417–430. [Google Scholar]
Kwon M, Godinho SA, Chandhok NS, Ganem NJ, Azioune A, Thery M, Pellman D (2008). Mechanisms to suppress multipolar divisions in cancer cells with extra centrosomes. Genes & Development 22: 2189–2203. [Google Scholar]
Leontovich AA, Salisbury JL, Veroux M, Tallarita T, Billadeau D, McCubrey J, Ingle J, Galanis E, D’Assoro AB (2013). Inhibition of Cdk2 activity decreases Aurora-A kinase centrosomal localization and prevents centrosome amplification in breast cancer cells. Oncology Reports 29: 1785–1788. [Google Scholar]
Li G, Chong T, Yang J, Li H, Chen H (2018). Kinesin motor protein KIFC1 is a target protein of miR-338-3p and is associated with poor prognosis and progression of renal cell carcinoma. Oncology Research 27: 125–137. [Google Scholar]
Lingle WL, Lukasiewicz K, Salisbury JL (2005). Deregulation of the centrosome cycle and the origin of chromosomal instability in cancer. Advances in Experimental Medicine and Biology 570: 393–421. [Google Scholar]
Liu Y, Zhan P, Zhou Z, Xing Z, Zhu S et al. (2016). The overexpression of KIFC1 was associated with the proliferation and prognosis of non-small cell lung cancer. Journal of Thoracic Disease 8: 2911–2923. [Google Scholar]
Löffler H, Fechter A, Matuszewska M, Saffrich R, Mistrik M, Marhold J, Hornung C, Westermann F, Bartek J, Krämer A (2011). Cep63 recruits Cdk1 to the centrosome: implications for regulation of mitotic entry, centrosome amplification, and genome maintenance. Cancer Research 71: 2129–2139. [Google Scholar]
Ma C, Cummings C, Liu XJ (2003). Biphasic activation of Aurora-A kinase during the meiosis I-meiosis II transition in Xenopus oocytes. Molecular and Cellular Biology 23: 1703–1716. [Google Scholar]
Malumbres M, Carnero A (2003). Cell cycle deregulation: A common motif in cancer. Progress in Cell Cycle Research 5: 5–18. [Google Scholar]
Marina M, Saavedra HI (2014). Nek2 and Plk4: Prognostic markers, drivers of breast tumorigenesis and drug resistance. Frontiers in Bioscience 19: 352–365. [Google Scholar]
McDonald HB, Stewart RJ, Goldstein LS (1990). The kinesin-like ncd protein of Drosophila is a minus end-directed microtubule motor. Cell 63: 1159–1165. [Google Scholar]
Mittal K, Choi DH, Klimov S, Pawar S, Kaur R et al. (2016). Centrosome clustering protein, KIFC1, predicts aggressive disease course in serous ovarian adenocarcinomas. Journal of Ovarian Research 9: 17. [Google Scholar]
Montañez-Wiscovich ME, Shelton MD, Seachrist DD, Lozada KL, Johnson E, Miedler JD, Abdul-Karim FW, Visvader JE, Keri RA (2010). Aberrant expression of LMO4 induces centrosome amplification and mitotic spindle abnormalities in breast cancer cells. Journal of Pathology 222: 271–281. [Google Scholar]
Morgan DO (2007). Cell cycle: Principles of control. Yale Journal of Biology and Medicine 80: 141–142. [Google Scholar]
Nigg EA (2002). Centrosome aberrations: cause or consequence of cancer progression? Nature Reviews Cancer 2: 815–825. [Google Scholar]
Nigg EA, Raff JW (2009). Centrioles, centrosomes, and cilia in health and disease. Cell 139: 663–678. [Google Scholar]
Ogden A, Garlapati C, Li XB, Turaga RC, Oprea-Ilies G et al. (2017). Multi-institutional study of nuclear KIFC1 as a biomarker of poor prognosis in African American women with triple-negative breast cancer. Scientific Reports 7: 42289. [Google Scholar]
Oghabi M, Safaroghli-azar A, Pourbagheri-sigaroodi A, Sayyadi M, Hamidpour M, Mohammadi MH, Bashash D (2020). Anti-proliferative effects of a small molecule inhibitor of CDK AT7519 on chronic myeloid leukemia (CML) cells through halting the transition of cells from G2/M phase of the cell cycle. Biocell 44: 183–192. [Google Scholar]
Pannu V, Rida PC, Ogden A, Turaga RC, Donthamsetty S et al. (2015). HSET overexpression fuels tumor progression via centrosome clustering-independent mechanisms in breast cancer patients. Oncotarget 6: 6076–6091. [Google Scholar]
Parvin A, Hao SL, Tan FQ, Yang WX (2020). Inhibition of kinesin motor protein KIFC1 by AZ82 induces multipolar mitosis and apoptosis in prostate cancer cell. Gene 760: 144989. [Google Scholar]
Parvin A, Hao SL, Tan FQ, Yang WX (2021). Corrigendum to Inhibition of kinesin motor protein KIFC1 by AZ82 induces multipolar mitosis and apoptosis in prostate cancer cell. Gene 769: 145232. [Google Scholar]
Pawar S, Donthamsetty S, Pannu V, Rida P, Ogden A, Bowen N, Osan R, Cantuaria G, Aneja R (2014). KIFCI, a novel putative prognostic biomarker for ovarian adenocarcinomas: delineating protein interaction networks and signaling circuitries. Journal of Ovarian Research 7: 53. [Google Scholar]
Qiao L, Zheng J, Tian Y, Zhang Q, Wang X, Chen JJ, Zhang W (2018). Regulator of chromatin condensation 1 abrogates the G1 cell cycle checkpoint via Cdk1 in human papillomavirus E7-expressing epithelium and cervical cancer cells. Cell Death & Disease 9: 583. [Google Scholar]
Ren J, Liang Q (2019). HMGB1 promotes the proliferation and invasion of oral squamous cell carcinoma via activating epithelial-mesenchymal transformation. Biocell 43: 199–206. [Google Scholar]
Rhys AD, Monteiro P, Smith C, Vaghela M, Arnandis T et al. (2018). Loss of E-cadherin provides tolerance to centrosome amplification in epithelial cancer cells. Journal of Cell Biology 217: 195–209. [Google Scholar]
Rieder CL, Faruki S, Khodjakov A (2001). The centrosome in vertebrates: More than a microtubule-organizing center. Trends in Cell Biology 11: 413–441. [Google Scholar]
Salisbury JL, Suino KM, Busby R, Springett M (2002). Centrin-2 is required for centriole duplication in mammalian cells. Current Biology 12: 1287–1292. [Google Scholar]
Sekino Y, Oue N, Shigematsu Y, Ishikawa A, Sakamoto N, Sentani K, Teishima J, Matsubara A, Yasui W (2017). KIFC1 induces resistance to docetaxel and is associated with survival of patients with prostate cancer. Urologic Oncology 35: 31.e13–31.e20. [Google Scholar]
Siegel RL, Miller KD, Jemal A (2020). Cancer statistics, 2020. CA: A Cancer Journal for Clinicians 70: 7–30. [Google Scholar]
van Neste L, Herman JG, Otto G, Bigley JW, Epstein JI, van Criekinge W (2012). The epigenetic promise for prostate cancer diagnosis. Prostate 72: 1248–1261. [Google Scholar]
Walczak CE, Vernos I, Mitchison TJ, Karsenti E, Heald R (1998). Model for the proposed roles of different microtubule based motor proteins in establishing spindle bipolarity. Current Biology 8: 903–913. [Google Scholar]
Watts CA, Richards FM, Bender A, Bond PJ, Korb O et al. (2013). Design, synthesis, and biological evaluation of an allosteric inhibitor of HSET that targets cancer cells with supernumerary centrosomes. Chemistry & Biology 20: 1399–1410. [Google Scholar]
Xiao YX, Shen HQ, She ZY, Sheng L, Chen QQ, Chu YL, Tan FQ, Yang WX (2017). C-terminal kinesin motor KIFC1 participates in facilitating proper cell division of human seminoma. Oncotarget 8: 61373–61384. [Google Scholar]
Yang C, Tian Y (2019). SPAG9 promotes prostate cancer growth and metastasis. Biocell 43: 207–214. [Google Scholar]
Zasadil LM, Andersen KA, Yeum D, Rocque GB, Wilke LG, Tevaarwerk AJ, Raines RT, Burkard ME, Weaver BA (2014). Cytotoxicity of paclitaxel in breast cancer is due to chromosome missegregation on multipolar spindles. Science Translational Medicine 6: 229ra43. [Google Scholar]
Zhang Y, Yuan Y, Liang P, Zhang Z, Guo X et al. (2017). Overexpression of a novel candidate oncogene KIF14 correlates with tumor progression and poor prognosis in prostate cancer. Oncotarget 8: 45459–45469. [Google Scholar]
Zhou H, Kuang J, Zhong L, Kuo WL, Gray JW, Sahin A, Brinkley BR, Sen S (1998). Tumour amplified kinase STK15/BTAK induces centrosome amplification, aneuploidy and transformation. Nature Genetics 20: 189–193. [Google Scholar]
Zyss D, Gergely F (2009). Centrosome function in cancer: Guilty or innocent? Trends in Cell Biology 19: 334–346. [Google Scholar]
SUPPLEMENTARY INFORMATION

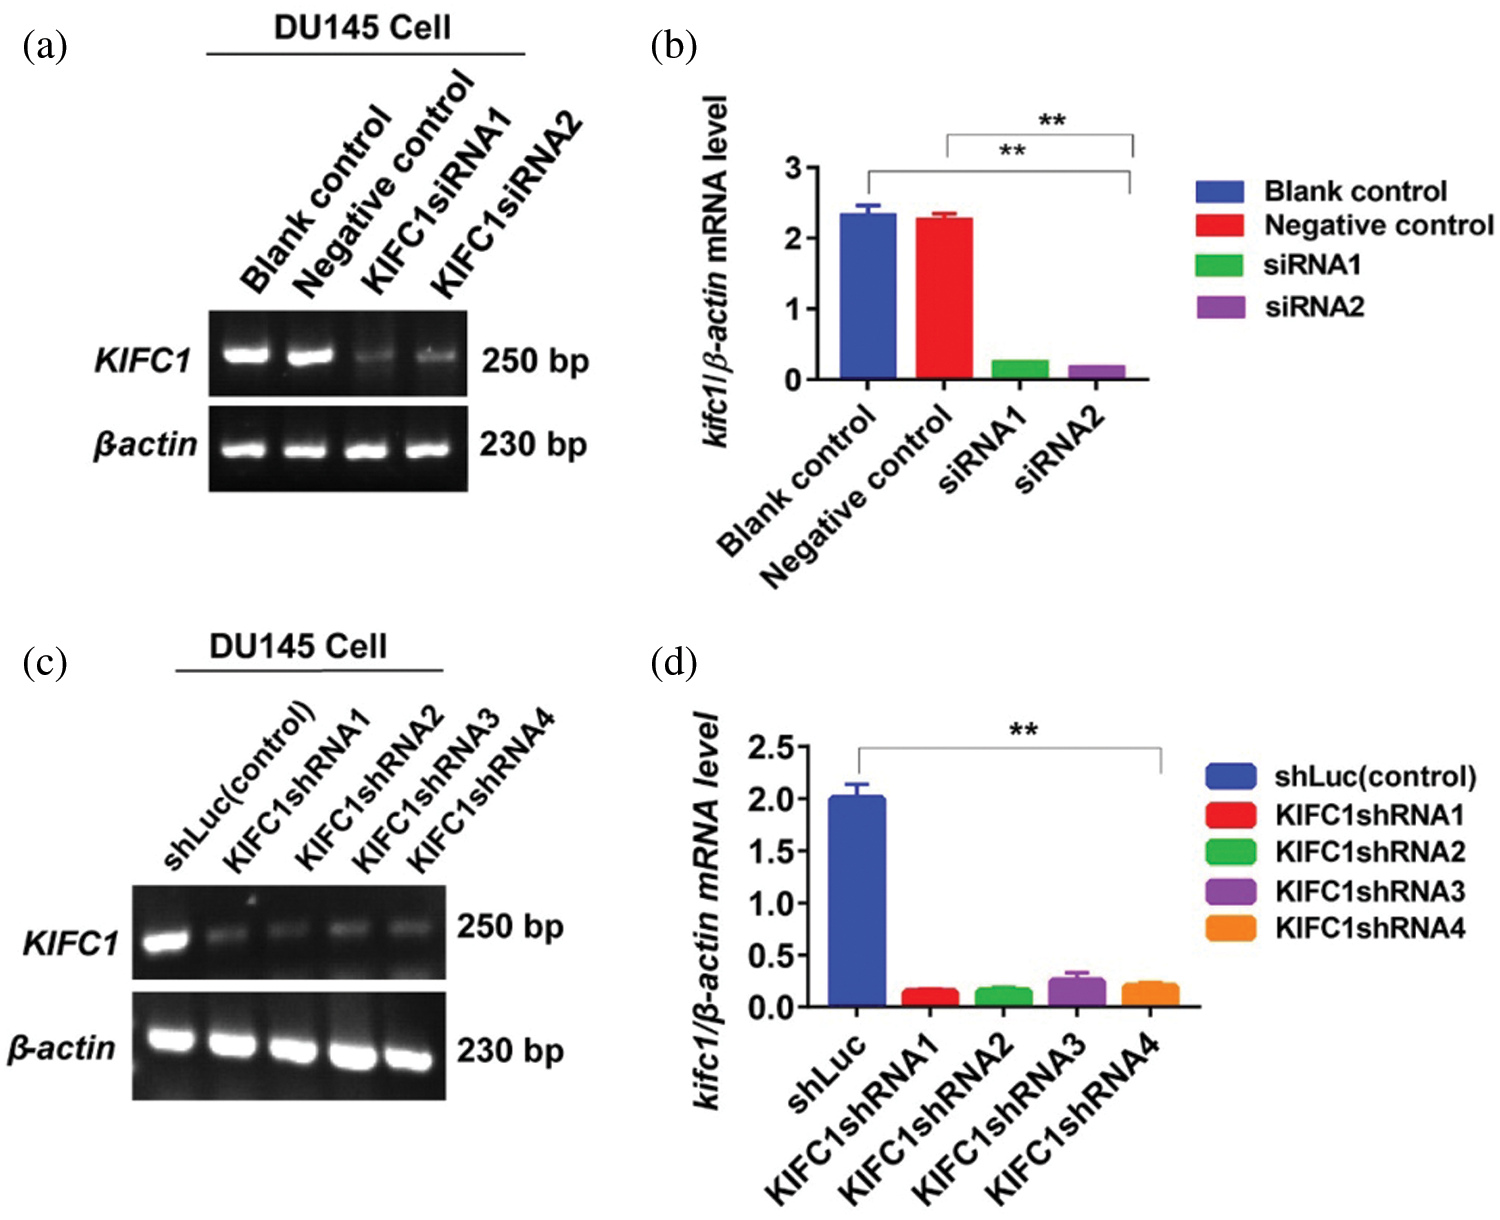
Supplementary figure S1: Knockdown efficiency of endogenous KIFC1mRNA in prostate cancer (PCa) cells by RNAi. (a–b) Analysis of the efficiency of KIFC1siRNA mediated KIFC1 silencing by detecting KIFC1mRNA in PCa cell (DU145) through semi-quantitative RT-PCR. Cells were transfected with siRNA of KIFC1 and negative control of KIFC1siRNA using a Lipofectamine® 2000. (c–d) Knockdown efficiency of endogenous KIFC1 by KIFC1shRNA in DU145 cells was analyzed through semi-quantitative RT-PCR. Silencing efficiency by KIFC1shRNAs was KIFC1shRNA3 > KIFC1shRNA4 > KIFC1shRNA1 > KIFC1shRNA2. KIFC1shRNAs and shLuc (control) expressing pRNAiU6.2 plasmids were transfected in PCa cells using a Lipo 6000TM cell transfection kit. Results were normalized to the β-actin expression level. The mRNA levels were quantified by Image J software. Error bars in graphs represent SEM from three independent experiments. **P < 0.01 by paired t-test.
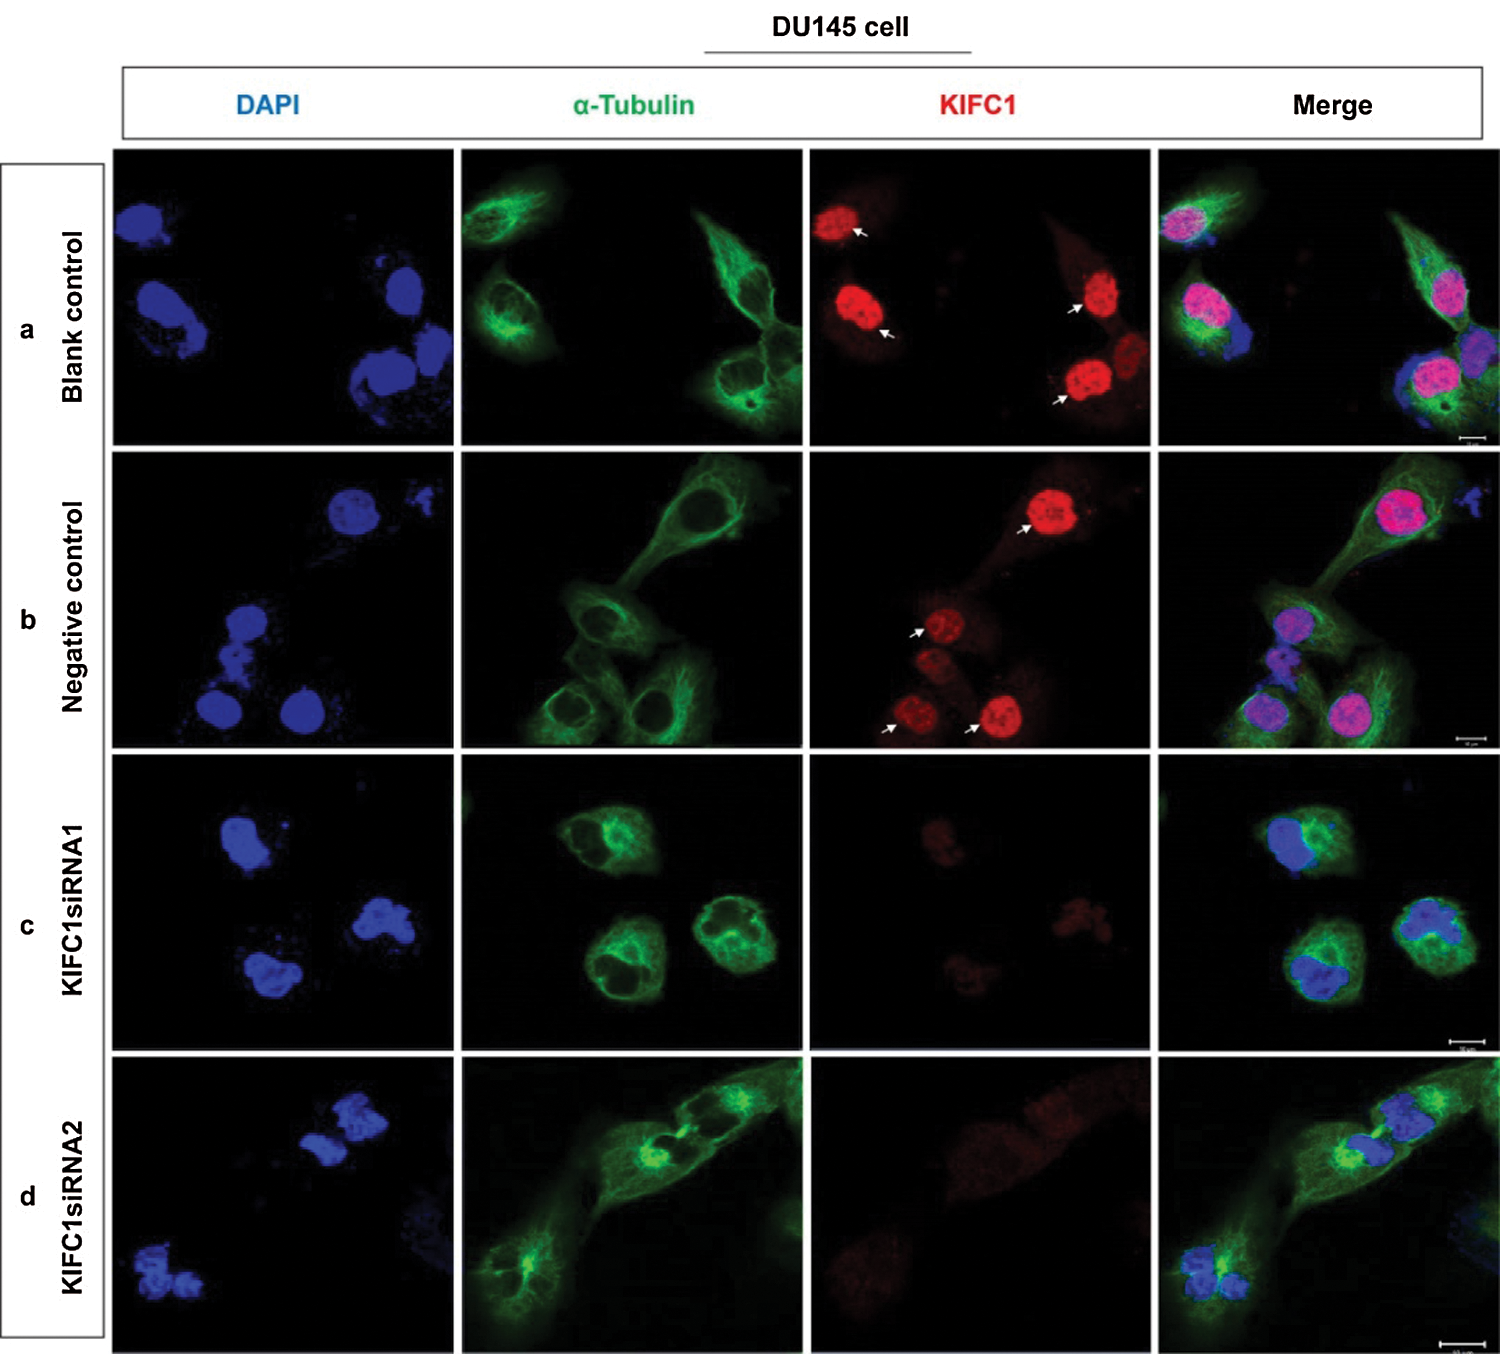
Supplementary figure S2: Analysis of the location and accumulation of KIFC1 and α-tubulin in the KIFC1-silenced prostate cancer (PCa) cell by immunofluorescence. (a–d) Confocal images show the location and accumulation of KIFC1 and α-tubulin in control (a,b), and KIFC1-knockdown groups (c,d) of prostate cancer cells (DU145). Scale bars: 20 μm. Arrows indicate the strong KIFC1 signals. Cells were stained with DAPI, anti-α-tubulin, and anti-KIFC1 antibody for observing nucleus (blue) α-tubulin (green) and KIFC1 (red). Cells were transfected with KIFC1siRNAs and negative control of KIFC1siRNA using a Lipofectamine® 2000.
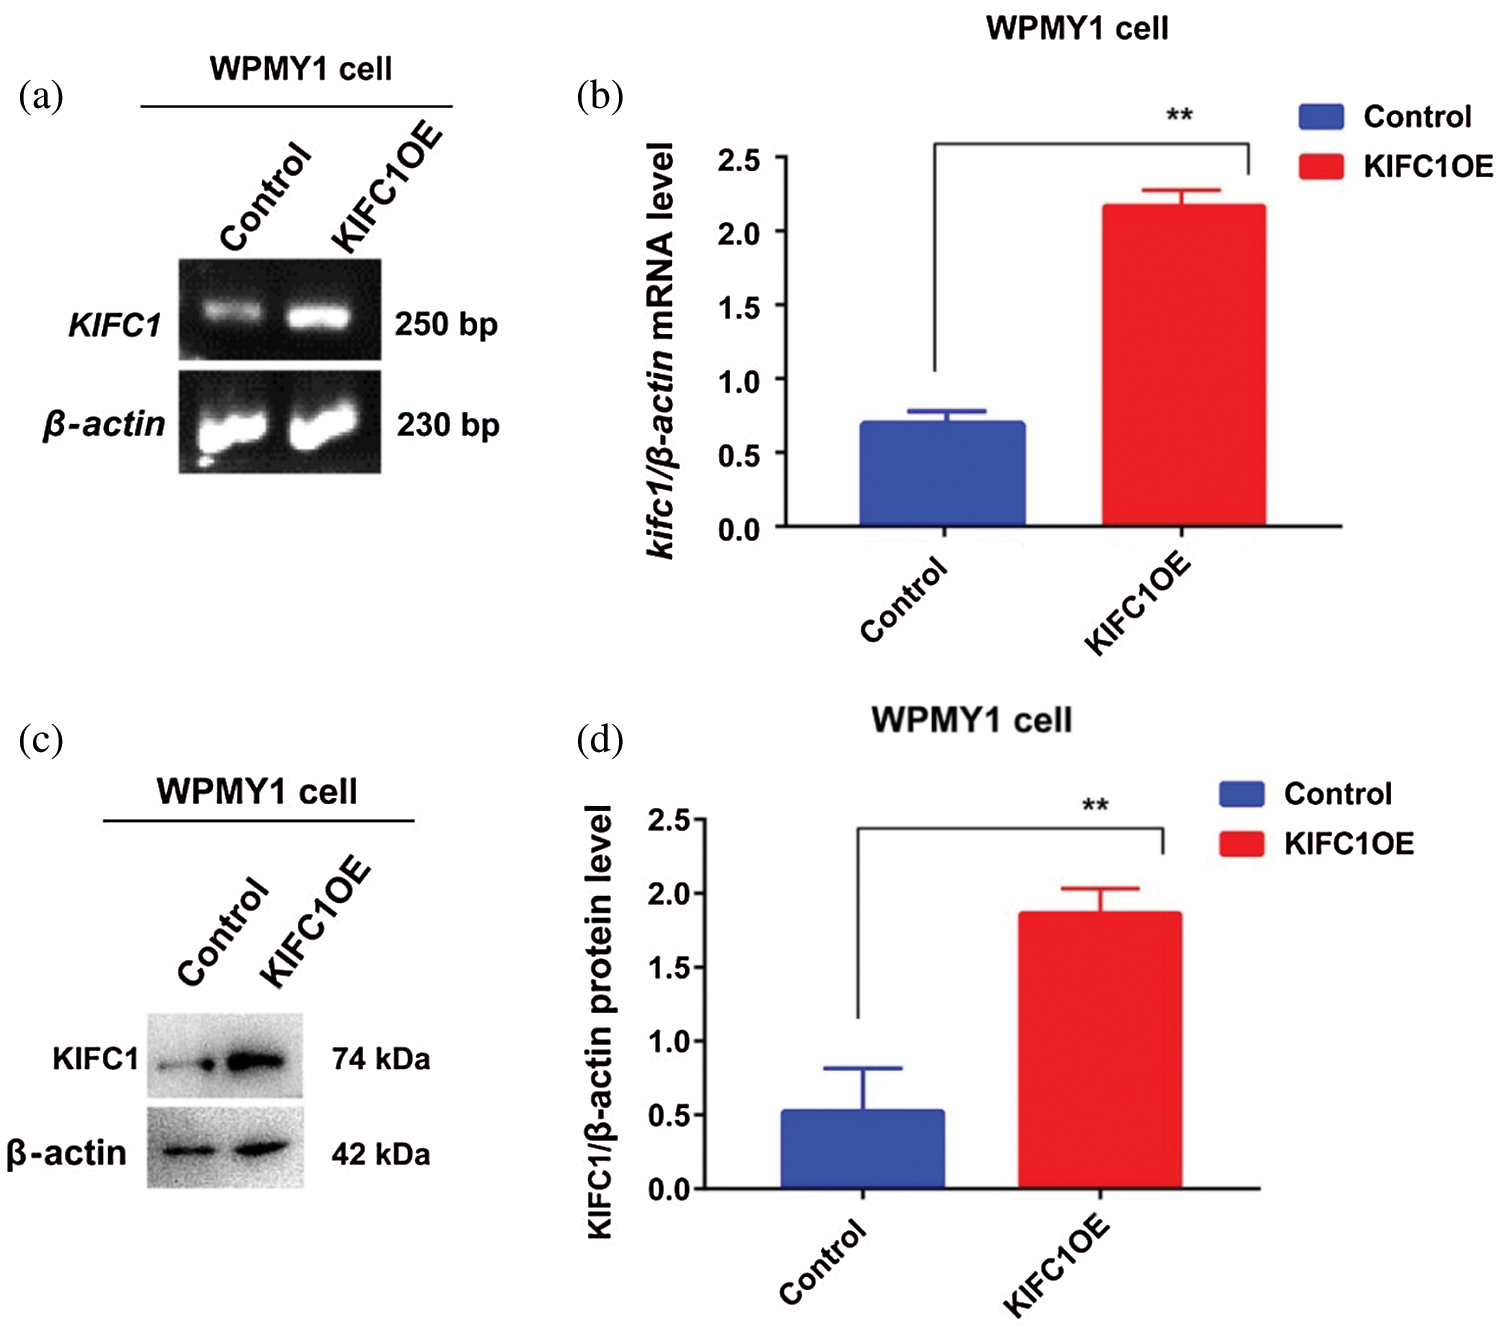
Supplementary figure S3: Analysis of overexpression efficiency of full-length KIFC1 (KIFC1FL) in prostatic stromal cell (WPMY1) by semi-quantitative RT-PCR and western blotting. (a–b) Analysis the KIFC1mRNA in control and KIFC1FL-overexpressing WPMY1 cells by semi-quantitative RT-PCR. β-actin was used as an internal control (c–d) Analysis of the KIFC1 protein level in control and KIFC1FL-overexpressing WPMY1 cells by western blotting. β-actin was used as an internal control. The mRNA and protein level were quantified by Image J software. Relative mRNA (b) and protein (d) level was measured by β-actin mRNA and β-actin protein level. Cells were transfected with KIFC1FL-overexpressing and empty (control) PCMV-N-Flag-EGFP plasmids using Lipofectamine® 2000 cell transfection kit.
Supplementary figure S4: Full blots of western blotting of Fig. 7g to analyze the stable interaction between KIFC1 and Centrin 2 in whole-cell extracts of DU145 cells that were immunoprecipitated with anti-Centrin 2 antibody. (a–b) Immunoprecipitation (IP) of whole-cell extracts of DU145 cells with anti-Centrin 2 antibody and then subjected to affinity purification to confirm the binding of KIFC1 to Centrin 2 in DU145 cells. IP was performed with an anti-Centrin 2 antibody (10 μL) in cell lysates from the DU145 cells. Results were analyzed by western blotting with the indicated antibodies (anti-KIFC1 and anti-Centrin 2 antibodies).
 | This work is licensed under a Creative Commons Attribution 4.0 International License, which permits unrestricted use, distribution, and reproduction in any medium, provided the original work is properly cited. |