DOI:10.32604/biocell.2021.017019
| BIOCELL DOI:10.32604/biocell.2021.017019 | |
| Article |
Repurposing of FDA-Approved drugs to predict new inhibitors against key regulatory genes in Mycobacterium tuberculosis
1Department of Pediatrics, 3201 Hospital, Hanzhong, China
2Centre for Interdisciplinary Research in Basic Sciences, Jamia Millia Islamia, New Delhi, India
3Department of Computer Science and Information Technology, Maulana Azad National Urdu University, Hyderabad, India
4Department of Computer Science, Jamia Millia Islamia, New Delhi, India
*Address correspondence to: Khalid Raza, kraza@jmi.ac.in
Received: 21 April 2021; Accepted: 25 May 2021
Abstract: Tuberculosis (TB) disease has become one of the major public health concerns globally, especially in developing countries. Numerous research studies have already been carried out for TB, but we are still struggling for a complete and quick cure for it. The progress of Mycobacterium tuberculosis (MTB) strains resistant to existing drugs makes its cure and control very complicated. Therefore, it is the need of the hour to search for newer and effective drugs that can inhibit an increasing number of putative drug targets. We applied the drug repurposing concept to identify promising FDA-approved drugs against five key-regulatory genes (FurB, IdeR, KstR, MosR, and RegX3) of the MTB. The FDA drugs were virtually screened using a structure-based approach by GOLD versions 5.2, and subjected to rigid docking followed by an induced-fit docking algorithm to enhance the accuracy and prioritize drugs for repurposing. We found 11 candidate drugs (including ZINC03871613, ZINC03871614, ZINC03871615 as top scorer candidate drugs) that were frequently present within the top 20 GoldScore ranks and showed promising results. Furthermore, molecular dynamics simulation was performed to monitor the effect of the top scorer drugs on the structural stability of all the five targets, indicating that inhibitors preferentially bind to the active site of the targets. This work suggests that these known FDA-approved drugs open new application domains in the form of anti-tuberculosis agents.
Keywords: Virtual screening; Molecular docking; MD simulation; PPI network
Tuberculosis (TB) is one of the oldest diseases with molecular evidence that dates back to17,000 years ago. Despite advances in modalities for diagnosis and treatment of TB, unfortunately, people are still suffering, and it is among the top 10 killer communicable diseases worldwide, second only to HIV. TB is a communicable disease caused by Mycobacterium tuberculosis. It typically affects the lungs (pulmonary TB) but can affect other sites as well (extra-pulmonary TB) (Ahmad, 2011). The disease is spread in the air when people who are sick with pulmonary diseases expel bacteria during coughing. According to WHO, six countries hold 60% of all the TB burden of the entire world in which India is the leading country followed by Indonesia, China, Nigeria, Pakistan, and South Africa (shown in Fig. 1). The Central TB Division, Ministry of Health and Family Welfare, India has published a report on “India TB report 2018” which reported TB statistics for India for 2016 to give an estimated incidence figure of 2.79 million cases of TB for India and up to 4.23 lakh patients were estimated to have died during the year (India TB Report, 2018). Multidrug-resistant (MDR) tuberculosis (TB) is a serious global public health problem (Dua et al., 2018), and estimates indicate that unless the management of MDR TB changes radically, it will be one of the main drivers of antimicrobial resistance, which could kill more persons than cancer by 2050 (Ho et al., 2016). Major challenges to curb the TB in India include poor primary healthcare system in rural areas, unregulated private health care leading to the indiscriminate use of first-line and second-line anti-TB drugs, spreading HIV infection, poverty, and lack of administrative coordination among government bodies responsible for health and hygiene (Singh et al., 2017). Hence, there is an urgent need to design or developed nontoxic biocompatible drugs against TB (Peters et al., 2020; Weiner et al., 2020).

Figure 1: Six leading countries account for 60% of the total, with India leading the count, followed by Indonesia, China, Nigeria, Pakistan, and South Africa (WHO).
In our study, we have used the drug repurposing concept, which is a method for disease cure that accelerates the identification of new uses for existing drugs with minimum side effects (Karaman and Sippl, 2019; Lanza et al., 2018; Savoia, 2016). Previous research has shown that the drug repurposing concept (a combination of virtual screening with docking and dynamics studies) can be successfully applied to treat new diseases with existing drugs. For example, the drug sildenafil, which was initially designed for the treatment of hypertension and ischemic heart disease, was later approved for the treatment of erectile dysfunction, representing a successful history of drug repurposing (Afzal et al., 2014; Karthick and Ramanathan, 2013; Li et al., 2001; Palos et al., 2017). Here, we use a computer-guided drug repurposing method and apply it to virtually screened FDA approved drugs against five key regulatory proteins from MTB: (a) FurB–as shown by the regulatory profiles, furB gene is up-regulated in macrophages-phagocytosed bacteria, fascinating that it might be involved in the regulation of intracellular gene expressions. The furB gene is co-transcribed with its upstream gene (Rv2358), which encodes another zinc-dependent regulator and responsible for repressing at least 32 genes, several of which have been implicated with zinc homeostasis. In addition, FurB controls five genes encoding ribosomal proteins three of which containing a putative zinc-binding motif. Based on comparative genomics data these ribosomal proteins have also been suggested to be involved in zinc homeostasis (Lucarelli et al., 2007; Panina et al., 2003). (b) IdeR–It is an iron-dependent regulator that maintains a moderate level of iron inside a bacterium by controlling the transcription of genes, including the expression of its own gene involved in iron uptake, transport, and storage (Banerjee et al., 2011). In M. tuberculosis regulation of the intracellular levels of iron are performed by the transcription factor IdeR.In the iron sufficient stage in MTB, iron binds and activates intracellular IdeR, which then represses the iron acquisition machinery of the pathogen and activates the synthesis of iron storage proteins. IdeR also plays a key role in protecting the cells against the oxidative stress generated by the host (Rohilla et al., 2017). (c) KstR–It is a highly conserved
Preparation of drug target and drug-library
In our study, we considered five key regulatory genes from MTB; FurB(PDB ID: 2O03) (Lucarelli et al., 2007), IdeR (PDB ID: 1B1B) (Pohl et al., 1999), KstR (PDB ID: 3MNL) (Ho et al., 2016), MosR (PDB ID: 4FX0) (Brugarolas et al., 2012) and RegX3 (PDB ID: 2OQR) (King-Scott et al., 2007), details are given in Fig. 2. All the atomic coordinates (x-ray structure with good resolution, from 1.8Å to 2.7Å) of these proteins were downloaded from Protein Data Bank (Berman et al., 2000). The proteins were optimized for docking by following standard procedures, which include removal of crystallographic water molecules, the addition of missing H-atoms, and minimizing the energy level of all the proteins using the Swiss-PDB viewer tool and this server provides an energy minimization facility using the GROMOS96 force field (Alam et al., 2016; Johansson et al., 2012). All the targets were further refined using SCWRL 4.0 tool to minimize side-chain to backbone clashes and the side-chain-to-side chain clashes (Wang et al., 2008). The drug library consists of

Figure 2: Key regulatory genes from MTB. FurB (PDB ID: 2O03), IdeR (PDB ID: 1B1B), KstR (PDB ID: 3MNL), MosR (PDB ID: 4FX0) and RegX3 (PDB ID: 2OQR).
Virtual screening (VS) is a computational method used in drug designing and discovery to find out the series of (compound library) small molecules in order to identify the most potent molecules which are most likely to bind to a drug target (Krueger et al., 2016; Morrone Xavier et al., 2016; Rester, 2008; Rollinger et al., 2008). In our study, VS was performed by using GOLD versions 5.2 (Genetic Optimisation for Ligand Docking; Cambridge Crystallographic Data Centre) (Jones et al., 1995; Jones et al., 1997). GOLD uses genetic algorithms to dock ligand with the receptor. The scoring function “GoldScore” was tested individually for each protein. The molecular docking that utilizes the genetic algorithm (GA) was set to three different execution runs–(a) 50, (b) 100, and (c) 200 GA runs, so as to identify influential and high-affinity binding modes. The radius of the docking sphere was 10–12 Å centered at the position, a maximum of 100,000 operations were performed that deliver high prediction accuracy but are relatively slow (Heberlé and De Azevedo, 2011; Potemkin and Grishina, 2018). The information on the binding site for all the targets was observed from the available literature which was then used further for grid generation. For FurB and IdeR, we used its active repressor site (Lucarelli et al., 2007) for KstR and MosR, we used its DNA binding site (Brugarolas et al., 2012; Ho et al., 2016) and for RegX3, we used its conformational switch region (present ‘hotspot’ residues) (Ahmad et al., 2015; Khalid et al., 2018).
As we are aware of the remarkable biological functions of proteins and DNA and also their profound dynamic mechanisms which include switching between active and inactive states (Autiero et al., 2013), cooperative effects the intercalation of drugs into DNA (Chou and Mao, 1988), and allosteric transition (Ward et al., 2010) can be unveiled by studying their internal motions (Lin and Lapointe, 2013). Likewise, to understand the action mechanism of receptor-ligand binding, we should not consider only the static structures concerned, but also the dynamical information obtained by simulating their internal motions or dynamic processes (de Azevedo, Jr et al., 2001; de Azevedo, 2011; Qazi and Raza, 2021). To realize this, initially, MD Simulations were performed for proteins only, e.g., FurB,IdeR, KstR, RegX3, and MosRat 300K to investigate the stability profile. We observed that drug ZINC03871613 was best docked with the three targets (FurB, KstR, and RegX3), and drugs ZINC03871615, ZINC03871614 were docked with MosR and IdeR targets, respectively. These are the best candidate drugs that exhibit high binding affinity with the targets. To observe conformational changes due to the presence of ligands in the active site, we performed MD simulations for protein complexes too.
Molecular dynamics (MD) simulations were performed using the GROMACS version 5.1 software (van der Spoel et al., 2005) with the standard GROMOS
Protein–Protein interaction network
The protein-protein interaction (PPI) networks are much important for the system-level understanding of cellular processes (Cau et al., 2018). Such networks are used for screening and evaluation of functional genomics data and provide an instinctive platform for annotating structural, functional, and evolutionary properties of proteins. The five proteins (FurB, IdeR, KstR, RegX3, and MosR) were taken as seed proteins from which we obtained direct and indirect PPIs using theSTRING 10.5 database (Snel et al., 2000). This database provides details on both predicted and experimentally verified interactions from different sources based on their neighborhood, co-occurrence, co-expression, gene fusions, experiments, and literature mining. We constructed a PPI network based on high confidence interaction which means that only interactions with a high level of confidence are considered as potential associations in the PPI network.
In the first step, the library of FDA approved drugs were screened using GOLD versions 5.2 server. Dock runs of all 1985 drugs on targets namely “FurB (binding cavity: His-81, His-83, Cys-76, Glu-78, Asp-24, Asp-62, etc.), IdeR (binding cavity: Glu-20, Asp-17, Arg-80, etc.), KstR (binding cavity: Arg-174, Glu-112, Pro-108, Trp-17, etc.), RegX3 (binding cavity: Pro-102, Tyr-103, Ser-104, etc.) and MosR (binding cavity: Thr-36, His-287, Glu-244, etc.)” using GOLD suite (with 50 GA runs were performed) resulted in a few best candidate drugs evaluated based on the Gold fitness score
We found a total of

Figure 3: The plot represents the Gold Score of compounds that have scored equal, or above the threshold value of 55.0. (A) IdeR bind with 355 compounds (B) KstR bind with 193 compounds (C) MosR bind with 157 compounds (D) FurB bind with 111 compounds (E) RegX3 bind with 12 compounds.
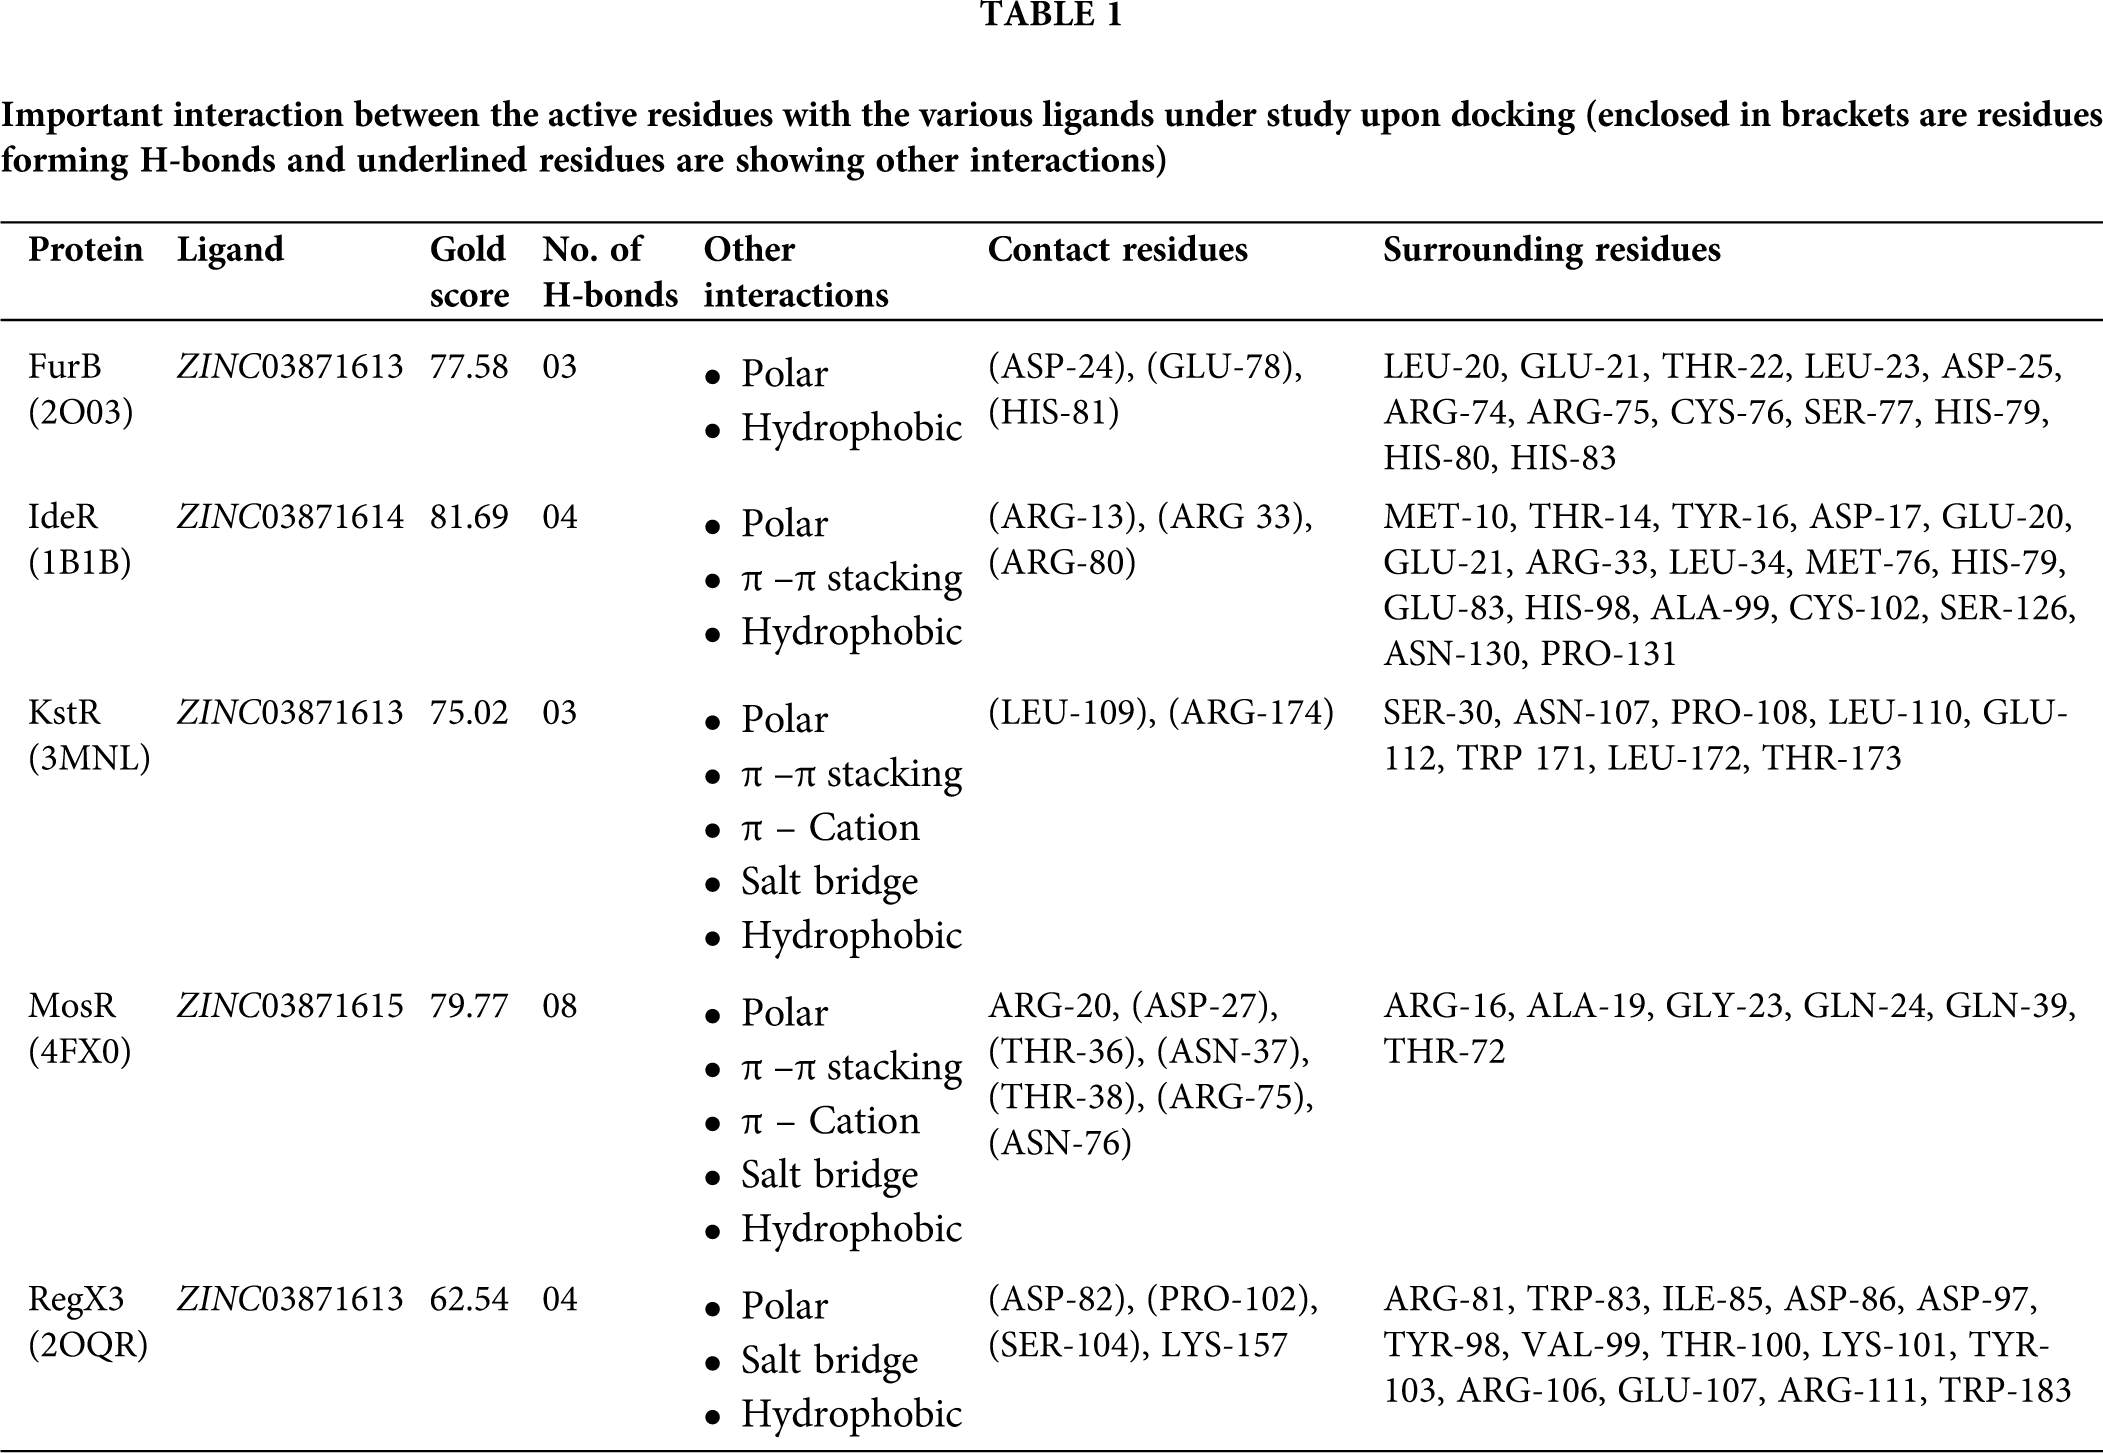
The consistent binding idea was given preference for the selected 11 candidate drugs over top 20 (for each target) as a matter of feasibility towards in-vitro or in-vivo testing for these bindings. The 2D structures of these 11 candidate drugs can be obtained from the ZINC-15 database (https://zinc15.docking.org/). In this study, we have visualized only top-ranked candidate drugs which are best bound with the targets like FurB, KstR, and RegX3, are docked with ZINC03871613, while IdeR and MosR are docked with ZINC03871614, and ZINC03871615 with GoldScore 77.58, 75.02, 62.54, 81.69, and 79.72, respectively. While studying the docked conformation of the FurB complex, mainly the three residues, ASP-24, GLU-78, and HIS-81 were found to form H-bonds with the ligands in the docked complex along with 12 surrounding residues. As in the case of KstR and RegX3 complexes, ASP-82, PRO-102, SER-104, and LYS-157 (also forms salt bridge interaction) and the residues LEU-109, ARG-174 (also forms π–π and π-cation and salt bridge interactions) make H-bond with the ligand along with 14 and eight surrounding residues, respectively. While in the case of the MosR complex, the residues, ARG-20 (also make π–π and π-cation interaction), ASP-27, THR-36, ASN-37, THR-38, ARG-75 (also forms salt bridge interaction), and ASN-76 while in the IdeR complex, the residues ARG-13, ARG 33, ARG-80 (also make π–π interaction) were seemed to make H-bonds with the ligands along with six and 17 surrounding residues, respectively. The complete details are given in Fig. 4 and Tab. 1. All the top scorer candidate drugs are purine derivatives in the form of triphosphate and the basic difference among them is in the cyclic pyranose which are isomers of each other due to the different spatial orientation of the hydroxyl group.
We performed MD simulation at 300K of the protein-ligand complex with top-ranked drugs to observe the effect on the structure, behavior, and flexibility of all the targets. We analyzed the RMSD, RMSF, RG, and SASA for all the selected targets, as shown in Fig. 5.


Figure 4: Binding poses are suggested by molecular docking. (A) Molecular docking poses of compound ZINC03871613 with FurB. (B) Compound ZINC03871614 docked with IdeR. (C) Compound ZINC03871613 docked with KstR. (D) Compound ZINC03871615 docked with MosR. (E) Compound ZINC03871613 docked with RegX3. The 2D depiction of the binding pocket and interactions are generated using Maestro with a 4.0 A cutoff. Protein residues forming hydrogen bonds are indicated with two different magenta lines (i) solid lines (backbone) (ii) dashes lines (side chain). The π-π stacking interaction between residues and the aromatic ring of the ligand is shown in the green solid line while π-Cation is a non-covalent molecular interaction is shown in the red solid line.

Figure 5: Molecular dynamics study. In this figure, we have shown RMSD, RMSF, RG, and SASA values each at 300k for our all targets (FurB, IdeR, KstR, MosR, and RegX3). The target protein and the complex (protein with ligands) are shown in green and red color, respectively.
a) Root-mean-square deviations (RMSD) from the native structure coordinates during the MD simulation were used to assess the stability and the reliability of the simulation. In our study, we noticed that
b) In the case of the IdeR, the trajectory (RMSD) remains stable throughout the simulation with small drifts, but the fluctuations were smaller too for the
c) In the case of theRegX3, the trajectory (RMSD) drastically fluctuated with large drifts, but the fluctuations were smaller for the
d) In the case of the MosR, the trajectory (RMSD) drastically fluctuated with large drifts, but the fluctuations were smaller for the
e) In the case of the KstR, the trajectory (RMSD) remains stable throughout the simulation with small drifts of
The root mean square fluctuation (RMSF)
a) We have performed RMSF from its time-averaged position to set up the conformational fluctuations of the FurB and FurB complex at the residual level. The average residual fluctuation of all the residues in the case of
b) RMSF analysis for the
c) On analyzing the fluctuations in the
d) In RMSF analysis of theMosR, we observed that fluctuation of amino acids was largest in the two regions from 14–40 and 44–110 residues, in both MosR and
e) The fluctuations of KstR are less than
a) The radius of gyration (
b) In the presence of ligand with IdeR protein, the average
c) In the case of RegX3, we observed structural fluctuations throughout the simulation, but in the case of
d) In the presence of ligand with MosR, the average
e) In presence of ligand with KstR protein, at two points, lower transitions were observed, and the system’s overall compactness witnessed an increase after
Solvent accessible surface area
a) Solvent accessible surface area (SASA) remained relatively constant for the FurB protein at
b) In the case of IdeR, we observed the structural fluctuations in SASA throughout the simulation, but these fluctuations diminish later on and the overall system is optimized after
c) In the case of RegX3, SASA remained stable up to
d) The SASA remained relatively constant for the MosR at
e) In the case of KstR protein and complex, gradual upper transition and lower transition were observed, respectively, but SASA remained relatively constant, and the overall system is optimized after
Network analysis and nodes characterization
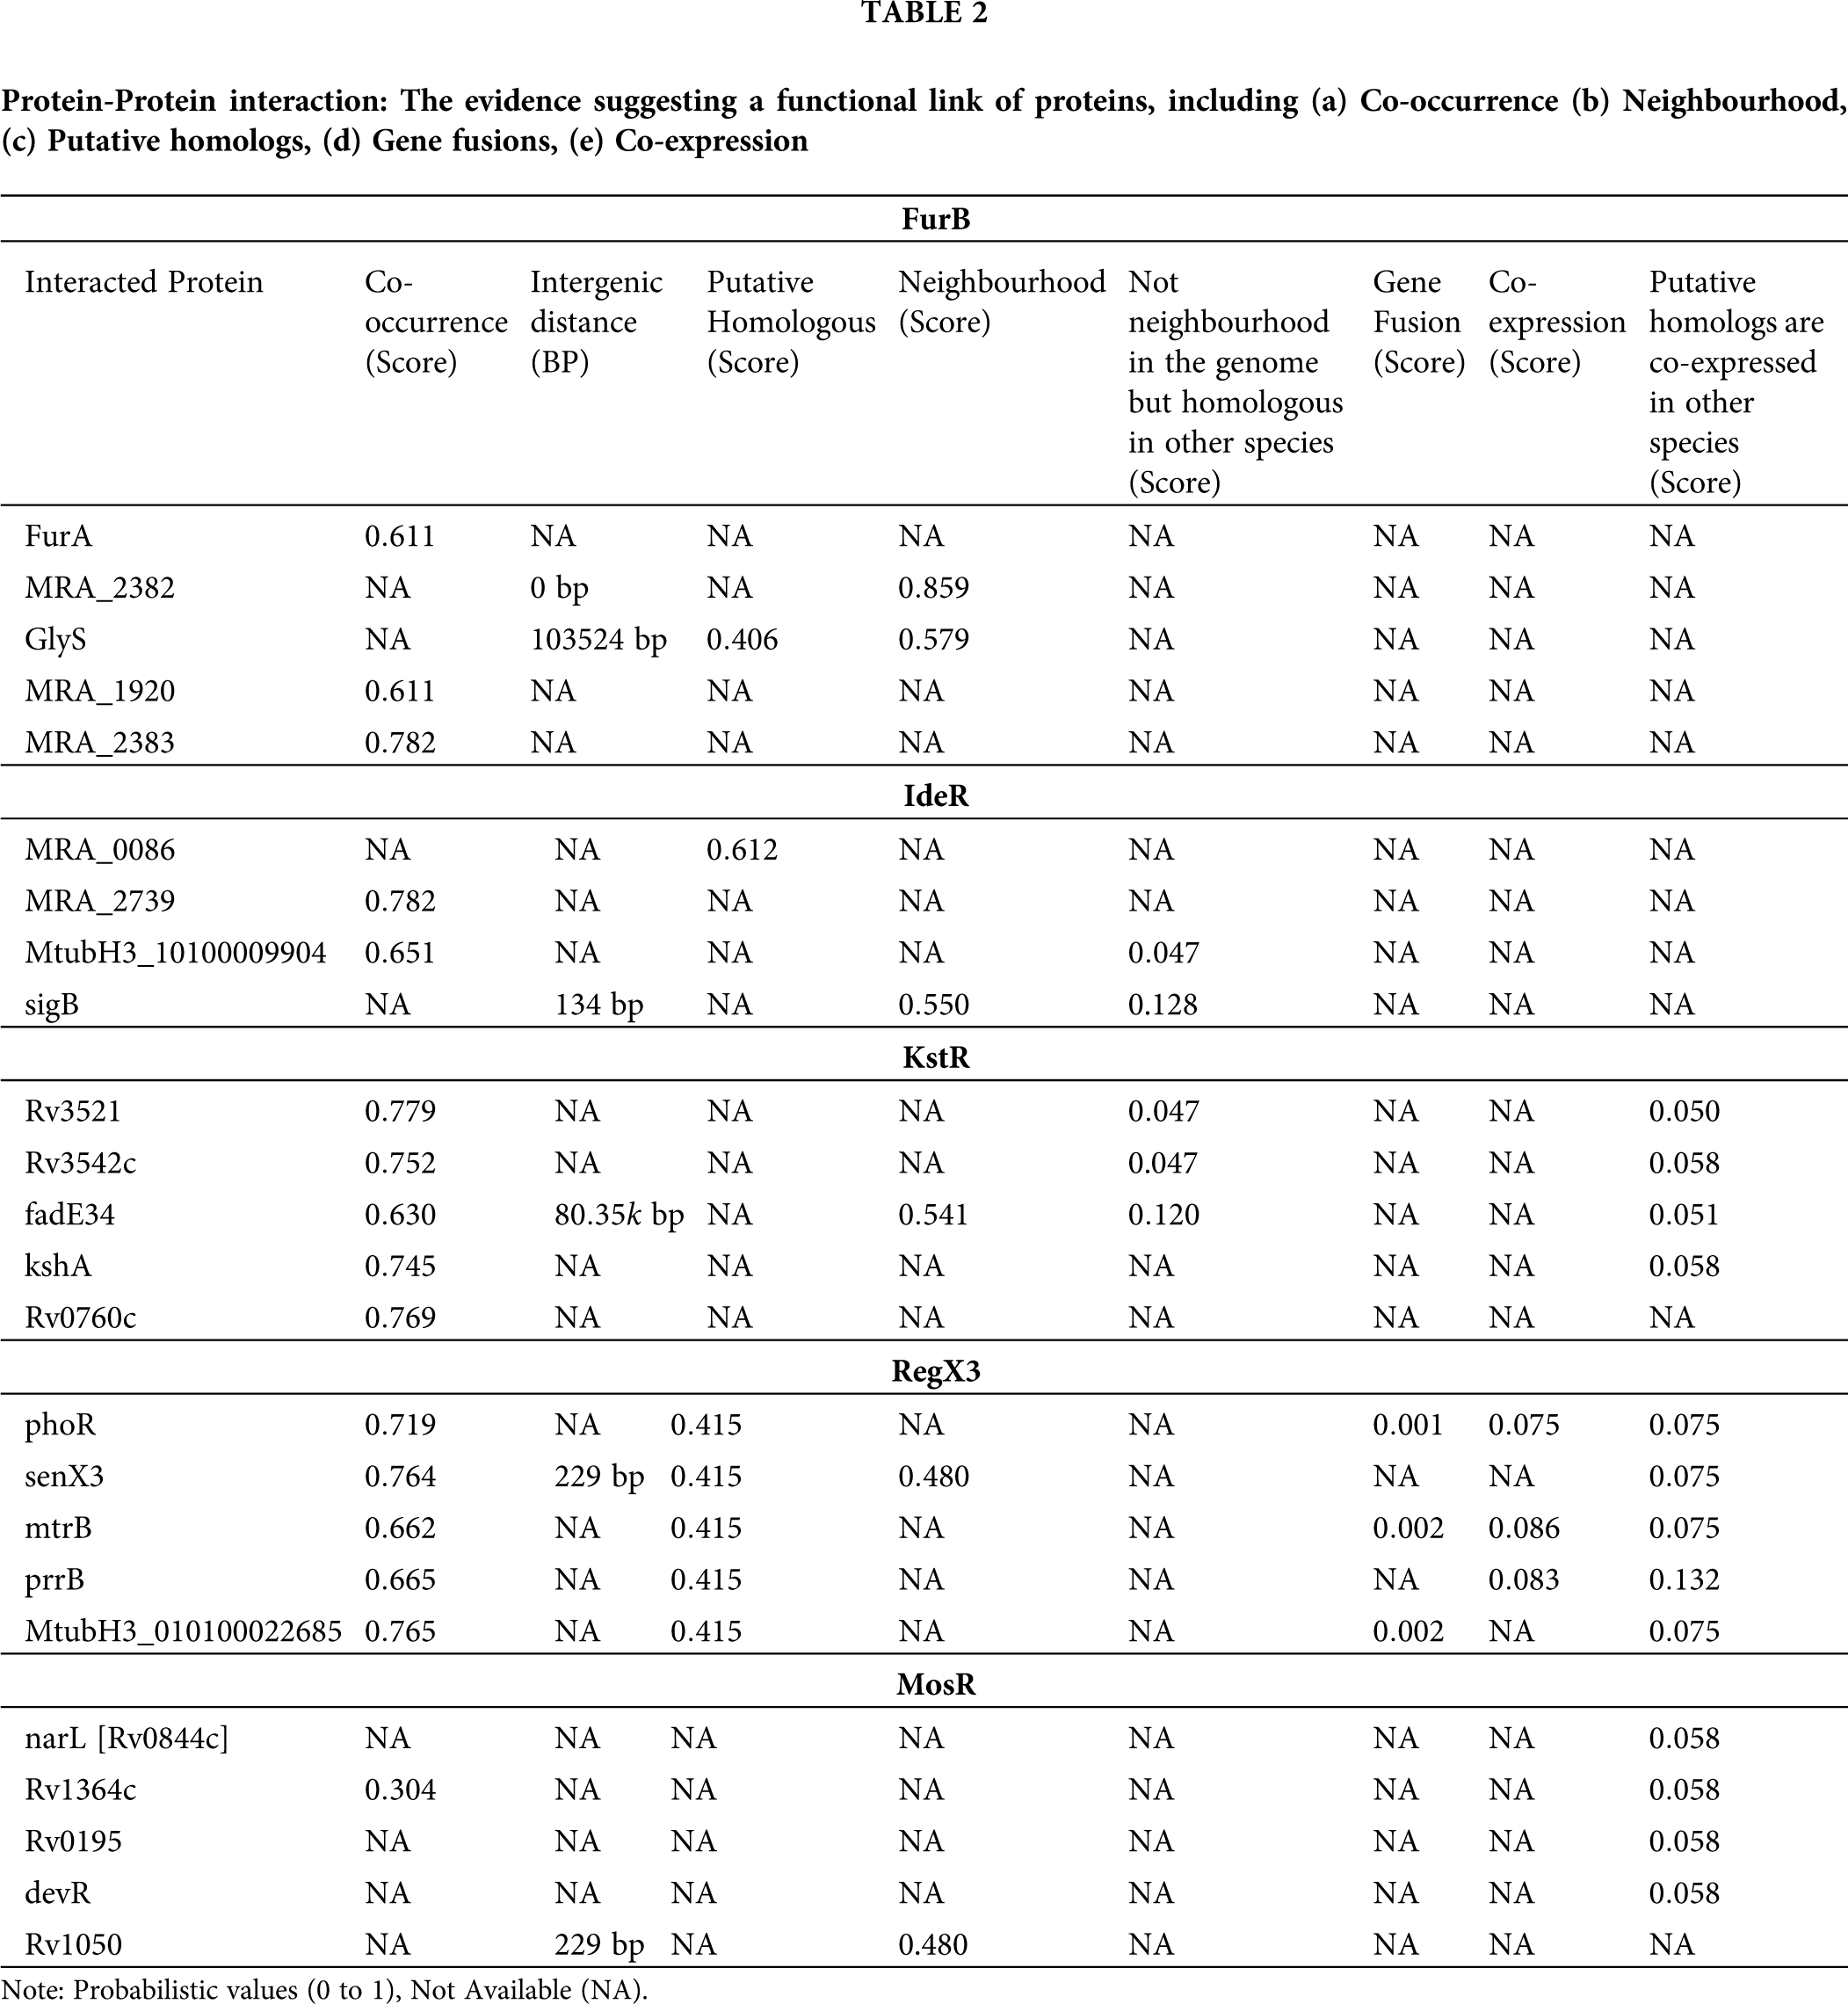
The Protein-protein interaction (PPI) network was constructed using the five seed genes from the STRING database. In the present study, we considered only the immediate interacting partners (not more than 5 interactors) that abided the medium confidence score of 0.400. We have considered occurrence across the genome (suggesting that protein has a similar function or an occurrence in the same metabolic pathway further which to be expressed together and hold similar phylogenetic profile.), neighborhood (similar genomic context in different species suggesting similar functions of the proteins), putative homologs, gene fusions (that means proteins that are fused in some genomes are the most likely to be functionally linked), co-expression. We observed that FurB is present in the neighborhood of

Figure 6: Analysis of protein-protein interaction (PPI) using STRING 10.5 server. The figure illustrates the PPI neighborhood of the 5 receptors (FurB, IdeR, KstR, RegX3, and MosR), the nodes of the graph represent proteins and the connections illustrate their known or predicted direct and indirect interactions. The connection between any two proteinnodes is based on the available information mined from relevant.
Till now TB has claimed the lives of millions of people across the world, despite our continuous efforts it is emerging as the next challenge for us to eradicate this ailment. Here we have tried to identify new scaffolds for drug discovery by repurposing FDA-approved drugs against M. tuberculosis. Almost all drugs repositioning concepts require at least some experimental validation of assessment for its efficacy, therefore we have adopted an in-silico approach to support experimental work in developing effective drugs in a shorter duration. Our systematic study has highlighted several important observations; molecular docking analysis of a set of
The ROC curve applied to the retrospective analysis of a virtual screening experiment is a plot of the true positive fractions (TPR, y-axis) versus false positive fractions (FPR, x-axis) for all drugs in a ranked dataset. The ROC curve analysis reveals either perfect discrimination, i.e., passes through the upper left corner (100% sensitivity, 100% specificity), or defective discrimination. Therefore, the closer the ROC curve is to the upper left corner, the higher the overall accuracy of the test58. The area under the ROC curve (ROC AUC) outlines the overall performance thus higher the AUC, the higher is the accuracy. In this case, we performed former experimentin order to identify the interaction capability of the targets with other potential based on the fitness value calculated using various parameters, e.g., interaction entropy. We found fitness values give a perfect discrimination, i.e., highly accurate, while interaction entropy contributes to the larger part of this perfection in each case (for both active and inactive ligands) as shown in ROC curve analysis of active and inactive ligands against targets in Fig. 7.
The protein-ligand complex with top-ranked drugs was used for the dynamics simulation study in order to see the effect of top scorer drugs on the structural stability of all five targets. It was found that these top scorer drugs preferentially fit into the active site of the targets. RMSD of all the protein’s initial structures and protein-ligand complexes were calculated. Throughout the simulation period, significant drifts were observed in the backbone of FurB, IdeR, KstR, RegX3, and MosR and protein-ligand complexes, implying that binding of drug candidates at the active sites of the targets is not only preferentially fitting, but also disturbs the structure of proteins, i.e., the structure became more compact that is also proved by RG-score analysis (The lowest radius of gyration mean more compact structure). RMSF analysis suggests that the observed residual fluctuations were largest in active sites of proteins that confirm the important role being played by these residues in the ligand-binding process. The significant drifts in native structures and protein-ligand complexes were observed in SASA analysis. The decrease in SASA caused by the change in protein conformation during its folding must be accompanied by the corresponding increase in the number of native contacts with ligand, clearly indicating that ligands tightly fit into the active sites. We performed hydrogen bond analysis and extracted the complex at the particular interval (5000, 10,000, 15,000, 20,000 ps, respectively) in the PDB format using g_h bond utility of GROMACS. However, we have noticed that one or two residues (that formed H-bonds from ligands) from each protein are common in all 4 intervals of time (5, 10, 15, 20 ns) that indicate that ligands are tightly bounds in the active sites. Apart from virtual screening and simulation study, we analyzed the PPI network of target proteins to evaluate the functional genomics information and for providing an instinctive platform for annotating structural, functional, and evolutionary properties of proteins. For a better understanding of the effects of cellular interconnectedness on disease progression the analysis of PPI’s may lead to the detection of disease genes and disease pathways, which may offer better targets for drug development. It has been clearly shown that the method utilized in this study is successful in finding out the most promising drug candidates against these targets that play a key role in the progression of TB disease. This work can be further explored to study the receptor-ligand interactions experimentally and assessment of their biological activity would help in specifying drugs against these key targets of MTB.
Tuberculosis (TB), being one of the major public health concerns, still lacks a complete and quick cure due to the Mycobacterium tuberculosis (MTB) strains resistant to existing drugs. Hence, it is important to look for new and effective drugs that can inhibit several putative drug targets. In this paper, we executed a computational drug repurposing pipeline to identify promising FDA-approved drugs against five key-regulatory genes of Mtb, namely, FurB, IdeR, KstR, MosR, and RegX3. Our study found 11 drug candidates including ZINC03871613, ZINC03871614, and ZINC03871615 as the top three drug candidates. In order to validate these results, a molecular dynamics simulation study was performed which indicates that inhibitors preferentially bind to the active site of the targets. This finding opensa new application domain in the form of anti-tuberculosis agents. This study can be further extended to explore the receptor-ligand interactions experimentally and assessment of their biological activity against key targets of MTB.


Figure 7: ROC curve analysis of active and inactive ligands against targets.
Availability of Data and Materials: Available on request to the authors.
Author Contribution: The idea was conceived by XY and KR, an experiment was designed by AA and KR, result analysis by AA, and the manuscript written by XY, AA, and KR. All authors reviewed the results and approved the final version of the manuscript.
Conflicts of Interest: The authors declare that they have no conflicts of interest to report regarding the present study.
Afzal O, Kumar S, Kumar R, Firoz A, Jaggi M, Bawa S (2014). Docking based virtual screening and molecular dynamics study to identify potential monoacylglycerol lipase inhibitors. Bioorganic & Medicinal Chemistry Letters 24: 3986–3996. [Google Scholar]
Ahmad A, Cai Y, Chen X, Shuai J, Han A (2015). Conformational dynamics of response regulator RegX3 from Mycobacterium tuberculosis. PLoS One 10: e0133389. [Google Scholar]
Ahmad F, Kumar S (2016). Rewiring of interconnected hubs in Gene Interaction Network of Mycobacterium tuberculosis and its survival in human host. Journal of Applied Computing 1: 38–50. [Google Scholar]
Ahmad S (2011). Pathogenesis, immunology, and diagnosis of latent Mycobacterium tuberculosis infection. Clinical and Developmental Immunology 2011: 814943. [Google Scholar]
Alam A, Ali S, Ahamad S, Malik MZ, Ishrat R (2016). From ZikV genome to vaccine: in silico approach for the epitope-based peptide vaccine against Zika virus envelope glycoprotein. Immunology 149: 386–399. [Google Scholar]
Almatar M, Almandeal H, Var I, Kayar B, Köksal F (2017). New drugs for the treatment of Mycobacterium tuberculosis infection. Biomedicine & Pharmacotherapy 91: 546–558. [Google Scholar]
Autiero I, Langella E, Saviano M (2013). Insights into the mechanism of interaction between trehalose-conjugated beta-sheet breaker peptides and Aβ (1-42) fibrils by molecular dynamics simulations. Molecular BioSystems 9: 2835–2841. [Google Scholar]
Banerjee S, Farhana A, Ehtesham NZ, Hasnain SE (2011). Iron acquisition, assimilation and regulation in mycobacteria. Infection, Genetics and Evolution 11: 825–838. [Google Scholar]
Berman HM, Westbrook J, Feng Z, Gilliland G, Bhat TN et al. (2000). The protein data bank. Nucleic Acids Research 28: 235–242. [Google Scholar]
Bjelkmar P, Larsson P, Cuendet MA, Hess B, Lindahl E (2010). Implementation of the CHARMM force field in GROMACS: Analysis of protein stability effects from correction maps, virtual interaction sites, and water models. Journal of Chemical Theory and Computation 6: 459–466. [Google Scholar]
Brugarolas P, Movahedzadeh F, Wang Y, Zhang N, Bartek IL et al. (2012). The oxidation-sensing regulator (MosR) is a new redox-dependent transcription factor in Mycobacterium tuberculosis. Journal of Biological Chemistry 287: 37703–37712. [Google Scholar]
Carroll P, Faray-Kele MC, Parish T (2011). Identifying vulnerable pathways in Mycobacterium tuberculosis by using a knockdown approach. Applied and Environmental Microbiology 77: 5040–5043. [Google Scholar]
Cau Y, Valensin D, Mori M, Draghi S, Botta M (2018). Structure, function, involvement in diseases and targeting of 14-3-3 proteins: An update. Current Medicinal Chemistry 25: 5–21. [Google Scholar]
Cheatham T, Miller J, Fox T, Darden T, Kollman P (1995). Molecular dynamics simulations on solvated biomolecular systems: The particle mesh Ewald method leads to stable trajectories of DNA, RNA, and proteins. Journal of the American Chemical Society 117: 4193–4194. [Google Scholar]
Chou KC, Mao B (1988). Collective motion in DNA and its role in drug intercalation. Biopolymers: Original Research on Biomolecules 27: 1795–1815. [Google Scholar]
De Azevedo Jr WF, Canduri F, Fadel V, Teodoro LG, Hial V et al. (2001). Molecular model for the binary complex of uropepsin and pepstatin. Biochemical and Biophysical Research Communications 287: 277–281. [Google Scholar]
De Azevedo WF (2011). Molecular dynamics simulations of protein targets identified in Mycobacterium tuberculosis. Current Medicinal Chemistry 18: 1353–1366. [Google Scholar]
Dua K, Rapalli VK, Shukla SD, Singhvi G, Shastri MD et al. (2018). Multi-drug resistant Mycobacterium tuberculosis & oxidative stress complexity: Emerging need for novel drug delivery approaches. Biomedicine & Pharmacotherapy 107: 1218–1229. [Google Scholar]
García JL, Uhía I, Galán B (2012). Catabolism and biotechnological applications of cholesterol degrading bacteria. Microbial Biotechnology 5: 679–699. [Google Scholar]
Heberlé G, De Azevedo WF (2011). Bio-inspired algorithms applied to molecular docking simulations. Current Medicinal Chemistry 18: 1339–1352. [Google Scholar]
Ho NAT, Dawes SS, Crowe AM, Casabon I, Gao C et al. (2016). The structure of the transcriptional repressor KstR in complex with CoA thioester cholesterol metabolites sheds light on the regulation of cholesterol catabolism in Mycobacterium tuberculosis. Journal of Biological Chemistry 291: 7256–7266. [Google Scholar]
India TB Report (2018). Ministry Of Health and Family Welfare. [Google Scholar]
Irwin JJ, Sterling T, Mysinger MM, Bolstad ES, Coleman RG (2012). ZINC: A free tool to discover chemistry for biology. Journal of Chemical Information and Modeling 52: 1757–1768. [Google Scholar]
Johansson MU, Zoete V, Michielin O, Guex N (2012). Defining and searching for structural motifs using DeepView/Swiss-PdbViewer. BMC Bioinformatics 13: 173. [Google Scholar]
Jones G, Willett P, Glen RC (1995). Molecular recognition of receptor sites using a genetic algorithm with a description of desolvation. Journal of Molecular Biology 245: 43–53. [Google Scholar]
Jones G, Willett P, Glen RC, Leach AR, Taylor R (1997). Development and validation of a genetic algorithm for flexible docking. Journal of Molecular Biology 267: 727–748. [Google Scholar]
Karaman B, Sippl W (2019). Computational drug repurposing: Current trends. Current Medicinal Chemistry 26: 5389–5409. [Google Scholar]
Karthick V, Ramanathan K (2013). Virtual screening for oseltamivir-resistant a (H5N1) influenza neuraminidase from traditional Chinese medicine database: A combined molecular docking with molecular dynamics approach. Springerplus 2: 115. [Google Scholar]
Kendall SL, Burgess P, Balhana R, Withers M, Ten Bokum A et al. (2010). Cholesterol utilization in mycobacteria is controlled by two TetR-type transcriptional regulators: kstR and kstR2. Microbiology 156: 1362. [Google Scholar]
Khalid Z, Ahmad S, Raza S, Azam SS (2018). Subtractive proteomics revealed plausible drug candidates in the proteome of multi-drug resistant Corynebacterium diphtheriae. Meta Gene 17: 34–42. [Google Scholar]
King-Scott J, Nowak E, Mylonas E, Panjikar S, Roessle M et al. (2007). The structure of a full-length response regulator from Mycobacterium tuberculosis in a stabilized three-dimensional domain-swapped, activated state. Journal of Biological Chemistry 282: 37717–37729. [Google Scholar]
Krueger J, Thiel P, Merelli I, Grunzke R, Gesing S (2016). Portals and web-based resources for virtual screening. Current Drug Targets 17: 1649–1660. [Google Scholar]
Lanza V, Milardi D, Di Natale G, Pappalardo G (2018). Repurposing of copper (II)-chelating drugs for the treatment of neurodegenerative diseases. Current Medicinal Chemistry 25: 525–539. [Google Scholar]
Li MS, Monahan IM, Waddell SJ, Mangan JA, Martin SL et al. (2001). cDNA-RNA subtractive hybridization reveals increased expression of mycocerosic acid synthase in intracellular Mycobacterium bovis BCG. Microbiology 147: 2293–2305. [Google Scholar]
Lin SX, Lapointe J (2013). Theoretical and experimental biology in one—A symposium in honour of Professor Kuo-Chen Chou’s 50th anniversary and Professor Richard Giegé’s 40th anniversary of their scientific careers. Journal of Biomedical Sciences and Engineering 06: 435–442. [Google Scholar]
Lucarelli D, Russo S, Garman E, Milano A, Meyer-Klaucke W, Pohl E (2007). Crystal structure and function of the zinc uptake regulator FurB from Mycobacterium tuberculosis. Journal of Biological Chemistry 282: 9914–9922. [Google Scholar]
Morrone Xavier M, Sehnem Heck G, Boff De Avila M, Maria Bernhardt Levin N, Oliveira Pintro V et al. (2016). SAnDReS a computational tool for statistical analysis of docking results and development of scoring functions. Combinatorial Chemistry & High Throughput Screening 19: 801–812. [Google Scholar]
Palos I, Lara-Ramirez EE, Lopez-Cedillo JC, Garcia-Perez C, Kashif M et al. (2017). Repositioning FDA drugs as potential cruzain inhibitors from Trypanosoma cruzi: Virtual screening, in vitro and in vivo studies. Molecules 22: 1015. [Google Scholar]
Panina EM, Mironov AA, Gelfand MS (2003). Comparative genomics of bacterial zinc regulons: Enhanced ion transport, pathogenesis, and rearrangement of ribosomal proteins. Proceedings of the National Academy of Sciences of the United States of America 100: 9912–9917. [Google Scholar]
Pei JF, Qi N, Li YX, Wo J, Ye BC (2021). RegX3-mediated regulation of methylcitrate cycle in Mycobacterium smegmatis. Frontiers in Microbiology 12: 119. [Google Scholar]
Peters JS, Ismail N, Dippenaar A, Ma S, Sherman DR et al. (2020). Genetic diversity in Mycobacterium tuberculosis clinical isolates and resulting outcomes of tuberculosis infection and disease. Annual Review of Genetics 54: 511–537. [Google Scholar]
Pohl E, Holmes RK, Hol WG (1999). Crystal structure of the iron-dependent regulator (IdeR) from Mycobacterium tuberculosis shows both metal binding sites fully occupied. Journal of Molecular Biology 285: 1145–1156. [Google Scholar]
Potemkin V, Grishina M (2018). Grid-based technologies for in silico screening and drug design. Current Medicinal Chemistry 25: 3526–3537. [Google Scholar]
Qazi S, Raza K (2021). Phytochemicals from Ayurvedic plants as potential medicaments for ovarian cancer: An in silico analysis. Journal of Molecular Modeling 27: 114. [Google Scholar]
Rester U (2008). From virtuality to reality-Virtual screening in lead discovery and lead optimization: A medicinal chemistry perspective. Current Opinion in Drug Discovery & Development 11: 559–568. [Google Scholar]
Roberts G, Vadrevu IS, Madiraju MV, Parish T (2011). Control of CydB and GltA1 expression by the SenX3 RegX3 two component regulatory system of Mycobacterium tuberculosis. PLoS One 6: e21090. [Google Scholar]
Rohilla A, Khare G, Tyagi AK (2017). Virtual Screening, pharmacophore development and structure based similarity search to identify inhibitors against IdeR, a transcription factor of Mycobacterium tuberculosis. Scientific Reports 7: 4653. [Google Scholar]
Rollinger JM, Stuppner H, Langer T (2008). Virtual screening for the discovery of bioactive natural products. Natural Compounds as Drugs I: 211–249. [Google Scholar]
Sanz J, Navarro J, Arbués A, Martín C, Marijuán PC et al. (2011). The transcriptional regulatory network of Mycobacterium tuberculosis. PLoS One 6: e22178. [Google Scholar]
Savoia D (2016). New antimicrobial approaches: Reuse of old drugs. Current Drug Targets 17: 731–738. [Google Scholar]
Singh P, Jaiyeola B, Kerru N, Ebenezer O, Bissessur A (2017). A review of recent advancements in anti-tubercular molecular hybrids. Current Medicinal Chemistry 24: 4180–4212. [Google Scholar]
Snel B, Lehmann G, Bork P, Huynen MA (2000). STRING: A web-server to retrieve and display the repeatedly occurring neighbourhood of a gene. Nucleic Acids Research 28: 3442–3444. [Google Scholar]
van der Spoel D, Lindahl E, Hess B, Groenhof G, Mark AE, Berendsen HJ (2005). GROMACS: Fast, flexible, and free. Journal of Computational Chemistry 26: 1701–1718. [Google Scholar]
Wang Q, Canutescu AA, Dunbrack RL,Jr (2008). SCWRL and MolIDE: Computer programs for side-chain conformation prediction and homology modeling. Nature Protocols 3: 1832. [Google Scholar]
Ward SK, Abomoelak B, Marcus S, Talaat AM (2010). Transcriptional profiling of Mycobacterium tuberculosis during infection: Lessons learned. Frontiers in Microbiology 1: 121. [Google Scholar]
Weiner J, Domaszewska T, Donkor S, Kaufmann SH, Hill PC, Sutherland JS (2020). Changes in transcript, metabolite, and antibody reactivity during the early protective immune response in humans to Mycobacterium tuberculosis infection. Clinical Infectious Diseases 71: 30–40. [Google Scholar]
Zoete V, Cuendet MA, Grosdidier A, Michielin O (2011). SwissParam: A fast force field generation tool for small organic molecules. Journal of Computational Chemistry 32: 2359–2368. [Google Scholar]

 | This work is licensed under a Creative Commons Attribution 4.0 International License, which permits unrestricted use, distribution, and reproduction in any medium, provided the original work is properly cited. |