DOI:10.32604/biocell.2021.017289
| BIOCELL DOI:10.32604/biocell.2021.017289 | |
| Article |
A novel nine gene signature integrates stemness characteristics associated with prognosis in hepatocellular carcinoma
1Institute of Biomedical Engineering, West China School of Basic Medical Sciences & Forensic Medicine, Sichuan University, Chengdu, 610041, China
2Department of Radiation Oncology, Sichuan Cancer Hospital & Institute, School of Medicine of University of Electronic Science and Technology of China, Chengdu, 610041, China
3Jinzhou City Center for Disease Control and Prevention, Jinzhou, 121000, China
*Address correspondence to: Ye Zeng, ye@scu.edu.cn; Liang Li, lilianghx@163.com
#Authors contributed equally
Received: 28 April 2021; Accepted: 26 July 2021
Abstract: Cancer stem cells (CSCs) are heterogeneous with self-renewal and differentiation ability. The mRNA expression-based stemness index (mRNAsi) described the similarity between tumor cells and CSCs, which is positively associated with the poor prognosis of cancer patients. However, the key prognostic genes related to mRNAsi in hepatocellular carcinoma (HCC) remains unclear. A 9-gene signature related to mRNAsi and HCC prognosis including PSMG3, SNRPD1, DTYMK, PIGU, NME1, TXNL4A, IPO4, PES1, and REXO4 was obtained. High expression of this signature indicates poor prognosis of HCC. PIGU was an independent prognostic factor of HCC, which was significantly associated with progression of HCC. Among them, DTYMK and NME1 enriched in pyrimidine metabolism, SNRPD1 and TXNL4A enriched in spliceosome and PIGU enriched in glycosyl phosphatidylinositol (GPI)-anchor biosynthesis pathways. High levels of IPO4, NME1, PES1, PIGU and SNRPD1 were closely associated with metastasis of HCC, and low levels of IPO4, PIGU and REOX4 were significantly associated with sorafenib resistance of HCC. High expression of the 9-gene signature was negatively correlated with the stromal cell infiltration, and positively correlated with specific immune subtypes-related to angiogenesis, M1/M2 macrophage polarization, and M2 response. The 9-gene signature was negatively correlated with the stroma, and SNRPD1 and TXNL4 were positively correlated with immune infiltrate. NME1 was negatively correlated with tumor purity. Therefore, a 9-gene signature related to mRNAsi and poor prognosis in HCC were identified, which can be used as biomarkers for the diagnosis of HCC and functional mechanism exploration of CSCs in HCC. These genes such as IPO4 and PIGU might drive the transition of tumor cells into CSCs which possibly controls the balance between metastasis and drug resistance in HCC. The challenge on balance between metastasis and drug resistance for tumor therapy was firstly reported by the present study.
Keywords: Stemness index; Hepatocellular carcinoma; Prognosis; Microenvironment
Abbreviations
| AACR: | The American Association for Cancer Research |
| BP: | biological process |
| CC: | cellular component |
| CSCs: | cancer stem cells |
| DEGs: | differentially expressed genes |
| DTYMK: | Deoxythymidylate kinase |
| EREG-mRNAsi: | epigenetically regulated mRNAsi |
| FDR: | false discovery rate |
| GO: | Gene Ontology |
| GPI: | glycosyl phosphatidylinositol |
| GSEA: | Gene set enrichment analyses |
| HCC: | hepatocellular carcinoma |
| HPA: | the human protein atlas |
| IPO4: | Importin-4 |
| KEGG: | Kyoto Encyclopedia of Genes and Genomes |
| LIHC: | liver HCC |
| MF: | molecular function |
| mRNAsi: | stemness index |
| NES: | normalized enrichment score |
| NME1: | Nucleoside diphosphate kinase A |
| OCLR: | one-class logistic regression machine learning algorithm |
| PES1: | Pescadillo ribosomal biogenesisfactor 1 |
| PIGU: | Phosphatidylinositol glycan anchor biosynthesis class U protein |
| PSMG3: | Proteasome assembly chaperone 3 |
| RNA-seq: | RNA sequencing |
| ROCs: | receiver operating characteristic curves |
| SNRPD1: | Small nuclear ribonucleoprotein Sm D1 |
| TCGA: | The Cancer Genome Atlas |
| TXNL4A: | Thioredoxin like 4A |
| WGCNA: | weighted gene coexpression network analysis |
Primary liver cancer is the fourth most common tumor in the world (Villanueva, 2019). Hepatocellular carcinoma (HCC) takes account of 90% of all cases of primary liver cancer (Chedid et al., 2017), which is the third most fatal cancer in the world (Salem and Lewandowski, 2013). The early onset of HCC is hidden without obvious symptoms and signs, most of HCC has entered the middle and late stages once diagnosed was ensured (Hartke et al., 2017). In recent years, with the continuous progress of comprehensive treatments including surgery and targeted drugs, the overall survival (OS) of patients had improved significantly, but tumor metastasis and recurrence, radiotherapy and chemotherapy resistances lead to a high mortality rate of HCC (Andreou et al., 2018; Kulik and El-Serag, 2019).
The American Association for Cancer Research (AACR) has been defined cancer stem cell (CSC) as Cells that exist in tumor tissue with unlimited self-renewal ability and produce tumor cells with different degrees of differentiation at the same time (Eaves, 2008). Cancer progression includes the progressive loss of differentiation phenotype and the acquisition of progenitor cell and stem cell-like characteristics. The transcriptomic data of all tumor and control samples in the TCGA database were previously acquired by applying a one-class logistic regression machine learning algorithm (OCLR) to obtain mRNA expression-based stemness index (mRNAsi) which is an indicator of their stem cell characteristics in response to gene expression (Malta et al., 2018). The mRNAsi can be used to recognize undifferentiated cancers, which was correlated with gene mutations, tumor progression and metastasis, and immune response (Malta et al., 2018). It was believed that CSCs are the seed cells of HCC, which may be of endogenous, mainly hepatic origin (Robrechts et al., 1998; Yi and Nan, 2008). CSCs have the properties of mutual transformation with tumor cells, promotion of tumor development, metastasis and recurrence, and resistance to radiotherapy and chemotherapy (Nassar and Blanpain, 2016; Xu et al., 2010). The degree of malignancy of HCC is closely associated with CSC phenotypes (Cheng et al., 2016; Nio et al., 2017). The postoperative recurrence rate of patients with low-differentiated HCC is significantly higher than those with intermediate or high-differentiated HCC.
In recent, weighted gene coexpression network analysis (WGCNA) was used to evaluate the correlation between clinical traits and coexpression gene modules by constructing scale-free topology and find the hub genes related to clinical traits (Langfelder and Horvath, 2008b). By WGCNA, the key genes and pathways for HCC initiation and progression were identified, including GMPS, ACACA, ALB, TGFB1, KRAS, ERBB2, BCL2, EGFR, STAT3, and CD8A, which enriched in response to endoplasmic reticulum stress, cellular response to cadmium and zinc ion, cell locomotion and differentiation, ribonucleoprotein complex and RNA processing, and immune system process, etc. (Zhang et al., 2017). The hub genes such as PLK1 and CDK1 that regulated the tumorigenesis in HCC were identified (Li et al., 2019a; Xu et al., 2016). Hsa-cir-0000517 was identified to be associate with adverse prognosis in HCC (Wang et al., 2019b). The modules of immune-related genes were analyzed to explore the immune escape mechanisms of HCC (Li et al., 2019b). It was demonstrated that mRNAsi expression in LIHC increased with the tumor pathological grade (Bai et al., 2020). Twenty-one key genes including DCN, ECM1, HAND2, PTGIS, SFRP1, SRPX, COLEC10, GRP182, ADAMTS7, CD200, CDH11, COL8A1, FAP, LZTS1, MAP1B, NAV1, NOTCH3, OLFML2A, PRR16, TMEM119, and VCAN were reported to involve in angiogenesis, negative regulation of DNA-binding transcription factor activity, apoptosis, and autophagy by identifying stemness-related genes through WGCNA (Bai et al., 2020). In the present study, we identified a gene signature related to prognosis and mRNAsi in HCC, and performed a relatively comprehensive mining of the clinical characteristics, drug resistance, metastasis, immune subtypes, and tumor microenvironment of the gene signature.
Data download and preprocessing
The RNA-Seq data, somatic cell mutation data and the corresponding clinical traits (Supplemental Tab. 1) of 374 liver HCC (LIHC) and 50 normal liver tissue samples were downloaded from The Cancer Genome Atlas TCGA databases (https://www.cancer.gov/) in November 2019. The human.gtf was downloaded from the ensemble website (https://asia.ensembl.org/info/website/upload/gff.html). The transcriptome data and clinical characteristics of HCC patients were downloaded from gene Expression Omnibus (GEO) databases including GSE76427, GSE39791, GSE36376, GSE109211 and GSE40367 by GEOquery (Davis and Meltzer, 2007) and Biobase (Huber et al., 2015) packages of R, and were used to analyze the hub genes in survival and clinical traits (Supplemental Tab. 2), sorafenib resistance, and metastasis in HCC, respectively. Fragments per kilobase million (FPKM) values from RNA-Seq data were pre-transformed into transcript per kilobase million (TPM) values, and batch effects arising from non-biotechnical bias were corrected by Sva R package (Leek et al., 2012) using the “ComBat” algorithm. The mRNAsi was obtained from a previously published study (Malta et al., 2018). Immune subtypes, and genetic variation data including somatic mutations and copy number variation (CNV) were downloaded from the xena browser (https://xenabrowser.net/datapages/).
Identification of Differentially Expressed Genes (DEGs)
The Limma R package (Ritchie et al., 2015) was used to identify the differentially expressed genes (DEGs) with selection criteria: false discovery rate (FDR) < 0.05, and |log2FC| > 1. The results were visualized by heatmap and volcano maps respectively using pheatmap and ggplot2 R packages (Ito and Murphy, 2013; Li et al., 2018).
Establishment of WGCNA modules and identification of stemness index and prognosis-related genes
The WGCNA R package (Langfelder and Horvath, 2008a) was used to construct a co-expression network of the DEGs. After deleting the outliers by setting the abline value to 20000, the person coefficient between any two genes were calculated, and the best cluster was chosen to constructed the scale-free network (the soft threshold β value = 9, scale-free R2 = 0.89). Classification of genes according to expression patterns was performed based on the weighted correlation coefficients of genes. The average linkage hierarchical clustering is established by hierarchical clustering based on topological overlap measure (TOM). Gene clustering tree is obtained using dynamic tree cut method to identify the mRNAsi-related gene module and epigenetically regulated mRNAsi (EREG-mRNAsi)-related gene module (minimum gene number size of 50, P < 0.05). Survival analysis of DEGs was performed by the survival (Therneau, 2020) and survminer R package (Kassambara, 2020) with the Kaplan-Meier (KM) method. The genes significantly associated with overall survival (OS) (P < 0.05) were screened out as prognostic DEGs and their receiver operating characteristic curves (ROCs) were performed by using the survival ROC R package (Heagerty, 2000). The prognostic DEGs were intersected with the genes from each mRNAsi-related gene module. The module with highest or lowest correlation coefficient, which contain most prognostic DEGs was selected as module of interest. Once the module of interest was selected, the hub genes in corresponding module and gene expression profiles were screened out by thresholds of gene significance (cor. GS) > 0.3, module membership (cor. MM) > 0.7, and P < 0.05. A gene signature was final identified by intersection of hub genes in module of interest and the prognostic DEGs.
To verify the co-expression of mRNAsi and prognosis-related genes, we used the corrplot R package (Wei and Simko, 2013) to obtain the correlation between the expression levels of each gene, as well as the Person’s correlation coefficient.
Protein-Protein Interaction (PPI) analysis
Protein-protein interactions (PPI) were constructed by the STRING10.0 (https://www.string-db.org/). The STRING10.0 is a searchable database of known protein-protein and predicted protein-protein interactions for 2031 species, containing 9.6 million proteins and 13.8 million medium protein interactions. PPIs include both direct physical interactions and indirect functional correlations.
To evaluate the biological functions of mRNAsi and prognosis-related genes, we used the clusterProfiler R package (Yu et al., 2012) for GO functional annotations and KEGG pathway analysis. The threshold values were as follows: p < 0.05, and FDR < 0.05.
Clustering of tumor samples based on the gene signature, and comparison of overall survival (Os), clinical characteristics, immune cell infiltration and gene functions among the clusters
To further analyze the role of mRNAsi and prognosis-related genes in HCC, we clustered the tumor samples into three subgroups by ConsensusClusterPlus R package (Wilkerson and Hayes, 2010) according to the expression levels of those hub genes, and performed PCA analysis using the limma R package (Ritchie et al., 2015) and visualized by the ggplot2 R package (Villanueva and Chen, 2019). The differences in OS among the three clusters were compared using the survival R package (Therneau, 2020). The differences in clinical characteristics (age, gender, stages I–IV/grades I–IV/Tumor-node-metastasis (TNM) T1–T4) among the three clusters were also compared. For comparison, one way ANOVA analysis was used for numerical variables and the non-parametric test (chi-square) was performed for categorical variables. The survival and forestplot R packages (Lumley, 2020; Therneau, 2020) were used for univariate Cox regression analysis, and the survival R package (Therneau, 2020) was used for multivariate regression analysis. The immune cell infiltration among the three clusters were compared by single-sample Gene Set Enrichment Analysis (ssGSEA) (Zuo et al., 2020). The differences in biological processes between mRNAsi and prognosis-related genes were investigated by GSVA enrichment analysis using Gene set variation analysis (GSVA) package of R (Hänzelmann et al., 2013). The gene set “c2.cp.kegg.v6.2.-symbols” was downloaded from the MSigDB database. Adjusted p-values less than 0.05 were considered statistically significant.
To further evaluate the prognostic role of the 9-gene signature, we performed univariate Cox regression analysis based on the expression status of each hub gene, with the patient’s prognosis as the outcome variable. In the analysis we assigned a risk score to each patient, patients were divided into high- and low-risk subgroups. Then, KM survival analysis was applied to establish a survival model for evaluating the predication of the 9-gene signature. Gene set enrichment analysis (GSEA) was performed by GSEA v4.0.3 for Windows (Subramanian et al., 2005) to calculate enriched functional categories of each subgroup. The gene sets including c5.all.v7.0.symbols.gmt and c2.cp.kegg.v7.0.symbols.gmt were downloaded from the Molecular Signatures Database (http://software.broadinstitute.org/gsea/msigdb/index.jsp). The normalized enrichment score (NES) was acquired by 1000 permutations. A gene set is considered to be significantly enriched when P-value is < 0.05 and false discovery rate (FDR) is < 0.05.
Relationships between each mRNAsi and prognosis-related gene and clinical characteristics, immune subtypes, and tumor microenvironment
The correlations between each hub gene in mRNAsi and prognosis-related gene profile and clinical characteristics in HCC were analyzed using the beeswarm R package (Eklund, 2016). The infiltration of immune and stromal cells in HCC tumor was evaluated by immune and stromal scores using the Estimation of STromal and Immune cells in MAlignant Tumor tissues using Expression data (ESTIMATE) algorithm (Yoshihara et al., 2013), and HCC purity was assessed by ESTIMATE score. Correlations between gene panel and these scores were calculated using Spearman’s correlation analysis, correlations between gene expression and immune subtypes (Thorsson et al., 2018) in the tumor microenvironment were analyzed using an ANOVA model, and the correlation between HCC purity and mRNAsi-related gene expression was detected by Spearman’s correlation test. Immune subtypes including C1 (wound healing), C2 (IFN-γ dominant), C3 (inflammatory), C4 (lymphocyte depleted), C5 (immunologically quiet), and C6 (TGF-β dominant) were characterized as previously described (Thorsson et al., 2018). GEO data including sorafenib resistance dataset (GSE109211) and the metastasis-related dataset (GSE40367) were used to evaluate expression of each mRNAsi and prognosis-related gene in HCC patients with drug resistance and metastasis, respectively.
WGCNA analysis of DEGs based on mRNAsi
The bioinformatics analysis was performed to identify the DEGs between 50 normal (non-tumor) samples and 374 LIHC samples obtained from TCGA. As shown in Fig. 1A, there are a total of 394 significantly downregulated and 7273 significantly upregulated genes (Supplemental Tab. 3). To further analyze the DEGs obtained in the study which the highest correlated with mRNAsi, WGCNA was constructed to identify important gene modules (Figs. 1B–1D). After eliminating 22 outliers, the samples were clustered into 325 1-cluster and 27 2-clusters (Fig. 1B). Then, the 1-cluster was selected, and WGCNA analysis was performed on 7273 DEGs, and finally, 13 modules were obtained after merging the similarity modules (Fig. 1C). Among the modules, the grey module was not significantly correlated with EREG-mRNAsi, but other modules were significantly correlated with mRNAsi and EREG-mRNAsi (Fig. 1D, Supplemental Tab. 4). Among the 6 significant negative modules, the magenta module was most significantly correlated with mRNAsi, with a correlation coefficient of −0.71 (P < 0.001). Among the 6 significant positive modules, the blue module was significantly correlated with mRNAsi, with the biggest correlation coefficient of 0.38 (P < 0.001) (Fig. 1E).
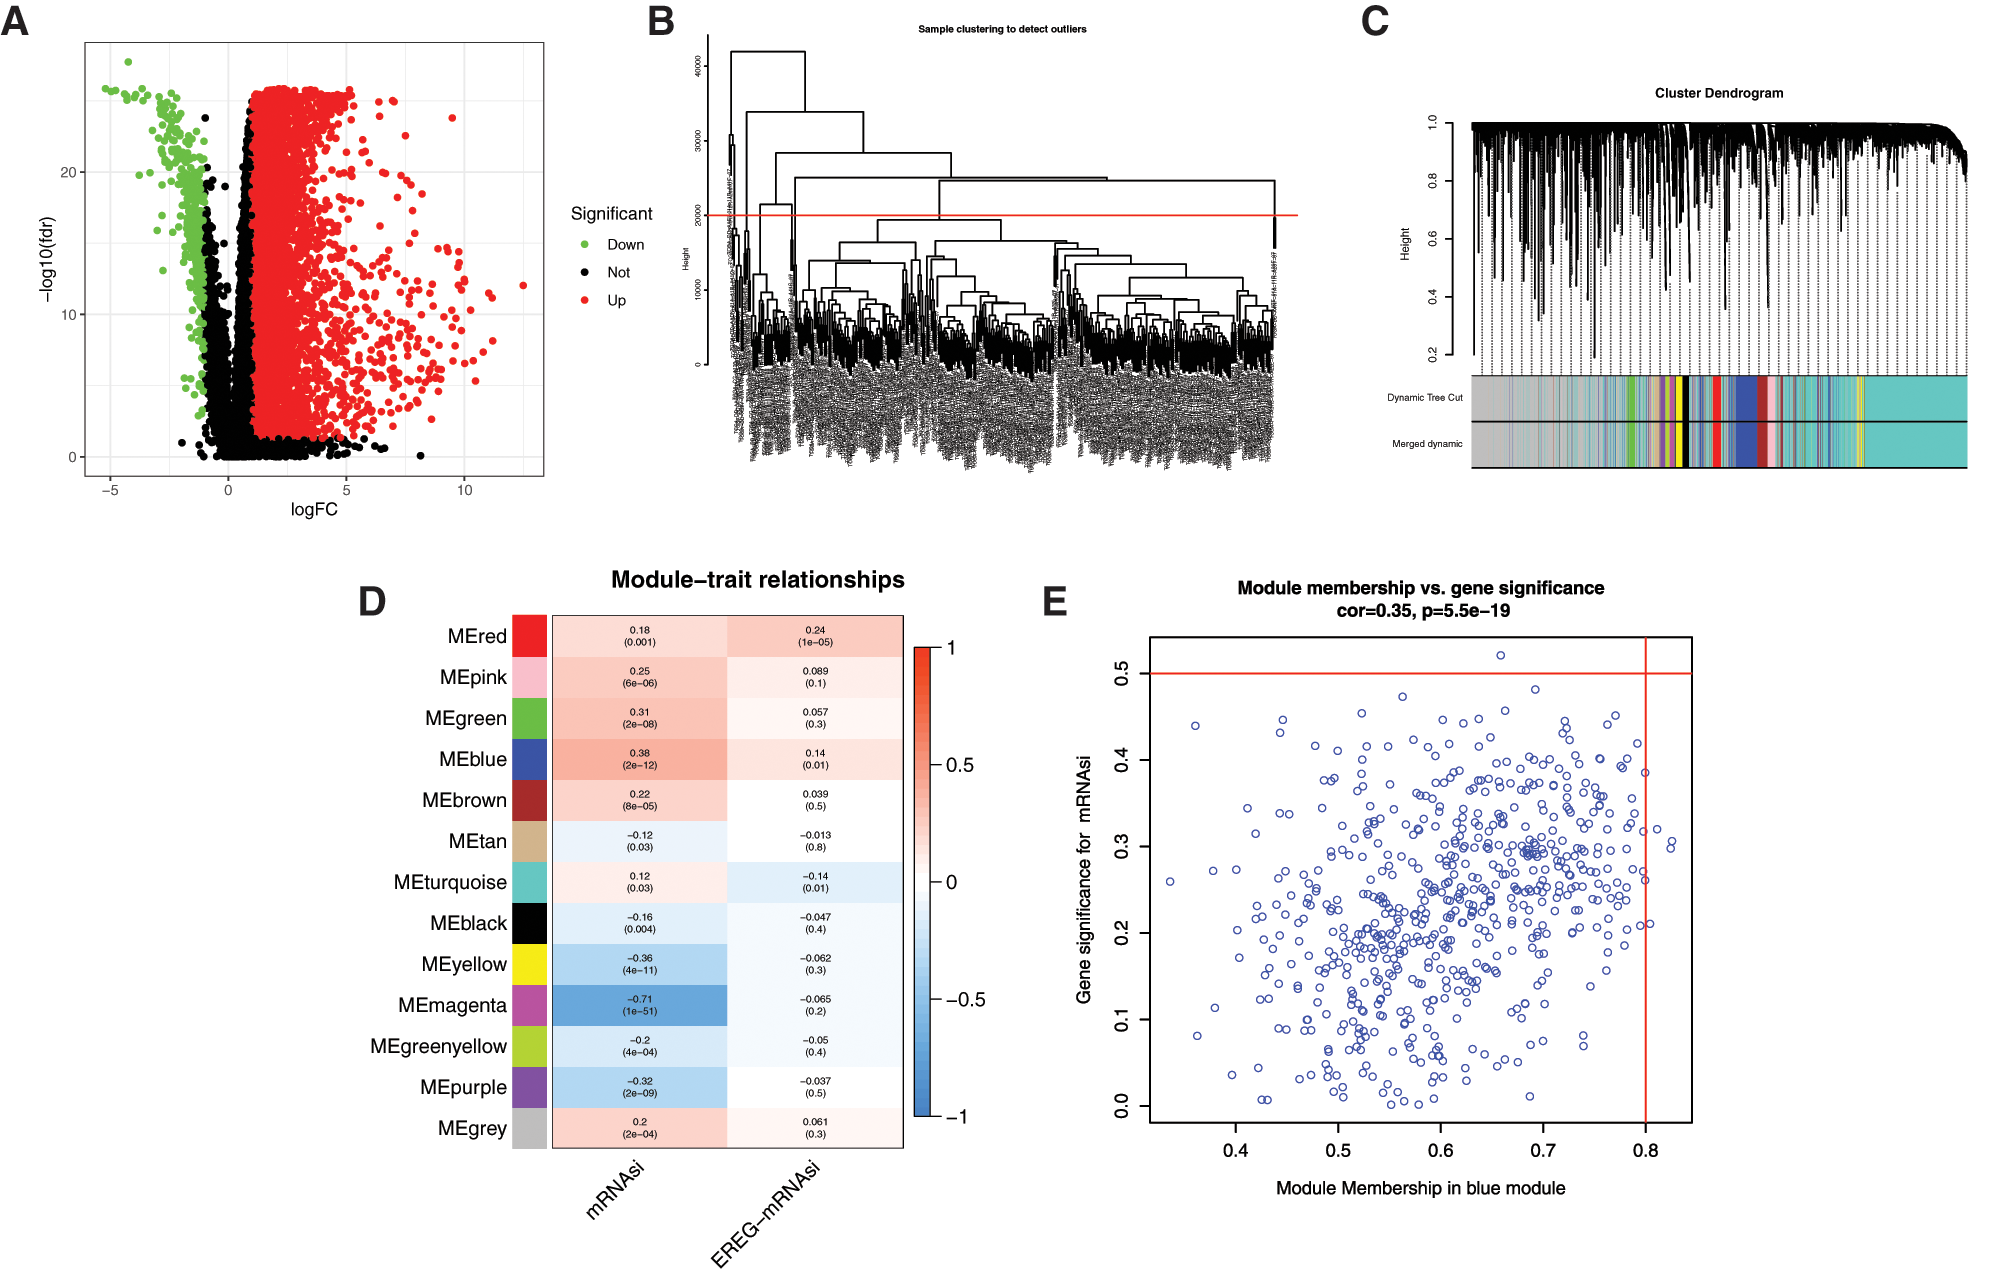
Figure 1: WGCNA analysis of DEGs based on mRNAsi. A, Volcano plots of DEGs. Dots in red and green represent up-regulated and down-regulated DEGs. DEGs between 50 normal (non-tumor, N) samples and 374 LIHC (tumor, T) samples were obtained from TCGA databases. Genes without significant difference are in black. The differences are set as false discovery rate (FDR) < 0.05, and |log2FC| > 1. DEG: differentially expressed gene; N: normal control; T: tumor. B, Clustering of samples to detect outliers. The outliers were deleted by setting the abline value to 20000. C, WGCNA dendrogram indicating the expression of different gene modules in LIHC samples. D, Correlations between the gene modules and mRNAsi, and gene modules and epigenetically regulated mRNAsi (EREG-mRNAsi). E, Scatterplot of module eigengenes in the blue module.
Identification of mRNAsi and prognosis-related genes
The KM analysis of the DEGs was performed and a total of 245 prognostic DEGs had significantly correlated with the 3-year, 5-year survival of HCC patients (Supplemental Tab. 5).
To evaluate the relationship between mRNAsi and the survival of HCC patients, we compared the prognostic-related DEGs and the DEGs in all modules. Most prognostic-related DEGs were appeared in the blue (60 DEGs) modules (Fig. 2A).
With cor. GS > 0.3, cor. MM > 0.7, and P-value < 0.05, a total of 50 hub genes were obtained in the blue module (Fig. 2B, Supplemental Tab. 6). Among the hub genes in the blue module, 9 hub genes were miRNAsi and prognostic-related genes (Fig. 2B), including PSMG3, SNRPD1, DTYMK, PIGU, NME1, TXNL4A, IPO4, PES1, and REXO4. A better prediction efficiency of 1 year, 3 years, and 5 years of the 9-gene signature was obtained (Figs. 2C–2K).
There were not prognostic-related DEGs (no genes in the list of 245 prognostic DEG) in the magenta module. Therefore, the genes in the magenta module (Supplemental Tab. 7) were not considered in the present study.
Genetic variation of mRNAsi and prognosis-related genes
The incidence of somatic mutations and copy number variations (CNV) of the 9 mRNAsi and prognosis-related genes in HCC were found. Among 364 samples, 8 samples were experienced mutations, with a frequency of 2.2%. It was found that NME1, IPO4, PES1 and REXO4 exhibited mutation with a frequency of 1% PIGU, PSMG3, SNRPD1, DTYML and TXNL4A did not show any mutations (Fig. 3A).
There were alterations on the amplifications in copy number of CNV in IPO4, NME1, PSMG3, REXO4, PIGU and SNRPD1, while DTYML, TXNL4A and PES1 had a widespread frequency of CNV deletion (Fig. 3B). The location of CNV alteration of mRNAsi and prognosis-related genes on chromosomes was shown in Fig. 3C. Basing on the expression of the expression of these mRNAsi and prognosis-related genes, we could completely distinguished HCC samples from normal samples (Figs. 3D and 3F). All the 9 hub genes were significantly upregulated in HCC samples (Figs. 3D and 3E, P < 0.001). To further validate our results obtained based on TCGA, GEO datasets GSE39791 and GSE36376 were used to analyze the expression of these genes, and results showed that 8 genes were significantly overexpressed in HCC tissues except DTYMK that were not significantly changed (Figs. 3F and 3G).
The expression correlation among genes were analyzed by combining the TCGA with GEO expression data, and results showed that the expression of 9 genes was positively correlated, and that the pearson correlation coefficient of PIGU and REOX4 was highest (0.63), followed by NME1 and IPO4 (0.61) (Fig. 3H, P < 0.001). Among them, NME1, DTYMK, SNRPD1 and TXNL4A in a PPI network, and REXO4, PES1 and IPO4 in another PPI network were found by PPI network analysis (Fig. 3I). PIGU and PSMG3 were separated with other genes in the 9-gene signature (Fig. 3I).
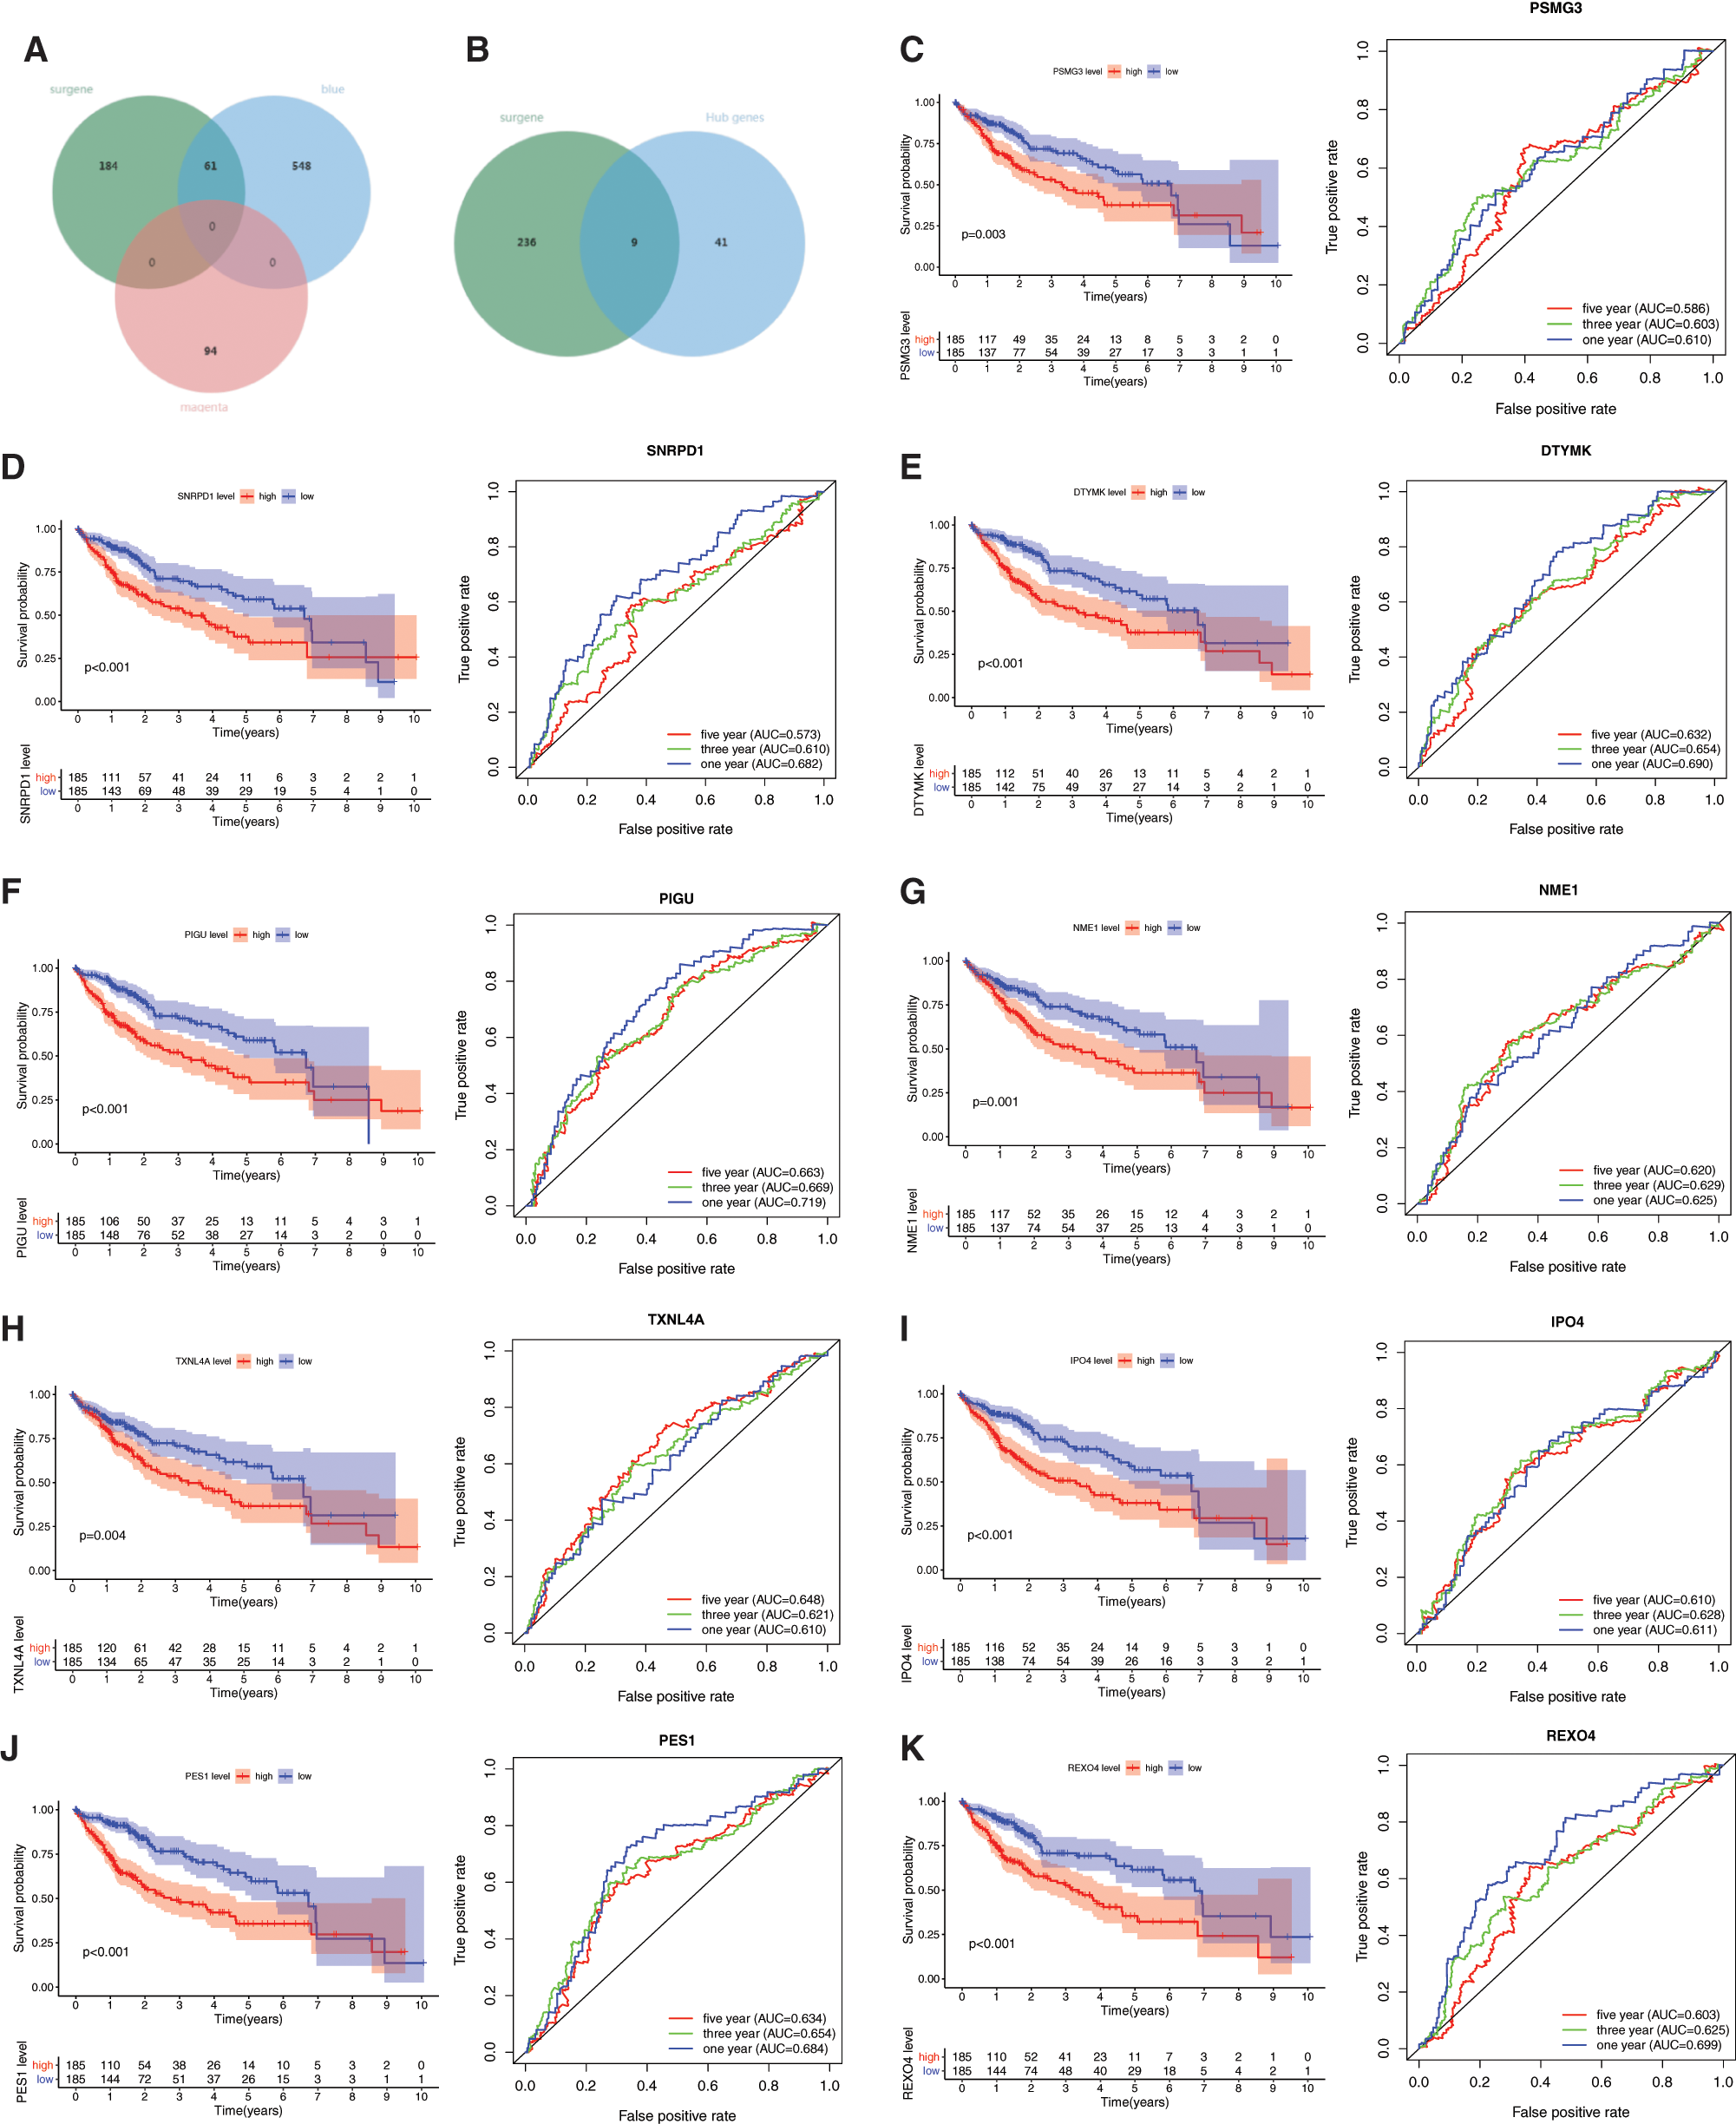
Figure 2: Prognostic values of the 9 mRNAsi and prognosis-related genes in LIHC. A, The venn plot of survival related genes, blue and megenta moudle genes. B, The venn plot of survival related genes, blue moudle hub genes. C–K, The KM analysis and ROC curves of the 9 mRNAsi and prognosis-related genes including PSMG3, SNRPD1, DTYMK, PIGU, NME1, TXNL4A, IPO4, PES1, and REXO4.
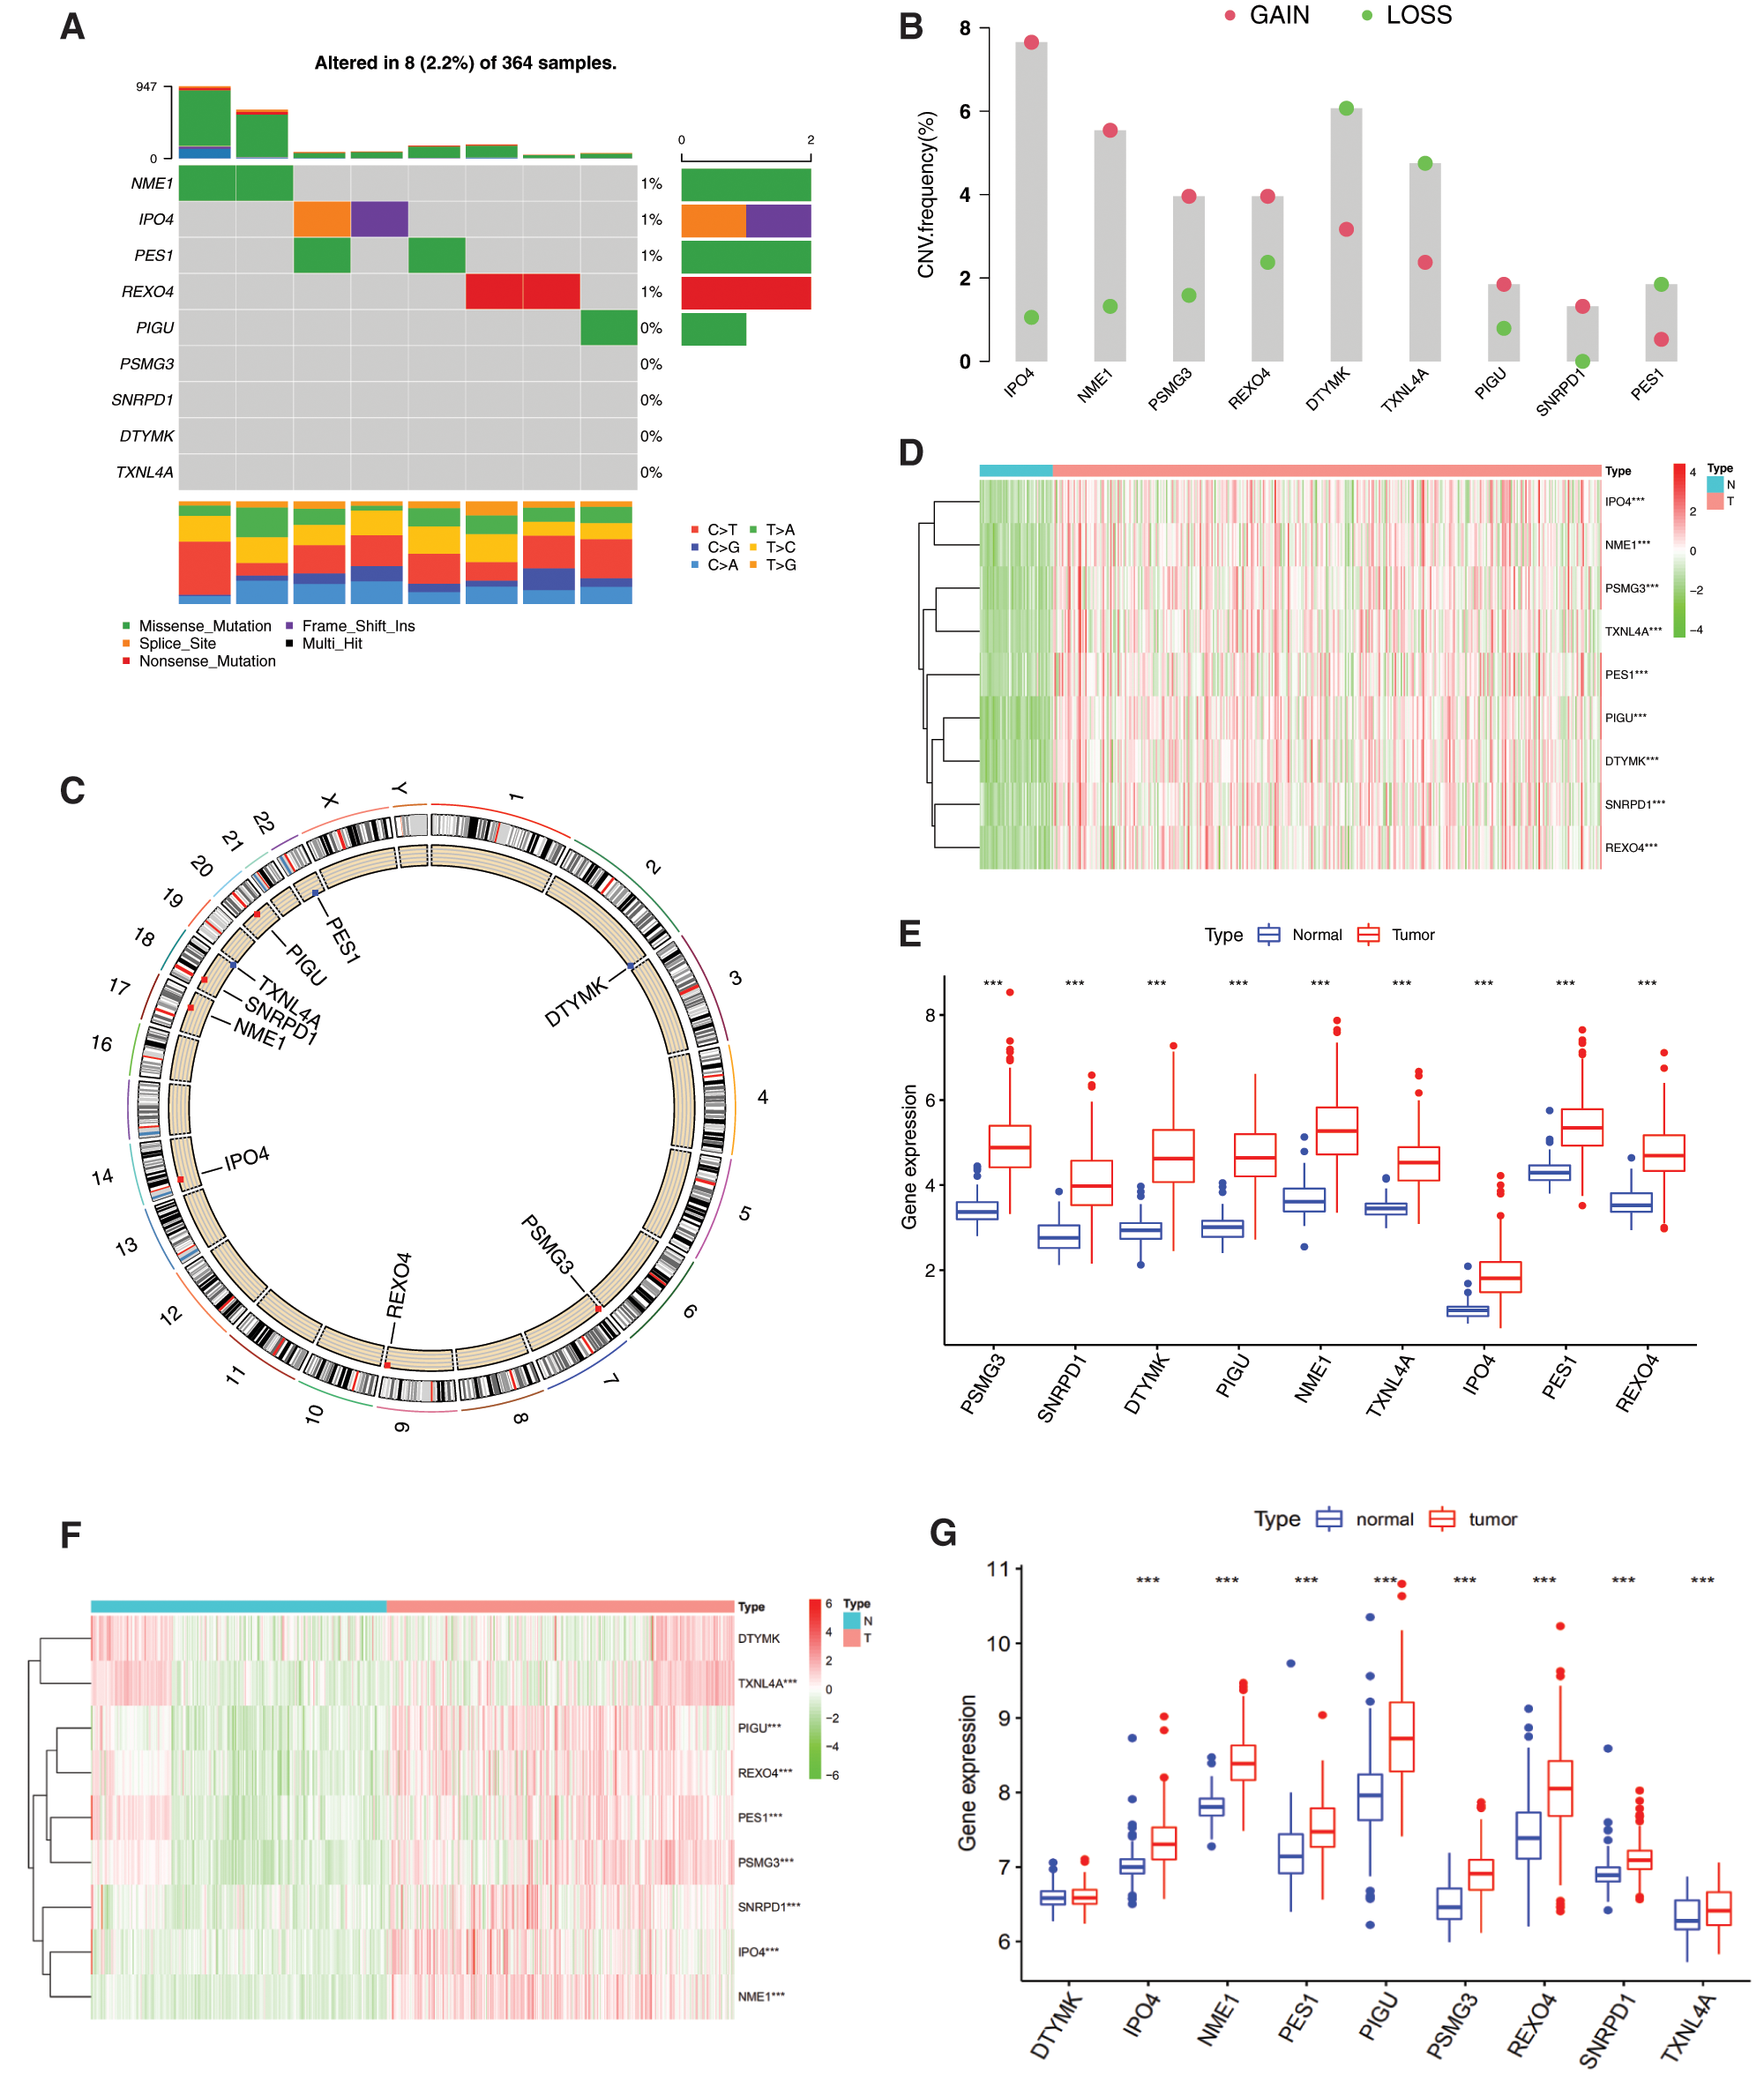
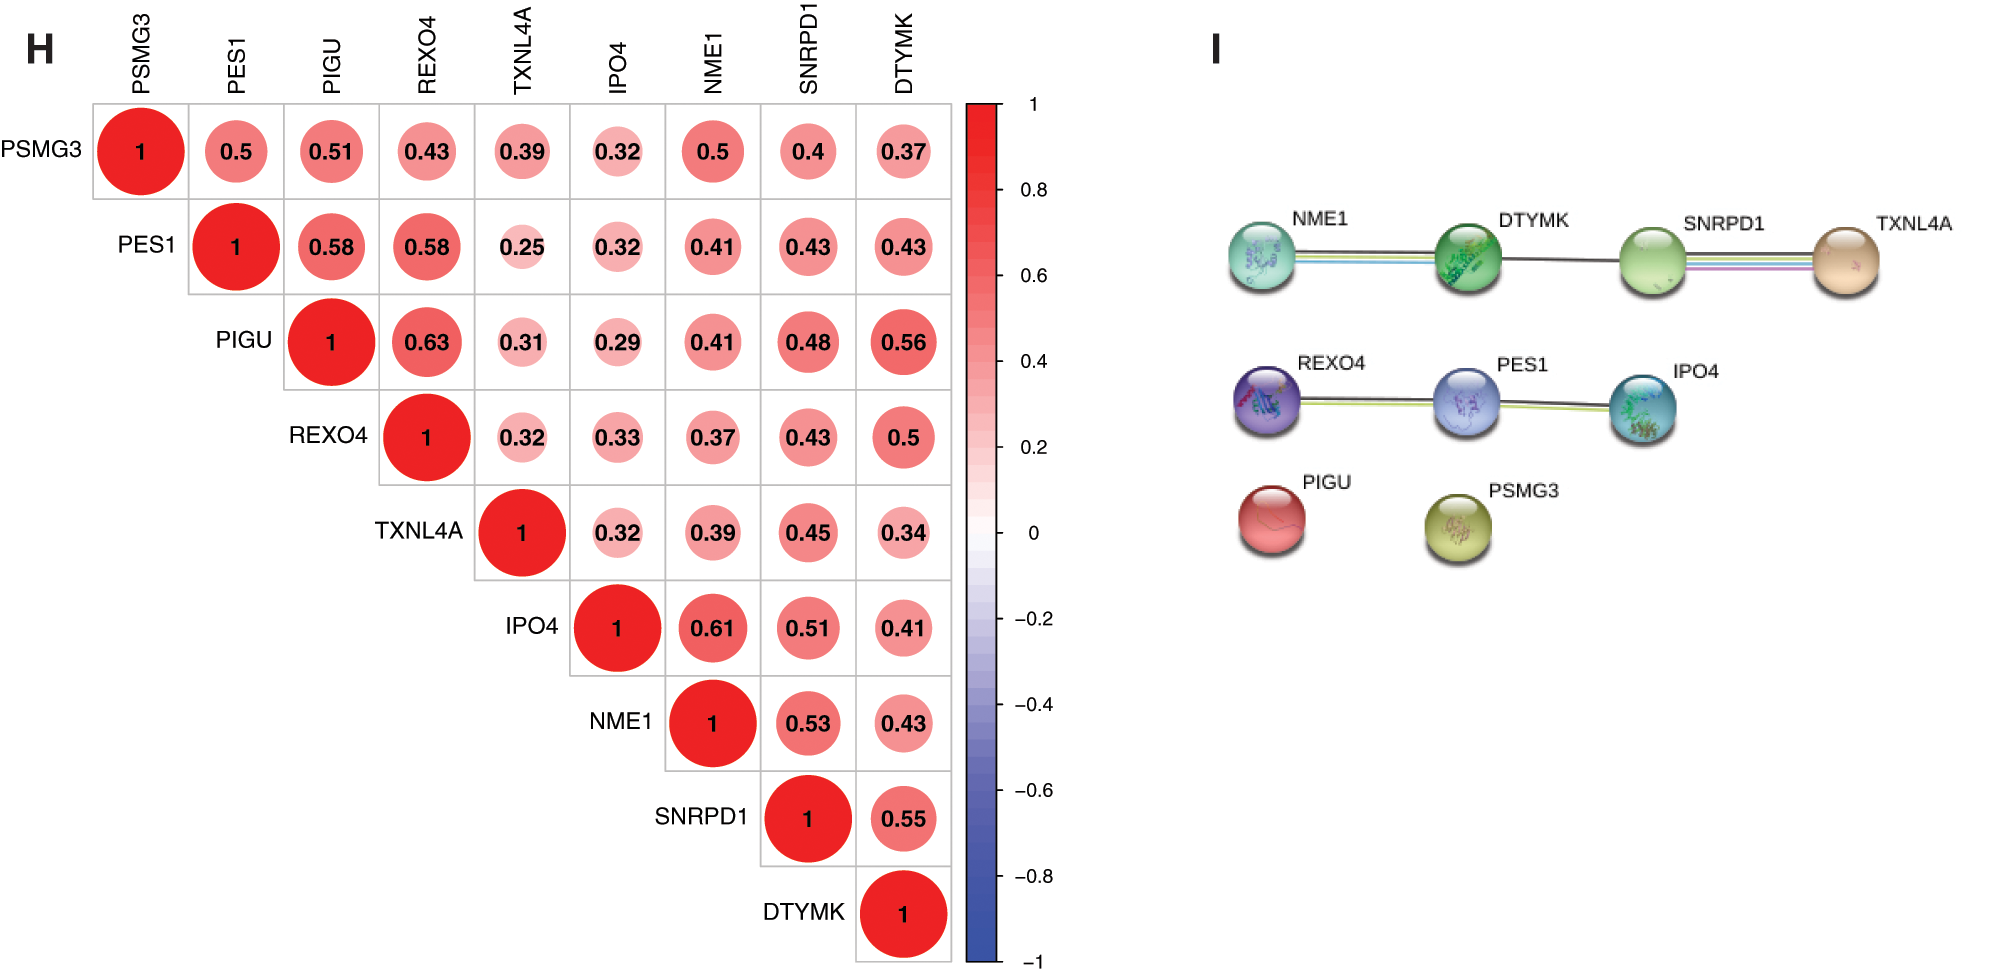
Figure 3: Genetic and expression variation of mRNAsi and prognosis-related genes. A, The mutation frequency of 9 mRNAsi and prognosisrelated genes in 367 patients. The upper barplot shows TMB. The number on the right indicates the mutation frequency in each regulator. The right barplot shows the proportion of each variant type. The bottom stacked barplot shows fraction of conversions in each sample. B, The CNV variation frequency of mRNAsi and prognosis-related genes. The height of the column represents the alteration frequency. Blue and red dots represent the deletion frequency and amplification frequency, respectively. C, The location of CNV alteration of mRNAsi and prognosisrelated genes on the 23 chromosomes. D, The expression heatmap of the mRNAsi and prognosis-related genes in TCGA-LIHC dataset. Red and green indicate gene expression upregulation and downregulation, respectively. E, The expression levels of mRNAsi and prognosisrelated genes in TCGA-LIHC dataset. Data are presented as mean S.D. F, The expression heatmap of the mRNAsi and prognosis-related genes in GEO datasets (GSE39791, and GSE36376). G, The expression levels of the mRNAsi and prognosis-related genes in GEO datasets (GSE39791, and GSE36376). Data are presented as mean S.D. H, Spearman correlation analysis of the 9 mRNAsi and prognosis-related genes. I, PPI network of the 9 mRNAsi and prognosis-related genes. *P < 0.05, **P < 0.01, ***P < 0.001.
Functional annotation of mRNAsi and prognosis-related genes
To further understand the biological function of the mRNAsi and prognosis-related genes, we performed GO and KEGG enrichment analysis (Fig. 4A and Tab. 1). GO analysis includes three parts of biological process (BP), cellular component (CC), and molecular function (MF). BP analysis showed that the top 10 enriched terms were pyrimidine nucleoside triphosphate biosynthetic process, ribonucleoprotein complex biogenesis, pyrimidine nucleoside triphosphate metabolic process, nucleobase-containing small molecule interconversion, pyrimidine nucleotide biosynthetic process, pyrimidine-containing compound biosynthetic process, pyrimidine nucleotide metabolic process, spliceosomal complex assembly, pyrimidine-containing compound metabolic process, and nucleoside diphosphate metabolic process. The significantly enriched BP terms were all associated with nucleic acid metabolic processes, and the major enriched genes were DTYMK and NME1 (Fig. 4A and Tab. 1).
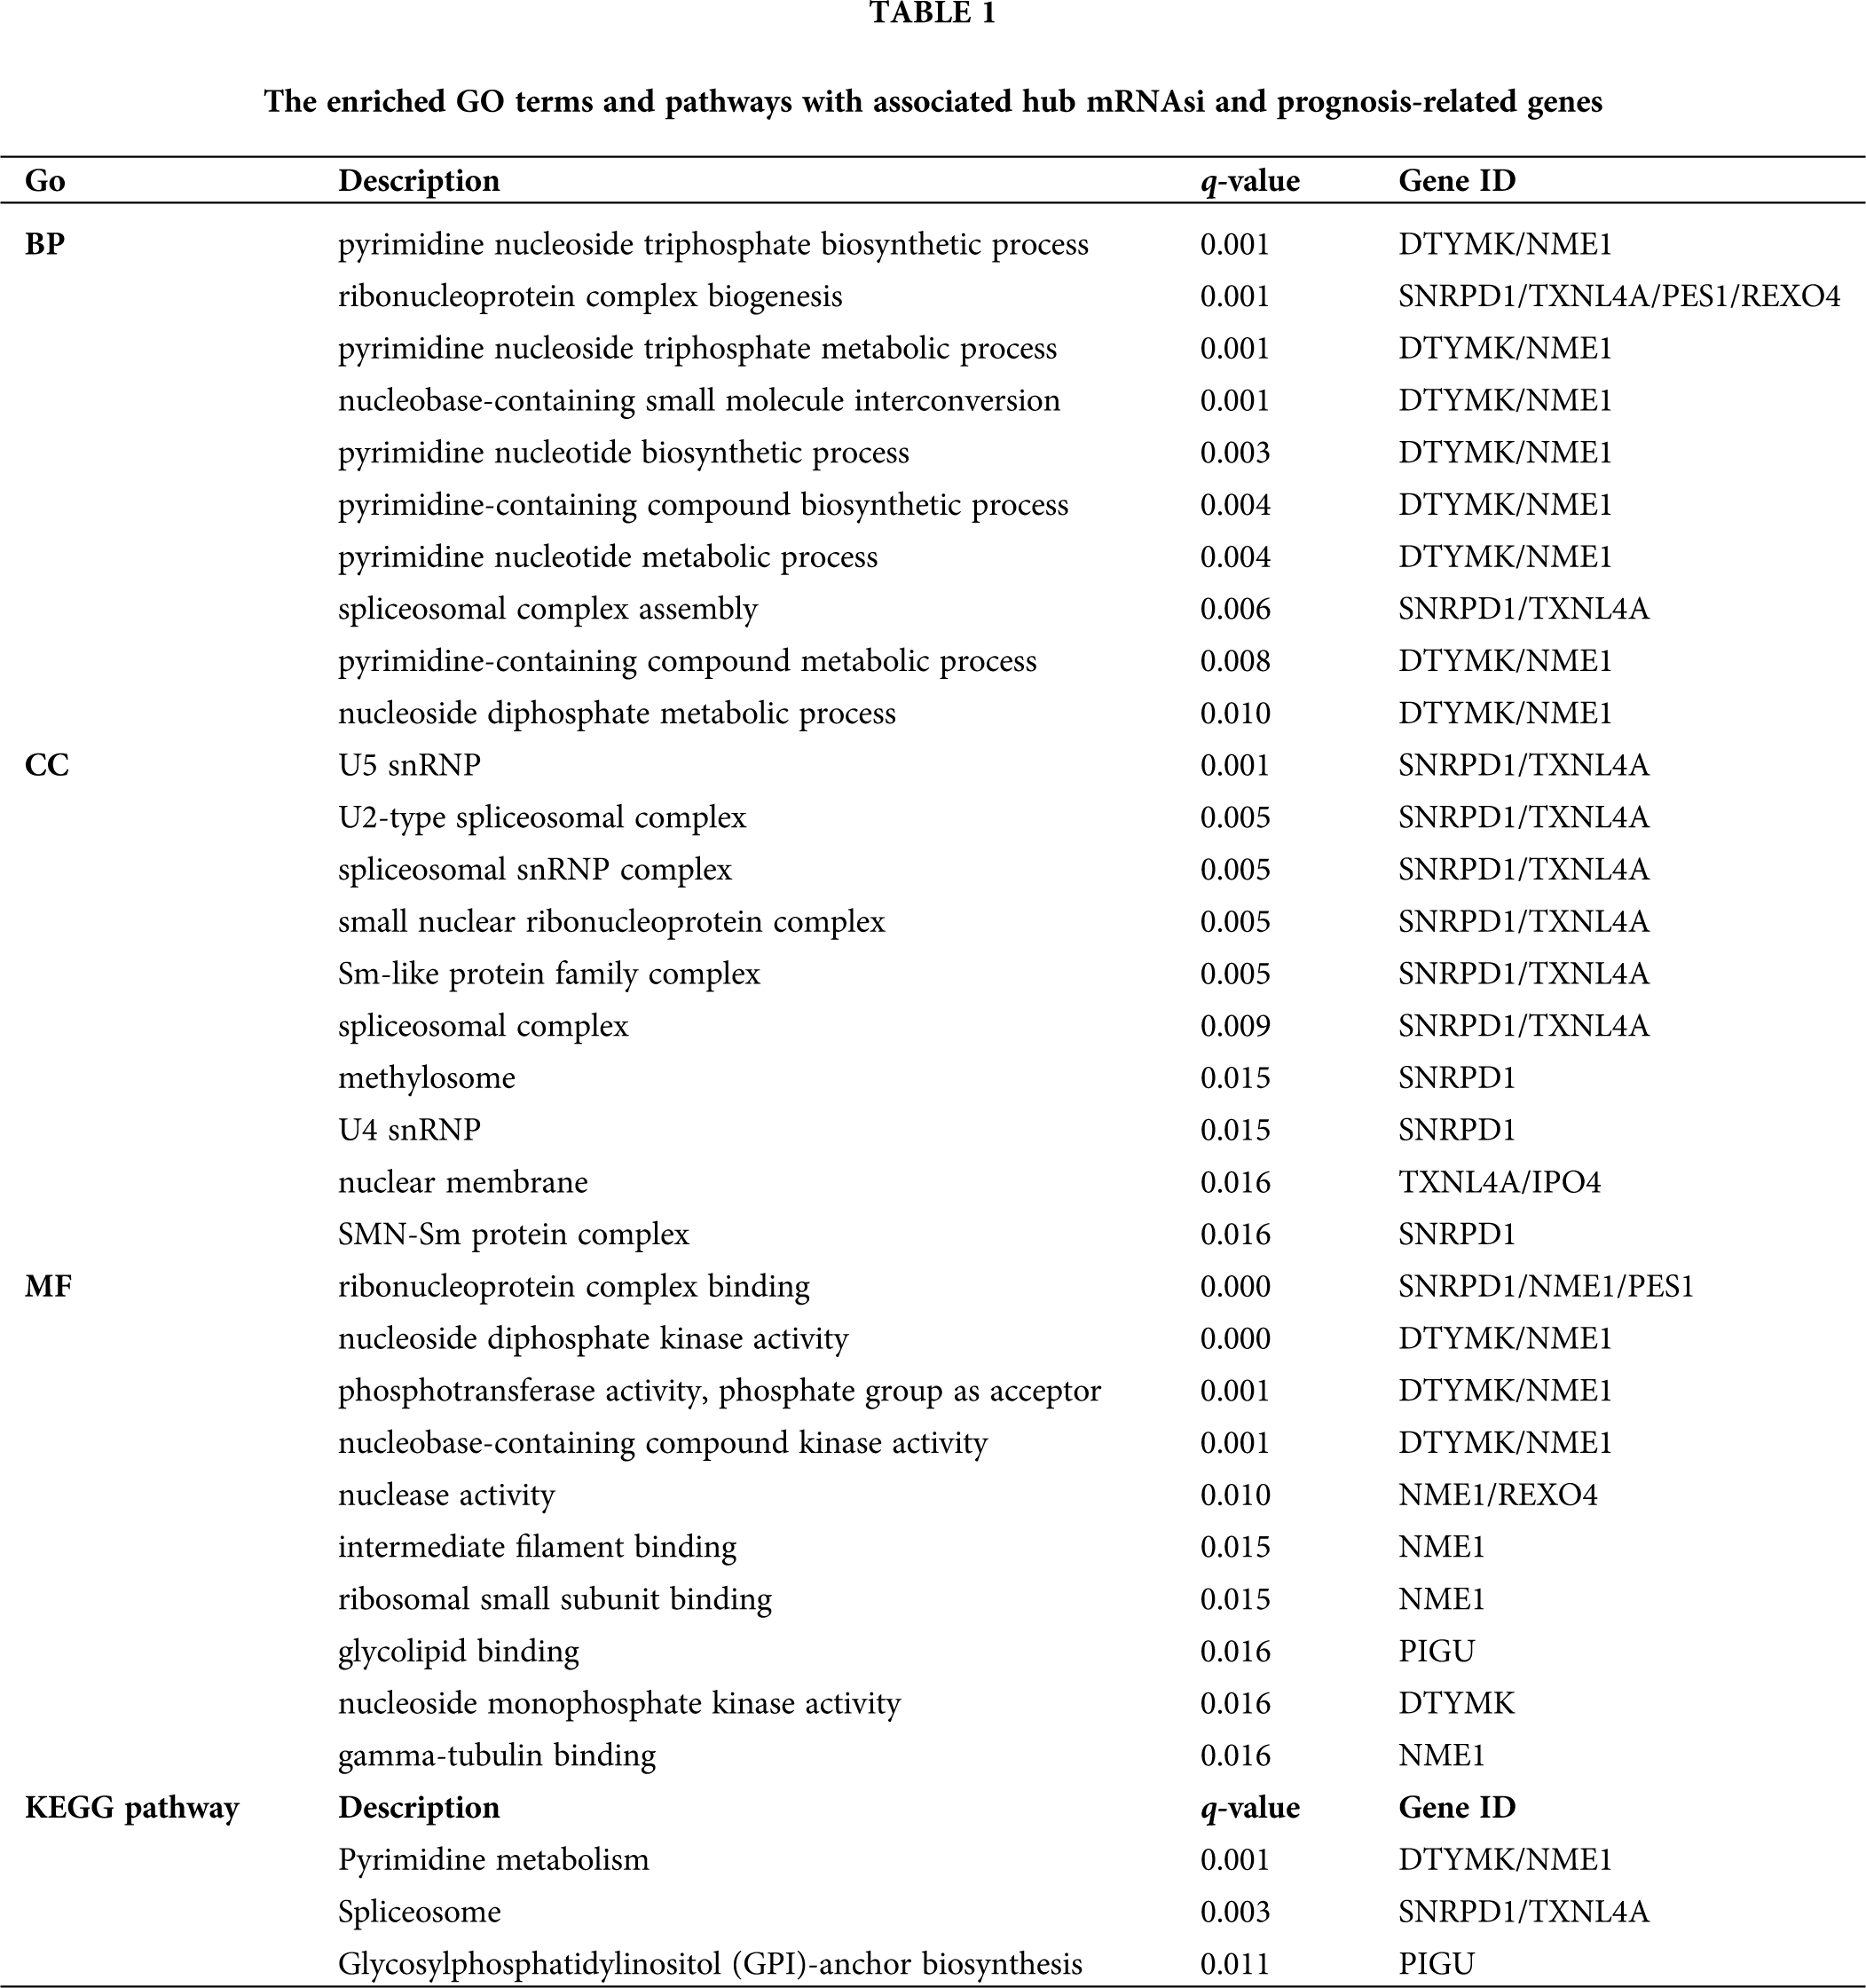
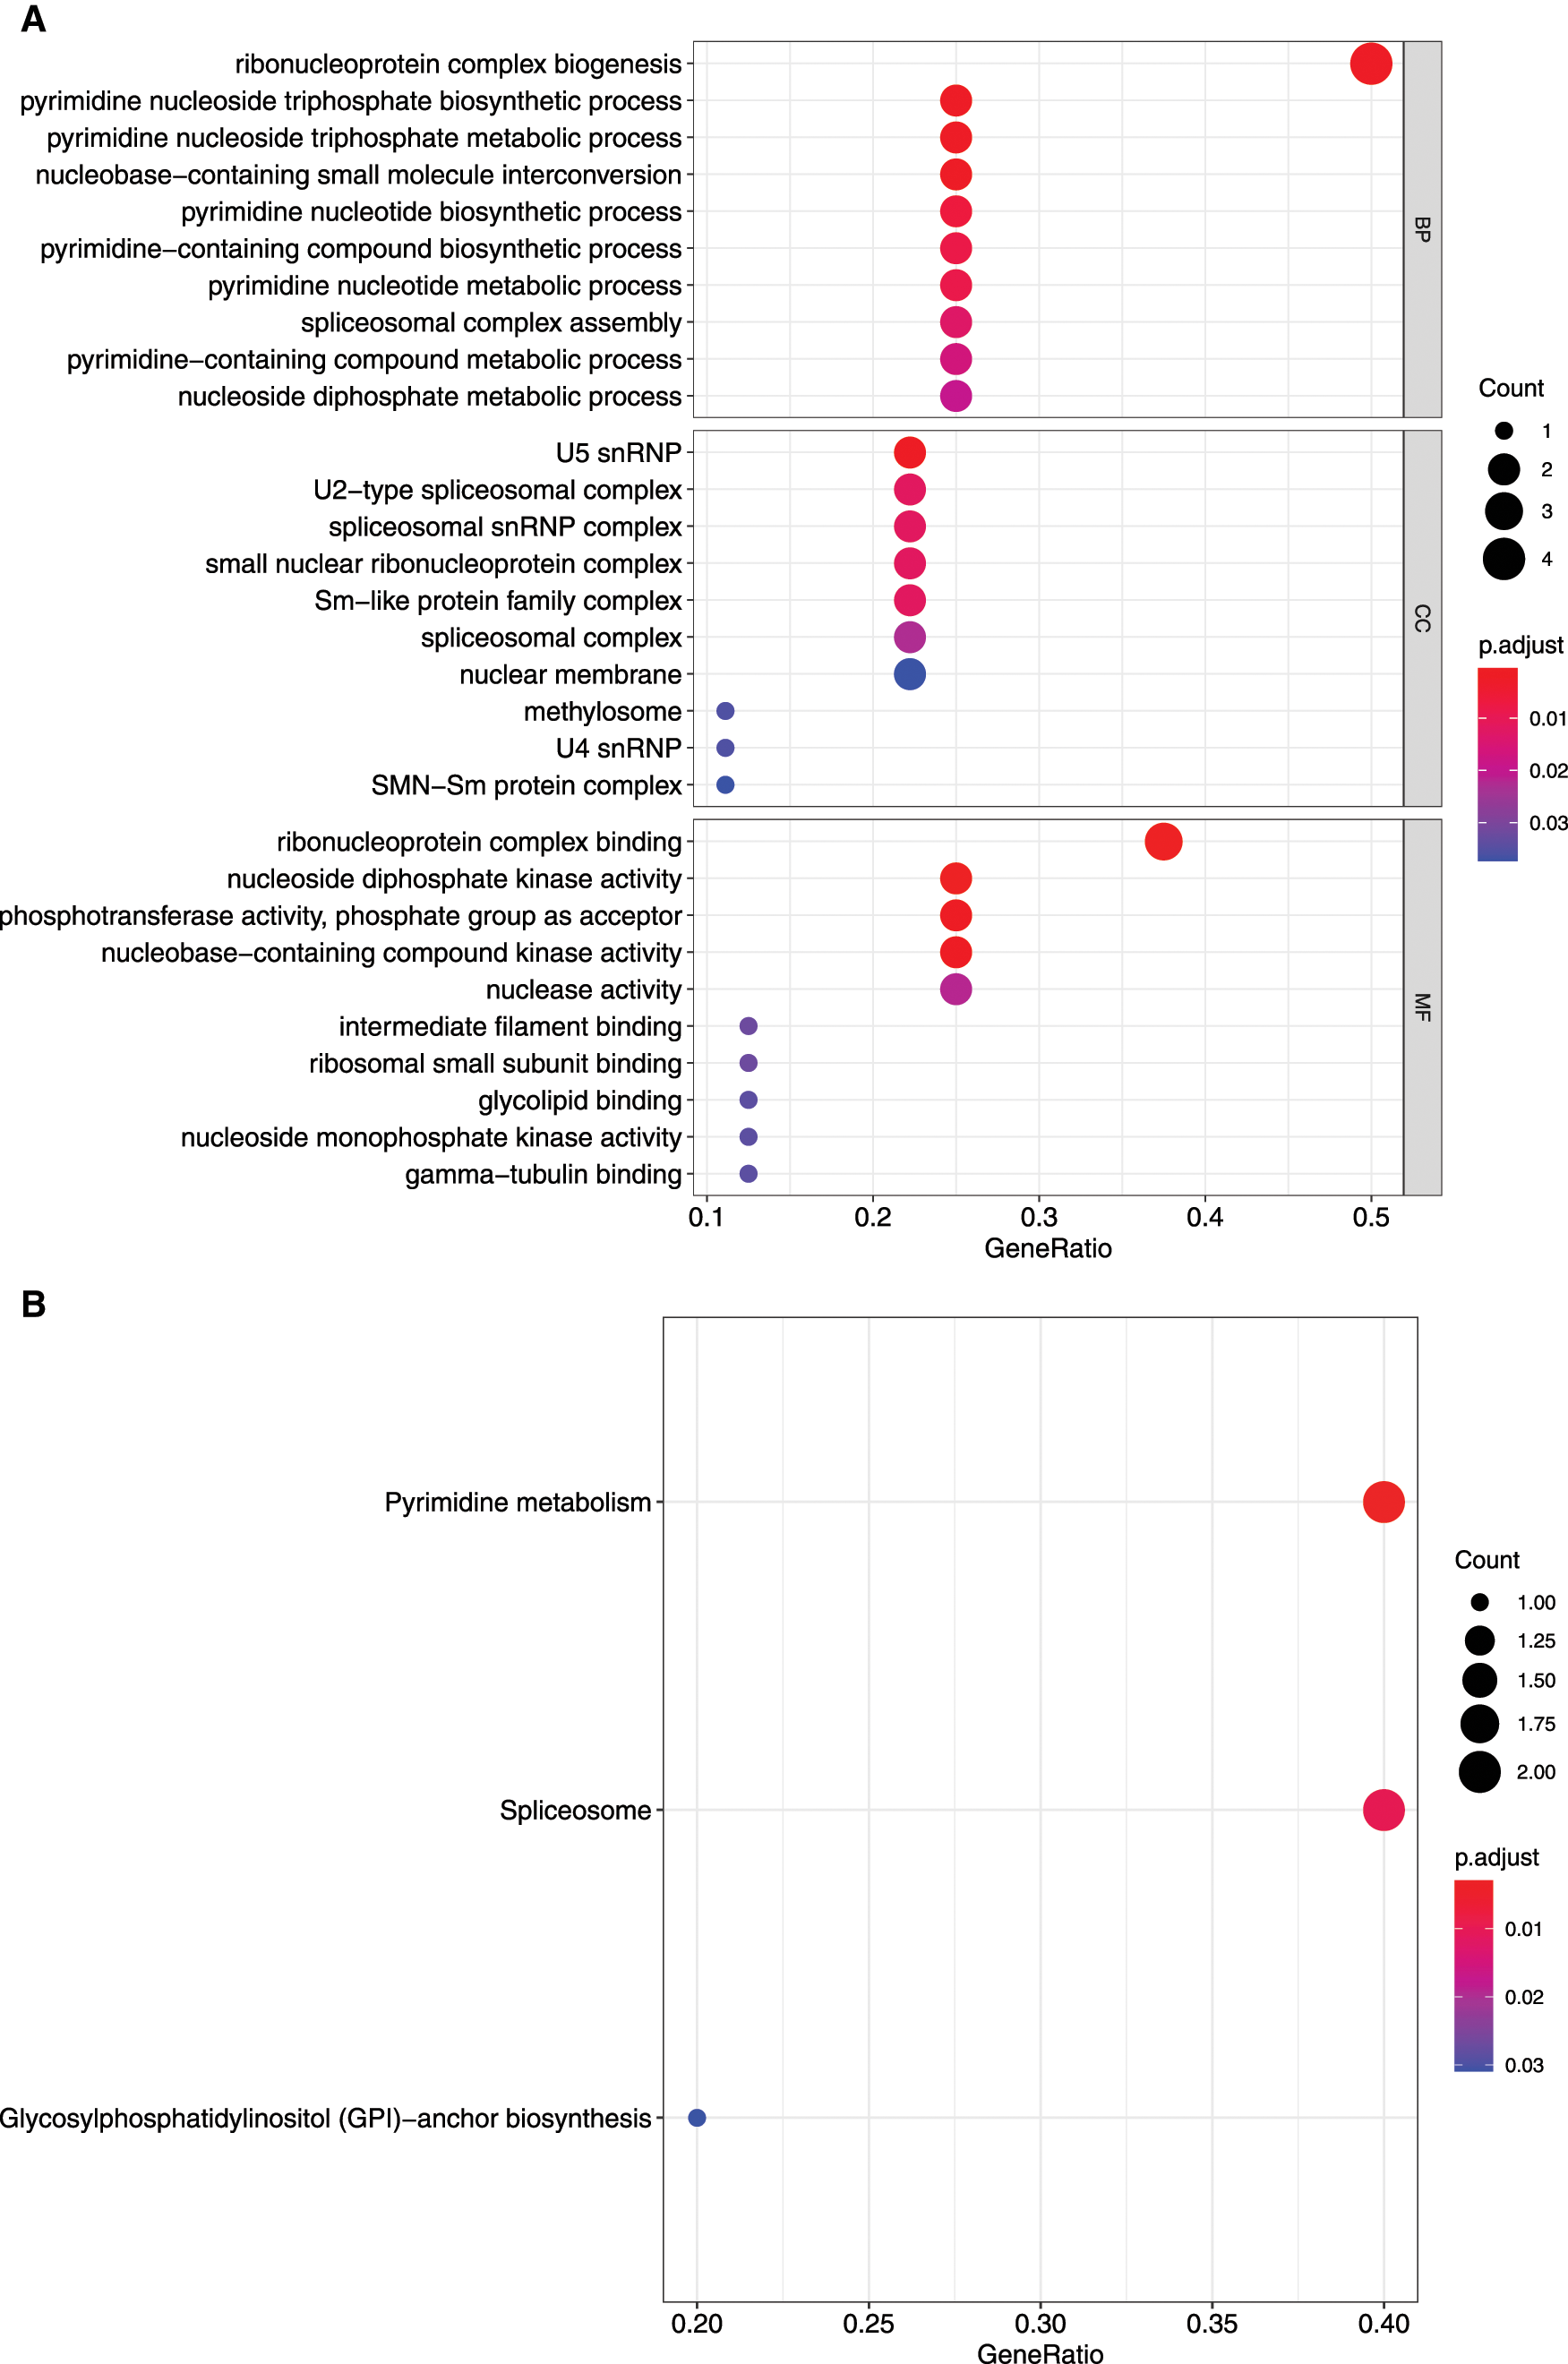
Figure 4: GO and KEGG enrichment analysis of mRNAsi and prognosis-related genes. A, GO analysis. Top 10 terms of Biological process (BP), cellular component (CC), and molecular function (MF) are shown, respectively. B, Enriched KEGG pathways.
CC analysis showed that the top 10 enriched terms were U5 snRNP, U2-type spliceosomal complex, spliceosomal snRNP complex, small nuclear ribonucleoprotein complex, Sm-like protein family complex, spliceosomal complex, methylosome, U4 snRNP, nuclear membrane, and SMN-Sm protein complex. The CC significantly enriched terms were all associated with nucleic acid proteins, and the major enriched genes were SNRPD1 and TXNL4A (Fig. 4A and Tab. 1).
MF analysis showed that the top 10 enriched terms were ribonucleoprotein complex binding, nucleoside diphosphate kinase activity, phosphotransferase activity, phosphate group as acceptor, nucleobase-containing compound kinase activity, nuclease activity, intermediate filament binding, ribosomal small subunit binding, glycolipid binding, nucleoside monophosphate kinase activity, and gamma-tubulin binding. The MF significantly enriched terms were all related to nucleic acid processing, and the major enriched genes were DTYMK and NME1 (Fig. 4A and Tab. 1).
The KEGG pathway analysis showed that DTYMK and NME1 enriched in pyrimidine metabolism, SNRPD1 and TXNL4A enriched in spliceosome, and PIGU enriched in glycosyl phosphatidylinositol (GPI)-anchor biosynthesis pathways (Fig. 4B and Tab. 1).
Identified three clusters of HCC samples base on mRNAsi and prognosis-related genes expression
To further evaluate the prognostic value of the mRNAsi and prognosis-related genes, the TCGA dataset were merged with the GEO (GSE76427) dataset. We clustered the tumor samples according to the expression of mRNAsi and prognosis-related genes. The clustering results showed that skew of cumulative distribution function (CDF) towards 0 at k = 3 (Fig. 5A), and areas of CDF at k = 3 were bigger than other cluster numbers (k) (Figs. 5B and 5C), suggesting that the tumor samples divided into three clusters was the optimal choice. To determine whether our classification was correct, we analyzed the clustering of the three clusters of samples using principal component analysis (PCA), the distribution of the three subgroups was significantly different from each other (Fig. 5D).
Compared with the clinical outcomes and clinicopathological features among the three sample clusters
In order to further analyze the differences between the HCC samples of the 3 clusters, we used KM survival analysis and one-way ANOVA analysis to analyze the differences in survival and clinicopathological characteristics of the three clusters of patients. The results showed that the KM survival curves of OS of the three clusters were significantly different, and the survival rates of cluster C patients within 5 years were significantly greater than that of Clusters A and C patients (Fig. 5E, P < 0.01). Consistent with the survival, the prognosis of Cluster C was the best one (alive vs. dead, P < 0.05; Fig. 5E). Comparing the differences in mRNAsi and prognosis-related genes expression and clinicopathological characteristics among the three subgroups, the expression of mRNAsi and prognosis-related genes in Cluster B was significantly higher than that in Clusters A and C, and the stage, gender, and age among these three subgroups were significantly different (Fig. 5F, P < 0.05). Thus, we defined the characteristics of three subgroups as A, moderate prognosis with irregular expression of the 9-gene signature; B, low prognosis with high expression of the 9-gene signature; and C, high prognosis with low expression of the 9-gene signature.
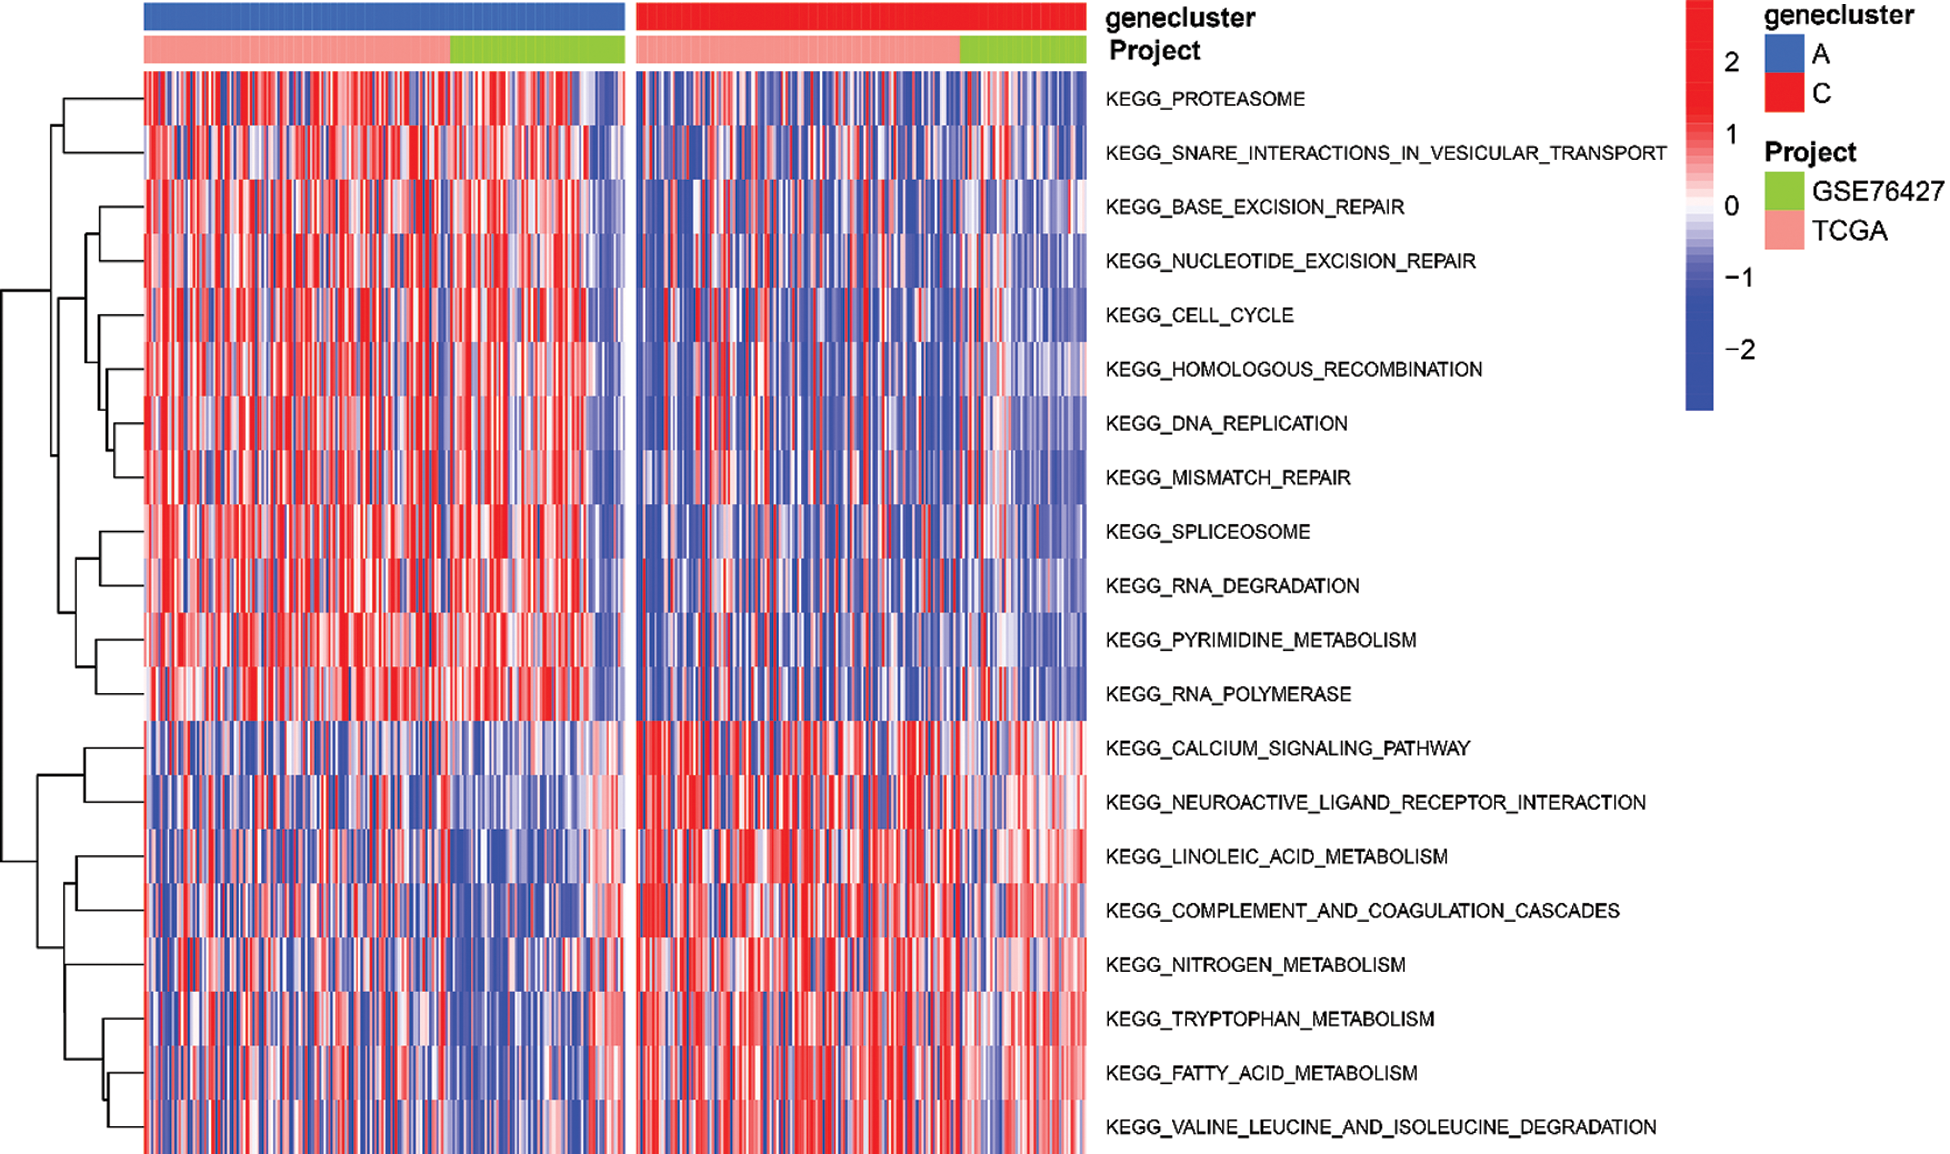
To explore the biological function of the 9-gene signature in the three HCC sample clusters, we performed gene set variation analysis (GSVA) enrichment analysis to enrich the pathways in A, B and C clusters. The results showed that the top 10 enriched pathway terms of Cluster A vs. Cluster B were primary bile acid biosynthesis, complement and coagulation cascades, fatty acid metabolism, glycine serine and threonine metabolism, retinol metabolism, drug metabolism cytochrome p450, valine leucine and isoleucine degradation, tryptophan metabolism, propanoate metabolism, and beta alanine metabolism (Fig. 5G). The top 10 enriched pathway terms of Cluster B vs. Cluster C were nucleotide excision repair, non-homologous end joining, RNA degradation, mismatch repair, cell cycle, RNA polymerase, ribosome, homologous recombination, spliceosome, and DNA replication (Fig. 5H). The top 10 enriched pathway terms of Cluster A vs. Cluster C were DNA replication, spliceosome, ribosome, homologous recombination, mismatch repair, RNA polymerase, proteasome, cell cycle, RNA degradation, base excision repair, nucleotide excision repair, non-homologous end joining, pyrimidine metabolism, protein export, and ubiquitin mediated proteolysis (Supplemental Fig. 1).
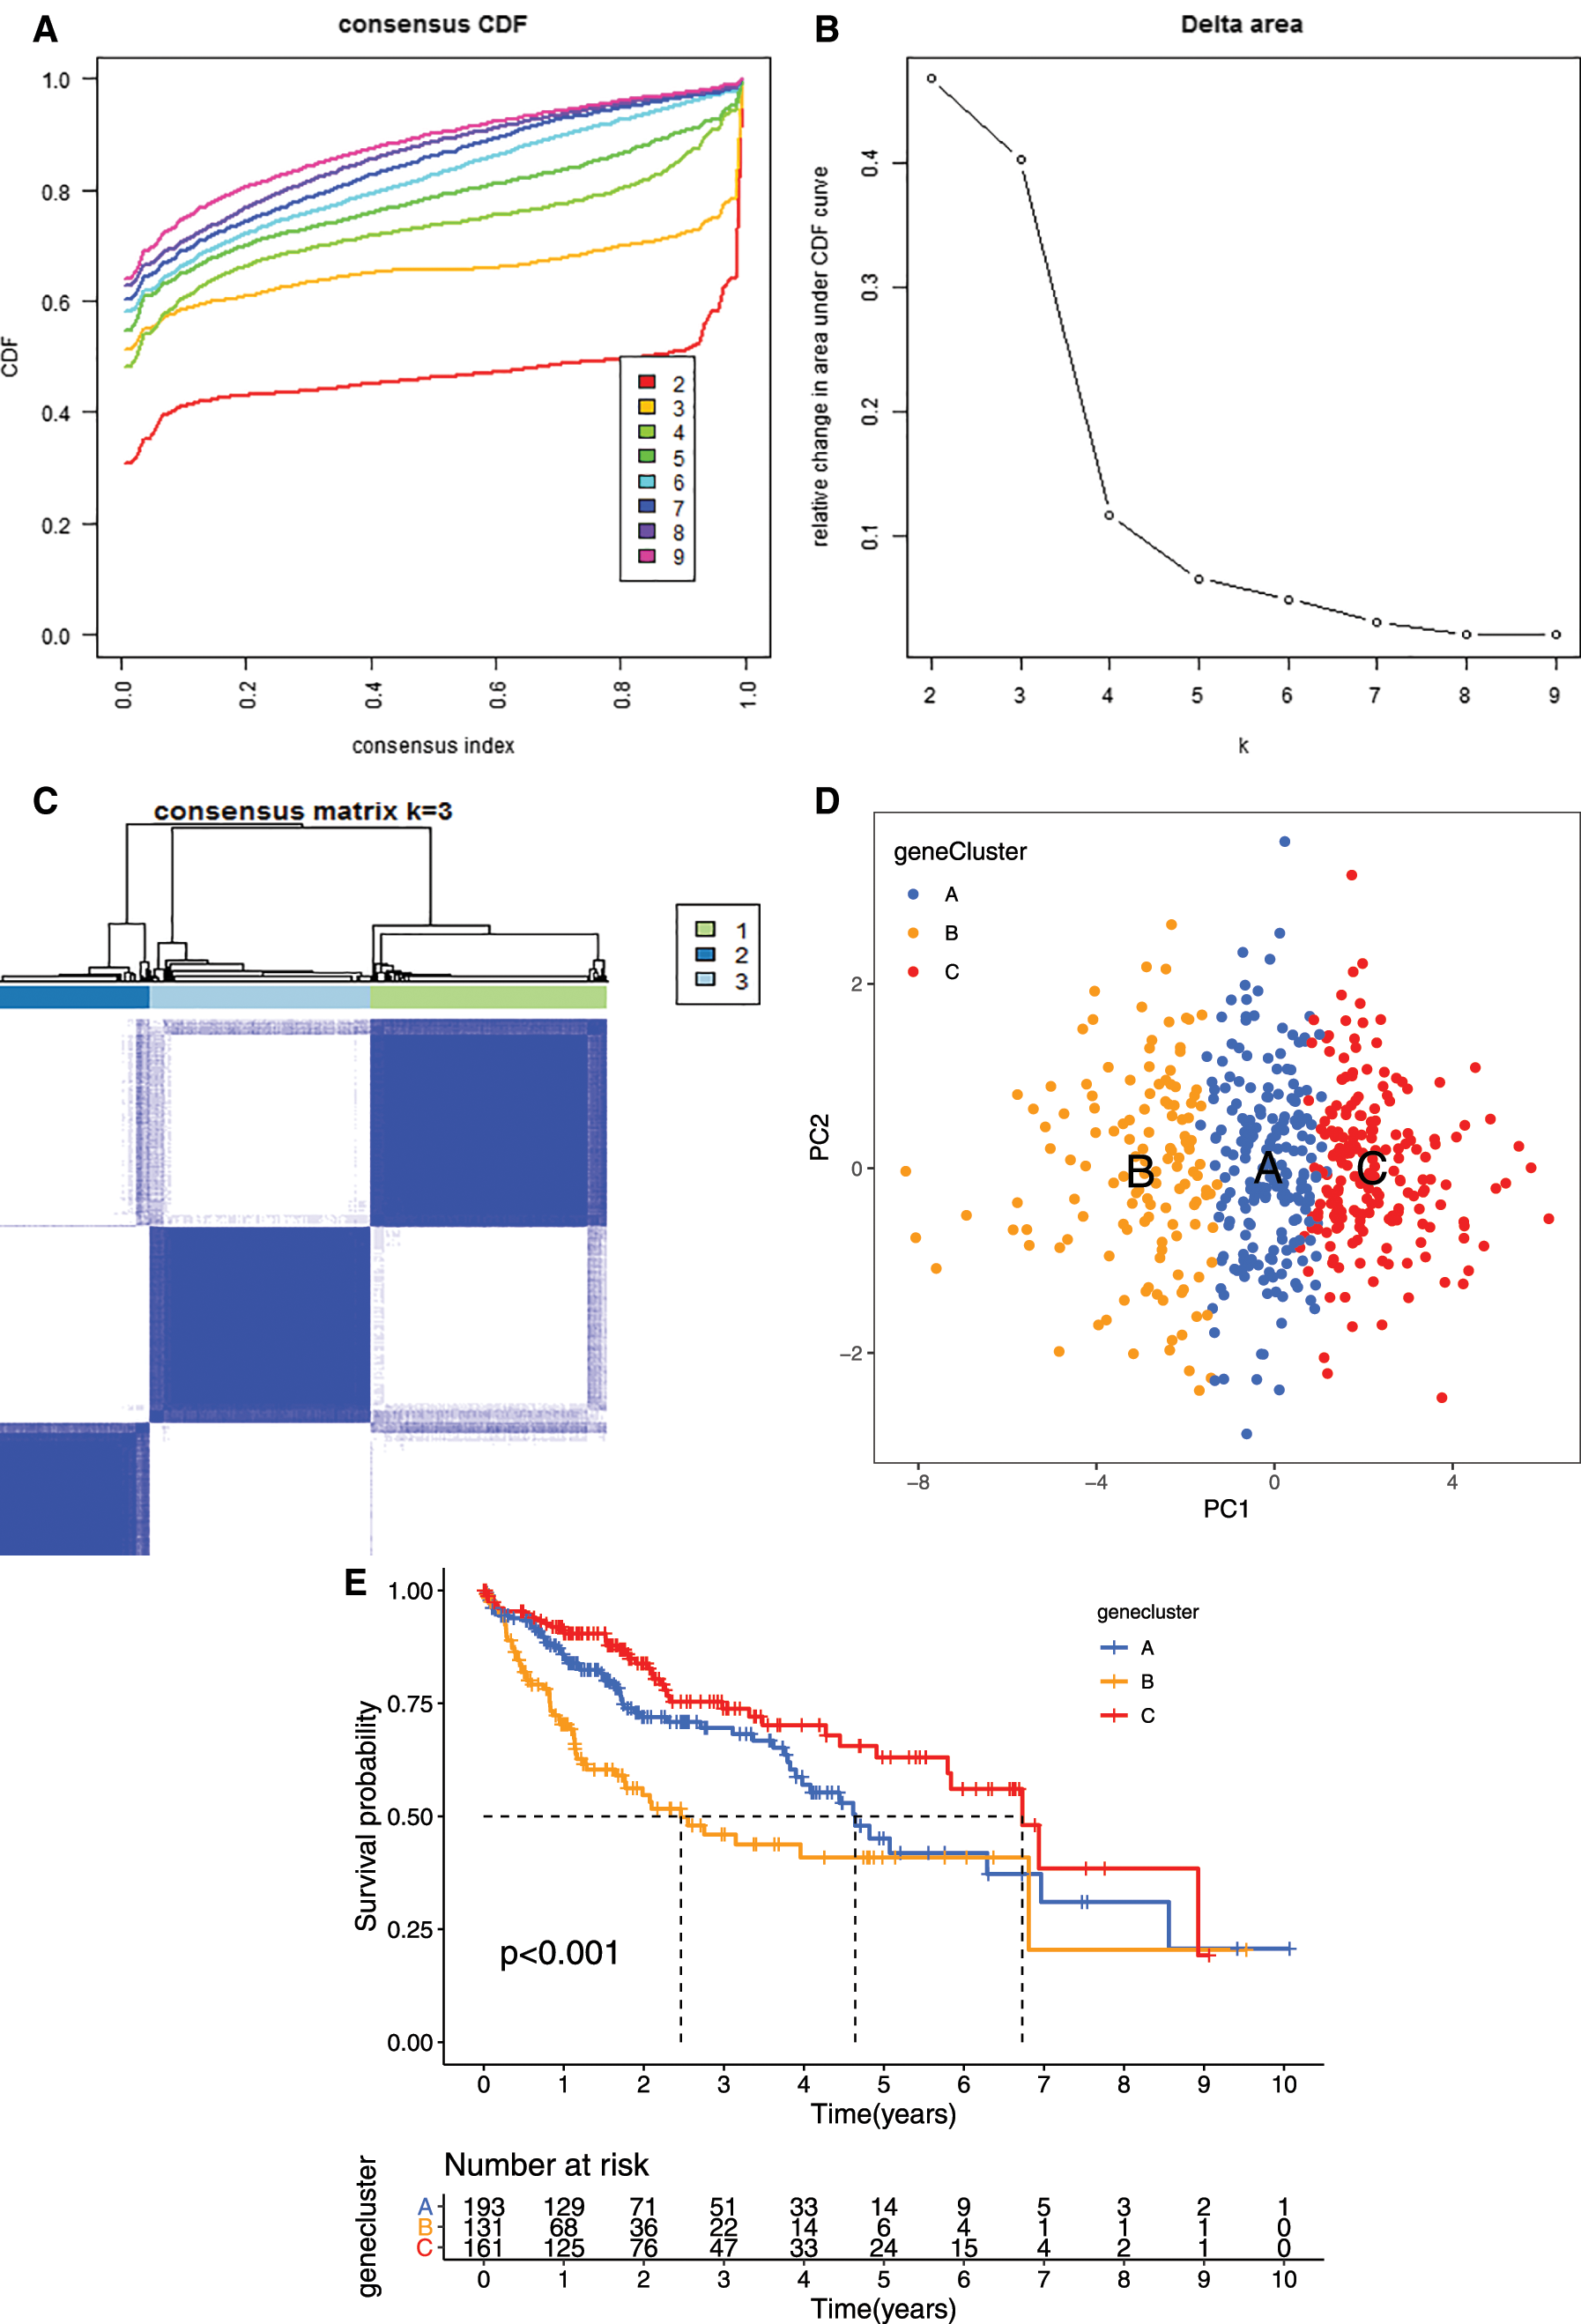
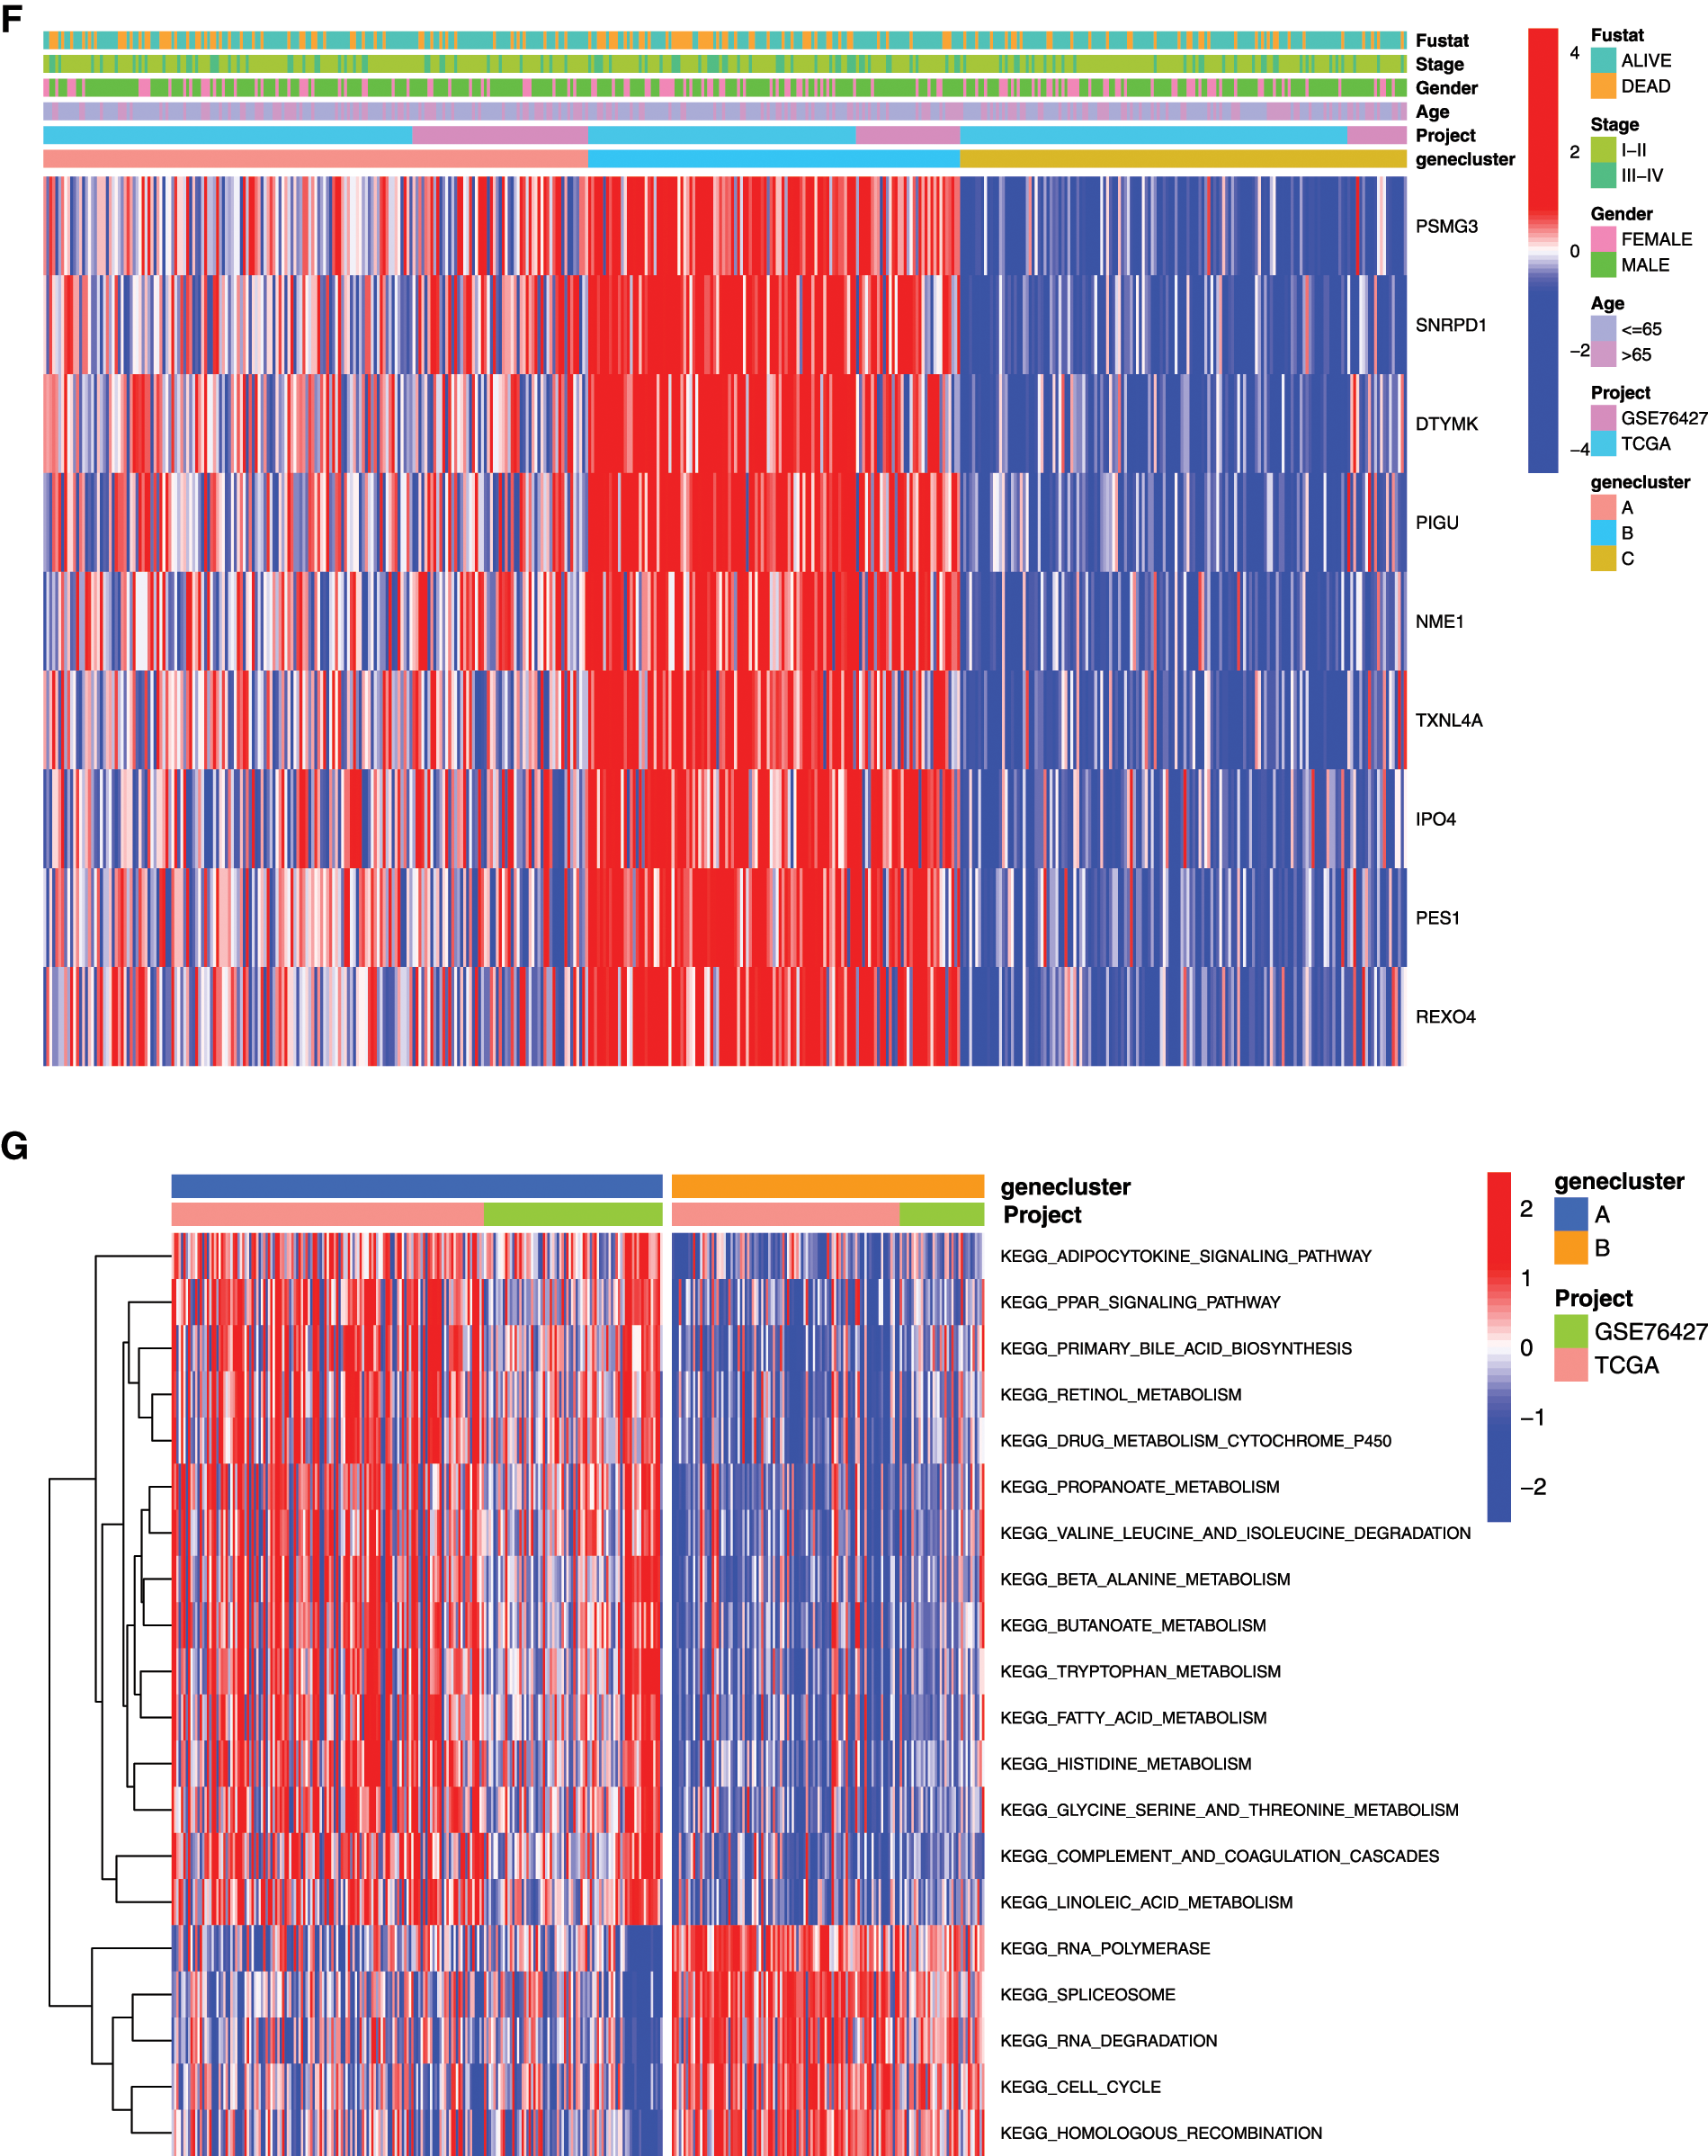
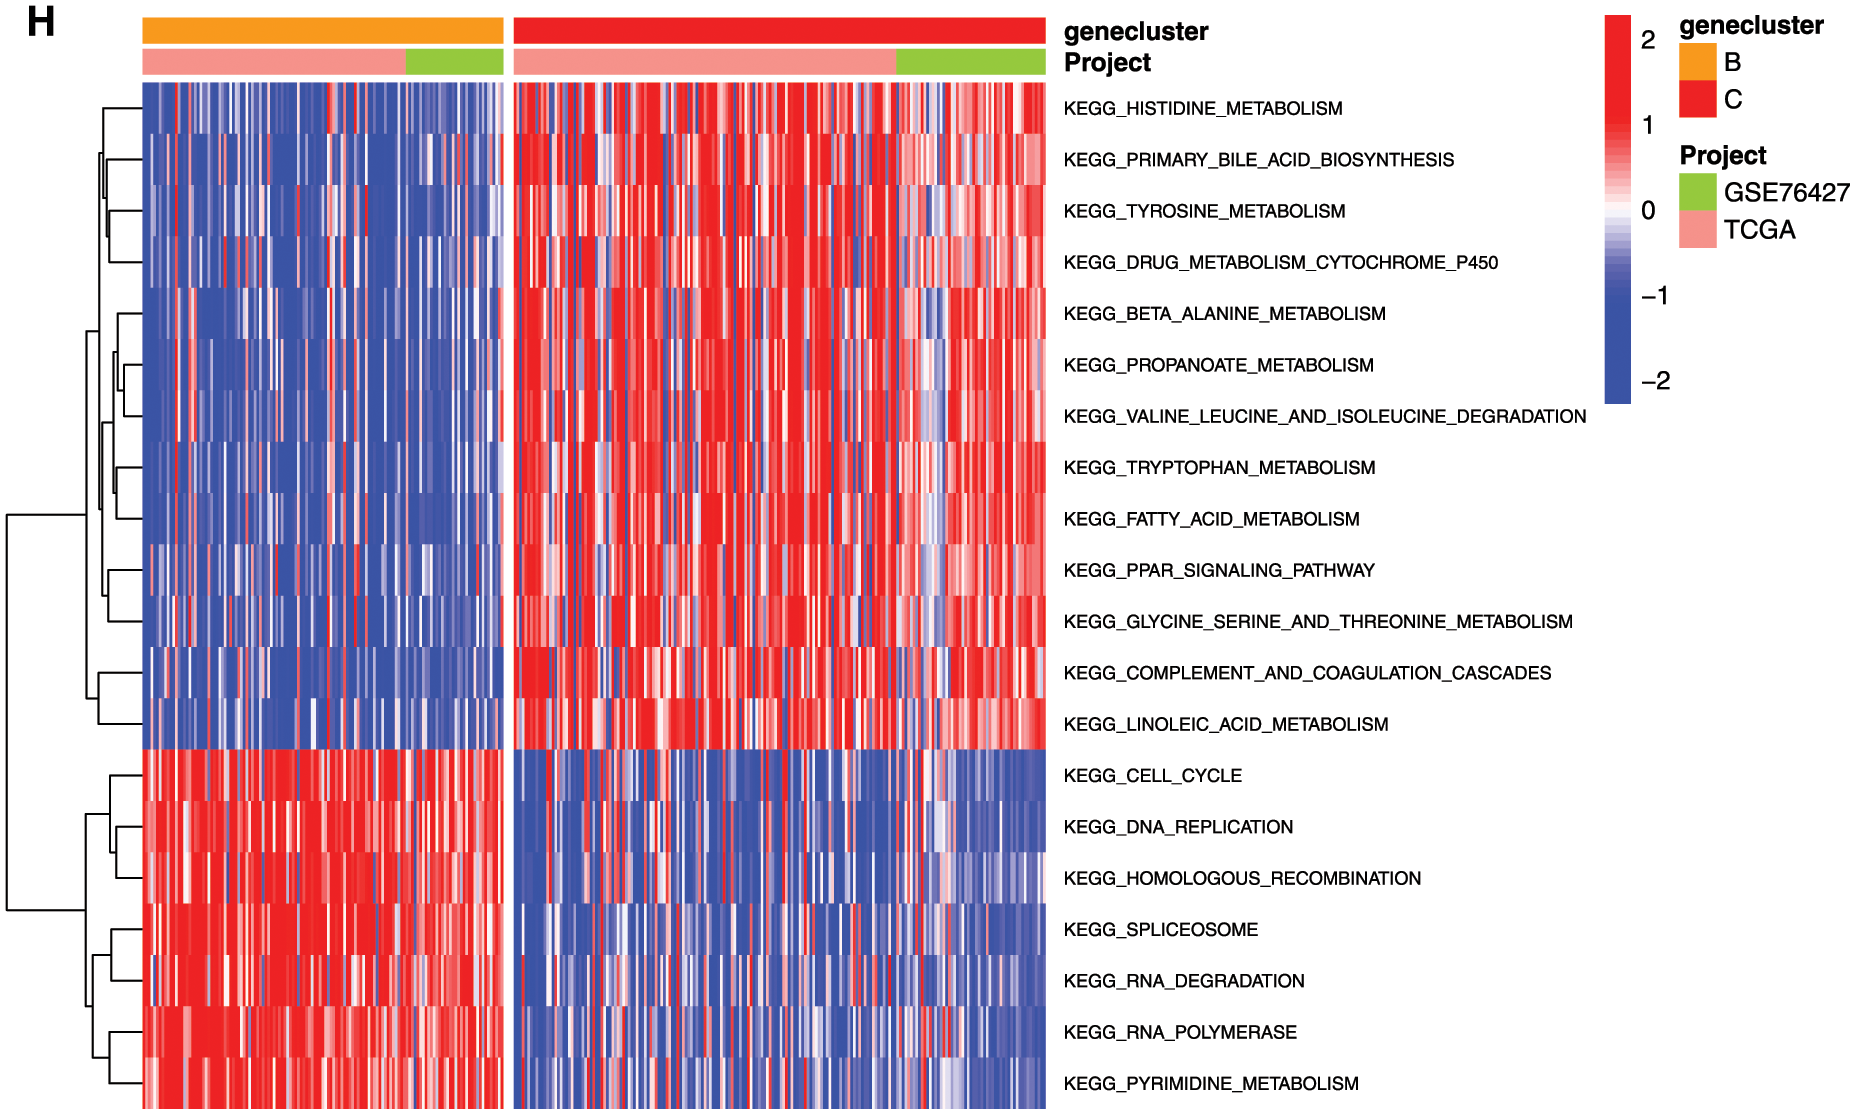
Figure 5: Clustering tumor samples into subgroups based on expression using the consensus k-means clustering and the clinical outcomes and clinicopathological features among different clusters. A, Relative change in area under CDF curve for k = 2 to k = 10. B, Cumulative distribution function (CDF) plots corresponding to the consensus matrices for cluster numbers k = 2 to k = 10. This plot shows the cumulative distribution of the entries of the consensus matrices within the 01 range. Skew towards 0 and 1 indicates good clustering. C, The consensus matrix shows the robustness of the discovered clusters to sampling variability for k = 3. The good clustering and robustness at k = 3 suggest that the tumor samples divided into three clusters was the optimal choice. D, Principal component analysis (PCA) of the gene expression profiles in the three clusters. E, Kaplan-Meier overall survival (OS) curves for three clusters. F, Heatmap, and clinicopathologic features of the three clusters defined by the mRNAsi and prognosis-related genes consensus expression. *P < 0.05; **P < 0.01. G, The heatmap of these different biological processes of Cluster A vs. Cluster B. H, The heatmap of these different biological processes of Cluster B vs. Cluster C. Red represented activated pathways and blue represented inhibited pathways.
ssGSEA analysis revealed the infiltration level of 23 immune cell types in the immune microenvironment. We found that the infiltration level of activated.CD4.T.cell, eosinophil cell, macrophage cell, mast cell, monocyte cell, natural killer T cell, natural killer cell, neutrophil cell, plasmacytoid dendritic cell, regulatory T cell, T follicular helper cell, Type1 T helper (Th1) cell, and Type 2 T helper (Th2) cell were significantly different among the three clusters (Fig. 6).
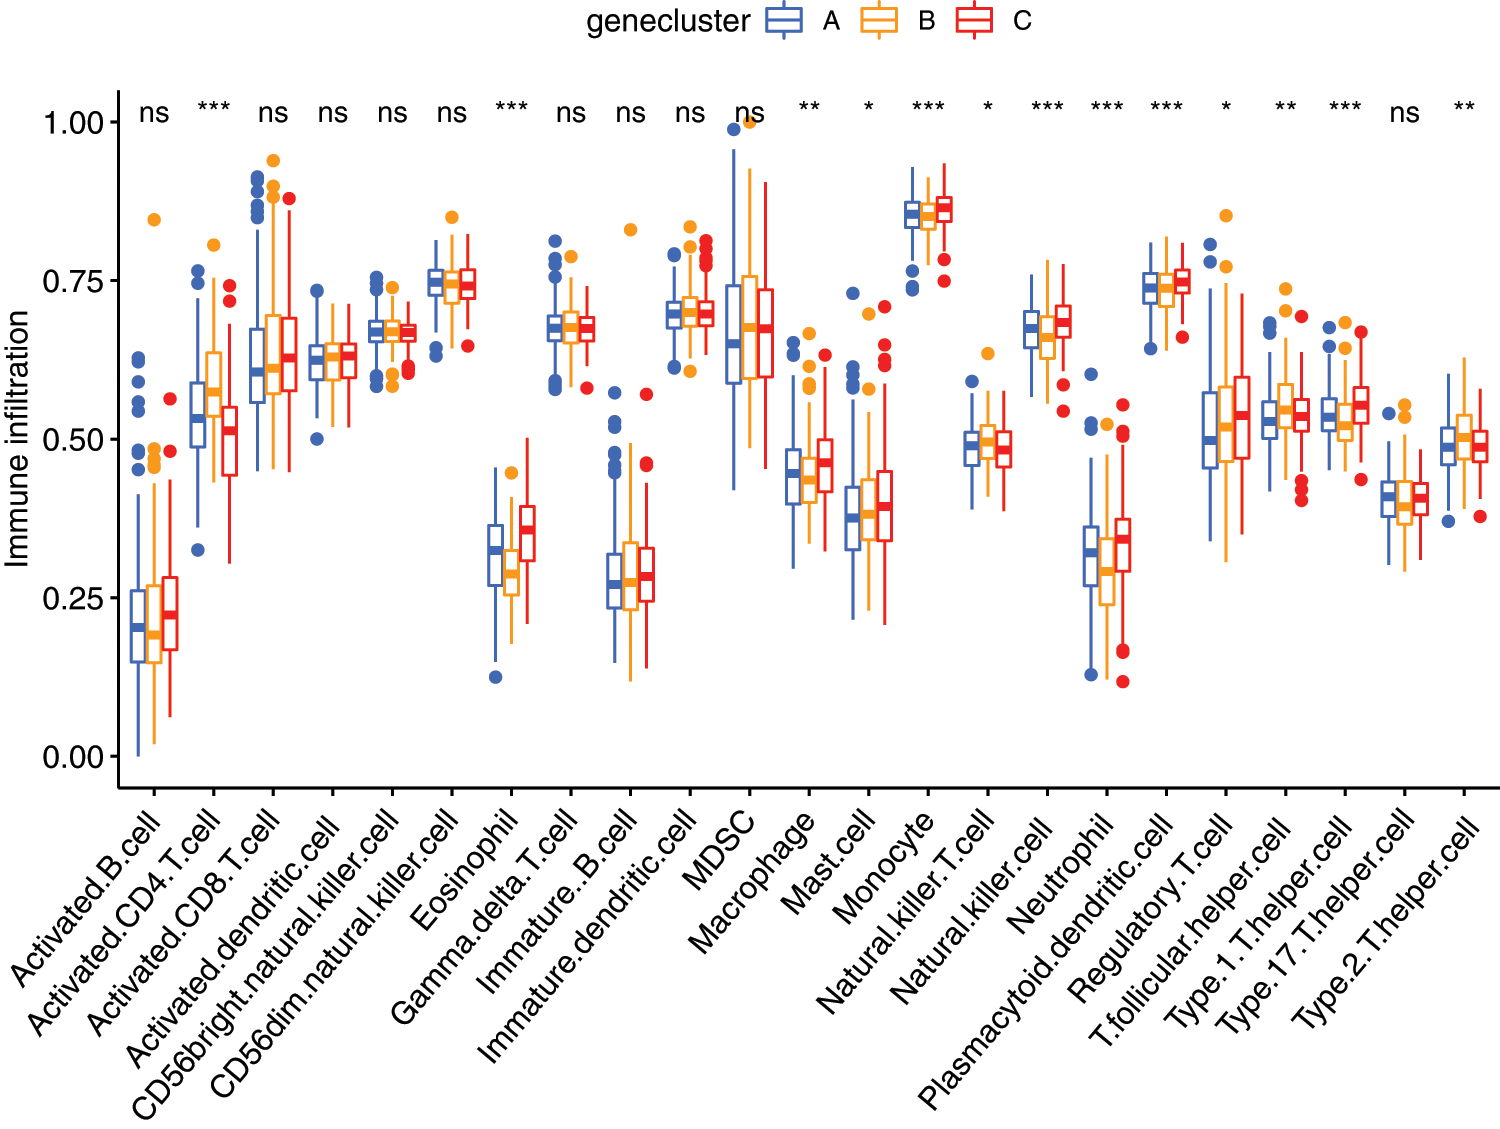
Figure 6: The abundance of each infiltrating cell in tumor environment in three cluster groups. *P < 0.05, **P < 0.01, ***P < 0.001.
Prognostic value of mRNAsi and prognosis-related genes
To better understand the prognostic role of mRNAsi and prognosis-related genes in HCC, we performed univariate Cox regression analysis. The univariate Cox regression analysis results showed that high expression of PES1 (HR = 1.669, 95%CI = 1.270–2.192), PSMG3 (HR = 1.332, 95%CI = 1.086–1.633), TXNL4A (HR = 1.709, 95%CI = 1.289–2.267), DTYMK (HR = 1.679, 95%CI = 1.345–2.097), IPO4 (HR = 1.916, 95%CI = 1.285–2.858), SNRPD1 (HR = 1.583, 95%CI = 1.233–2.032), PIGU (HR = 2.006, 95%CI = 1.513–2.660), REXO4 (HR = 1.905, 95%CI = 1.393–2.606), NME1 (HR = 1.358, 95%CI = 1.113–1.658) had a poor prognosis in HCC (Fig. 7A). As all the 9 genes were significant in the univariate cox regression analysis, the multifactorial regression model was further shown that PIGU was an independent prognostic factor (HR = 2.01, 95%CI = 1.51-2.66, P < 0.0001).
By assigning a risk score to each patient, patients were divided into high- and low-risk subgroups according to the cut-off value (Supplemental Tab. 8). Then, KM survival analysis showed that there was a significant difference in the survival of patients in the high-risk and low-risk subgroups at different times (Fig. 7B, P < 0.001), and ROC for model validation showed that the prediction efficiency of the model was 0.672 (Fig. 7C), suggesting that the model has a good predictive role. The riskScore of each patient in the high- and low-risk groups were visualized, we found that the dead persons were increased with the riskScore (Supplemental Fig. 2).
Gene set enrichment analysis (GSEA) analysis was performed based on the risk scores. In the high-risk subgroup, GO analysis were predominantly enriched in RNA catabolic process, regulation of cell cycle phase transition, cell cycle G2-M phase transition, mRNA cis splicing via spliceosome, non-canonical Wnt signaling pathway, rRNA catabolic process, negative regulation of response to DNA damage stimulus, and regulation of intrinsic apoptotic signaling pathway (Fig. 7D). KEGG analysis was predominantly enriched in spliceosome, RNA degradation, pyrimidine metabolism, DNA replication, n glycan biosynthesis, cell cycle, RNA polymerase, pathways in cancer, Wnt signaling pathway, mismatch repair, etc. (Fig. 7E). In the low-risk subgroup, the GO analysis enriched in cellular amino acid catabolic process, alpha amino acid catabolic process, aspartate family amino acid catabolic process, aromatic amino acid family catabolic process, branched chain amino acid catabolic process, glutamate metabolic process, sulfur amino acid metabolic process, monocarboxylic acid metabolic process, alpha amino acid metabolic process, etc. (Fig. 7F). The KEGG analysis enriched in tryptophan metabolism, valine leucine and isoleucine degradation, glycine serine and threonine metabolism, arginine and proline metabolism, tyrosine metabolism, phenylalanine metabolism, alanine aspartate and glutamate metabolism, pyruvate metabolism, and starch and sucrose metabolism (Fig. 7G).
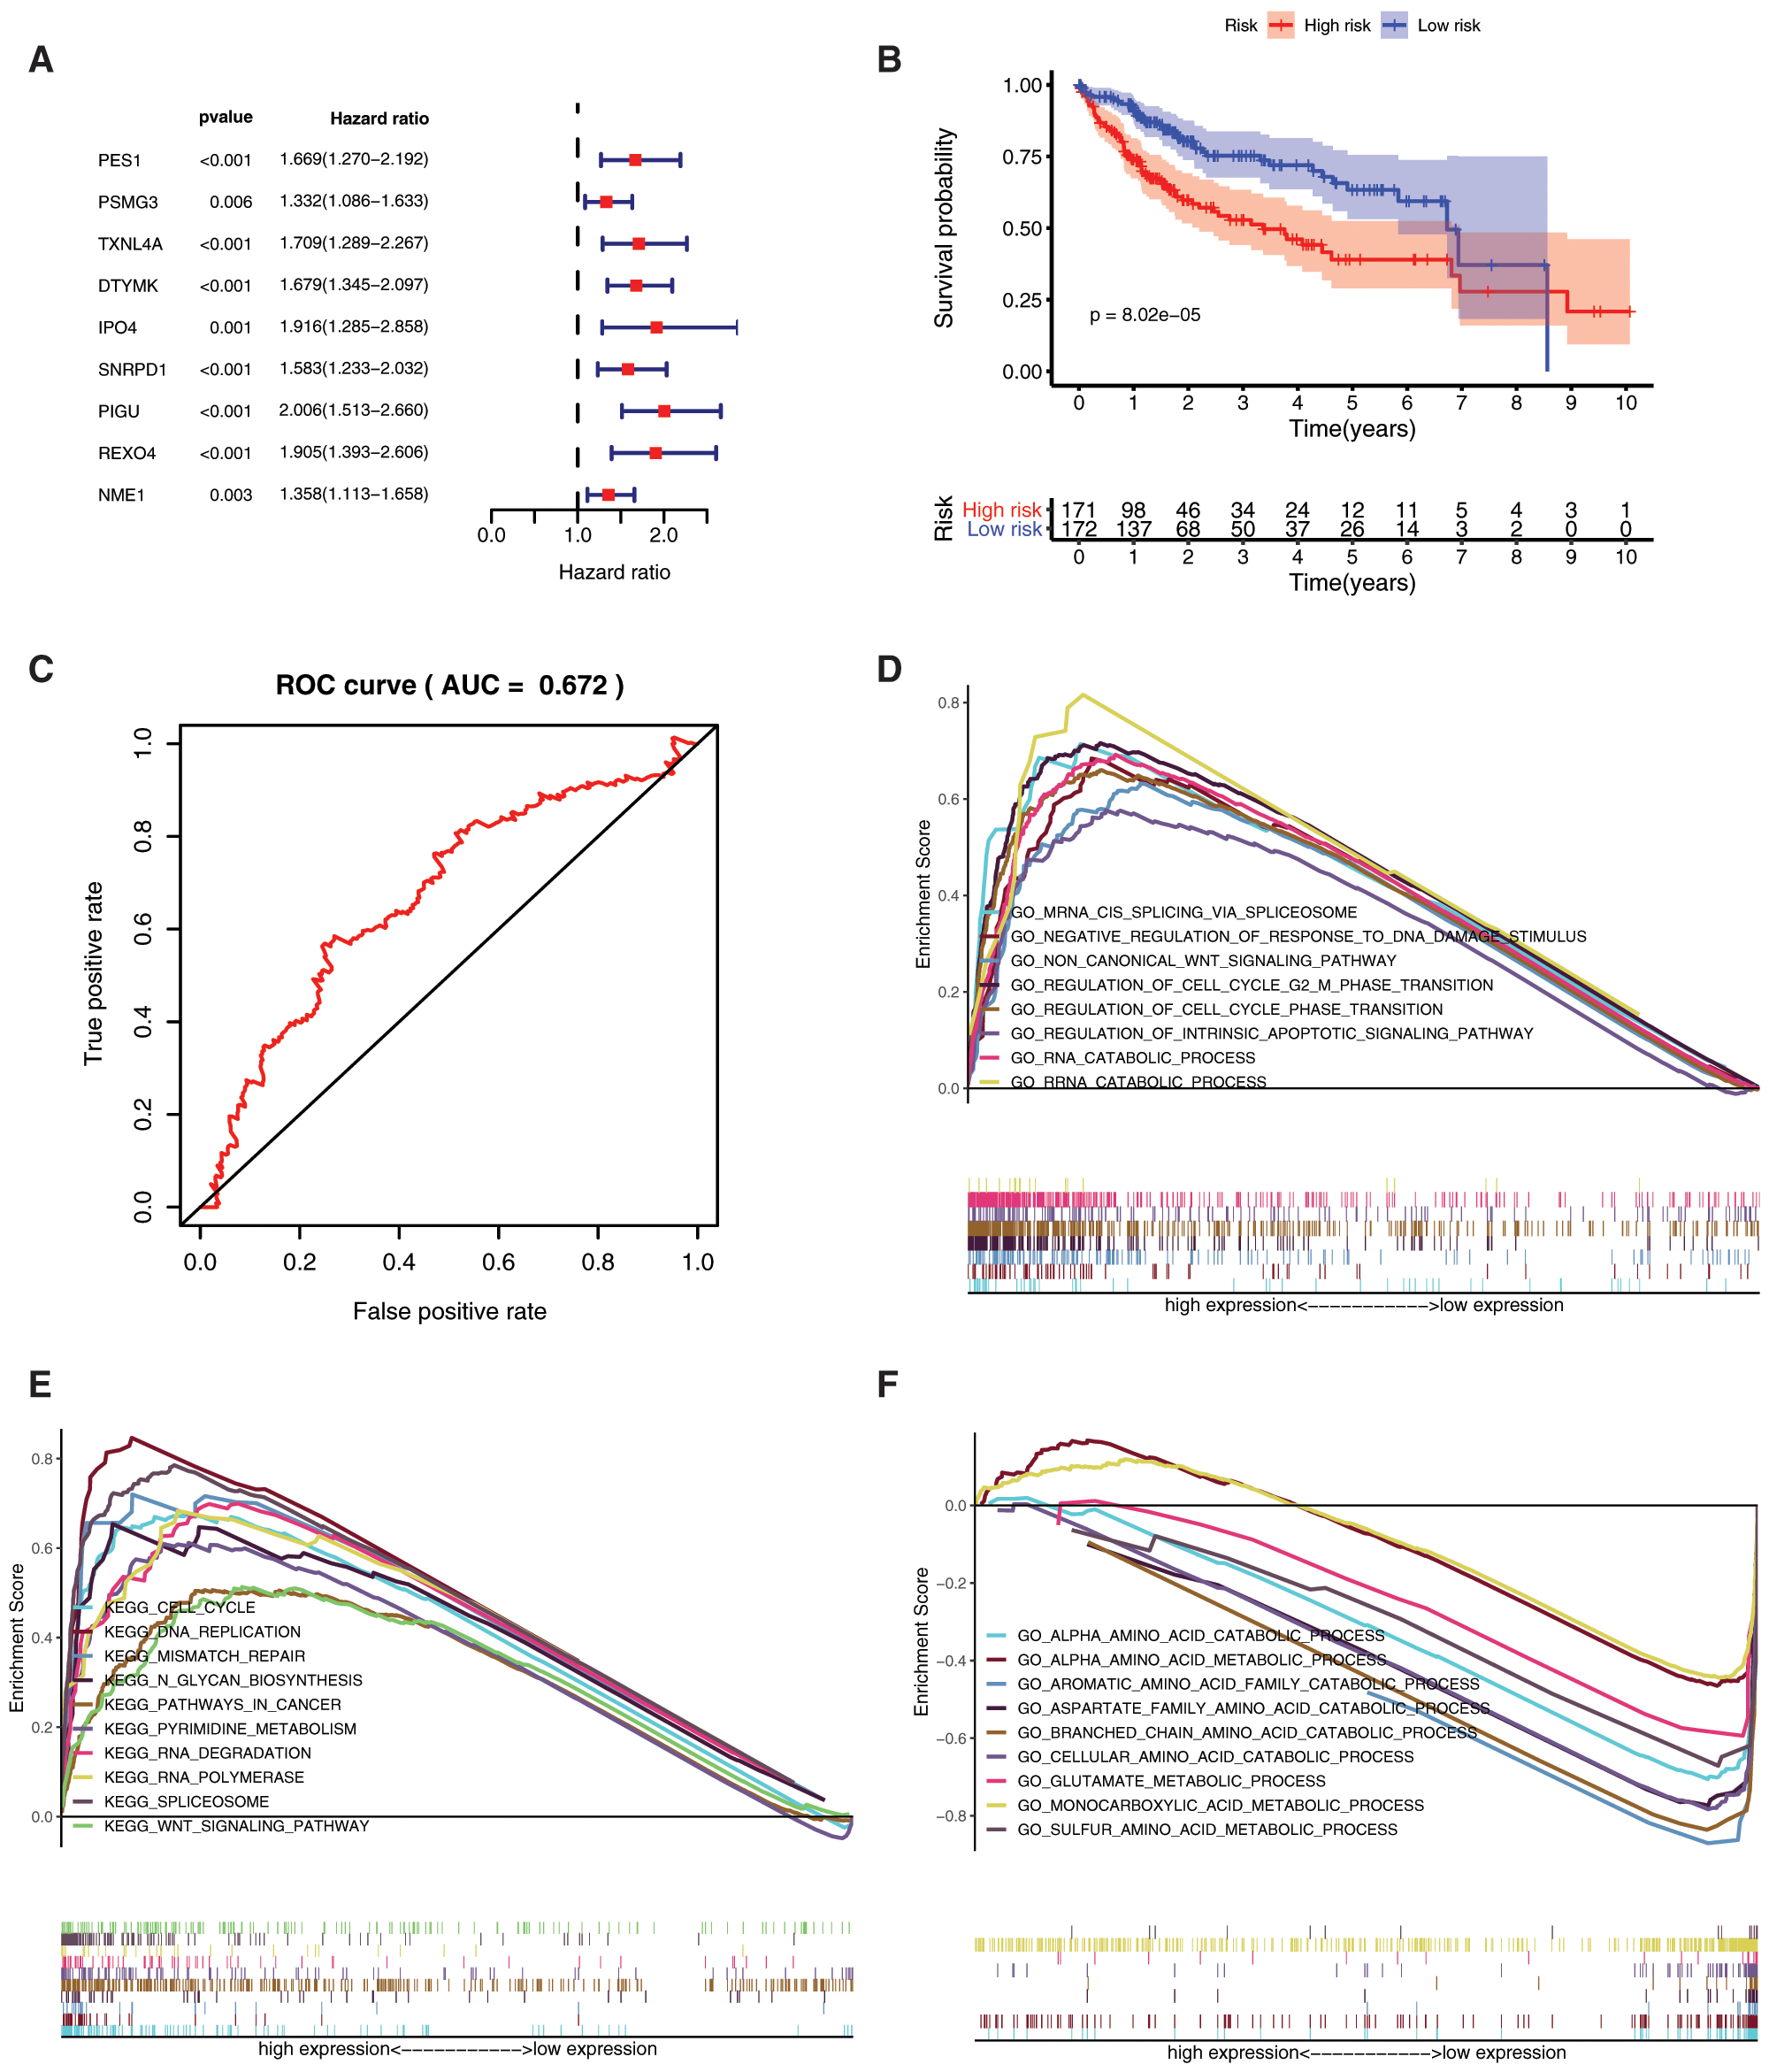
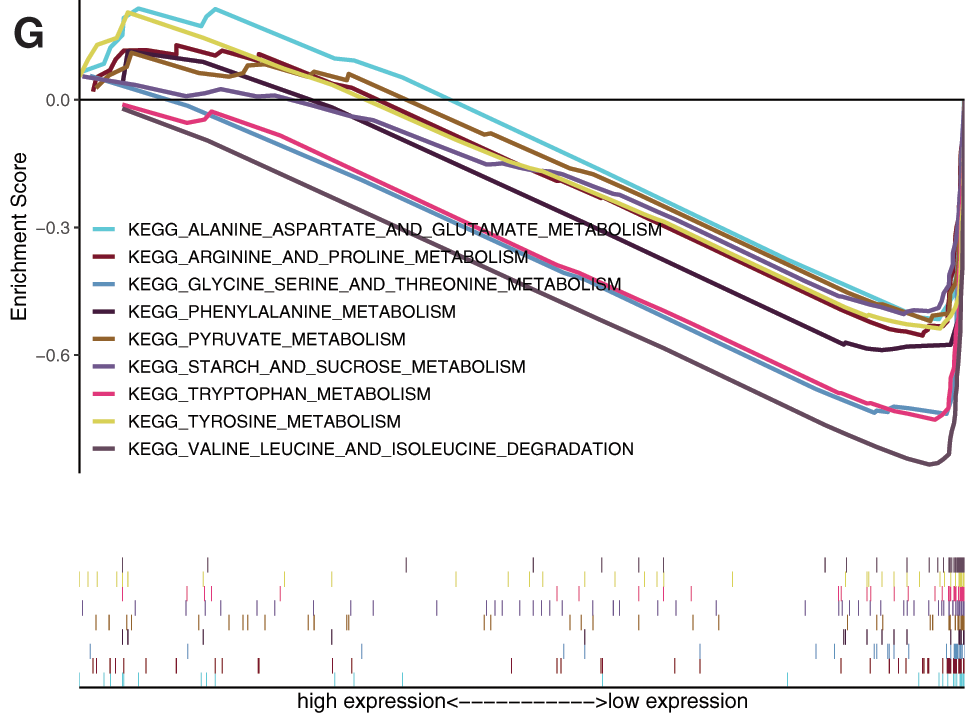
Figure 7: Prognostic value of mRNAsi and prognosis-related genes, and gene set enrichment analysis based on risk score. A, The univariate Cox regression analysis based on the expression status of 9 mRNAsi and prognosis-related genes. The hazard ratios (HR), 95% confidence intervals (CI) were calculated by univariate Cox regression. B, Kaplan-Meier overall survival (OS) curves for patients assigned to high and low-risk subgroups based on the risk score base on multifactorial regression analysis. C, ROC for model validation. Go, and KEGG in the high-risk subgroup. F-G, Go, and KEGG in the low-risk subgroup.
Relationship between mRNAsi and prognosis-related genes and clinical characteristics
Further analysis of the correlation between 9 hub genes and clinical characteristics (age, gender, and stage/grade/TNM) (Fig. 8), revealed that PSMG3 was significantly associated with grade (Fig. 8A), SNRPD1 was significantly associated with age and grade (Figs. 8B–8C). DTYMK was significantly associated with age, stage, grade, and T (Figs. 8D–8G). PIGU was significantly associated with gender, stage, grade, and T (Figs. 8H–8K). IPO4 was significantly associated with grade (Fig. 8L). NME1 was significantly associated with stage, grade, and T (Figs. 8M–8O). TXNL4A and REXO4 were significantly associated with stage, grade, and T (Figs. 8P–8U). It was not observed significant association between PES1 and the clinical characteristics.
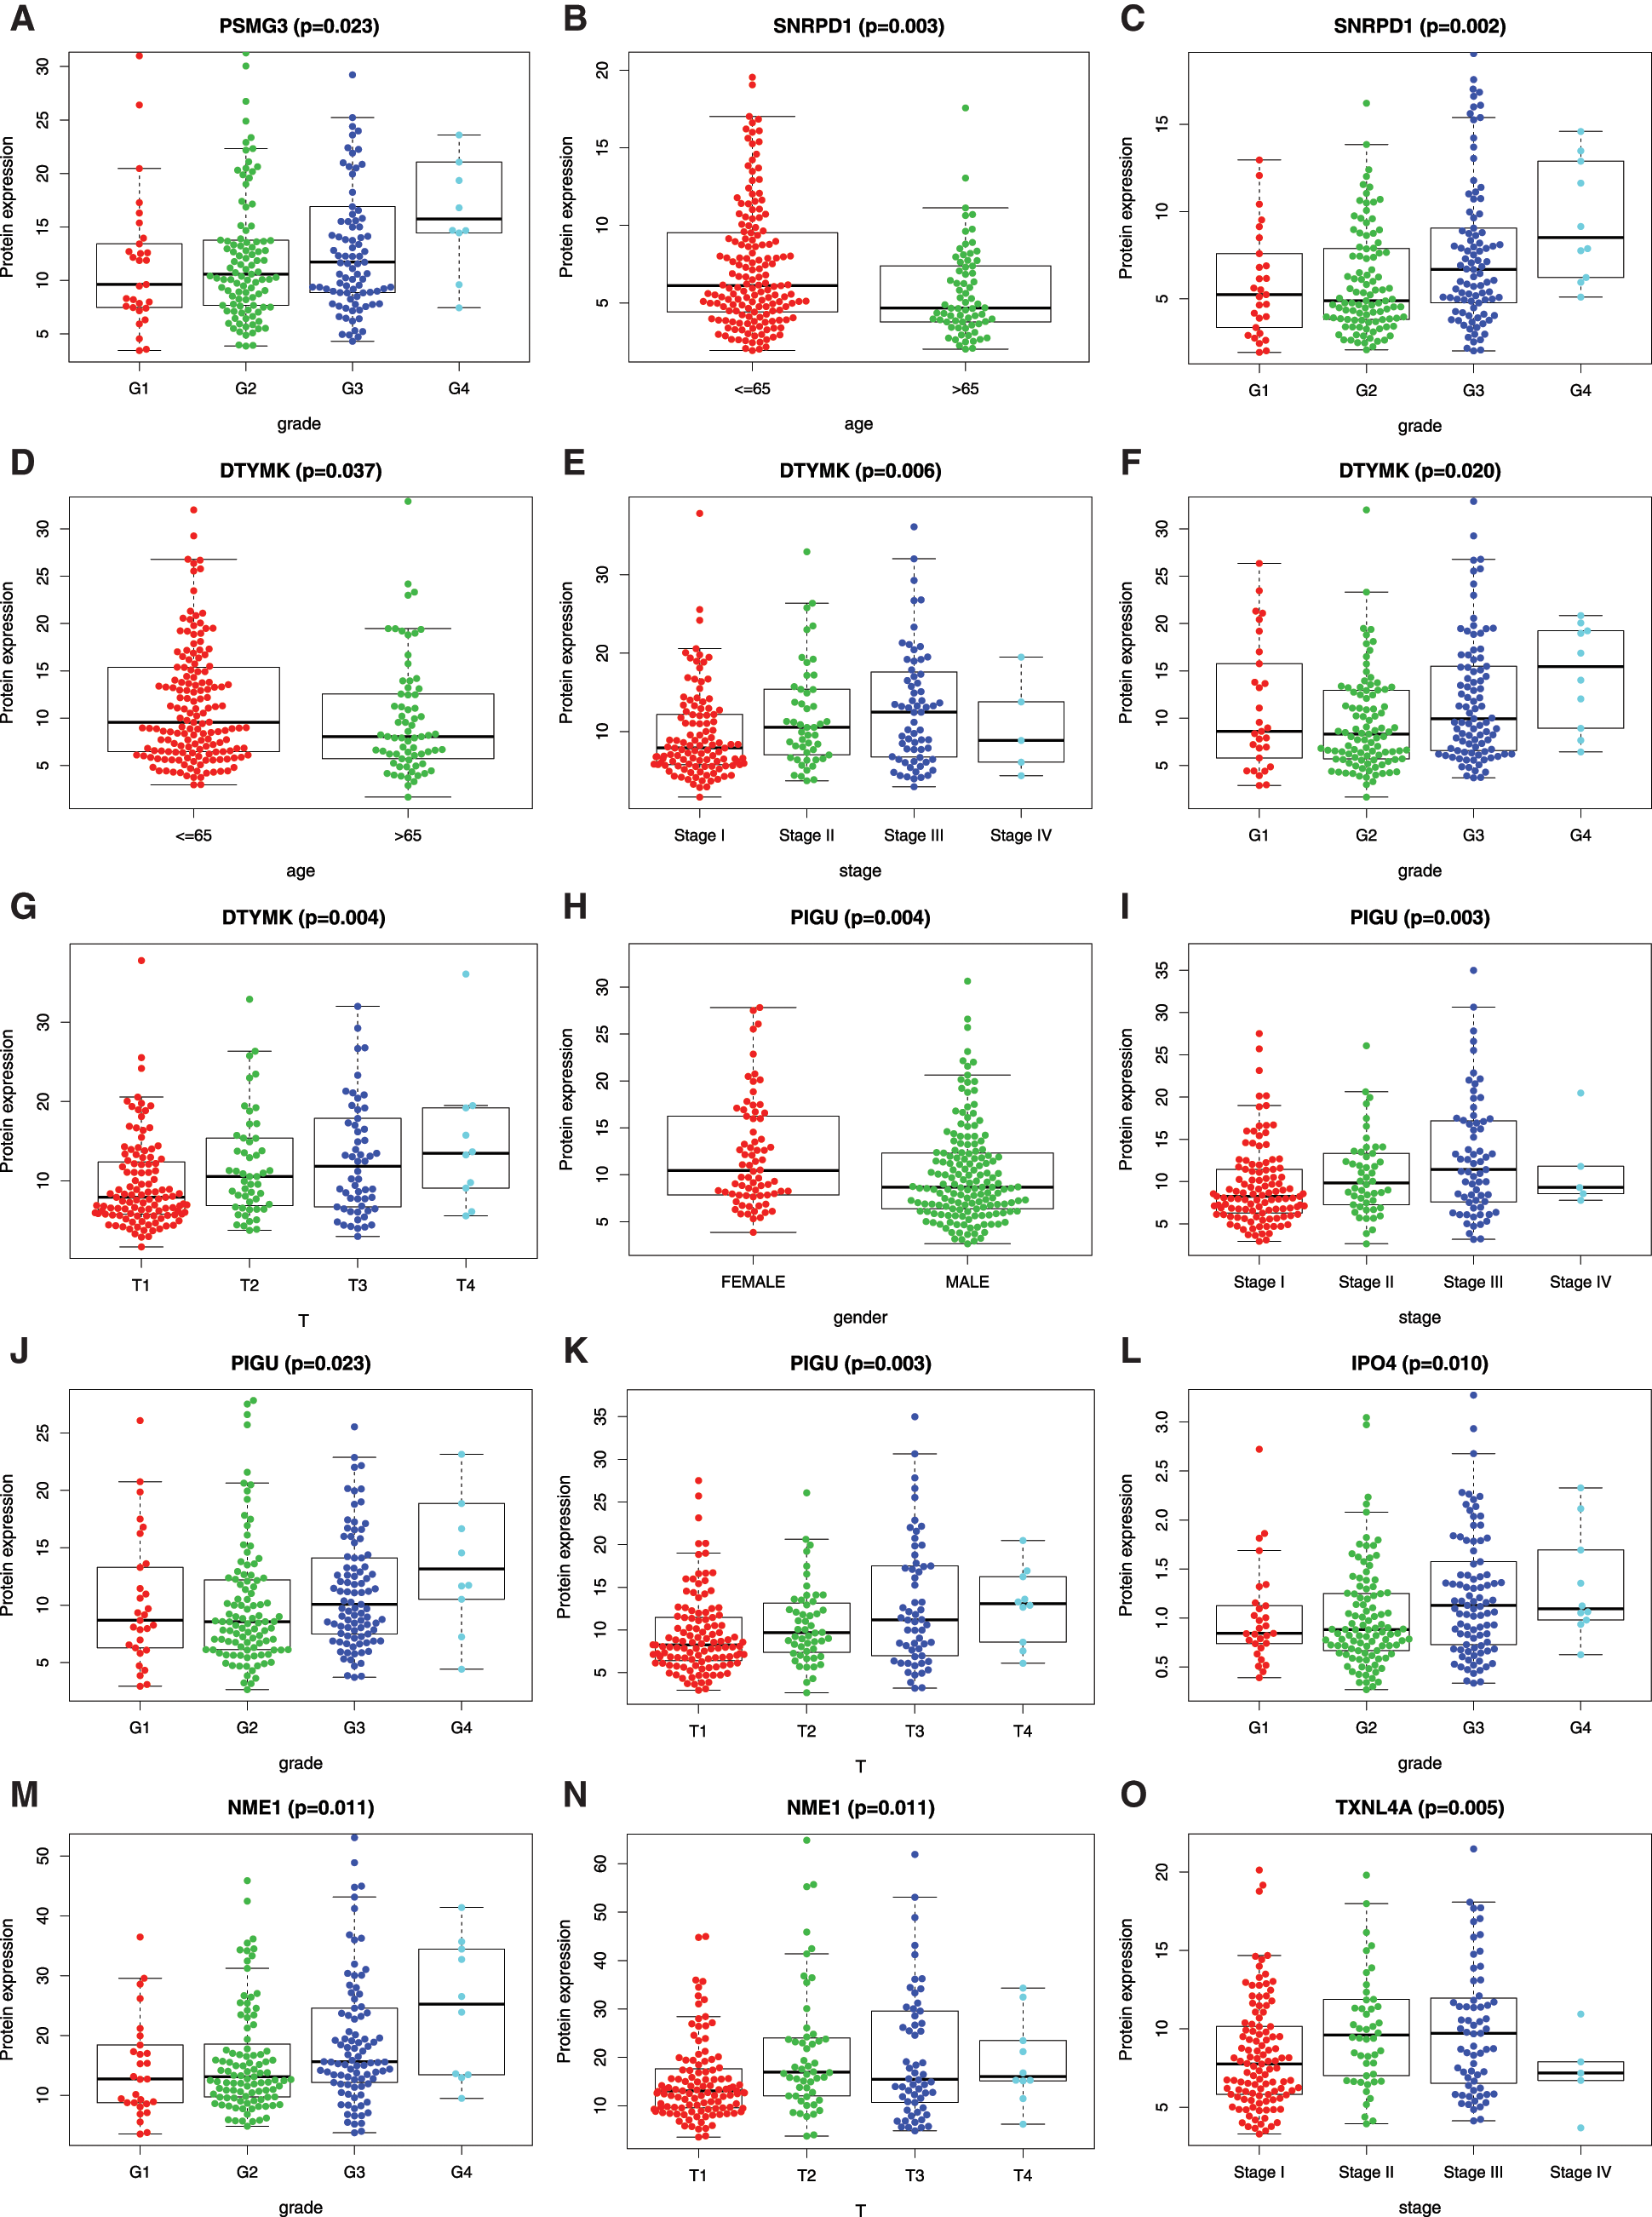
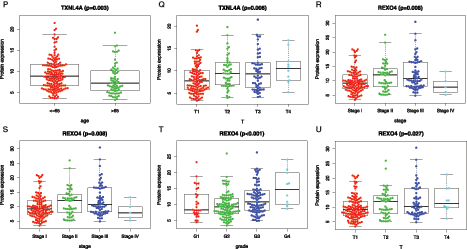
Figure 8: Relationship betweenmRNAsi and prognosis-related genes and clinical characteristics. A, PSMG3 is significantly associated with grade. B-C, SNRPD1 is significantly associated with age and grade. D-G, DTYMK was significantly associated with age, grade, stage, and T. H-K, PIGU was significantly associated with gender, grade, stage, and T. L, IPO4 was significantly associated with grade.M-O, NME1 is significantly associated with grade, stage, and T. P-R, TXNL4A is significantly associated with stage, age, and T. S-U, REXO4 is significantly associated with grade, stage, and T. According to the international Tumor-Node-Metastasis (TNM) classification of malignant tumors, T1-T4 indicate the size of tumor (T4 > T3 > T2 > T1). Grade indicate the differentiation level of tumor cells. Stage indicate the size and metastasis of tumor.
Relationship between mRNAsi and prognosis-related genes and drug resistance, metastasis, and immune microenvironment
Different in expression of mRNAsi and prognosis-related gene in normal subjects and HCC patients with drug resistance and metastasis were analyzed (Figs. 9A–9D). IPO4, NME1, PES1, PIGU and SNRPD1 were significantly higher expressed in patients with metastasis (Figs. 9A and 9B), and IPO4, PIGU and REOX4 were significantly lower expressed in drug resistant patients (Fig. 9C and 9D).
The relationships between 9 mRNAsi and prognosis-related genes and immune subtypes were analyzed (Figs. 9E and 9F). It was demonstrated that patients with C3 and C5 immune subtypes had better survival than those with C4 (Tamborero et al., 2018). No HCC patients were characterized to the C5 immune subtype (Fig. 9E). All the 9 hub genes were highly expressed in HCC samples, and their higher expressions were correlated with C1, C2, and C4, indicated they promote angiogenesis, M1/M2 macrophage polarization, and M2 response, and thus associated with prognosis of HCC.
In the microenvironment analysis (Fig. 9F), the 9 mRNAsi and prognosis-related genes were negatively correlated with the stroma (stromal score) (P < 0.001), and SNRPD1 and TXNL4 were positively correlated with immune infiltrate (immune score) (P < 0.001). There was a negative correlation between NME1 and tumor purity (ESTIMATE score) (P < 0.05).
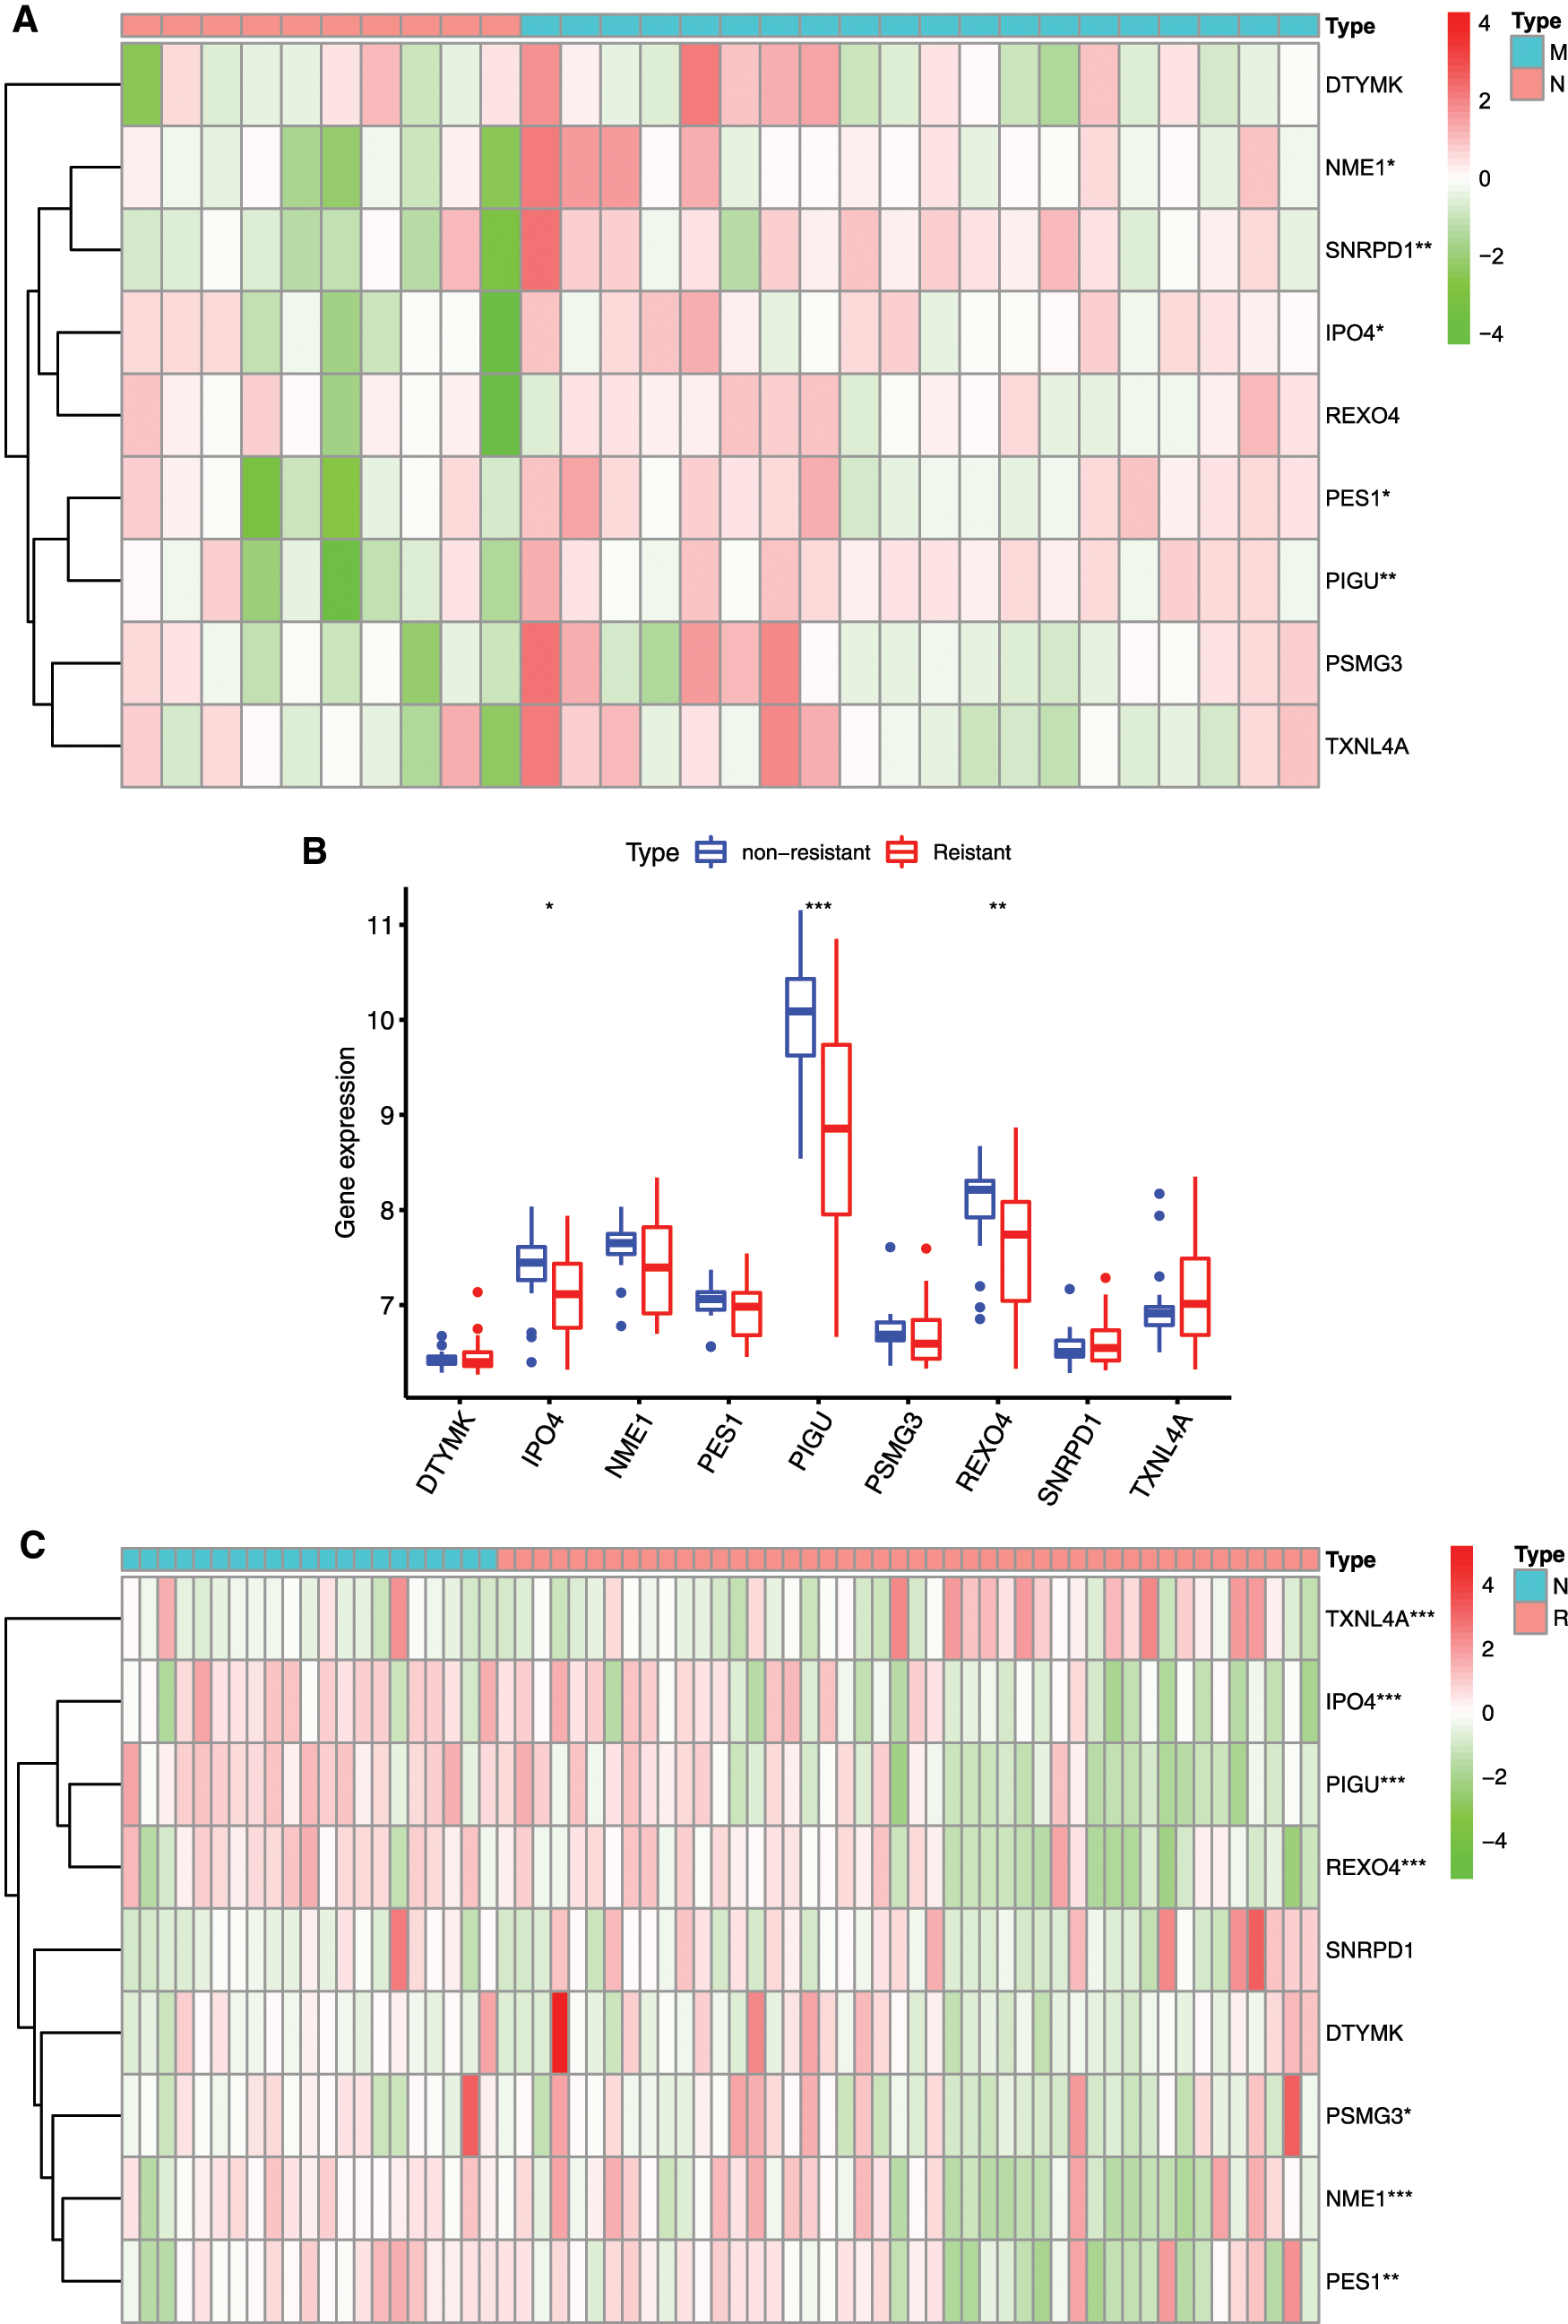
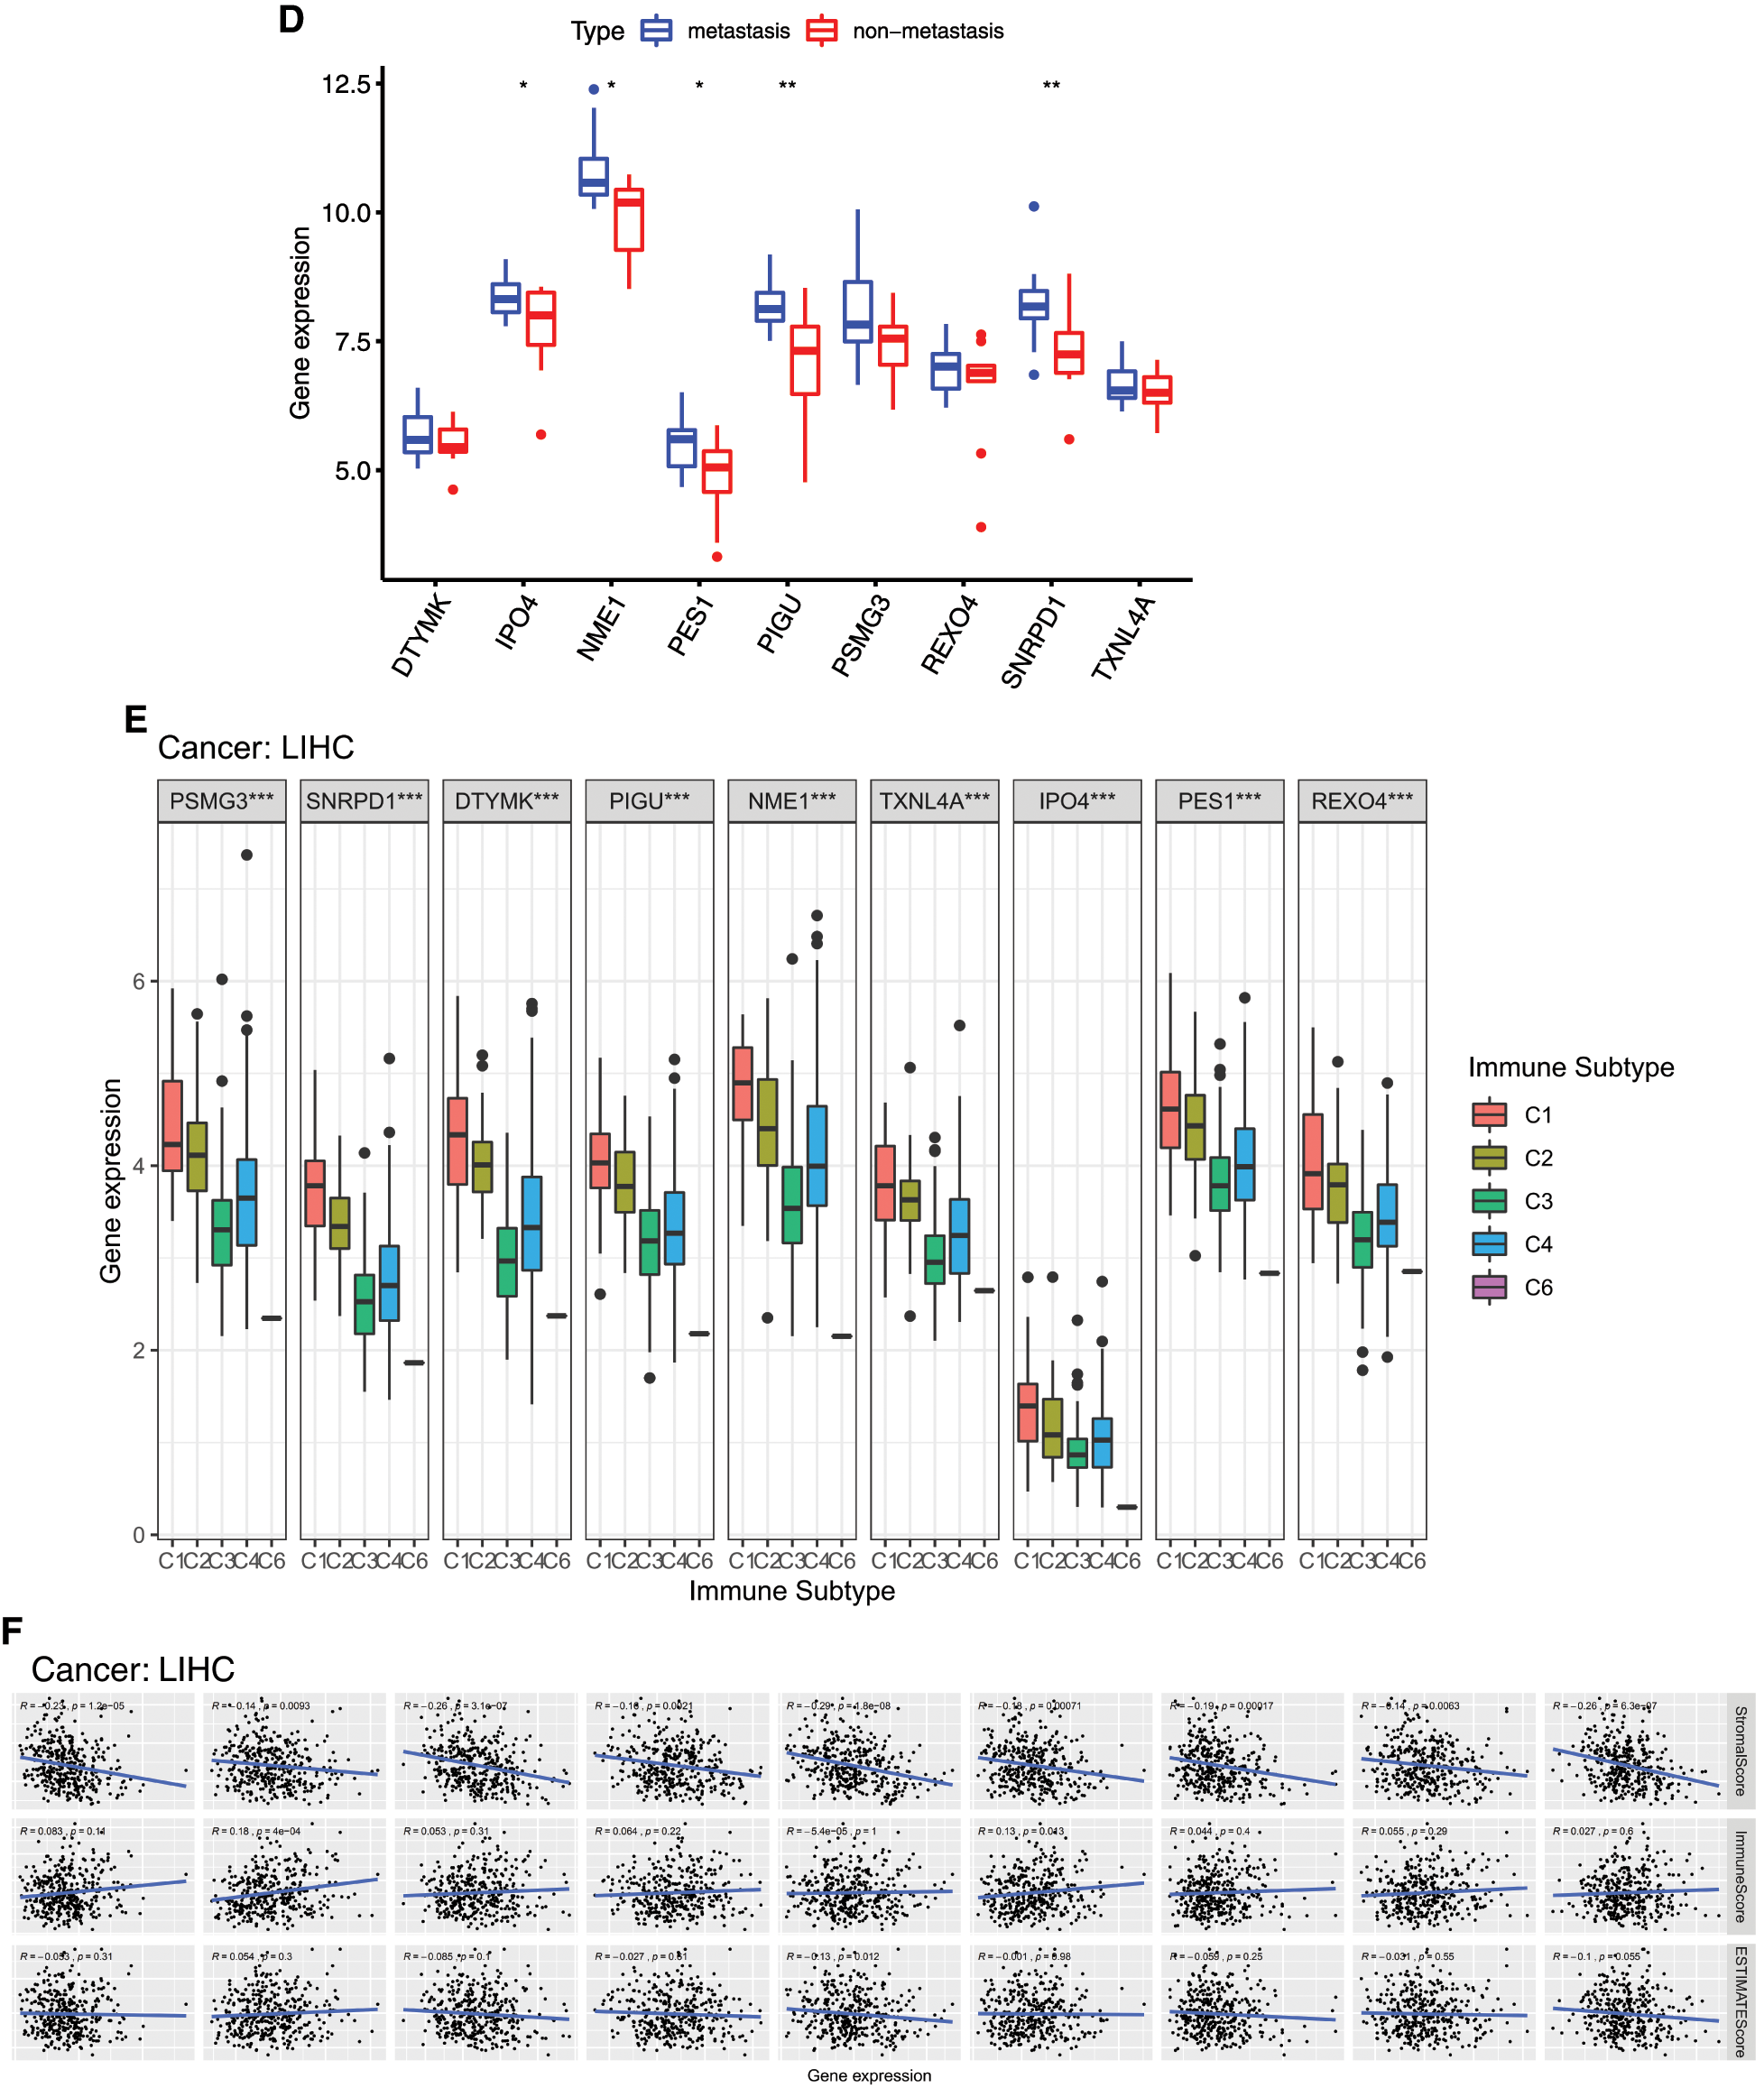
Figure 9: Relationship between mRNAsi and prognosis-related genes and drug resistance, metastasis and immune microenvironment of HCC. A, The expression heatmap of the mRNAsi and prognosis-related genes in GEO HCC sorafenib resistance dataset (GSE109211). B, The expression levels of mRNAsi and prognosis-related genes in sorafenib resistant patients. C, The expression heatmap of the mRNAsi and prognosis-related genes in GEO HCC metastasis dataset (GSE40367). D, The expression levels of mRNAsi and prognosis-related genes in HCC metastatic patients. Red and green indicate gene expression upregulation and downregulation, respectively. E, Association of 9 genes expression with immune infiltrate subtypes in HCC. F, Correlation matrixes between 9 hub genes expression and stromal score, immune score, and ESTIMATE Score. Data are presented as mean S.D. *P < 0.05, **P < 0.01, ***P < 0.001.
Cancer progression involves progressive acquisition of stem cell-like features. Basing on genome, methylome and transcriptome data of HCC patients, a stem cell-like subtype of HCC and stem cell-related pathways such as Wnt/β-catenin and Notch pathways were identified as a characteristic of tumor heterogeneity in HCC, which may provide new insights into understating of HCC metastasis mechanism and treatment resistant (Rebouissou and Nault, 2020; Shimada et al., 2019). Here, we explored the contribution of stemness indicator mRNAsi- and prognostic-related genes in tumor heterogeneity of HCC by WGCNA analysis.
Predicative role of the 9-gene signature in HCC
Since mRNAsi provided by Malta et al. (2018) was obtained by OCLR, we could obtain the mRNAsi values for each sample in TCGA. The higher mRNAsi, the higher degree of stemness. It was demonstrated that high mRNAsi scores is closely associated with poor prognosis of HCC (Cai et al., 2021; Li et al., 2020). Li et al. (2020) reported that mRNAsi-related genes including ANGPT2, EMCN, GLDN, USHBP1 and ZNF532 have high accurate prognoses for HCC patients. Cai et al. (2021) reported that TNFAIP8L3, SERPINE1, VASH1, GNA14, FAM110D and AFAP1L1 were able to predict patient prognosis. Bai et al. (2020) reported that 21 genes including DCN, ECM1, HAND2, PTGIS, SFRP1, SRPX, COLEC10, GRP182, ADAMTS7, CD200, CDH11, COL8A1, FAP, LZTS1, MAP1B, NAV1, NOTCH3, OLFML2A, PRR16, TMEM119, and VCAN were enriched in Wnt, Notch, and hypoxia pathways that are closely related to tumorigenesis. In the present study, WGCNA was used to identify hub genes associated with HCC stemness and prognosis based on the mRNAsi and clinical data from TCGA database. We screened the miRNAsi- and prognostic-related genes, a 9-gene signature including PSMG3, SNRPD1, DTYMK, PIGU, NME1, TXNL4A, IPO4, PES1, and REXO4, which are potential novel biomarkers for prognosis of HCC and functional mechanism exploration of the CSCs in HCC. In the present study, those mRNAsi and prognosis-related genes in HCC was significantly higher than that in normal liver tissues. The expression of those hub genes was confirmed by GEO databases, except DTYMK; and also confirmed by the human protein atlas (HPA) datasets (Supplemental Fig. 3), except TXNL4A.
Poor prognosis of HCC patients was associated with overexpression of those genes, showing the 9-gene signature is a credible prognostic indicator of HCC. The univariate regression analysis shown that all the 9 genes were high risk factors for the survival of the HCC patients, and the multifactorial regression analysis shown that PIGU is an independent prognostic factor. It was suggested that high risk of PIGU in survival of HCC patients, and that other 8 genes do not perform significantly when they are covariates. The area under curve (AUC) is > 0.5 but < 0.85 in this study, a further screen on the 9-gene signature by in vitro and in vivo experiments is needed and helpful to improve the accuracy of the predictive classification model.
Previous studies have suggested that CSCs are closely associated with tumor metastasis (Lee et al., 2017; Lee et al., 2018). miRNAsi was positive correlated with tumor grade (Bai et al., 2020). Tumors in G4/Stage IV harboring the greatest stem cell and metastatic features. IPO4, NME1, PES1, PIGU and SNRPD1 were significantly higher expressed in patients with metastasis, and IPO4, NME1, PIGU and SNRPD1 were closely associated with grade/stage/TNM. Go and KEGG functional analysis of the 9-gene signature shown an enrichment in the metabolism of pyrimidine nucleic acids, implying that the nine genes may contribute to the metabolic reprogramming of cells, which had been shown to drive stemness and metastasis of tumors (Inoue et al., 2021; Nimmakayala et al., 2021; Zhu et al., 2021).
The HCC samples were divided into Clusters A, B and C according to the 9-gene signature expression: The prognosis of Cluster B was lowest, and that of Cluster C was best. The immune infiltration levels between the three clusters were different. The high prognosis Cluster C had higher macrophage cell infiltration that other two clusters, which is consistent with the viewpoint that immune microenvironment contributes to prognosis of tumor (Shimada et al., 2019). The enriched pathway terms of Cluster A vs. Cluster B are well-known metabolism pathways such as drug metabolism, suggesting the stemness is closely related to drug metabolism. The enriched pathway terms of Cluster B vs. Cluster C are well-known cell differentiation pathways, suggesting the ability of self-renew may be controlled by the 9-gene signature. Taken together, these results suggested that the 9-gene signature regulates HCC progression, immune microenvironment, and drug resistance via stemness. CSCs are an important contributor to tumor drug resistance (Lytle et al., 2018; Sun et al., 2016). IPO4, PIGU and REOX4 were significantly reduced in drug resistant HCC patients, which might be responsible for the drug resistance via control of the metabolic reprogramming (Pranzini et al., 2021).
We further divided the patients into high-risk and low-risk subgroups and found low levels of the gene signature was related to a good prognosis of HCC patients. The enriched pathway terms in high-risk subgroup were closely related to cell differentiation/proliferation/apoptosis such as DNA replication and cell cycle, and and metastasis such as Wnt signaling pathway. The enriched pathway terms in low-risk subgroup were closely related to metabolism such as pyruvate metabolism and tyrosine metabolism.
The present study presented an imbalance expression of the 9-gene signature between normal and HCC samples, and a highly intra-tumor heterogeneity. Alteration of CNV might perturbed the expression of the gene signature. We speculate those genes drives the transition of tumor cells into CSCs, not only like CSCs. High expression of IPO4 and PIGU indicates more tumor stem cells, which increase the drug resistance and metastasis. In addition, the nine genes were negatively correlated with stroma in the microenvironment. SNRPD1 and TXNL4 were positively correlated with immune cell infiltration, and NME1 was negatively correlated with the tumor purity, suggesting that those genes may affect the purity of tumor cells and mediate the microenvironment stimulus.
Advances on the roles of the 9 hub genes in stemness and progression of tumor
Proteasome assembly chaperone 3 (PSMG3) is significantly correlated with tumor grade. However, its antisense strand PSMG3-AS1 that is a lncRNA partially complementary to PSMG3, was found to promote the progression of breast, liver, and lung cancers by increasing the stability of PSMG3 (Cui et al., 2020; Yue et al., 2020; Zhang et al., 2020). PPI analysis showed that PSMG3 not interacted with other identified hub genes, its function in HCC should be investigated in the future.
Small nuclear ribonucleoprotein Sm D1 (SNRPD1) is a novel gene signature for prognosis prediction in ovarian cancer (Bao et al., 2020). Overexpression of SNRPD1 is significantly associated with poor survival of lung adenocarcinomas (Yi et al., 2020). It was demonstrated that SNRPD1 is associated with mesenchymal stem cell osteogenic differentiation by WGCNA (Yang et al., 2019). It was found that SNRPD1 is involved in mediating the unique spliceosomal features of human pluripotent stem cells (Kim et al., 2017), and previous studies have found that it is able to reprogram mouse pluripotent ESCs to a totipotent state by spliceosome inhibition (Shen et al., 2021). We found that SNRPD1 is significantly enriched in the spliceosome pathway, which might contribute to maintaining the stem cell characteristics of liver CSCs.
Deoxythymidylate kinase (DTYMK) is involved in dTTP biosynthesis, which is part of pyrimidine metabolism. LKB1 mutations in human non-cellular lung cancer exhibit a positive effect on DTYMK sensitivity, suggesting that DTYMK is a potential therapeutic target for lung cancer (Liu et al., 2013). In low-differentiated liver cancer, pyrimidine metabolism rate-limiting enzyme is a signature gene of cancer stemness, which is associated with poor prognosis (Yeh et al., 2017), which is consistent with our results.
Nucleoside diphosphate kinase A (NME1) is a member of the NME gene family (Puts et al., 2018). Extracellular NME has a role in promoting stem cell pluripotency and inducing central nervous system development as well as neuroprotective effects (Romani et al., 2018). NME1 could promote dynamin 2 oligomerization, regulate endocytosis, and suppress the metastasis of tumor cells (Khan et al., 2019). Low expression of NME1 is associated with poor prognosis, low survival rate, and lymph node infiltration in breast cancer, ovarian cancer, and melanoma (Hartsough and Steeg, 2000). However, overexpression of NME1 is a poor prognostic signature for HCC (Hindupur et al., 2018; Yang et al., 2017). Functional analysis revealed that NME1 enrichment is associated with pyrimidine metabolism.
Thioredoxin like 4A (TXNL4A) is a pre-mRNA splicing factor gene, which is upregulated in a maternal HF diet caused hepatic hypermethylation in male mice (Seki et al., 2017), and endometrial cancer (Wang et al., 2020). The role of TXNL4A in the transformation of cells in HCC tumors to stem cells remains unclear.
Importin-4 (IPO4) acts as a nuclear transport receptor for nuclear protein import. IPO4 was found to be involved in poor prognosis in primary gastric cancer (Xu et al., 2019). IPO4-mediated CEBPD nuclear import can increase cervical cancer chemosensitivity by inhibiting PRKDC-driven DNA damage repair, thereby increasing cervical cancer incidence (Zhou et al., 2020). However, IPO4 has not been reported in hepatocellular carcinoma. We found that IPO4 is associated with the grade in HCC. IPO4 might inhibit DNA damage repair of HCC cells, which should be studied in the future.
Pescadillo ribosomal biogenesisfactor 1 (PES1) is involved in ribosome generation and embryonic development (Hölzel et al., 2005; Lapik et al., 2004). Overexpression of PES1 promotes the development of breast cancer, ovarian cancer, and gastric cancer (Li et al., 2016; Li et al., 2013; Thomas and Gustafsson, 2012), and is reported to be associated with poor prognosis in HCC (Fan et al., 2018; Fu et al., 2019). PES1 could enhance proliferation and tumorigenesis in HCC via the PI3K/AKT pathway (Wang et al., 2019a), and PES1 is transcriptionally regulated by BRD4 and could promote cell proliferation and glycolysis (Fan et al., 2018). Cell growth of liver CSCs was regulated by CD44 via a miR-105-5p/PSE1 signaling pathway (Wei et al., 2019). However, PES1 was not significantly correlated with clinical stages and grades of HCC in this study.
Phosphatidylinositol glycan anchor biosynthesis class U protein (PIGU) is involved in the recognition of either the GPI attachment signal or the lipid portion of GPI (Hong et al., 2003). PIGU overexpression was found to express differentially in different stages of HCC and could be used for prognostic stratification of HCC patients (Cao et al., 2019; Sarathi and Palaniappan, 2019). We found that PIGU is associated with gender, grade, stage, and T. PIGU is enriched in spliceosomes (El Marabti and Younis, 2018), pyrimidine metabolism (Yeh et al., 2017), DNA repair (Gerson et al., 2006; Maugeri-Saccà et al., 2012) and Notch signaling pathway, etc. The Notch pathway promotes tumor metastasis (He et al., 2021) and the tumor stem cell properties of CD90+ cells in HCC (Luo et al., 2016). Thus, PIGU might play an important role in HCC CSC stemness and tumor metastasis via Notch pathway.
REX4 homolog, 3’-5’ exonuclease (REXO4) is less studied, Melo et al have reported that the mutation of REXO4 was found to be implied in prolactinoma (Melo et al., 2016). In GO analysis, REXO4 was found involved in the transcriptional regulation of DNA and rRNA degradation and other processes, and its role in the regulation of HCC stemness is expected to be further investigated.
To sum up, our study found a series of stemness index and prognosis-related genes in HCC. These genes can be used as biomarkers for the diagnosis of HCC. Among these genes, PIGU can serve as an independent prognostic factor for the survival of HCC patients. High expression of the 9-gene signature was related to angiogenesis, M1/M2 macrophage polarization, and M2 response. Angiogenesis is critical for tumor development and therapy resistance (Zeng and Fu, 2020; Zeng et al., 2019). We speculate there is a balance between metastasis and drug resistance, which is possibly regulated by IPO4 and PIGU, and closely associated with tumor cell-tumor stem cell transition (TST) and tumor refractory. The investigations on function of the gene signature and the underlying mechanism should be carried out in the future.
Availability of Data and Materials: The datasets used and/or analysed during the current study are available from the corresponding author on reasonable request.
Supplementary Material: The supplementary material is available online at DOI: https://10.32604/biocell.2021.017289.
Author Contribution: ZY contributed to the conception and design of the work. ZY, LCQ, and YXH performed the analysis. All authors work on the manuscript.
Funding statement: Supported by the Key Research and Development Projects in Sichuan Province (No. 2021YFS0188). The funders had no role in the design and conduct of the study; data collection and analysis; decision to publish, or preparation of the manuscript. Open Access funding provided by Sichuan University.
Conflicts of Interest: The authors declare that they have no conflicts of interest to report regarding the present study.
Andreou A, Struecker B, Raschzok N, Krenzien F, Haber P et al. (2018). Minimal-invasive versus open hepatectomy for hepatocellular carcinoma: Comparison of postoperative outcomes and long-term survivals using propensity score matching analysis. Surgical Oncology-Oxford 27: 751–758. [Google Scholar]
Bai KH, He SY, Shu LL, Wang WD, Lin SY et al. (2020). Identification of cancer stem cell characteristics in liver hepatocellular carcinoma by WGCNA analysis of transcriptome stemness index. Cancer Medicine 9: 4290–4298. [Google Scholar]
Bao M, Zhang L, Hu Y (2020). Novel gene signatures for prognosis prediction in ovarian cancer. Journal of Cellular and Molecular Medicine 24: 9972–9984. [Google Scholar]
Cai JL, Zhu GQ, Du JX, Wang B, Wan JL et al. (2021). Identification and validation of a new gene signature predicting prognosis of hepatocellular carcinoma patients by network analysis of stemness indices. Expert Review of Gastroenterology & Hepatology 15: 699–709. [Google Scholar]
Cao J, Wang P, Chen J, He X (2019). PIGU overexpression adds value to TNM staging in the prognostic stratification of patients with hepatocellular carcinoma. Human Pathology 83: 90–99. [Google Scholar]
Chedid MF, Kruel CRP, Pinto MA, Grezzana-Filho TJM, Leipnitz I et al. (2017). Hepatocellular carcinoma: Diagnosis and operative management. Arquivos Brasileiros de Cirurgia Digestiva: ABCD 30: 272–278. [Google Scholar]
Cheng Z, Li X, Ding J (2016). Characteristics of liver cancer stem cells and clinical correlations. Cancer Letters 379: 230–238. [Google Scholar]
Cui Y, Fan Y, Zhao G, Zhang Q, Bao Y et al. (2020). Novel lncRNA PSMG3‐AS1 functions as a miR‐143‐3p sponge to increase the proliferation and migration of breast cancer cells. Oncology Reports 43: 229–239. [Google Scholar]
Davis S, Meltzer PS (2007). GEOquery: A bridge between the Gene Expression Omnibus (GEO) and BioConductor. Bioinformatics 23: 1846–1847. [Google Scholar]
Eaves CJ (2008). Cancer stem cells: Here, there, everywhere? Nature 456: 581–582. [Google Scholar]
Eklund A (2016). beeswarm: The bee swarm plot, an alternative to stripchart. R package version 0.2.3. https://CRANR-projectorg/package=beeswarm. [Google Scholar]
El Marabti E, Younis I (2018). The cancer spliceome: Reprograming of alternative splicing in cancer. Frontiers in Molecular Biosciences 5: 80. [Google Scholar]
Fan P, Wang B, Meng Z, Zhao J, Jin X (2018). PES1 is transcriptionally regulated by BRD4 and promotes cell proliferation and glycolysis in hepatocellular carcinoma. International Journal of Biochemistry and Cell Biology 104: 1–8. [Google Scholar]
Fu Z, Jiao Y, Li YQ, Ke JJ, Xu YH et al. (2019). PES1 in liver cancer: A prognostic biomarker with tumorigenic roles. Cancer Management and Research 11: 9641–9653. [Google Scholar]
Gerson SL, Reese J, Kenyon J (2006). DNA repair in stem cell maintenance and conversion to cancer stem cells. Ernst Schering Foundation Symposium Proceedings 5: 231–244. [Google Scholar]
Hänzelmann S, Castelo R, Guinney J (2013). GSVA: Gene set variation analysis for microarray and RNA-seq data. BMC Bioinformatics 14: 7. [Google Scholar]
Hartke J, Johnson M, Ghabril M (2017). The diagnosis and treatment of hepatocellular carcinoma. Seminars in Diagnostic Pathology 34: 153–159. [Google Scholar]
Hartsough MT, Steeg PS (2000). Nm23/nucleoside diphosphate kinase in human cancers. Journal of Bioenergetics and Biomembranes 32: 301–308. [Google Scholar]
He H, Shao X, Li Y, Gihu R, Xie H et al. (2021). Targeting signaling pathway networks in several malignant tumors: Progresses and challenges. Frontiers in Pharmacology 12: 675675. [Google Scholar]
Heagerty PJ, Lumley T, Pepe MS (2000). Time-dependent ROC curves for censored survival data and a diagnostic marker. Biometrics 56: 337–344. [Google Scholar]
Hindupur SK, Colombi M, Fuhs SR, Matter MS, Guri Y et al. (2018). The protein histidine phosphatase LHPP is a tumour suppressor. Nature 555: 678–682. [Google Scholar]
Hölzel M, Rohrmoser M, Schlee M, Grimm T, Harasim T et al. (2005). Mammalian WDR12 is a novel member of the Pes1-Bop1 complex and is required for ribosome biogenesis and cell proliferation. Journal of Cell Biology 170: 367–378. [Google Scholar]
Hong Y, Ohishi K, Kang JY, Tanaka S, Inoue N et al. (2003). Human PIG-U and yeast Cdc91p are the fifth subunit of GPI transamidase that attaches GPI-anchors to proteins. Molecular Biology of the Cell 14: 1780–1789. [Google Scholar]
Huber W, Carey VJ, Gentleman R, Anders S, Carlson M et al. (2015). Orchestrating high-throughput genomic analysis with Bioconductor. Nature Methods 12: 115–121. [Google Scholar]
Inoue J, Kishikawa M, Tsuda H, Nakajima Y, Asakage T, Inazawa J (2021). Identification of PDHX as a metabolic target for esophageal squamous cell carcinoma. Cancer Science 112: 2792–2802. [Google Scholar]
Ito K, Murphy D (2013). Application of ggplot2 to Pharmacometric Graphics. CPT Pharmacometrics Syst Pharmacol 2: 56. [Google Scholar]
Kassambara A, Kosinski M, Biecek P (2020). survminer: Drawing Survival Curves using ’ggplot2’. R package version 0.4.8. https://CRANR-projectorg/package=survminer. [Google Scholar]
Khan I, Gril B, Steeg PS (2019). Metastasis suppressors NME1 and NME2 promote dynamin 2 oligomerization and regulate tumor cell endocytosis, motility, and metastasis. Cancer Research 79: 4689–4702. [Google Scholar]
Kim YD, Lee J, Kim HS, Lee MO, Son MY et al. (2017). The unique spliceosome signature of human pluripotent stem cells is mediated by SNRPA1, SNRPD1, and PNN. Stem Cell Research 22: 43–53. [Google Scholar]
Kulik L, El-Serag HB (2019). Epidemiology and management of hepatocellular carcinoma. Gastroenterology 156: 477–491. [Google Scholar]
Langfelder P, Horvath S (2008a). WGCNA: An R package for weighted correlation network analysis. BMC Bioinformatics 9: 1471–2105. [Google Scholar]
Langfelder P, Horvath S (2008b). WGCNA: An R package for weighted correlation network analysis. BMC Bioinformatics 9: 559. [Google Scholar]
Lapik YR, Fernandes CJ, Lau LF, Pestov DG (2004). Physical and functional interaction between Pes1 and Bop1 in mammalian ribosome biogenesis. Molecular Cell 15: 17–29. [Google Scholar]
Lee SY, Jeong EK, Ju MK, Jeon HM, Kim MY et al. (2017). Induction of metastasis, cancer stem cell phenotype, and oncogenic metabolism in cancer cells by ionizing radiation. Molecular Cancer 16: 10. [Google Scholar]
Lee SY, Ju MK, Jeon HM, Lee YJ, Kim CH et al. (2018). Oncogenic metabolism acts as a prerequisite step for induction of cancer metastasis and cancer stem cell phenotype. Oxidative Medicine and Cellular Longevity 2018: 1027453. [Google Scholar]
Leek JT, Johnson WE, Parker HS, Jaffe AE, Storey JD (2012). The sva package for removing batch effects and other unwanted variation in high-throughput experiments. Bioinformatics 28: 882–883. [Google Scholar]
Li B, Pu K, Wu X (2019a). Identifying novel biomarkers in hepatocellular carcinoma by weighted gene co-expression network analysis. Journal of Cellular Biochemistry. DOI 10.1002/jcb.28420. [Google Scholar] [CrossRef]
Li GM, Zhang CL, Rui RP, Sun B, Guo W (2018). Bioinformatics analysis of common differential genes of coronary artery disease and ischemic cardiomyopathy. European Review for Medical and Pharmacological Sciences 22: 3553–3569. [Google Scholar]
Li J, Zhang C, Yuan X, Ren Z, Yu Z (2020). Correlations between stemness indices for hepatocellular carcinoma, clinical characteristics, and prognosis. American Journal of Translational Research 12: 5496–5510. [Google Scholar]
Li J, Zhou X, Lan X, Zeng G, Jiang X, Huang Z (2016). Repression of PES1 expression inhibits growth of gastric cancer. Tumour Biology 37: 3043–3049. [Google Scholar]
Li J, Zhuang Q, Lan X, Zeng G, Jiang X, Huang Z (2013). PES1 differentially regulates the expression of ERα and ERβ in ovarian cancer. IUBMB Life 65: 1017–1025. [Google Scholar]
Li W, Wang H, Ma Z, Zhang J, Ou-Yang W, Qi Y, Liu J (2019b). Multi-omics analysis of microenvironment characteristics and immune escape mechanisms of hepatocellular carcinoma. Frontiers in Oncology 9: 1019. [Google Scholar]
Liu Y, Marks K, Cowley GS, Carretero J, Liu Q et al. (2013). Metabolic and functional genomic studies identify deoxythymidylate kinase as a target in LKB1-mutant lung cancer. Cancer Discovery 3: 870–879. [Google Scholar]
Lumley MGaT (2020). forestplot: Advanced forest plot using ’grid’ graphics. R package version 1.10.1. https://CRANR-projectorg/package=forestplot. [Google Scholar]
Luo J, Wang P, Wang R, Wang J, Liu M, Xiong S, Li Y, Cheng B (2016). The Notch pathway promotes the cancer stem cell characteristics of CD90+ cells in hepatocellular carcinoma. Oncotarget 7: 9525–9537. [Google Scholar]
Lytle NK, Barber AG, Reya T (2018). Stem cell fate in cancer growth, progression and therapy resistance. Nature Reviews Cancer 18: 669–680. [Google Scholar]
Malta TM, Sokolov A, Gentles AJ, Burzykowski T, Poisson L et al. (2018). Machinelearning identifies stemness features associated with oncogenic dedifferentiation. Cell 173: 338–354.e315. [Google Scholar]
Maugeri-Saccà M, Bartucci M, De Maria R (2012). DNA damage repair pathways in cancer stem cells. Molecular Cancer Therapeutics 11: 1627–1636. [Google Scholar]
Melo FM, Couto PP, Bale AE, Bastos-Rodrigues L, Passos FM et al. (2016). Whole-exome identifies RXRG and TH germline variants in familial isolated prolactinoma. Cancer Genet 209: 251–257. [Google Scholar]
Nassar D, Blanpain C (2016). Cancer stem cells: Basic concepts and therapeutic implications. Annual Review of Pathology 11: 47–76. [Google Scholar]
Nimmakayala RK, Rauth S, Chirravuri Venkata R, Marimuthu S, Nallasamy P et al. (2021). PGC1α-Mediated metabolic reprogramming drives the stemness of pancreatic precursor lesions. Clinical Cancer Research. DOI 10.1158/1078-0432.CCR-20-5020. [Google Scholar] [CrossRef]
Nio K, Yamashita T, Kaneko S (2017). The evolving concept of liver cancer stem cells. Molecular Cancer 16: 4. [Google Scholar]
Pranzini E, Pardella E, Paoli P, Fendt SM, Taddei ML (2021). Metabolic reprogramming in anticancer drug resistance: A focus on amino acids. Trends Cancer 7: 682–699. [Google Scholar]
Puts GS, Leonard MK, Pamidimukkala NV, Snyder DE, Kaetzel DM (2018). Nuclear functions of NME proteins. Laboratory Investigation 98: 211–218. [Google Scholar]
Rebouissou S, Nault JC (2020). Advances in molecular classification and precision oncology in hepatocellular carcinoma. Journal of Hepatology 72: 215–229. [Google Scholar]
Ritchie ME, Phipson B, Wu D, Hu Y, Law CW et al. (2015). limma powers differential expression analyses for RNA-sequencing and microarray studies. Nucleic Acids Research 43: 20. [Google Scholar]
Robrechts C, De Vos R, Van den Heuvel M, Van Cutsem E, van damme B et al. (1998). Primary liver tumour of intermediate (hepatocyte-bile duct cell) phenotype: A progenitor cell tumour? Liver 18: 288–293. [Google Scholar]
Romani P, Ignesti M, Gargiulo G, Hsu T, Cavaliere V (2018). Extracellular NME proteins: A player or a bystander? Laboratory Investigation 98: 248–257. [Google Scholar]
Salem R, Lewandowski RJ (2013). Chemoembolization and radioembolization for hepatocellular carcinoma. Clinical Gastroenterology and Hepatology 11: 604–611. [Google Scholar]
Sarathi A, Palaniappan A (2019). Novel significant stage-specific differentially expressed genes in hepatocellular carcinoma. BMC Cancer 19: 663. [Google Scholar]
Seki Y, Suzuki M, Guo X, Glenn AS, Vuguin PM et al. (2017). In utero exposure to a high-fat diet programs hepatic hypermethylation and gene dysregulation and development of metabolic syndrome in male mice. Endocrinology 158: 2860–2872. [Google Scholar]
Shen H, Yang M, Li S, Zhang J, Peng B et al. (2021). Mouse totipotent stem cells captured and maintained through spliceosomal repression. Cell 184: 2843–2859.e2820. [Google Scholar]
Shimada S, Mogushi K, Akiyama Y, Furuyama T, Watanabe S et al. (2019). Comprehensive molecular and immunological characterization of hepatocellular carcinoma. EBioMedicine 40: 457–470. [Google Scholar]
Subramanian A, Tamayo P, Mootha VK, Mukherjee S, Ebert BL et al. (2005). Gene set enrichment analysis: A knowledge-based approach for interpreting genome-wide expression profiles. Proceedings of the National Academy of Sciences of the United States of America 102: 15545–15550. [Google Scholar]
Sun JH, Luo Q, Liu LL, Song GB (2016). Liver cancer stem cell markers: Progression and therapeutic implications. World Journal of Gastroenterology 22: 3547–3557. [Google Scholar]
Therneau T (2020). A package for survival analysis in R. R package version 3.2-3.20: 2053–2054.https://CRANR-projectorg/package=survival. [Google Scholar]
Tamborero D, Rubio-Perez C, Muiños F, Sabarinathan R, Piulats JM et al. (2018). A pan-cancer landscape of interactions between solid tumors and infiltrating immune cell populations. Clinical Cancer Research 24: 3717–3728. [Google Scholar]
Thomas C, Gustafsson J (2012). Targeting PES1 for restoring the ERα/ERβ ratio in breast cancer. Journal of Clinical Investigation 122: 2771–2773. [Google Scholar]
Thorsson V, Gibbs DL, Brown SD, Wolf D, Bortone DS et al. (2018). The immune landscape of cancer. Immunity 48: 812–830. [Google Scholar]
Villanueva A (2019). Hepatocellular carcinoma. The New England Journal of Medicine 380: 1450–1462. [Google Scholar]
Villanueva RAM, Chen ZJ (2019). ggplot2: Elegant graphics for data analysis (2nd ed.). Measurement Interdisciplinary Research & Perspectives 17: 160–167. [Google Scholar]
Wang J, Sun J, Zhang N, Yang R, Li H et al. (2019a). PES1 enhances proliferation and tumorigenesis in hepatocellular carcinoma via the PI3K/AKT pathway. Life Science 219: 182–189. [Google Scholar]
Wang L, Zhou W, Li H, Yang H, Shan N (2020). Clinical significance, cellular function, and potential molecular pathways of CCT7 in endometrial cancer. Frontiers in Oncology 10: 1468. [Google Scholar]
Wang X, Wang X, Li W, Zhang Q, Chen J et al. (2019b). Up-regulation of hsa_circ_0000517 predicts adverse prognosis of hepatocellular carcinoma. Frontiers in Oncology 9: 1105. [Google Scholar]
Wei S, Liu K, He Q, Gao Y, Shen L (2019). PES1 is regulated by CD44 in liver cancer stem cells via miR-105-5p. Febs Letters 593: 1777–1786. [Google Scholar]
Wei T, Simko V (2013). corrplot: Visualization of a correlation matrix. Morbidity & Mortality Weekly Report 52: 145–151. [Google Scholar]
Wilkerson MD, Hayes DN (2010). ConsensusClusterPlus: A class discovery tool with confidence assessments and item tracking. Bioinformatics 26: 1572–1573. [Google Scholar]
Xu X, Zhang X, Xing H, Liu Z, Jia J, Jin C, Zhang Y (2019). Importin-4 functions as a driving force in human primary gastric cancer. Journal of Cellular Biochemistry 120: 12638–12646. [Google Scholar]
Xu X, Zhou Y, Miao R, Chen W, Qu K, Pang Q, Liu C (2016). Transcriptional modules related to hepatocellular carcinoma survival: Coexpression network analysis. Front Med 10: 183–190. [Google Scholar]
Xu XL, Xing BC, Han HB, Zhao W, Hu MH et al. (2010). The properties of tumor-initiating cells from a hepatocellular carcinoma patient’s primary and recurrent tumor. Carcinogenesis 31: 167–174. [Google Scholar]
Yang J, Lv Z, Huang J, Zhao Y, Li Y (2017). High expression of NME1 correlates with progression and poor prognosis in patients of hepatocellular carcinoma. International Journal of Clinical and Experimental Pathology 10: 8561–8568. [Google Scholar]
Yang W, Xia Y, Qian X, Wang M, Zhang X, Li Y, Li L (2019). Co-expression network analysis identified key genes in association with mesenchymal stem cell osteogenic differentiation. Cell and Tissue Research 378: 513–529. [Google Scholar]
Yeh HW, Lee SS, Chang CY, Hu CM, Jou YS (2017). Pyrimidine metabolic rate limiting enzymes in poorly-differentiated hepatocellular carcinoma are signature genes of cancer stemness and associated with poor prognosis. Oncotarget 8: 77734–77751. [Google Scholar]
Yi M, Li T, Qin S, Yu S, Chu Q et al. (2020). Identifying tumorigenesis and prognosis-related genes of lung adenocarcinoma: Based on weighted gene coexpression network analysis. Biomed Research International 2020: 4169691. [Google Scholar]
Yi SY, Nan KJ (2008). Tumor-initiating stem cells in liver cancer. Cancer Biology & Therapy 7: 325–330. [Google Scholar]
Yoshihara K, Shahmoradgoli M, Martínez E, Vegesna R, Kim H et al. (2013). Inferring tumour purity and stromal and immune cell admixture from expression data. Nature Communications 4: 2612. [Google Scholar]
Yu G, Wang LG, Han Y, He QY (2012). clusterProfiler: An R package for comparing biological themes among gene clusters. Omics-A Journal of Integrative Biology 16: 284–287. [Google Scholar]
Yue N, Ye M, Zhang R, Guo Y (2020). MiR-449b-5p targets lncRNA PSMG3-AS1 to suppress cancer cell proliferation in lung adenocarcinoma. BMC Pulmonary Medicine 20: 152. [Google Scholar]
Zeng Y, Fu BM (2020). Resistance mechanisms of anti-angiogenic therapy and exosomes-mediated revascularization in cancer. Frontiers in Cell and Developmental Biology 8: 610661. [Google Scholar]
Zeng Y, Yao X, Liu X, He X, Li L et al. (2019). Anti-angiogenesis triggers exosomes release from endothelial cells to promote tumor vasculogenesis. Journal of Extracellular Vesicles 8: 1629865. [Google Scholar]
Zhang C, Peng L, Zhang Y, Liu Z, Li W et al. (2017). The identification of key genes and pathways in hepatocellular carcinoma by bioinformatics analysis of high-throughput data. Medical Oncology 34: 101. [Google Scholar]
Zhang J, Huang J, Chen W, Hu Z, Wang X (2020). miR-143-3p targets lncRNA PSMG3-AS1 to inhibit the proliferation of hepatocellular carcinoma cells. Cancer Management and Research 12: 6303–6309. [Google Scholar]
Zhou Y, Liu F, Xu Q, Yang B, Li X et al. (2020). Inhibiting Importin 4-mediated nuclear import of CEBPD enhances chemosensitivity by repression of PRKDC-driven DNA damage repair in cervical cancer. Oncogene 39: 5633–5648. [Google Scholar]
Zhu T, Zheng J, Zhuo W, Pan P, Li M et al. (2021). ETV4 promotes breast cancer cell stemness by activating glycolysis and CXCR4-mediated sonic Hedgehog signaling. Cell Death Discovery 7: 126. [Google Scholar]
Zuo S, Wei M, Wang S, Dong J, Wei J (2020). Pan-cancer analysis of immune cell infiltration identifies a prognostic immune-cell characteristic score (ICCS) in lung adenocarcinoma. Frontiers in Immunology 11: 1218. [Google Scholar]
Appendix
Supplemental Table 1. TCGA clinical data.
Supplemental Table 2. GEO Clinical data.
Supplemental Table 3. DEGs between 50 normal and 374 LIHC samples obtained from TCGA databases.
Supplemental Table 4. The details in correlations between the gene modules and mRNAsi, and gene modules and epigenetically regulated mRNAsi (EREG-mRNAsi).
Supplemental Table 5. DEGs significantly correlated with the 3-year, 5-year survival of HCC patients.
Supplemental Table 6. Hub genes in the blue module.
Supplemental Table 7. DEGs in magenta module.
Supplemental Table 8. High- and low-risk subgroups and risk scores.
SUPPLEMENTAL FIGURE 1: The heatmap of these different biological processes of Cluster B vs. Cluster C. Red represented activated pathways and blue represented inhibited pathways.
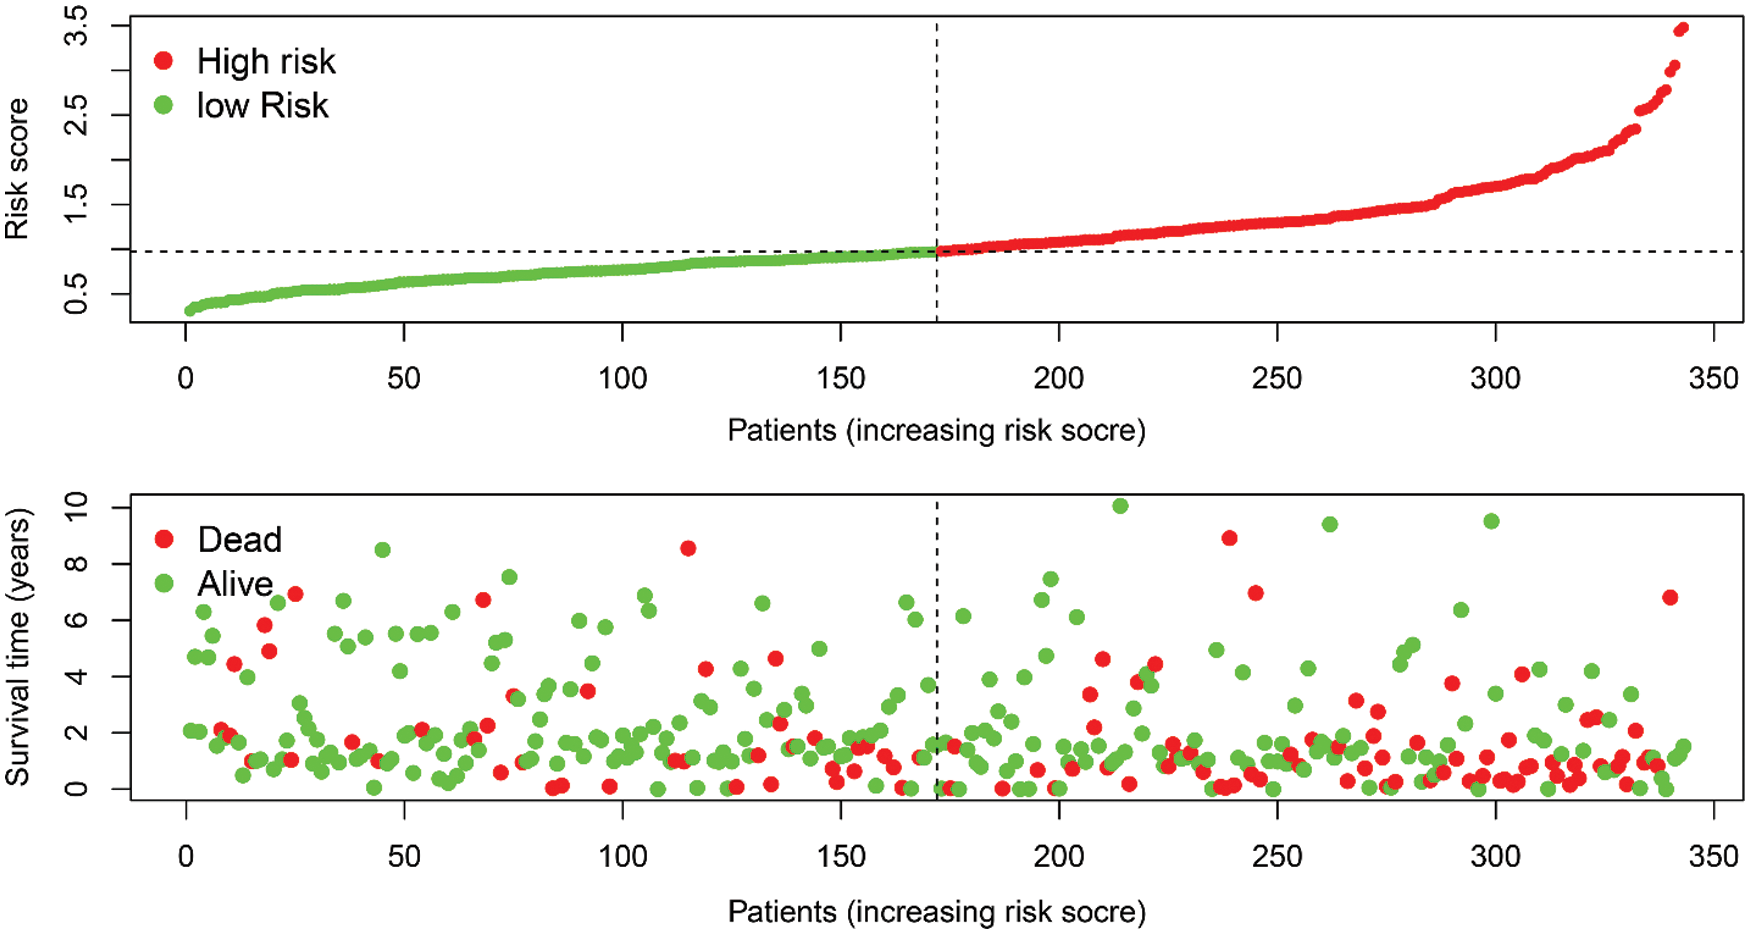
SUPPLEMENTAL FIGURE 2: The riskscore distribution of HCC patients in high- and low-risk subgroups (upper), and the overall survival status distribution of HCC patients with increasing risk score (bottom).
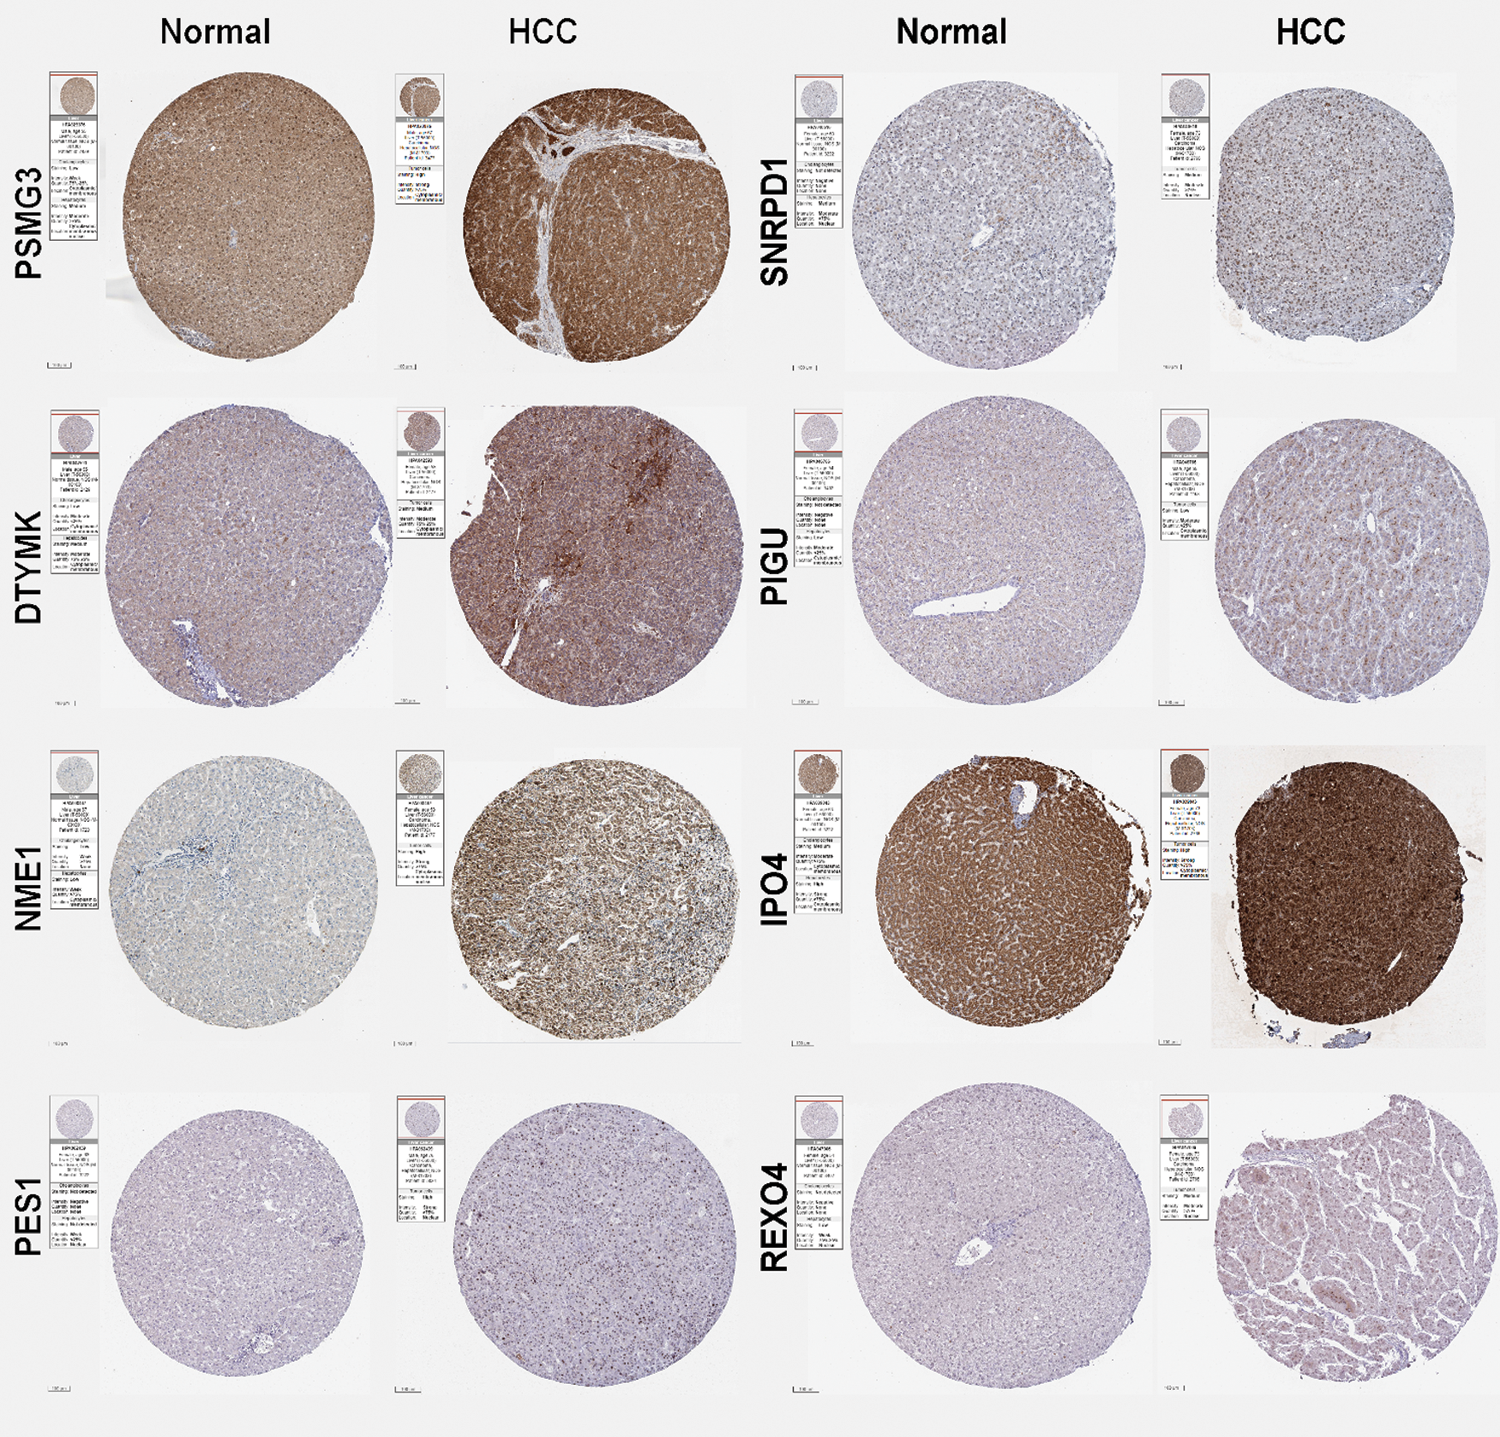
SUPPLEMENTAL FIGURE 3: Expression of the predictive hub genes. The immunohistochemistry (IHC) staining results of the hub genes obtained from the Human Protein Atlas (HPA) database. Representative images of PSMG3, SNRPD1, DTYMK, PIGU, NME1, IPO4, PES1, and REXO4 from normal subjects and liver cancer patients using the same antibody are shown. The sample and antibody information were shown in the label of each images.
 | This work is licensed under a Creative Commons Attribution 4.0 International License, which permits unrestricted use, distribution, and reproduction in any medium, provided the original work is properly cited. |