DOI:10.32604/biocell.2021.015376
| BIOCELL DOI:10.32604/biocell.2021.015376 | |
| Article |
Astragaloside IV improves melanocyte differentiation from mouse bone marrow mesenchymal stem cells
Department of Dermatology, Shanghai General Hospital, Shanghai Jiao Tong University School of Medicine, Shanghai, 200080, China.
*Address correspondence to: Weimin Shi, gzdhmjyp@163.com
Received: 14 December 2020; Accepted: 01 February 2021
Abstract: Vitiligo results in an autoimmune disorder destructing skin pigment cells, melanocytes (Mcs). This study aimed to investigate whether Astragaloside IV (AIV) could efficiently induce differentiation of bone marrow mesenchymal stem cells (BMMSCs) into Mcs. BMMSCs were induced and differentiated into Mcs with 0.1, 0.2, and 0.4 mg/L AIV during 150-day. Morphologic changes of differentiated cells were observed. Levels of some melanocytic specific genes (TRP-1, TRP-2, MART-1, Mitf) were measured with quantitative polymerase chain reaction (qPCR) at 90, 120, and 150 days of induction. After 90-day induction, the differentiated cells with 0.4 mg/L AIV demonstrated the typical morphology of Mcs, positive 3,4 dihydroxyphenylalanine staining, and positive staining of TRP-1, TRP-2, MART-1, and Mitf. After 90- and 120- days’ induction with 0.4 mg/L AIV, TRP-1 expression was significantly elevated (p < 0.01), and TRP-2 expression was significantly increased in 0.4 mg/L AIV-treated group compared to negative control (p < 0.01), 0.1 mg/L (p < 0.01), and 0.2 mg/L (p < 0.01) AIV-treated groups. Moreover, MART-1 expression was significantly up-regulated in 0.4 mg/L AIV-treated group compared to negative control, but without difference compared to 0.1 mg/L (p > 0.05) and 0.2 mg/L (p > 0.05) AIV-treated groups. During 90 to 150- day induction, there were no significant differences for Mitf levels between AIV-treated groups and negative control (p > 0.05). In conclusion, 90-day induction with 0.4 mg/L AIV up-regulated TRP-1, TRP-2, and MART-1 expression, indicating that AIV can efficiently induce Mcs differentiation from BMMSCs. These results provide experimental and theoretic evidence for AIV application in clinical vitiligo repigmentation treatment.
Keywords: Tyrosinase-related protein; Melanoma antigen recognized by T cells 1; Microphthalmia-associated transcription factor; Committed differentiation; Traditional Chinese medicine
Abbreviations
| Mc: | melanocyte |
| AIV: | astragaloside IV |
| BMMSC: | bone marrow mesenchymal stem cell |
| qPCR: | quantitative polymerase chain reaction |
| YQQB: | Yi Qi Qu Bai |
| TRP-1: | tyrosinase-related protein 1 |
| MART-1: | melanoma antigen recognized by T cells 1 |
| Mitf: | microphthalmia-associated transcription factor |
| DMEM-L: | Dulbecco’s Modified Eagle’s medium with L-glutamine |
| FBS: | fetal bovine serum |
| DMSO: | dimethyl sulfoxide |
| MEM: | Minimum Essential Medium |
| FGF: | fibroblast growth factor |
| PBS: | phosphate buffered saline |
| BSA: | bovine serum albumin |
| DAPI: | 4,6-diamidino-2-phenylindole |
| DOPA: | histochemical |
| DAG/PKC: | diacylglycerol/protein kinase C |
| NO/cGMP/PKG: | nitric oxide/cyclic GMP/protein kinase G |
| MAPK: | mitogen-activated protein kinase |
| cAMP/PKA: | cyclic AMP/protein kinase A |
| DGK: | DAG kinase |
| NSC: | neural stem cell |
| AD: | Alzheimer’s disease |
Vitiligo, an acquired pigmentary disorder, is clinically characterized by skin macules with loss of pigmentation (Boniface et al., 2018). The affected skin macules turn white with sharp margins and usually locate in areas exposed to the sun. The etiology of vitiligo is still unclear; however, it is believed to be related to genetic susceptibility to environmental factors, resulting in an autoimmune disorder that destructs skin pigment cells, melanocytes (Mcs) (Ezzedine et al., 2015). The global incidence of vitiligo is around 1%, and some populations even reach the rates as high as 2–3% (Whitton et al., 2016; Osinubi et al., 2018). Currently, there is no available and effective treatment for treating vitiligo. The most common treatment is a steroid combining ultraviolet light or creAIV to promote repigmentation (Whitton et al., 2016; Passeron, 2017). De-pigmentation is only considered for patients who present with large areas of vitiligo clinically. Several surgical treatments are available that restore Mcs at the skin site (Razmi et al., 2019). Most surgical techniques utilize Mcs suspensions prepared from a skin biopsy, and these Mcs are then autologously transplanted (Donaparthi and Chopra, 2016).
Bone marrow mesenchymal stem cells (BMMSCs) are members of the osteoblast lineage (Abdallah and Ali, 2020). BMMSCs have been demonstrated to be multi-potent and are capable of differentiating into various mesodermal and ectodermal lineages. This capability suggests that BMMSCs could be potentially used in therapeutic tissue repair procedures. In our earlier study (Mei et al., 2015), mouse BMMSCs were successfully differentiated into Mcs, of which the typical Mcs were verified not only by morphology but also by detection of Mcs specific cytoplasmic organelles, such as type III and IV melanosomes. This method could be applied to prepare an autologous Mcs suspension for transplantation in vitiligo treatment. However, the 180-day differentiation period may limit this application in the clinic.
Yi Qi Qu Bai (YQQB) granule was a traditional Chinese medicine made in our hospital, which has been used for vitiligo for many years and is primarily composed of Astragalusmembranaceus (Fisch.) Bunge (Fabaceae), Fructus Leonuri (Lamiaceae), Fructus Akebiae (Lardizabalaceae), and root of Caraganasinica (Bućhoz), Rehd. (Leguminosae). Astragalus membranaceus (AM) has been used to treat vitiligo patients in the progressive phase for nearly 30 years. In a prospective study (Zhang et al., 2017) of 233 segmental vitiligo patients, the effective rate and color-reverse rate of the patients who received combination therapy of YQQB granule and 308 nm-excimer laser were much higher than those who received only single 308 nm-excimer laser therapy.
Astragaloside IV (AIV) is characterized by a potential protective effect on the pathologies because of its wide range of biofunctional properties, including anti-inflammatory, antioxidant, anti-diabetic, anti-fibrotic, anti-viral, anti-asthmatic functions. (Costa et al., 2019). In the current study, we investigated whether AIV, the main ingredients from AM, could more efficiently induce differentiation of BMMSCs into Mcs by optimizing the induction method, shortening differentiation times, and increasing the overall yield of desired differentiated cells. To improve the previous method of Mcs differentiation from BMMSCs, we incubated BMMSCs with AIV at varying concentrations (0.1–0.4 mg/L) in the differentiation medium trying to find out more efficient induction time. We also measured the levels of some melanocytic specific marker genes, including tyrosinase-related protein 1 (TRP-1), TRP-2, melanoma antigen recognized by T cells 1 (MART-1), and microphthalmia-associated transcription factor (Mitf), using quantitative real-time polymerase chain reaction (qPCR). The results of this study would provide evidence to support the application of AIV in Mc differentiation.
Six male C57BL/6 mice (aged 6 weeks, 16–20 g; Slac, Shanghai, SCXK 2007-0005) were sacrificed for BMMSCs isolation. BMMSCs were isolated according to the protocol described by our previous study (Mei et al., 2015). Adherent primary BMMSCs were maintained in complete Dulbecco’s Modified Eagle’s medium with L-glutamine (DMEM-L) supplementing with 20% fetal bovine serum (FBS) (Gibco, EI Paso, Texas, USA) in an incubator at 37°C with 5% CO2. The culture medium was changed every 48 h. Cells were used after passage 3. Once the cells were approximately 70–80% confluent, they were collected and seeded into a 6-well plate at 2 × 10⁵/well. After 3 days in sub-culture, cellular surface markers were identified with immunocytochemical staining using rabbit anti-mouse CD34, CD44, CD45, CD90, and CD105 primary antibodies (Abcam, Cambridge, United Kingdom) and secondary FITC-labeled goat anti-rabbit antibody (Chemicon; Temecula, CA, USA). BMMSCs were identified by positive CD44, CD90, and CD105 and negative CD34 and CD45 staining.
Astragaloside IV (AIV) (purity >98%) was obtained from Chengdu Desite Pharmaceutical Technology Co., Ltd., Chengdu, China. And it was dissolved in dimethyl sulfoxide (DMSO) (less than 0.1% in the final working concentration).
Differentiation of BMMSCs into Mcs
BMMSCs (1 × 10⁶/mL; passage 6) were seeded on 25 cm2 cell culture plates (4 × 10⁴ cells/cm2) and cultured in Mcs differentiation medium containing Minimum Essential Medium Alpha Medium (MEM; Invitrogen, Carlsbad, CA, USA), 10% FBS and supplemented with 1.5 μg/mL hydrocortisone (Sigma-Aldrich, St. Louis, MO, USA), 10 μg/mL insulin (Sigma-Aldrich), 10 μg/mL transferrin (Invitrogen), 4 ng/mL basic fibroblast growth factor (FGF; Invitrogen) as a previous study described (Mei et al., 2015). The medium was changed every two days until the adherent cells reaching 90% confluent. The morphological characteristics of both primary and differentiated cells were observed under an inverted microscope (Leica, Wetzlar, Germany). In a preliminary experiment, we found that the induced BMMSCs demonstrated a lower survival rate in the culture media containing greater than 0.4 mg/L AIV (Suppl. Fig. S1). Thus, AIV was dissolved in Mcs differentiation medium at 0.4 mg/L.
3,4 dihydroxyphenylalanine (DOPA) staining
The induced BMMCSs (Mcs) were stained with mixed solution, including 25 mL of 0.2% DOPA solution (Sigma-Aldrich), 6 mL of 11 mg/mL Na2HPO4 • 2H2O, and 2 mL of 9 mg/mL KH2PO4 for 4 h at 37°C. Then, Mcs were washed three times with phosphate-buffered saline (PBS) and rinsed with water. First passage BMMSCs were used as negative controls, and B16 melanoma cells (ATCC, Manassas, VA, USA) were used as positive controls.
Immunofluorescence and immunocytochemical analysis
BMMSCs (passage 3) and differentiated cells (2 × 10⁵/well) cultured in a 6-well plate were fixed with 4% paraformaldehyde in PBS for 10 min at 4°C, washed with PBS, and blocked in buffer containing 5% bovine serum albumin (Gibco) for 30 min at room temperature. The BMMSCs were incubated with rabbit anti-mouse CD34, CD44, CD45, CD90, CD105 antibodies (all at 1:50, Abcam), and rat anti-mouse TRP-1, MART-1 (1:100, Abcam), rat anti-mouse Mitf (1:150, Abcam) and rabbit anti-mouse TRP-2 (1:200, Abcam) antibodies overnight at 4°C in 1% bovine serum albumin (BSA)/PBS, in a dark chamber. After two PBS washes, the cells were incubated with the appropriate secondary antibodies (1:100) for 2 h. Nuclei were visualized by staining with 4,6-diamidino-2-phenylindole (DAPI; Sigma). Immunocytochemical staining was evaluated according to a previously established method (Suleiman et al., 2019).
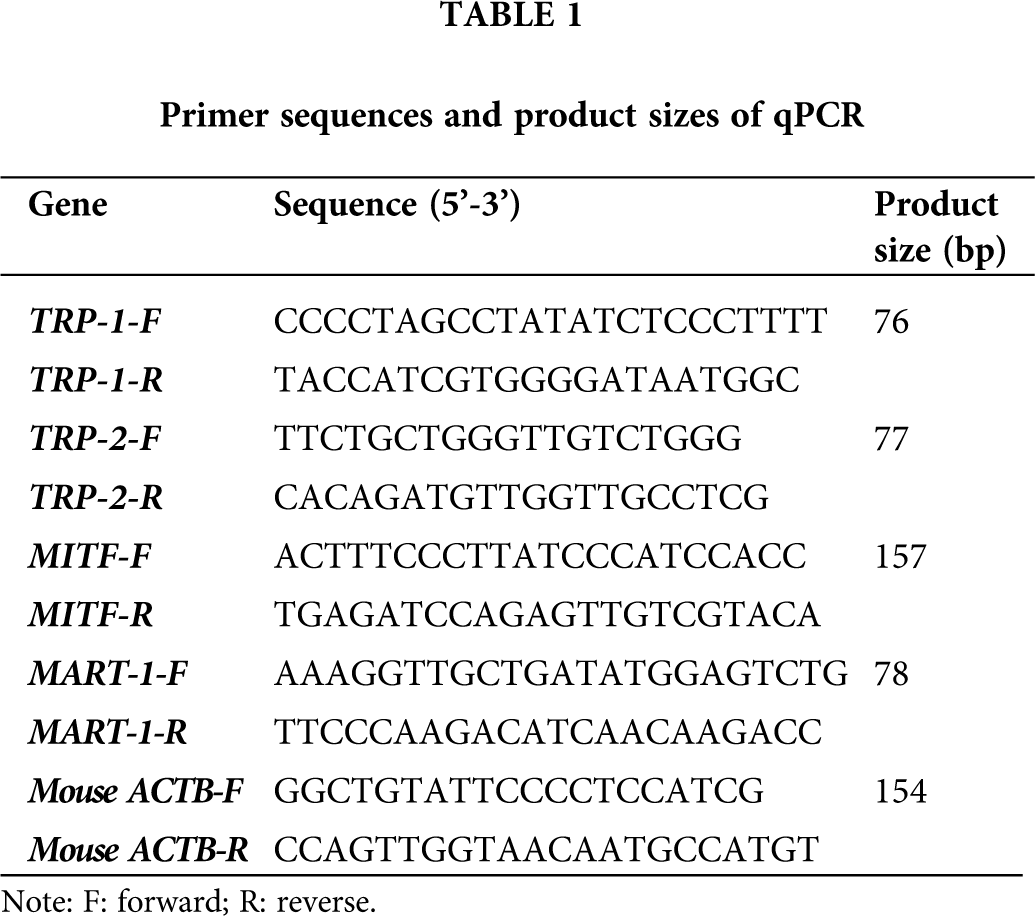
Quantitative polymerase chain reaction (qPCR)
Total RNAs from B16 melanoma cells, induced cells, and BMMSCs (passage 6) were extracted with Trizol reagent (Invitrogen) according to the manufacturer’s instructions. The RNA (1 μg) was reversely transcribed into cDNA with M-MLV (Takara, Tokyo, Japan) and random primers in a final reaction volume of 20 μL. qPCR assay was performed using Sybergreen Master Mix (Takara). The primers for the qPCR are listed in Tab. 1. The thermal cycles of qPCR reaction were listed as followings: 95°C for 30 s, 45 cycles at 95°C for 5 s, 60°C for 30 s, 95°C for 1 min, and 79 cycles at 55–95°C for 4 s. The relative transcriptions of the targeting genes (TRP-1, TRP-2, MART-1, and Mitf) were quantified using the FTC3000HT Real-Time PCR System (Funglyn Biotech, Richmond Hill, Ontario, Canada). Each sample was analyzed at least for three repeats, and mouse ACTB (β-actin) was used as an internal reference gene for semi-quantitative analysis.
Data were represented as mean ± standard deviation (SD) and analyzed using SPSS software (version: 20.0, IBM Corporation, Armonk, NY, USA). qPCR analysis was normalized to β-actin. Gene expression was analyzed by Student’s t-test. Statistical significance was considered at P-values < 0.05 (two-sided).
Identification of BMMSCs with cellular immunostaining
The isolated BMMSCs were identified using the cellular immunostaining method (Fig. 1A). The results showed that the BMMSCs demonstrated CD44, CD90, CD105 positive staining and CD34, CD45 negative staining (Fig. 1B). Therefore, the isolated cells were characterized as BMMSCs.
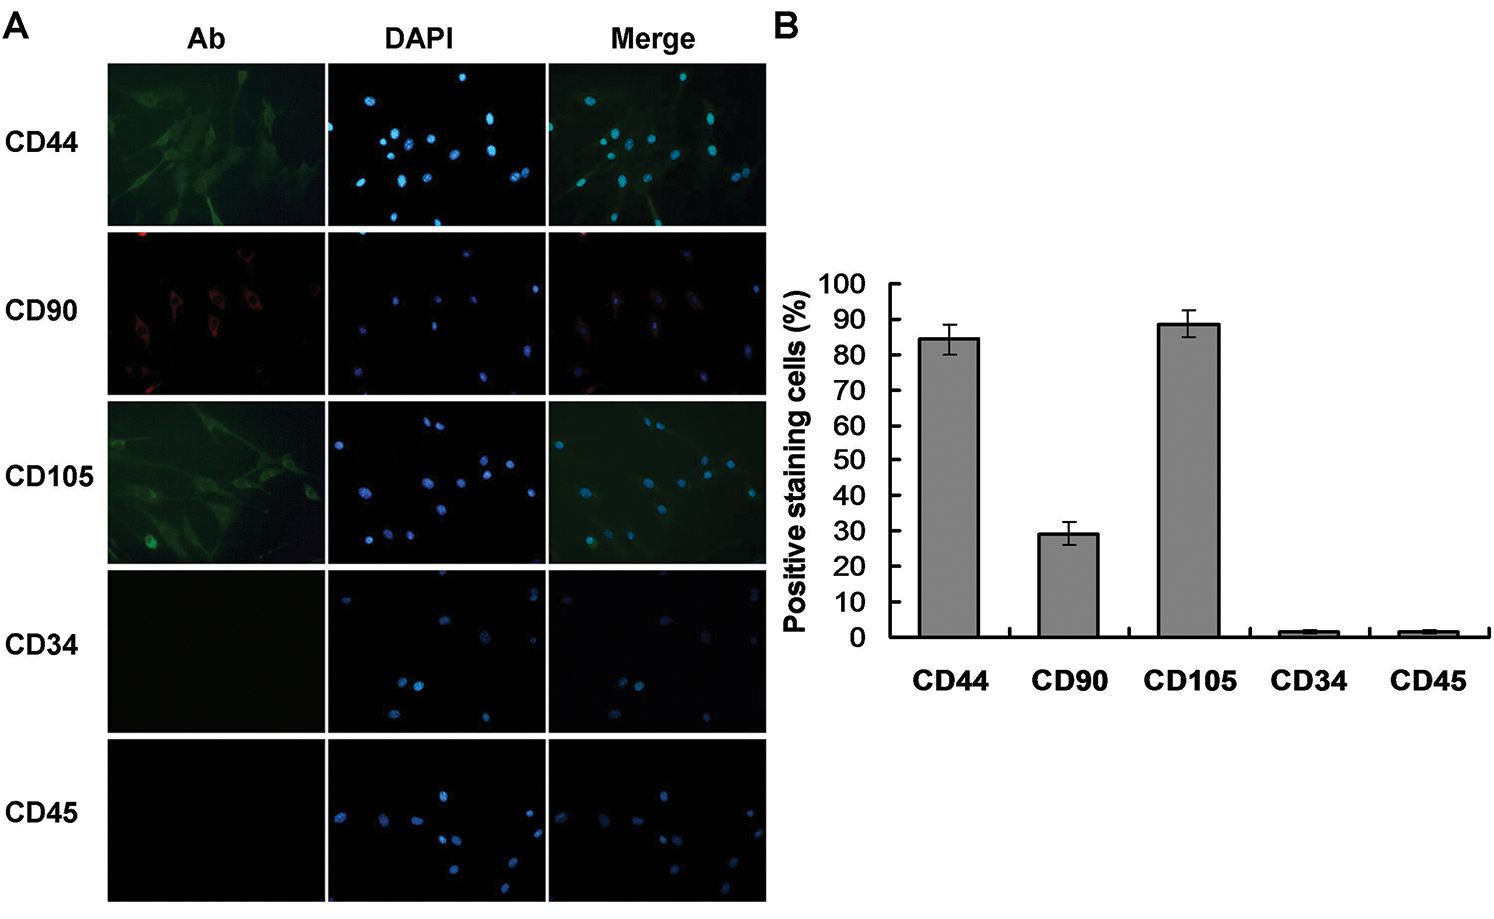
Figure 1: Immunofluorescence analysis of BMMSCs. (A) BMMSCs were immunostained with anti-CD44, anti-CD90, anti-D105, anti-CD34, and anti-CD45 antibodies (left panels, Ab). The corresponding nuclei were stained with DAPI (middle panels). The corresponding merged images of antibody (Ab) and DAPI were presented in the right panels. The images showed that CD44, CD90, and D105 were positively and CD34, CD45 were negatively stained in BMMSCs. (B) Statistical analysis for the positive (CD44, CD90, D105) and negative (CD34, CD45) staining cells.
Morphological changes during Mcs differentiation
During the initial induction period with 0.4 mg/L AIV-containing differentiation buffer, primary BMMSCs were adherent and round in shape and were mixed with some other suspending cells (Fig. 2A). The adherent cells presented as clonal expansion. At culture passage 3 (20-day induction), the cells were approximately 80–90% confluent and tended to gather in a monolayer on the bottom, which displayed a spindle-like shape with strong light refraction (Fig. 2B). At 70-day induction, the cells still displayed fibroblast morphology with a spindle-like shape, large cell body, and abundant cell nuclei (Fig. 2C). In this phase, the cells proliferated rapidly, with a passage cycle of approximately 4–5 days. At 90-day induction, the proliferation of the differentiated cells gradually slowed, and the passage cycle extended to 7 days. The differentiated cells formed networks, which displayed a polygonal shape with distinct outlines and prolonged dendrites, typical morphology of Mcs (Fig. 2D).
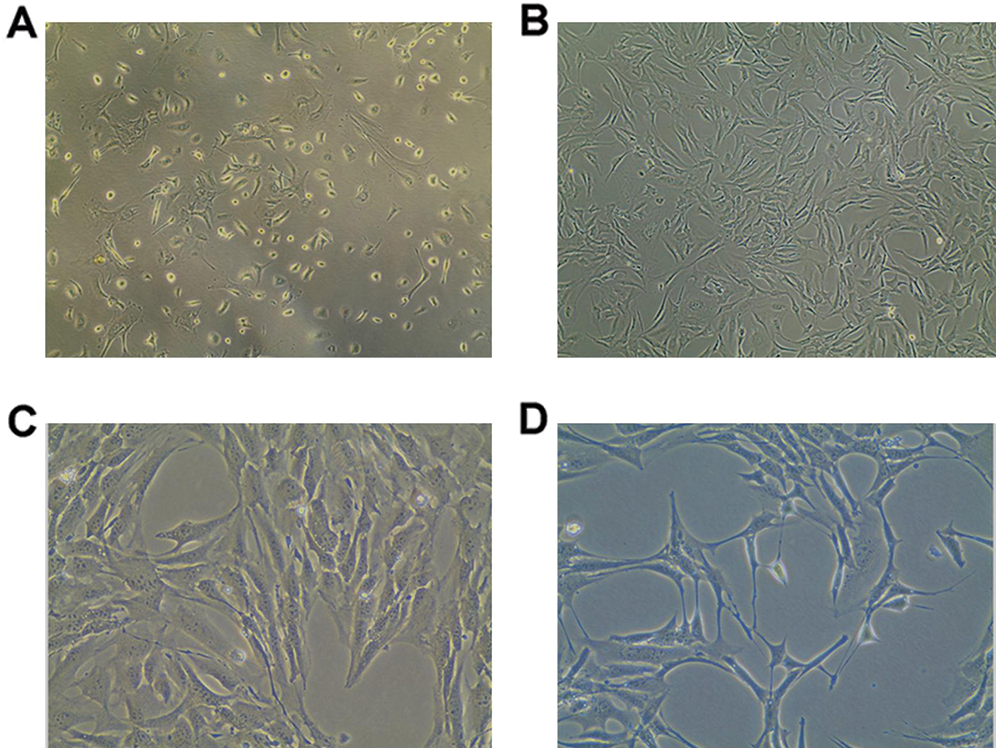
Figure 2: Morphologic changes of BMMSCs and differentiated cells. BMMSCs were induced with differentiation buffer supplemented with 0.4 mg/L AIV for 90 days. (A) In the initial culture, the primary BMMSCs were adherent and displayed a round shape, mixed with a small number of other suspension cells (10×). (B) After 3 passages (20-day induction), BMMSCs displayed spindle shape cells, had long cytoplasmic processes, and demonstrated strong light refraction (10×). (C) At 70-day induction, differentiated cells showed morphologic features similar to fibroblasts, with a spindle-like shape, large cell body, and abundant cell nuclei (40×). (D) At 90-day induction, the differentiated cells formed a network, with a polygonal shape and distinct outlines and prolonged dendrites, similar to Mcs (40×).
DOPA positive stain in differentiated cells
The DOPA assay was used to identify active tyrosinase (TYR). TYR is a rate-limiting oxidase that controls melanin production in Mcs. At 90-day induction with 0.4 mg/L AIV-containing differentiation buffer, the Mcs (Fig. 3A) and positive control B16 cells (Fig. 3B) demonstrated DOPA positive staining. However, the pre-differentiated BMMSCs demonstrated DOPA-negative staining (Fig. 3C). Meanwhile, there was no significant difference for DOPA-positive staining cells between the Mcs group and positive control B16 group (Fig. 3D, p > 0.05). The differentiated Mcs induced by 0.1 mg/L and 0.2 mg/L AIV differentiation buffer at 90-day induction demonstrated similar findings (Suppl. Fig. S1B).
Immunofluorescence staining of TRP-1, TRP-2, MART-1, and Mitf in differentiated Mcs
The specific Mcs marker proteins, TRP-1, TRP-2, MART-1, and Mitf, were identified in the differentiated cells by immunofluorescence staining. Mitf was primarily detected in the nuclei, while the other markers were predominantly expressed in the cytoplasm (Fig. 4). These results further confirmed that cells undergoing 90-day induction with 0.4 mg/L AIV differentiated into Mcs. The Mcs differentiated in 0.1 mg/L and 0.2 mg/L AIV differentiation buffer for 90 days showed similar results (Suppl. Fig. S1C).
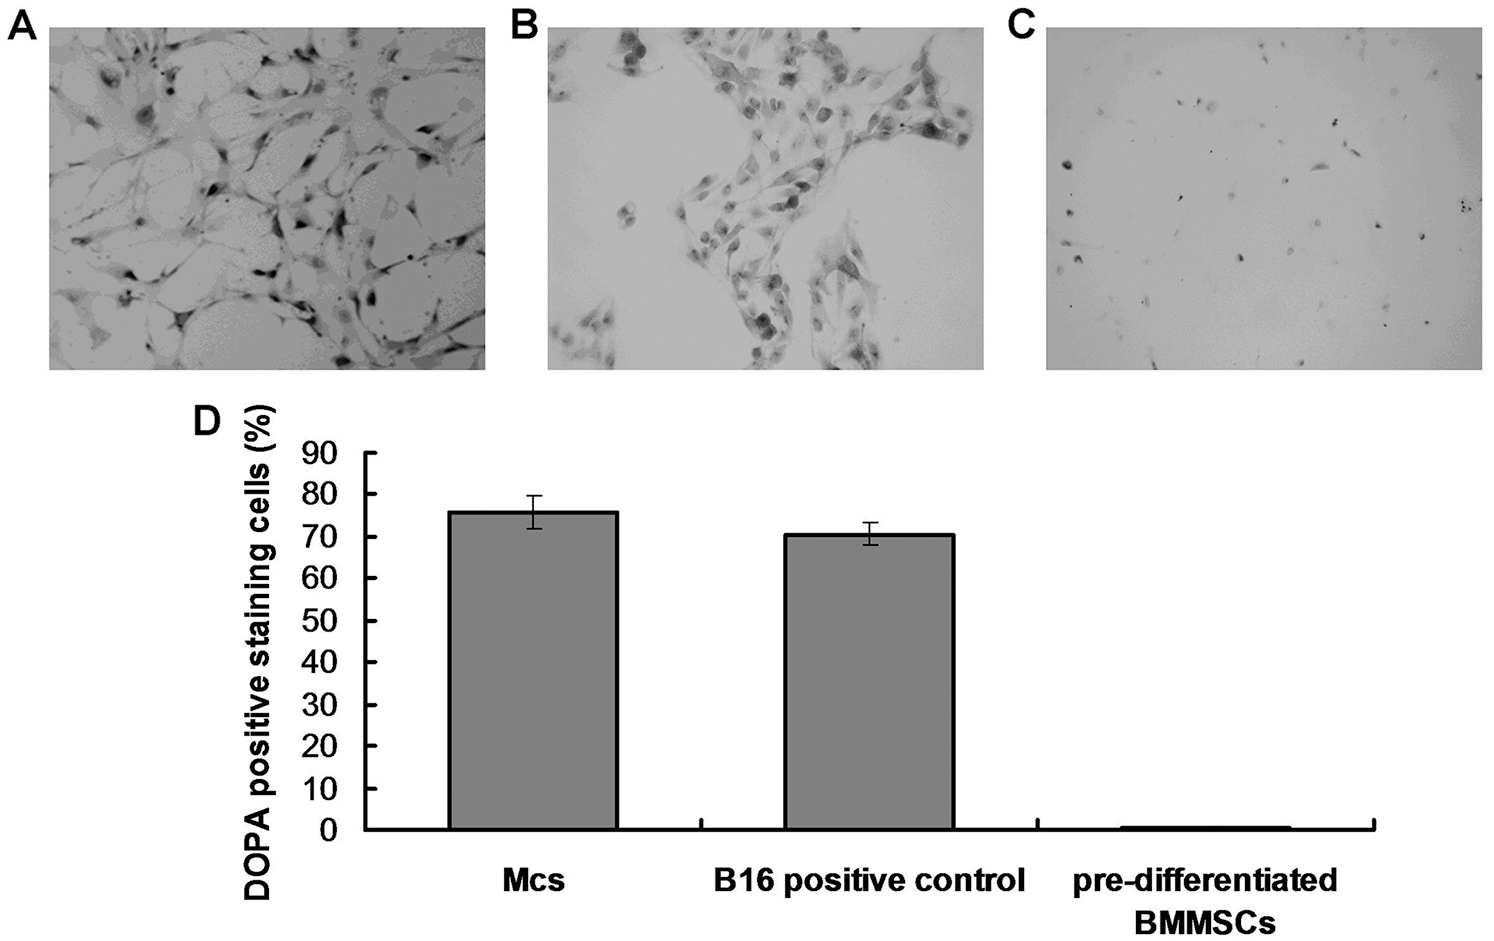
Figure 3: DOPA oxidase activity in differentiated Mcs. (A) The differentiated Mcs were positively stained with DOPA (Magnification, 200×). (B) The positive control B16 melanoma cells was positively stained with DOPA (Magnification, 200×). (C) The negative control pre-differentiated BMMSCs were negatively stained with DOPA (Magnification, 200×). According to the images, the differentiated Mcs and B16 cells displayed a typical melanocyte morphology and strong DOPA activity. (D) Statistical analysis for the DOPA staining cells.
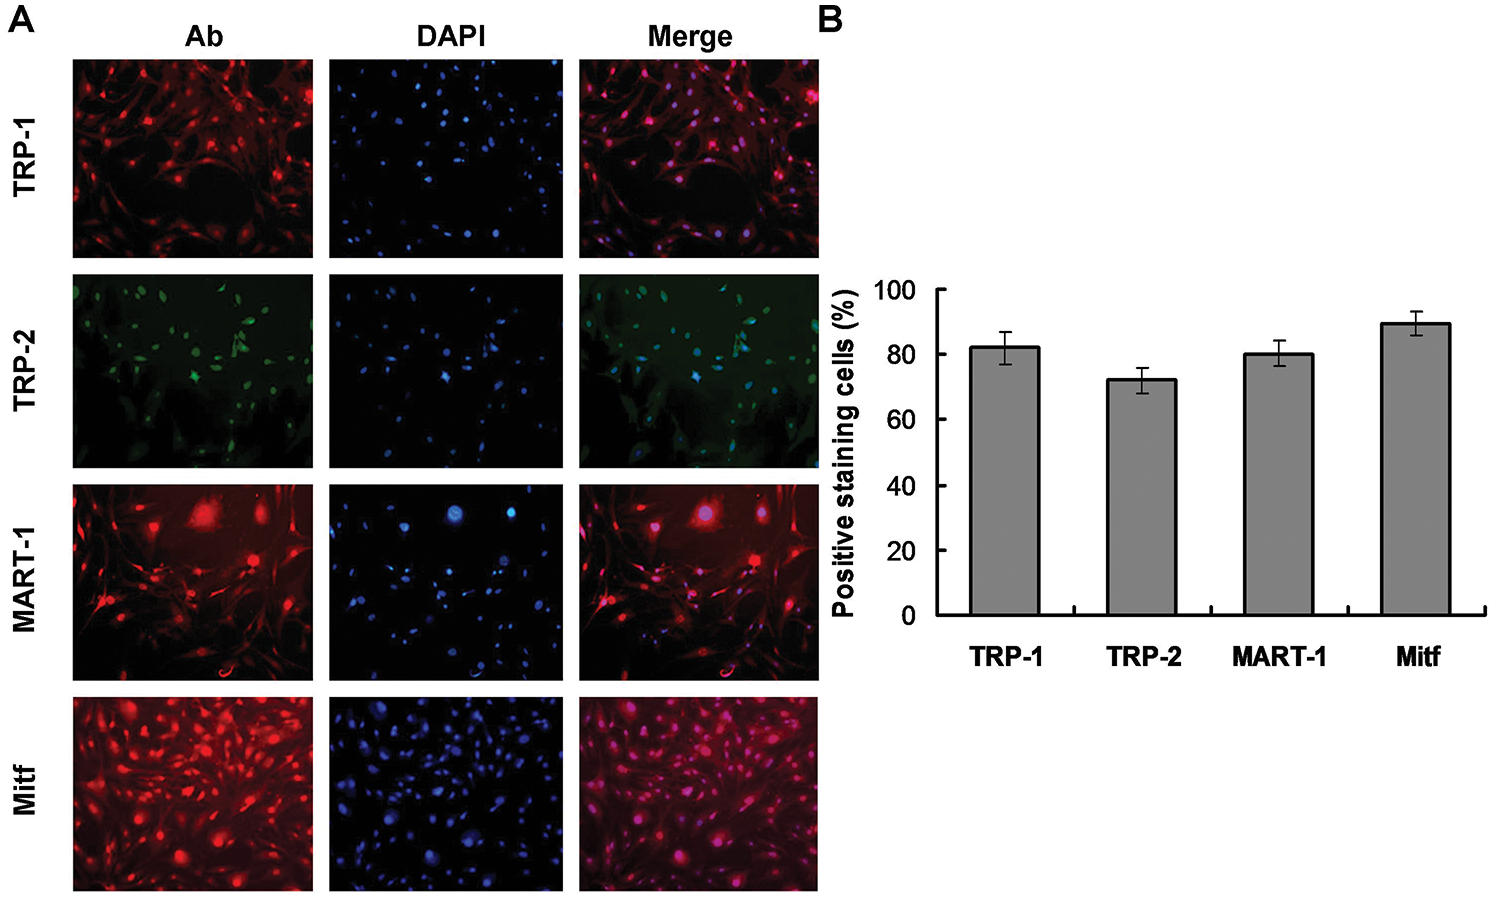
Figure 4: Immunocytochemical analyses of differentiated cells. (A) The differentiated cells were immunostained with anti-TRP1, anti-TRP2, anti-MART-1, and anti-Mitf antibodies (left panels, Ab). The corresponding nuclei were stained with DAPI (middle panels). The corresponding merged images of antibody (Ab) and DAPI are presented in the right panels. As the images illustrated, Mitf was primarily detected in nuclei, while TRP1, TRP2, and MART-1 were predominantly expressed in the cytoplasm. (B) The statistical analysis for the Mcs biomarkers-stained cells.
TRP-1 expression in differentiated Mcs supplemented with AIV
We used qPCR to measure the expression of the Mcs specific marker TRP-1 to determine the maturation state of the differentiated Mcs treated with different concentrations of AIV (Fig. 5A). At 150-day induction, TRP-1 expression was significantly increased in the 0.1, 0.2, and 0.4 mg/L AIV-treated cells compared to the control group (p < 0.01) and the differentiation medium group (p < 0.05), but still lower than that of the B16 positive control cells (p < 0.01) (Fig. 5A). The TRP-1 level in the 0.4 mg/L AIV group was higher compared to the 0.1 mg/L and 0.2 mg/L AIV groups (p < 0.05). TRP-1 expression levels between the 0.1 mg/L and 0.2 mg/L groups were not considerably different (p > 0.05). These data show that 150-day incubation with 0.1–0.4 mg/L AIV improves Mcs differentiation as evidenced by increased TRP-1 expression.
At 90- and 120-day induction, TRP-1 expression was significantly elevated in the 0.4 mg/L AIV-treated cells, which was not only higher compared to the negative control group (p < 0.01) and the differentiation medium group (p < 0.01 in 90-day group and p < 0.05 in 120-day group), but also higher compared to the 0.1 mg/L AIV-treated (p < 0.01 in 90-day group and p < 0.05 in 120-day group) and 0.2 mg/L (p < 0.01 in 90-day group and p < 0.05 in 120-day group) AIV-treated groups, respectively (Fig. 5A). TRP-1 expression was still lower compared to the B16 positive control group (p < 0.01). TRP-1 expression in the 0.1 mg/L AIV and 0.2 mg/L AIV treated groups was higher compared to the non-induction (negative control) group (p < 0.01), however, they were not significantly different compared to the differentiation medium group (p > 0.05), and lower compared to B16 positive control group (p < 0.01; Fig. 5A).
In summary, these data suggest that from 90- to 120-day induction in differentiation medium supplemented with 0.4 mg/L AIV improves Mc differentiation, as evidenced by increased expression of TRP-1.
TRP-2 expression in differentiated Mcs supplemented with AIV
We analyzed expression of the Mcs markerTRP-2 in the differentiated Mcs treated with different concentrations of AIV using qPCR assay (Fig. 5B). At 120- to 150-day induction, TRP-2 expression was augmented in the 0.1, 0.2, and 0.4 mg/L AIV-treated groups compared to the control group (p < 0.01). In addition, the TRP-2 level in the 0.4 mg/L AIV-treated group was higher compared to the 0.1 mg/L and 0.2 mg/L AIV groups (p < 0.05 and p < 0.01, respectively) and the differentiation medium group (p < 0.01), but TRP-2 expression was still lower compared to the B16 positive control group (p < 0.01) (Fig. 5B). The TRP-2 levels in the 0.1 mg/L and 0.2 mg/L AIV groups were higher compared to the differentiation buffer group (p < 0.05 and p < 0.01, respectively). The levels between the 0.1 mg/L and 0.2 mg/L groups were not considerably different (p > 0.05). These data suggest that 120 to 150-day incubation with 0.2–0.4 mg/L AIV improves Mcs differentiation, as evidenced by increased TRP-2 expression.
At 90-day induction, TRP-2 expression was significantly increased in the 0.4 mg/L AIV-treated cells, which was higher compared to the negative control group (p < 0.01) and the differentiation medium group (p < 0.01), and also higher compared to the 0.1 mg/L (p < 0.01) and 0.2 mg/L (p < 0.01) AM-treated groups (Fig. 5B). However, TRP-2 expression was still lower compared to the B16 positive control group (p < 0.01). TRP-2 expression in the 0.2 mg/L AIV-treated group was higher compared to the negative control group (p < 0.01). There was no significant difference between the 0.1 mg/L and 0.2 mg/L groups (p > 0.05) (Fig. 5B).
In summary, these results indicate that 90-day induction with 0.2 and 0.4 mg/L AIV improves Mc differentiation, as evidenced by increased TRP-2 expression.
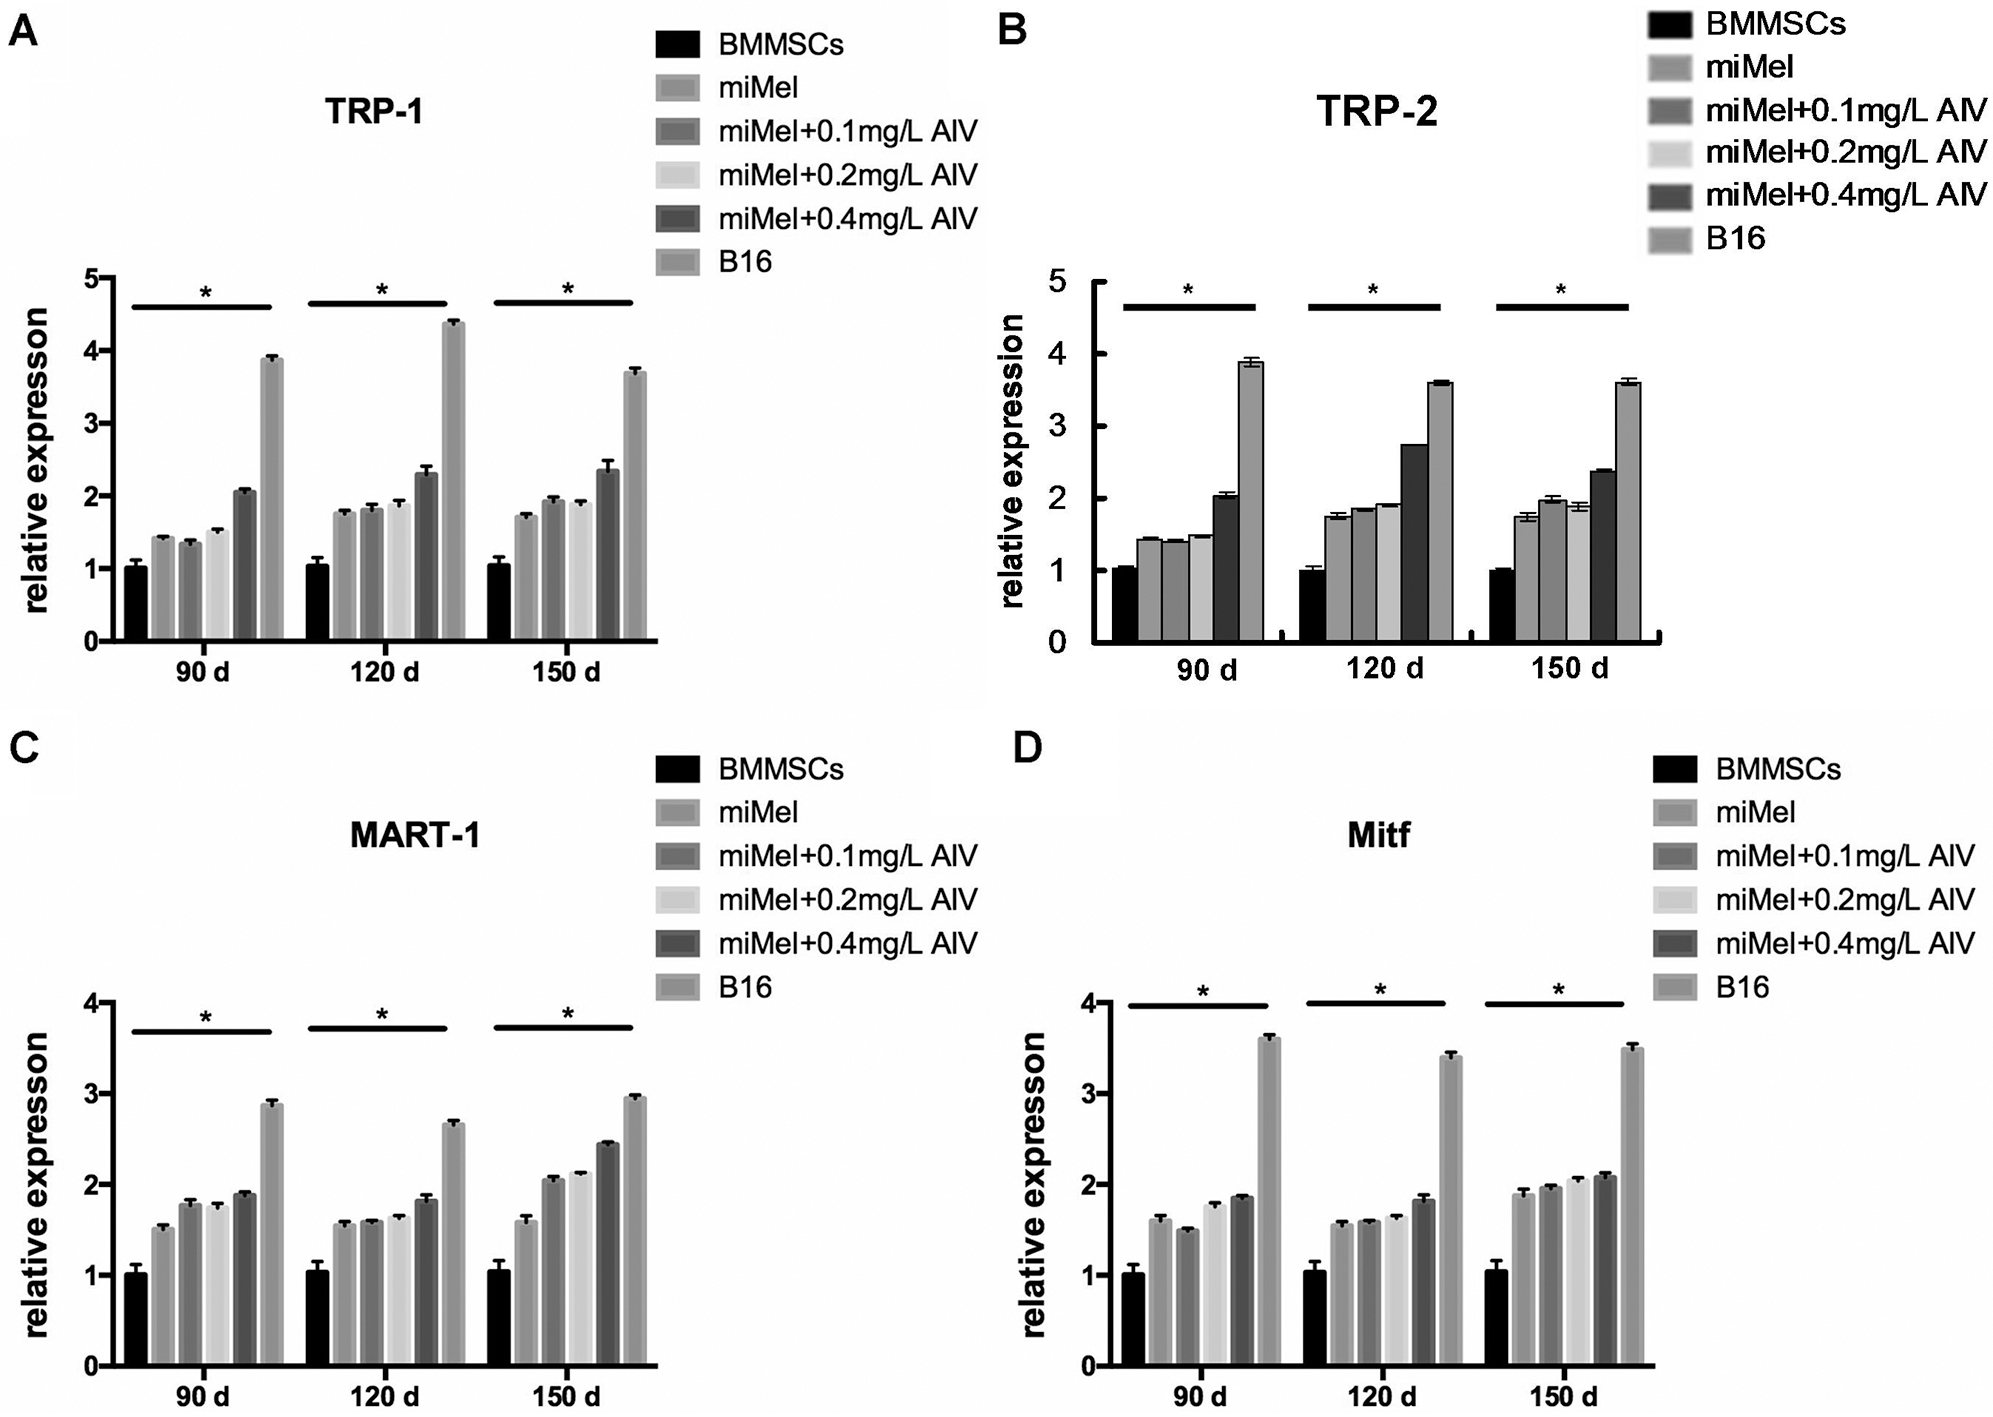
Figure 5: Expression of Mcs marker in the AM-treated cells. BMMSCs were induced with differentiation medium supplemented with the indicated concentrations of AIV (0.1, 0.2, and 0.4 mg/L) for 90- (brown), 120- (yellow), and 150- (light blue) day. After differentiation, expression of Mcs markers genes, TRP-1 (A), TRP-2 (B), MART-1 (C), and Mitf (D), were measured using qPCR. BMMSCs (blue) were used as negative controls and standardized as one-fold. B16 melanoma cells (dark purple) were used as positive controls. Each group represents three independent tests (N = 3). Data were represented as mean ± standard deviation (SD).
MART-1 expression in differentiated Mcs supplemented with AIV
Gene expression of MART-1, another melanocytic marker protein, in the differentiated Mcs treated with different concentrations of AIV was measured using qPCR assay (Fig. 5C). At 120 to 150-day induction, MART-1 levels were amplified in the 0.1, 0.2 and 0.4 mg/L AIV-treated groups compared to the negative control group (p < 0.05, p < 0.01, and p < 0.01, respectively). Furthermore, MART-1 levels in the 0.4 mg/L AIV-treated group were elevated compared to the differentiation medium group (p < 0.05). However, there were no differences for MART-1 levels among the 0.1, 0.2 and 0.4 mg/L AIV-treated groups (p > 0.05). MART-1 levels in all AIV-treated groups were lower compared to the B16 positive control group (p < 0.01) (Fig. 5C). At 90-day induction, MART-1 expression was significantly elevated in the 0.4 mg/L AIV-treated cells, which was higher compared to the negative control group (p < 0.01) and the differentiation medium group (p < 0.05) but was not different compared to the 0.1 mg/L (p > 0.05) and 0.2 mg/L (p > 0.05) AIV-treated groups (Fig. 5C). However, MART-1 was lower compared to the B16 positive control group (p < 0.01). MART-1 expression in both the 0.1 mg/L and 0.2 mg/L AIV-treated groups was higher compared to the non-induction (negative control) group (P < 0.01) and differentiation medium group (p < 0.05). There was no significant difference between 0.1 mg/L and 0.2 mg/L groups (p > 0.05) (Fig. 5C).
In summary, these results indicate that 90-day induction with 0.4 mg/L AIV improves Mc differentiation, as evidenced by increased MART-1 expression.
Mitf expression in the differentiated Mcs supplemented with AIV
Finally, Mitf gene expression, which is limited in Mcs, osteoclasts, and mast cells (Hershey and Fisher, 2004), was measured in the differentiated Mcs treated with different concentrations of AIV using qPCR assay (Fig. 5D). At 90 to 150-day induction, Mitf levels were augmented in all AIV-treated groups compared to the negative control group (p < 0.01, except the 0.1 mg/L AIV-treated group for 90-day induction, where the p-value was less than 0.05). However, none of the AIV supplemental groups was significantly different compared to the differentiation medium group (p > 0.05) (Fig. 5D). These results indicate that Mitf expression is not increased by AIV supplementation.
A surgical technique that involves autologous transplantation of Mcs has been established to treat patients with vitiligo (Donaparthi and Chopra, 2016). A crucial process in this technique is Mc differentiation. We have successfully differentiated Mcs from BMMSCs using hydrocortisone, insulin, transferrin, and FGF (Mei et al., 2015). However, the long induction time for differentiation (120–180 days) has limited the application of this technique. In this study, we applied a traditional Chinese medicine, AM, in combination with our previously described differentiation media to induce Mcs differentiation from BMMSCs. Morphological (Fig. 2), histochemical (DOPA) (Fig. 3), and immunofluorescence imaging (TRP-1, TRP-2, MART-1, and Mtif) (Fig. 4) analyses indicate that Mc differentiation can be optimized to a minimum of 90 days with 0.4 mg/L AIV. In addition, qPCR showed that expression levels of Mc markers, TRP-1, TRP-2, and MART-1, were significantly augmented (p < 0.01) compared to the negative control and the standard differentiation medium groups (p < 0.01). Another Mc marker, Mtif, was not affected by AIV-treatment and the standard differentiation medium group (p < 0.05) but was still higher compared to the negative (non-induction) controls (p < 0.05). These data suggest that treatment with 0.4 mg/L AIV for 90 days can increase TRP-1, TRP-2, and MART-1 expression. Collectively, morphology, immunocytochemistry, and immunofluorescence analyses suggest that 0.4 mg/L AIV decreases Mc differentiation time from 180 to 90 days when cells are cultured in the differentiation medium.
Mc proliferation and differentiation are primarily regulated by four different signaling transduction pathways including, diacylglycerol/protein kinase C (DAG/PKC), nitric oxide/cyclic GMP/protein kinase G (NO/cGMP/PKG), mitogen-activated protein kinase (MAPK), and cyclic AMP/protein kinase A (cAMP/PKA) (Halaban, 1994). Insulin, hydrocortisone, FGF, and transferrin, all of which were present in our differentiation medium, are non-carcinogenic factors that activate Mc differentiation via either the cAMP/PKA, MAPK, or NO/cGMP/PKG signaling pathways (Mei et al., 2015).
TYR is a rate-limiting enzyme that controls melanin production through hydroxylation of a monophenol and conversion of an o-diphenol to the corresponding o-quinone (Kumar et al., 2011). TRP-1 and TRP-2 are homologic enzymes of the TYR gene family, the function of which is to scavenge free radicals (Murisier and Beermann, 2006). In this study, 90-day culture in differentiation medium supplemented with 0.2–0.4 mg/L AIV increased TRP-1 and TRP-2 expression. Kawaguchi et al. (2012) found that DAG kinase (DGK) modulates TYR post-translation to regulate melanogenesis. This suggests that AIV may induce TYR activity in Mc differentiation through activation of the DAG/PKC pathway. It is widely speculated that AIV may be able to promote not only the expression of melanin biosynthesis-related proteins but also the differentiation of cells into intermediate melanoblasts. Future studies to investigate this differentiation process would be of particular interest.
MART-1 is a melanoma-associated antigen recognized by autologous cytotoxic T lymphocytes and is primarily presented on melanosomes and the endoplasmic reticulum, which plays an important role in the expression, stability, trafficking, and processing of the pre-melanosome protein as well as the formation of stage II melanosomes (Bandarchi et al., 2013). In this study, at 90-day induction of BMMSCs in differentiation medium supplemented with 0.4 mg/L AIV, MART-1 expression was significantly increased compared to the non-induced cells and the differentiation medium groups (Fig. 5C). This result suggests that AIV alone plays a primary role in regulating MART-1 expression. Indeed, Kono et al. (2006) found that inhibition of MAPK signaling with PD98059 or U0126 (MEK inhibitors) up-regulated MART-1 expression in melanoma cell lines, MU89 and MUX (a lower variant cell of MU89). These findings directly suggest that AIV may inactivate the MARK/MEK pathway to induce MART-1 expression during Mc differentiation.
Mitf highly expresses in malignant melanoma cells. Mitf regulates melanin production by binding to TYR, TRP-1, and TRP-2 promoters to trans-activating the expression of TYR-related genes (Levy et al., 2006). Mitf expressed in the differentiated cells (either with or without AM) was relatively stable and significantly lower compared to the positive control cells (B16 cells) during the 150-day induction (Fig. 5D). These results indicate that AIV does not up-regulate Mitf expression. Low expression of Mitf is related to stem cell-like or invasive potential (Hartman and Czyz, 2015). In this sense, AIV may not be involved in arresting cell cycle but could play a role in regulating invasive cellular properties. In addition, lower Mitf expression may promote mild melanocyte differentiation, but not melanoma. Our data clearly showed that AIV-induced TRP-1, TRP-2, and MART-1 expression was significantly lower compared to expression in the B16 positive control cells. The differentiation conditions in this study are relatively mild and safe, and the significantly increased expression levels of TRP-1, TRP-2, MART-1, and Mitf were only found in the B16 melanoma cell line.
In the clinic of traditional Chinese medicine, AM (AIV) has been applied to control progressive vitiligo for many years, which could decrease VIDA scores without obvious adverse effects. Our data in this study provided experimental evidence that AIV has the potential to promote melanocyte differentiation from MSCs and melanin production. In some studies, it has been demonstrated that AIV can take effects in neural stem cell (NSCs) differentiation. Hu et al. (2016) investigated the effect of AIV on the proliferation and differentiation of the engrafted neural stem cells in Alzheimer’s disease (AD) rat models. Their results indicated that AIV treatment resulted in improvements in learning and memory of AD models by promoting NSC proliferation and differentiation partly through the Notch signal pathway. These indicate that AIV plays a significant role in stem cell differentiation. Based on the results of our study, we speculate that AIV could improve Mc differentiation from mesenchymal stem cells in vitro as well.
We verified that supplementation of hydrocortisone, insulin, interferrin, and FGF-containing differentiation medium with 0.4 mg/L AIV improves Mcs differentiation by shortening the induction period from 180 to 90 days. Mcs differentiation was verified by morphology, immunocytochemistry, and immunofluorescence analyses, as well as by qPCR assay of melanocytic marker proteins (including TRP-1, TRP-2, and MART-1). Mitf expression was not induced by AIV, indicating that AIV is relatively safe. These results provide experimental and theoretic evidence for AIV application in clinical vitiligo repigmentation treatment.
Availability of Data and Materials: All data generated or analyzed during this study are included in this published article or are available from the corresponding author on reasonable request.
Author Contribution: The authors confirm contribution to the paper as follows: study conception and design: Xingyu Mei and Weimin Shi; data collection: Xingyu Mei, Zhouwei Wu, Chengzhong Zhang and Yue Sun; analysis and interpretation of results: Xingyu Mei and Yue Sun; draft manuscript preparation: Xingyu Mei and Weimin Shi. All authors reviewed the results and approved the final version of the manuscript.
Ethics Approval: All animal experiments were performed in accordance with the Care and Use of Laboratory Animals. All the study protocols were authorized by the Shanghai General Hospital Medical Ethics Committee (Approval code. 2017KY004; Approval date: January, 28th, 2017).
Funding Statement: This work was supported by the National Natural Science Foundation of China (Grant No. 81703140).
Conflicts of Interest: The authors state that they have no conflict of interests to be declared.
Abdallah BM, Ali EM (2020). Butein promotes lineage commitment of bone marrow-derived stem cells into osteoblasts via modulating ERK1/2 signaling pathways. Molecules 25: 1885. DOI 10.3390/molecules25081885. [Google Scholar] [CrossRef]
Bandarchi B, Jabbari CA, Vedadi A, Navab R (2013). Molecular biology of normal melanocytes and melanoma cells. Journal of Clinical Pathology 66: 644–648. DOI 10.1136/jclinpath-2013-201471. [Google Scholar] [CrossRef]
Boniface K, Seneschal J, Picardo M, Taieb A (2018). Vitiligo: focus on clinical aspects, immunopathogenesis, and therapy. Clinical Review of Allergy and Immunology 54: 52–67. DOI 10.1007/s12016-017-8622-7. [Google Scholar] [CrossRef]
Costa IM, Lima FOV, Fernandes LCB, Norrara B, Neta FI, Alves RD, Cavalcanti JRLP, Lucena EES (2019). Astragaloside IV supplementation promotes A neuroprotective effect in experimental models of neurological disorders: a systematic review. Current Neuropharmacology 17: 648–665. DOI 10.2174/1570159X16666180911123341. [Google Scholar] [CrossRef]
Donaparthi N, Chopra A (2016). Comparative study of efficacy of epidermal melanocyte transfer versus hair follicular melanocyte transfer in stable vitiligo. Indian Journal of Dermatology 61: 640–644. DOI 10.4103/0019-5154.193671. [Google Scholar] [CrossRef]
Ezzedine K, Eleftheriadou V, Whitton M, van Geel N (2015). Vitiligo. Lancet 386: 74–84. DOI 10.1016/S0140-6736(14)60763-7. [Google Scholar] [CrossRef]
Halaban R (1994). Signal transduction in normal and malignant melanocytes. Pigment Cell Research 7: 89–95. DOI 10.1111/j.1600-0749.1994.tb00026.x. [Google Scholar] [CrossRef]
Hartman ML, Czyz M (2015). MITF in melanoma: mechanisms behind its expression and activity. Cellular and Molecular Life Sciences 72: 1249–1260. DOI 10.1007/s00018-014-1791-0. [Google Scholar] [CrossRef]
Hershey CL, Fisher DE (2004). Mitf and Tfe3: members of a b-HLH-ZIP transcription factor family essential for osteoclast development and function. Bone 34: 689–696. DOI 10.1016/j.bone.2003.08.014. [Google Scholar] [CrossRef]
Hu HY, Yang RS, Jin GQ, Zhang XL, Xia HY, Xu YW (2016). Effect of astragaloside IV on neural stem cell transplantation in Alzheimer’s disease rat models. Evidence-based Complementary and Alternative Medicne 2016: 1–8. DOI 10.1155/2016/3106980. [Google Scholar] [CrossRef]
Kawaguchi M, Valencia JC, Namiki T, Suzuki T, Hearing VJ (2012). Diacylglycerol kinase regulates tyrosinase expression and function in human melanocytes. Journal of Investigative Dermatology 132: 2791–2799. DOI 10.1038/jid.2012.261. [Google Scholar] [CrossRef]
Kono M, Dunn IS, Durda PJ, Butera D, Rose LB, Haggerty TJ, Benson EM, Kurnick JT (2006). Role of the mitogen-activated protein kinase signaling pathway in the regulation of human melanocytic antigen expression. Molecular Cancer Research 4: 779–792. DOI 10.1158/1541-7786.MCR-06-0077. [Google Scholar] [CrossRef]
Kumar CM, Sathisha UV, Dharmesh S, Rao AG, Singh SA (2011). Interaction of sesamol (3,4-methylenedioxyphenol) with tyrosinase and its effect on melanin synthesis. Biochimie 93: 562–569. DOI 10.1016/j.biochi.2010.11.014. [Google Scholar] [CrossRef]
Levy C, Khaled M, Fisher DE (2006). MITF: master regulator of melanocyte development and melanoma oncogene. Trends in Molecular Medicine 12: 406–414. DOI 10.1016/j.molmed.2006.07.008. [Google Scholar] [CrossRef]
Mei X, Sun Y, Wu Z, Pan W, Zhu J, Shi W (2015). In vitro-induced differentiation of bone marrow mesenchymal stem cells into melanocytes. Cell Biology International 39: 824–833. DOI 10.1002/cbin.10455. [Google Scholar] [CrossRef]
Murisier F, Beermann F (2006). Genetics of pigment cells: lessons from the tyrosinase gene family. Histology and Histopathology 21: 567–578. DOI 10.14670/HH-21.567. [Google Scholar] [CrossRef]
Osinubi O, Grainge MJ, Hong L, Ahmed A, Batchelor JM, Grindlay D, Thompson AR, Ratib S (2018). The prevalence of psychological comorbidity in people with vitiligo: a systematic review and meta-analysis. British Journal of Dermatology 178: 863–878. DOI 10.1111/bjd.16049. [Google Scholar] [CrossRef]
Passeron T (2017). Medical and maintenance treatments for vitiligo. Dermatologic Clinics 35: 163–170. DOI 10.1016/j.det.2016.11.007. [Google Scholar] [CrossRef]
Razmi TM, Afra TP, Parsad D (2018). Vitiligo surgery: a journey from tissues via cells to the stems. Experimental Dermatology 28: 690–694. DOI 10.1111/exd.13807. [Google Scholar] [CrossRef]
Suleiman AY, Pity IS, Mohammed MR, Hassawi BA (2019). Histopathological patterns of ovarian lesions: a study of 161 cases. BIOCELL 43: 175–181. DOI 10.32604/biocell.2019.06884. [Google Scholar] [CrossRef]
Whitton M, Pinart M, Batchelor JM, Leonardi-Bee J, Gonzalez U, Jiyad Z, Eleftheriadou V, Ezzedine K (2016). Evidence-based management of vitiligo: summary of a Cochrane systematic review. British Journal of Dermatology 174: 962–969. DOI 10.1111/bjd.14356. [Google Scholar] [CrossRef]
Zhang C, Zhou L, Huang J, Shi W (2017). A combination of Yiqiqubai granule and 308-nm excimer laser in treatment of segmental vitiligo: a prospective study of 233 patients. Journal of Dermatological Treatment 28: 668–671. DOI 10.1080/09546634.2017.1303570. [Google Scholar] [CrossRef]
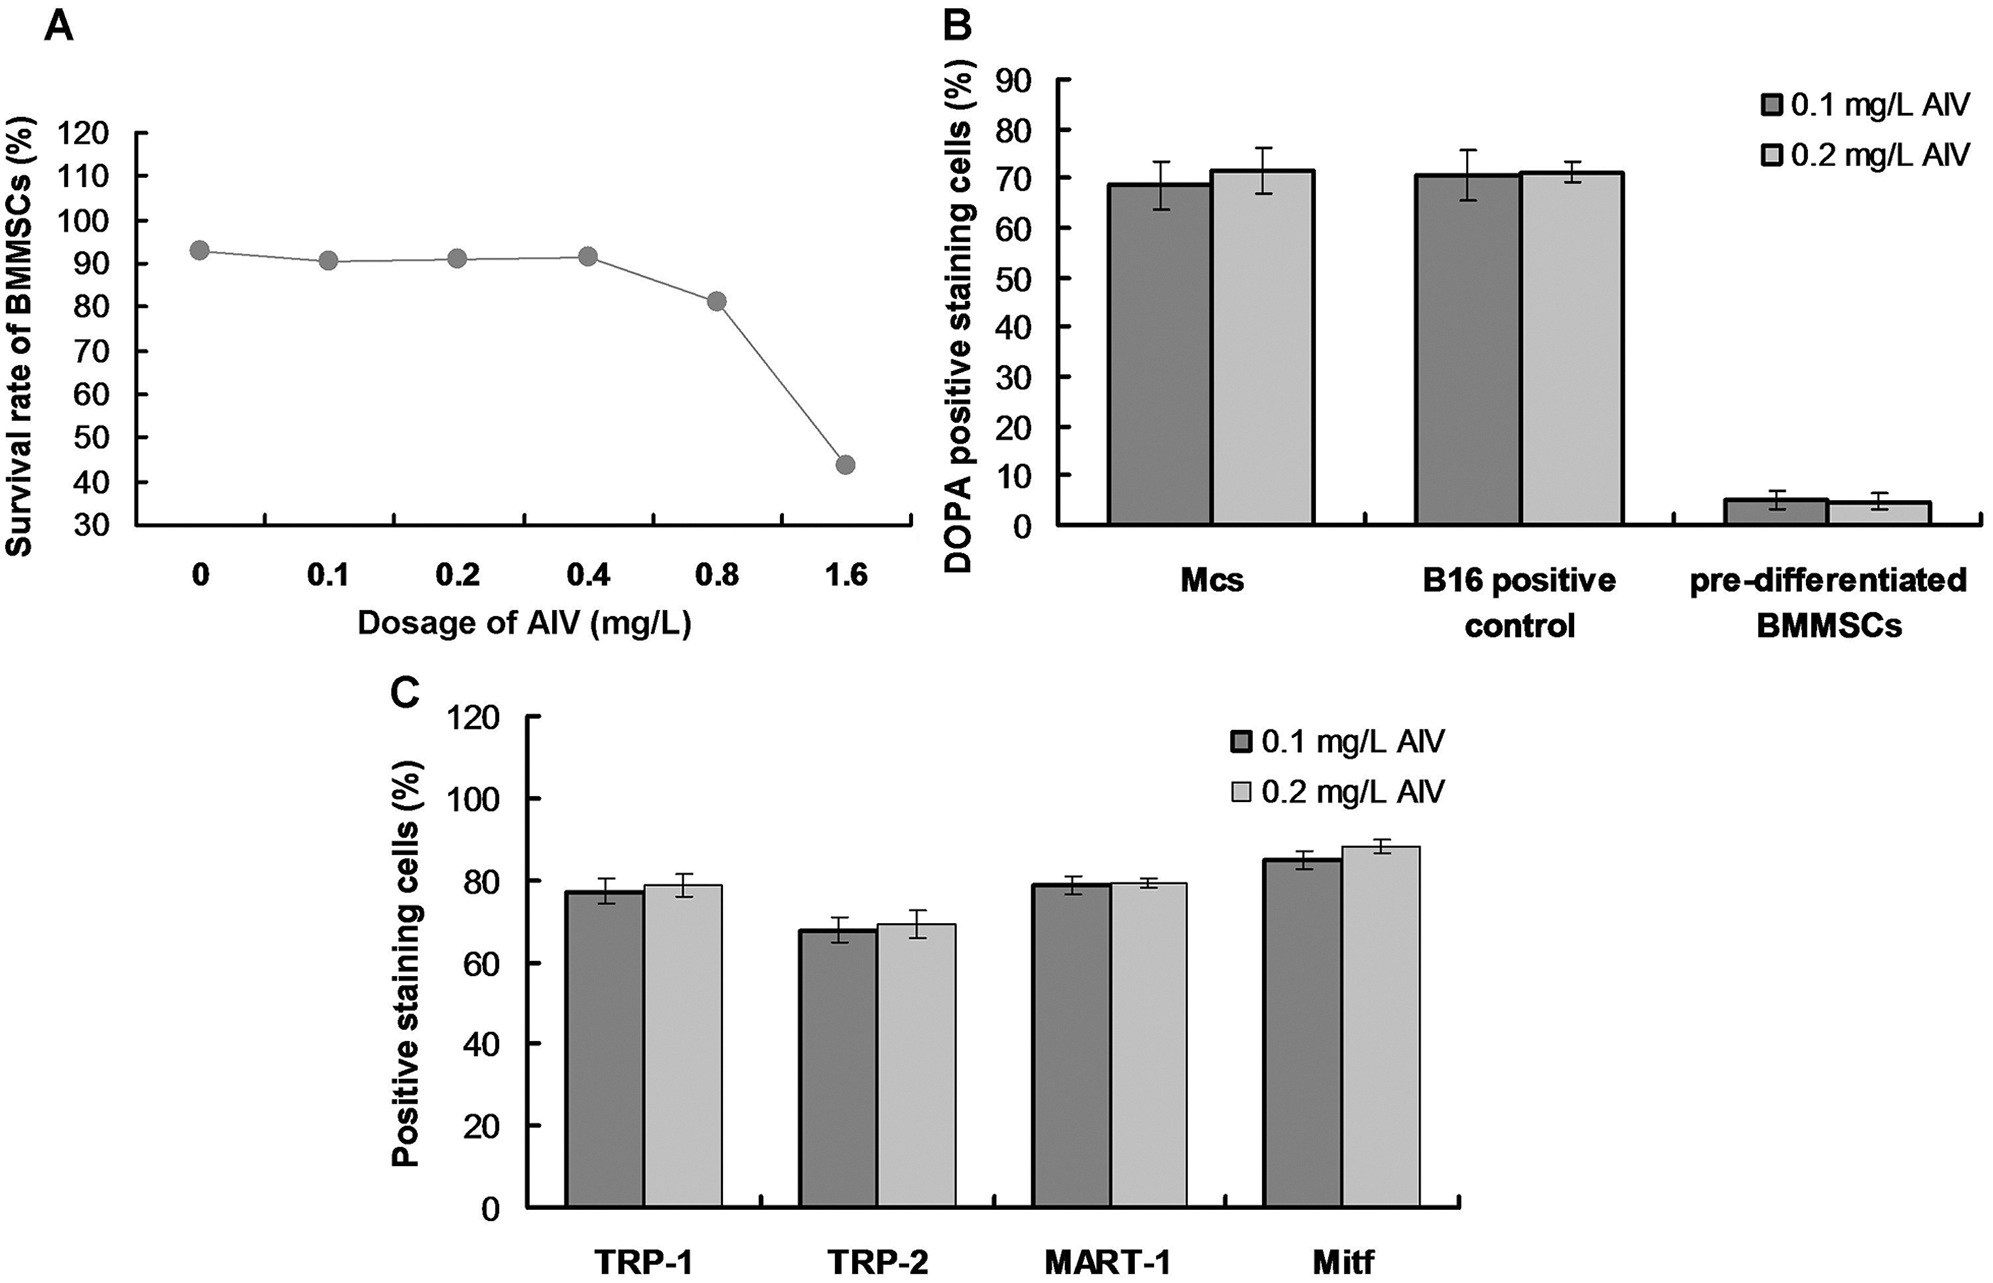
SUPPLEMENTARY FIGURE S1: Evaluation for effects of AIV treatment on survival rates of BMMSCs (A), DOPA positive staining (B), and TRP-1/TRP-2/MART-1/Mitf positive staining (C).
 | This work is licensed under a Creative Commons Attribution 4.0 International License, which permits unrestricted use, distribution, and reproduction in any medium, provided the original work is properly cited. |