DOI:10.32604/biocell.2022.016612
| BIOCELL DOI:10.32604/biocell.2022.016612 | |
| Article |
In Silico analysis and linking of metabolism-related genes with the immune landscape in head and neck squamous cell carcinoma
1Hospital of Stomatology, Sun Yat-sen University, Guangzhou, 510000, China
2Guangdong Provincial Key Laboratory of Stomatology, Guangzhou, 510000, China
3Guanghua School of Stomatology, Sun Yat-sen University, Guangzhou, 510000, China
*Address correspondence to: Juan Xia, xiajuan@mail.sysu.edu.cn; Bin Cheng, chengbin@mail.sysu.edu.cn
#These authors contributed equally to this work
Received: 02 April 2021; Accepted: 29 April 2021
Abstract: Metabolic reprogramming and immunologic suppression are two critical characteristics promoting the progression of head and neck squamous cell carcinoma (HNSCC). The integrative analysis of all the metabolism-related genes (MRGs) in HNSCC is lacking and the interaction between the metabolism and the immune characteristics also requires more exploration to uncover the potential mechanisms. Therefore, this study was designed to establish a prognostic signature based on all the MRGs in HNSCC. Genes of HNSCC samples were available from the TCGA and GEO databases while the MRGs were retrieved from a previous study. Ultimately 4 prognostic MRGs were selected to construct a model possessing robust prognostic value and accuracy in TCGA cohorts. The favorable reproducibility of this model was confirmed in validation cohorts from GEO databases. The risk score calculated by this model was an independent prognostic factor that further classified these HNSCC patients into high-/low-risk groups. GSEA analyses and somatic mutations indicated the low-risk group could activate several anti-tumor pathways and possessed lower TP53 mutation. The results of ESTIMATE, single-sample GSEA, CIBERSORT, and some immune-related molecules analyses suggested the low-risk group exhibited lower metabolic activities and higher immune characteristics. The Spearman correlation test implied most metabolic pathways with tumor-promoting function were negatively correlated with the immune activity, indicating a plausible approach of combining the anti-metabolism and the immunotherapy drugs in the high-risk group to enhance therapeutic effects than applied separately. In conclusion, this prognostic signature linking MRGs with the immune landscape could promote the individualized treatment for HNSCC patients.
Keywords: Metabolism-related signature; Prognosis; Gene classifier; Immune microenvironment
Head and neck squamous cell carcinomas (HNSCC) have a global annual incidence of approximately 600,000 cases, making it the sixth leading cause of cancer-related death (Ferlay et al., 2015). Despite the comprehensive alternatives for diagnosing and treating HNSCC, its prognosis remains far from optimal with a five-year survival rate of less than 50% (Bose et al., 2013). Given that HNSCC is a heterogeneous disease, patients within the same TNM stage might exhibit different molecular features and could benefit from individualized therapies (Leemans et al., 2018; Mroz et al., 2015). Therefore, to improve the clinical outcomes of HNSCC patients, it is of great value to explore more reliable prognostic biomarkers for distinguishing different risk patients from other perspectives serving as a supplement to the conventional TNM cancer staging.
Compelling evidence has suggested that sequencing technology combined with data mining are handy tools for building powerful prognostic models and classifying different subgroups in various cancers (Hu et al., 2020; Zhao and Cui, 2019; Chen et al., 2019). Considering the high energy and molecular demands of cancer cells, metabolic reprogramming plays a vital role in cancer progression and could contain numerous clinical prognostic indicators (Hsieh et al., 2019). Therefore, intensify the understanding of metabolic mechanisms in HNSCC possesses enormous benefits for exploring novel anti-cancer treatments. Some previous studies used glycolysis-related genes or glutaminolysis-related genes to identify prognostic index in HNSCC (Liu and Yin, 2020; Okazaki et al., 2019). However, the integrative analysis of all the metabolism-related genes (MRGs) in HNSCC has not been conducted yet. Consequently, it is worth exploring all the MRGs with prognostic value in HNSCC to identify novel therapeutic targets.
Biswas (2015) suggested that metabolic reprogramming could also impact the immune functions of active immune cells. In light of the crucial role of immune cells in cancer progression, it is important to further study the correlation between the metabolism and the immune characteristics in HNSCC. Therefore, in this study, we constructed a metabolism-related prognostic signature containing 4 MRGs selected from all the MRGs in HNSCC and further classified the patients into the high-/low-risk groups accordingly. We also performed a multi-omics analysis on this gene classifier to explore the difference between the high-/low-risk groups. Finally, we investigated the correlation between the metabolism and the immune characteristics in HNSCC. These findings might advance the personalized diagnosis and treatment in HNSCC.
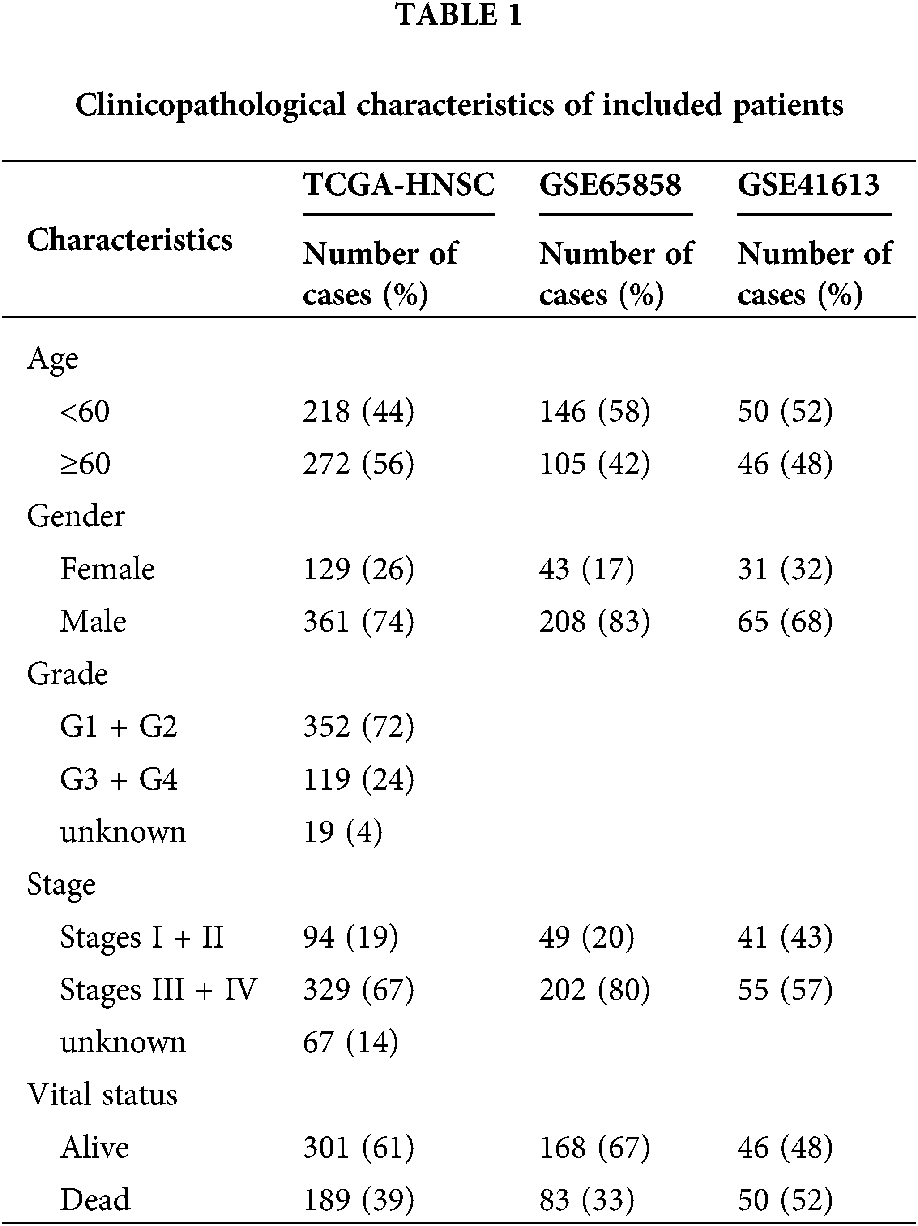
Gene expression data and corresponding patient clinical data for HNSCC were downloaded from The Cancer Genome Atlas (TCGA) database (https://portal.gdc.cancer.gov/). Altogether, 502 tumor tissues and 44 adjacent normal tissues were embodied in the HNSCC cohort. Some patients were excluded for not complying with the inclusion criteria of having and surviving a primary tumor for more than 30 days. Eventually, 490 tumor tissues and 44 adjacent normal tissues were included in this study. An external validation series containing the GSE41613 and GSE65858 data set was downloaded from the Gene Expression Omnibus (GEO) database. The microarray data of GSE41613 were based on the Affymetrix Human Genome U133 Plus 2.0 Array platform and that of GSE65858 stemmed from Illumina HumanHT-12 V4.0 expression beadchip. Tab. 1 exhibited specific baseline information.
Development and validation of the metabolism-related prognostic signature
The MRGs were obtained from the previous study (Possemato et al., 2011). These MRGs were further filtered using genes from the selected TCGA dataset and GEO datasets to pick out those appearing simultaneously in all datasets. Then these selected genes were analyzed by DESeq2 R package with filter criteria of adjusted P < 0.05 and absolute log2-fold change >1.5 to identify the differentially expressed metabolism-related genes (DEMRGs) between HNSCC and normal controls in TCGA datasets.
The correlation between the expression level of DEMRGs and the patient’s overall survival (OS) was evaluated by the univariate Cox analysis with P < 0.01 being considered as statistically significant. Then these prognostic DEMRGs were initially filtered using the least absolute shrinkage and selection operator (LASSO) method. Subsequently, we used bootstrapping (N = 1000) to further select the prognostic DEMRGs with stable results during the 1000 repetitions by the Cox regression analysis. The parameter for the Cox regression analysis was the default parameters in the ‘Survival’ R package. These specific DEMRGs were finally applied to construct a metabolism-related prognostic model based on the Akaike information criterion (AIC) using the stepwise multivariate Cox regression analysis. AIC is a well-recognized means for measuring the goodness of fit of the statistical models. AIC encourages the goodness of data fitting and helps avoid overfitting in the meanwhile. The priority model should be the one with the lowest AIC value. Therefore, we constructed the final model based on AIC to ensure the optimal goodness of fit of the established model.
The optimal cut-off point of the risk score calculated by the above model was determined using the Survminer R package to divide the patients into the high-/low-risk groups. The survival rates of patients in the high-/low-risk groups were measured utilizing the Kaplan–Meier survival curve. The time-dependent receiver operating characteristic (ROC) curves were drawn to assess the sensitivity and specificity of the model. Dataset GSE41613 with 96 oral squamous cell carcinoma patients and GSE65858 with 251 HNSCC patients were selected as the validation cohort. The same procedures were operated in these two external datasets to investigate whether the established model could effectively predict survival in HNSCC.
The metabolism-related signature as an independent prognostic factor
Univariate and multivariate Cox proportional hazards models were applied to estimate the hazard ratios (HRs) and 95% confidence intervals (CIs) for the risk of HNSCC mortality. A stratified multivariate Cox regression analysis based on the risk status was also performed. Besides, given that the human papillomavirus (HPV) status could influence the gene expression, mutational profile, metabolic regulation, and immune modulation of HNSCC, we further compared the HPV status in the high-/low-risk groups to evade the bias resulting from this potential confounding factor.
Somatic mutations and GSEA analysis
In light of gene mutation could drive tumor metabolic reprogramming, we compared the somatic mutations between different groups stratified by this metabolism-related model to uncover potential mechanisms leading to distinct prognosis. The somatic mutations data of HNSCC patients were downloaded via the TCGAbiolinks and the data was visualized by the “maftools” R package. In addition, we also explored the activated signaling pathways between high-/low-risk groups. To be specific, we applied the DEseq2 R package to obtain an ordered list of genes and conducted the subsequent Gene Set Enrichment Analysis (GSEA) by the ClusterProfiler R package with adjusted P < 0.05.
Estimation of metabolism and immune characteristics as well as their correlation
Scores of 26 metabolic pathways were retrieved from https://choih.shinyapps.io/metabolicsignatures (Choi and Na, 2018). Immune scores and stromal scores were calculated by applying the ESTIMATE algorithm which can report the enrichment of immune and stromal cell gene signatures (Yoshihara et al., 2013). Moreover, the single-sample gene-set enrichment analysis (ssGSEA) algorithm was adopted to quantify the relative abundance of each cell infiltration in the HNSCC tumor microenvironment (TME). The gene set for marking each TME infiltration immune cell type was obtained from the study of Charoentong et al. (2017) which demonstrated diverse human immune cell subtypes such as CD8 T cell, activated dendritic cell, macrophage, natural killer (NK) T cell, regulatory T cell, and so on. Subsequently, the CIBERSORT analysis was performed to estimate the fraction of the immune cell infiltration. Additionally, the explorations of some immune-related molecules including immune checkpoint genes, cytotoxic effectors, and an “interferon-gamma (IFNG) signature” were conducted in the high-/low-risk groups. Finally, the association between metabolic pathways and immune cell infiltrations was assessed by the spearman correlation test.
There were 2113 common MRGs in these selected datasets (Fig. 1A). Further analysis in the HNSCC TCGA dataset revealed 991 DEMRGs with 383 up-regulated and 608 down-regulated. Fig. 1B visualized the distribution of these DEMRGs between HNSCC and normal controls. Fig. 1C was the expression heatmap of these DEMRGs, in which significantly up-regulated genes and down-regulated genes were each represented by red and blue.
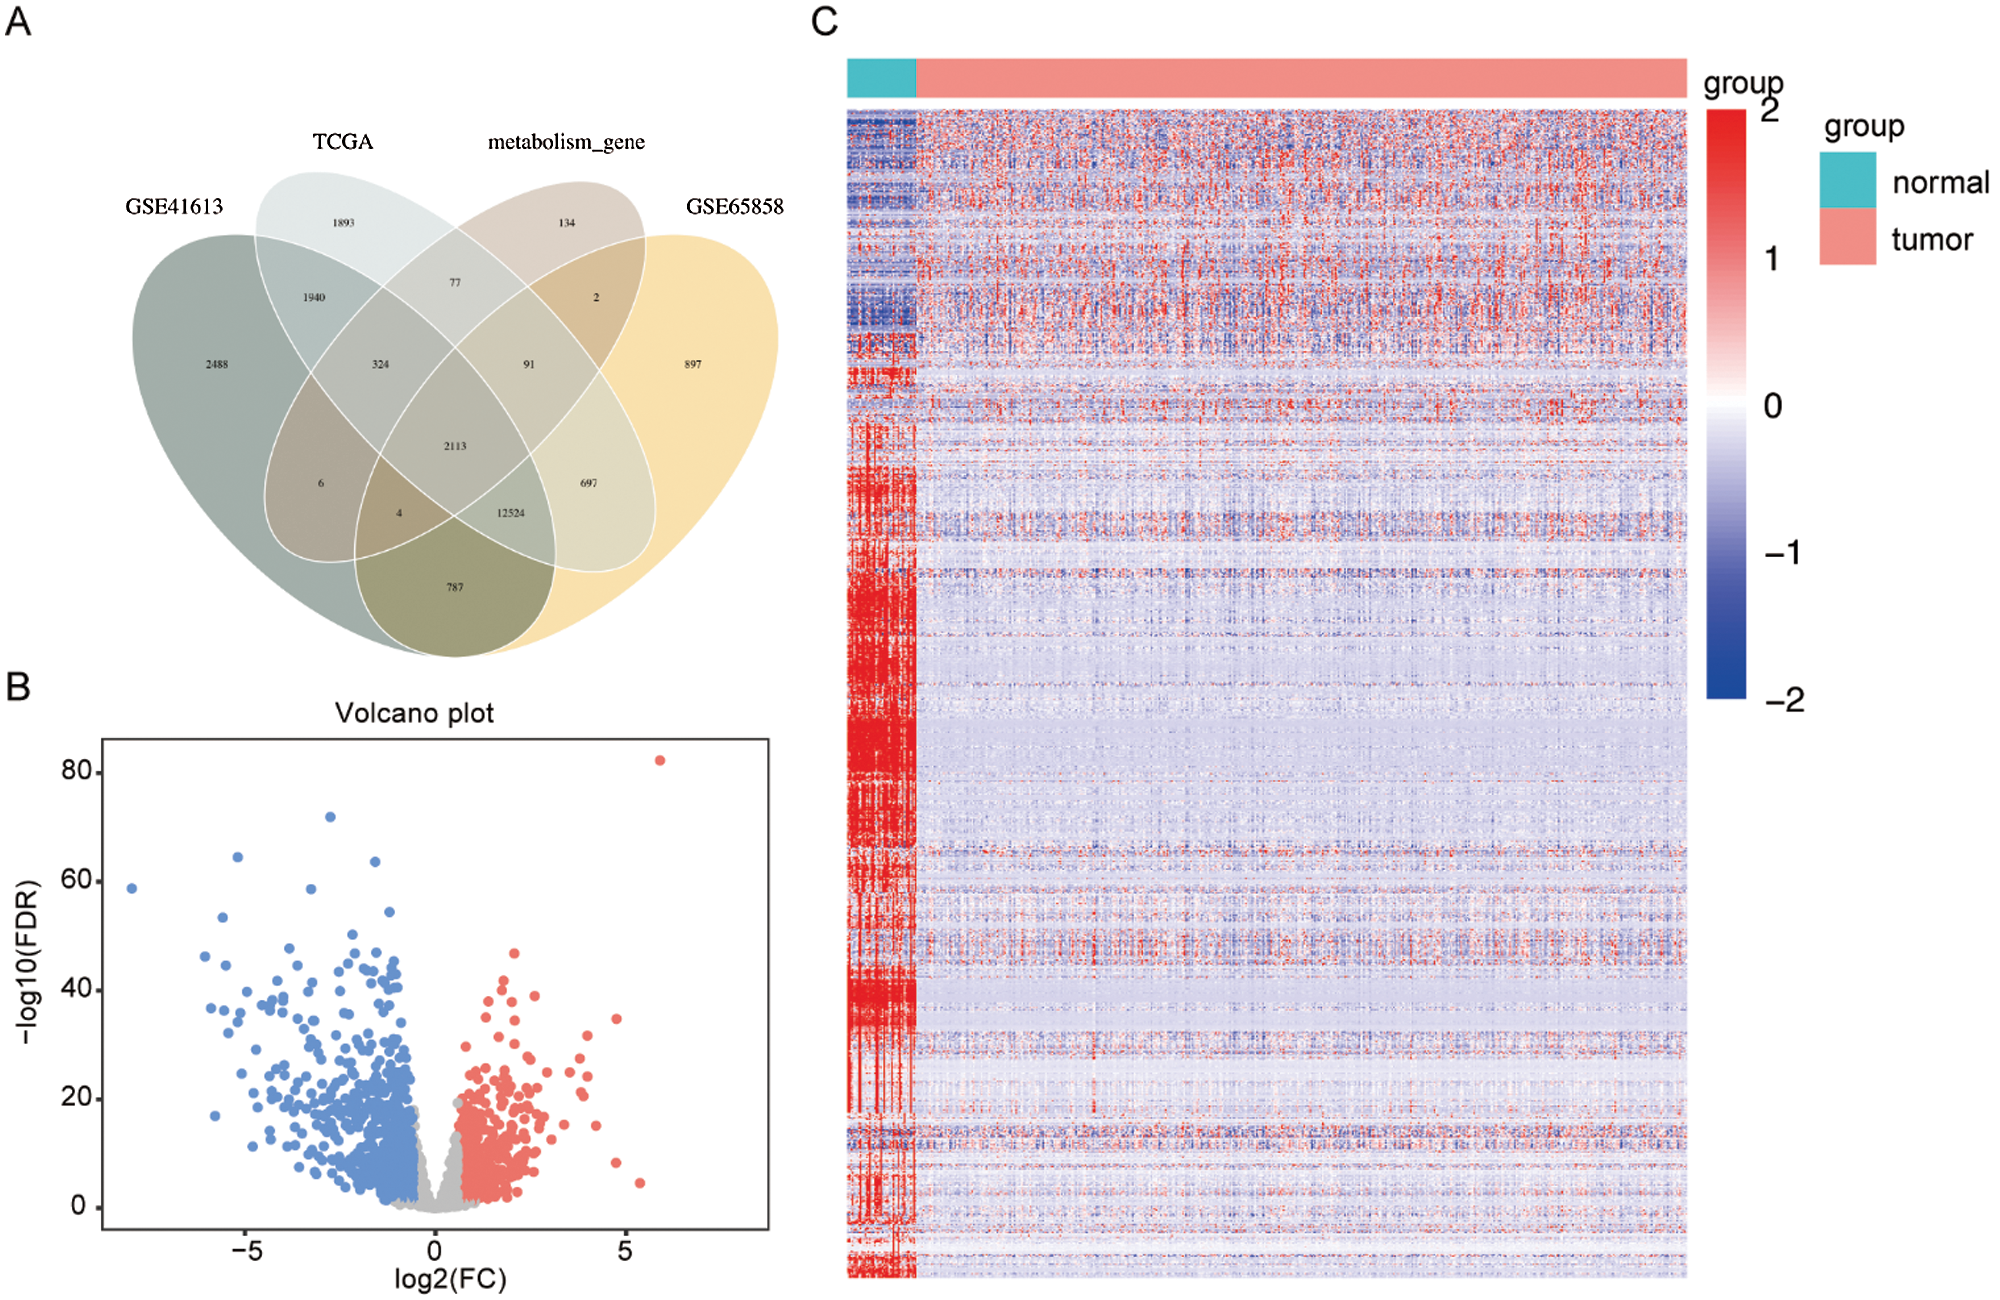
Figure 1: Selection of differentially expressed metabolism-related genes (DEMRGs) between head and neck squamous cell carcinoma (HNSCC) patients and adjacent non-tumor tissues.
Construction and validation of a metabolism-related signature
A total of 55 possible prognostic DEMRGs were preliminarily identified by univariate Cox analysis while 11 of them remained after being filtered by LASSO (Fig. 2A). Ultimately, 4 DEMRGs (GRIA3, PYGL, HPRT1, and SLC23A1) were selected after bootstrapping and they were applied to the final prediction model by stepwise multivariate Cox regression analysis. The imputed risk score from the metabolism-related signature was calculated using the following formula: (−0.38167 × expression level of GRIA3) + (0.31221 × expression level of PYGL) + (0.42102 × expression level of HPRT1) + (−0.50125 × expression level of SLC23A1). Patients were classified into the high-/low-risk groups according to the optimal cut-off of their risk scores (Fig. 2B). To be specific, patients with high risk tended to die earlier than those with low risk (Fig. 2C). Fig. 2D presented the survival heatmap, demonstrating GRIA3 and SLC23A1 to be the protective MRGs that were highly expressed in the low-risk group. On the contrary, PYGL and HPRT1 were highly expressed in the high-risk group, standing for the risk-associated MRGs. Kaplan–Meier curves for the high-/low-risk groups were exhibited in Fig. 2E, implying that the high-risk group had a poorer prognosis than the low-risk group. The area under the curve (AUC) of the 3-year ROC curve was 0.702, suggesting good predictive performance for the 3-year OS (Fig. 2F).
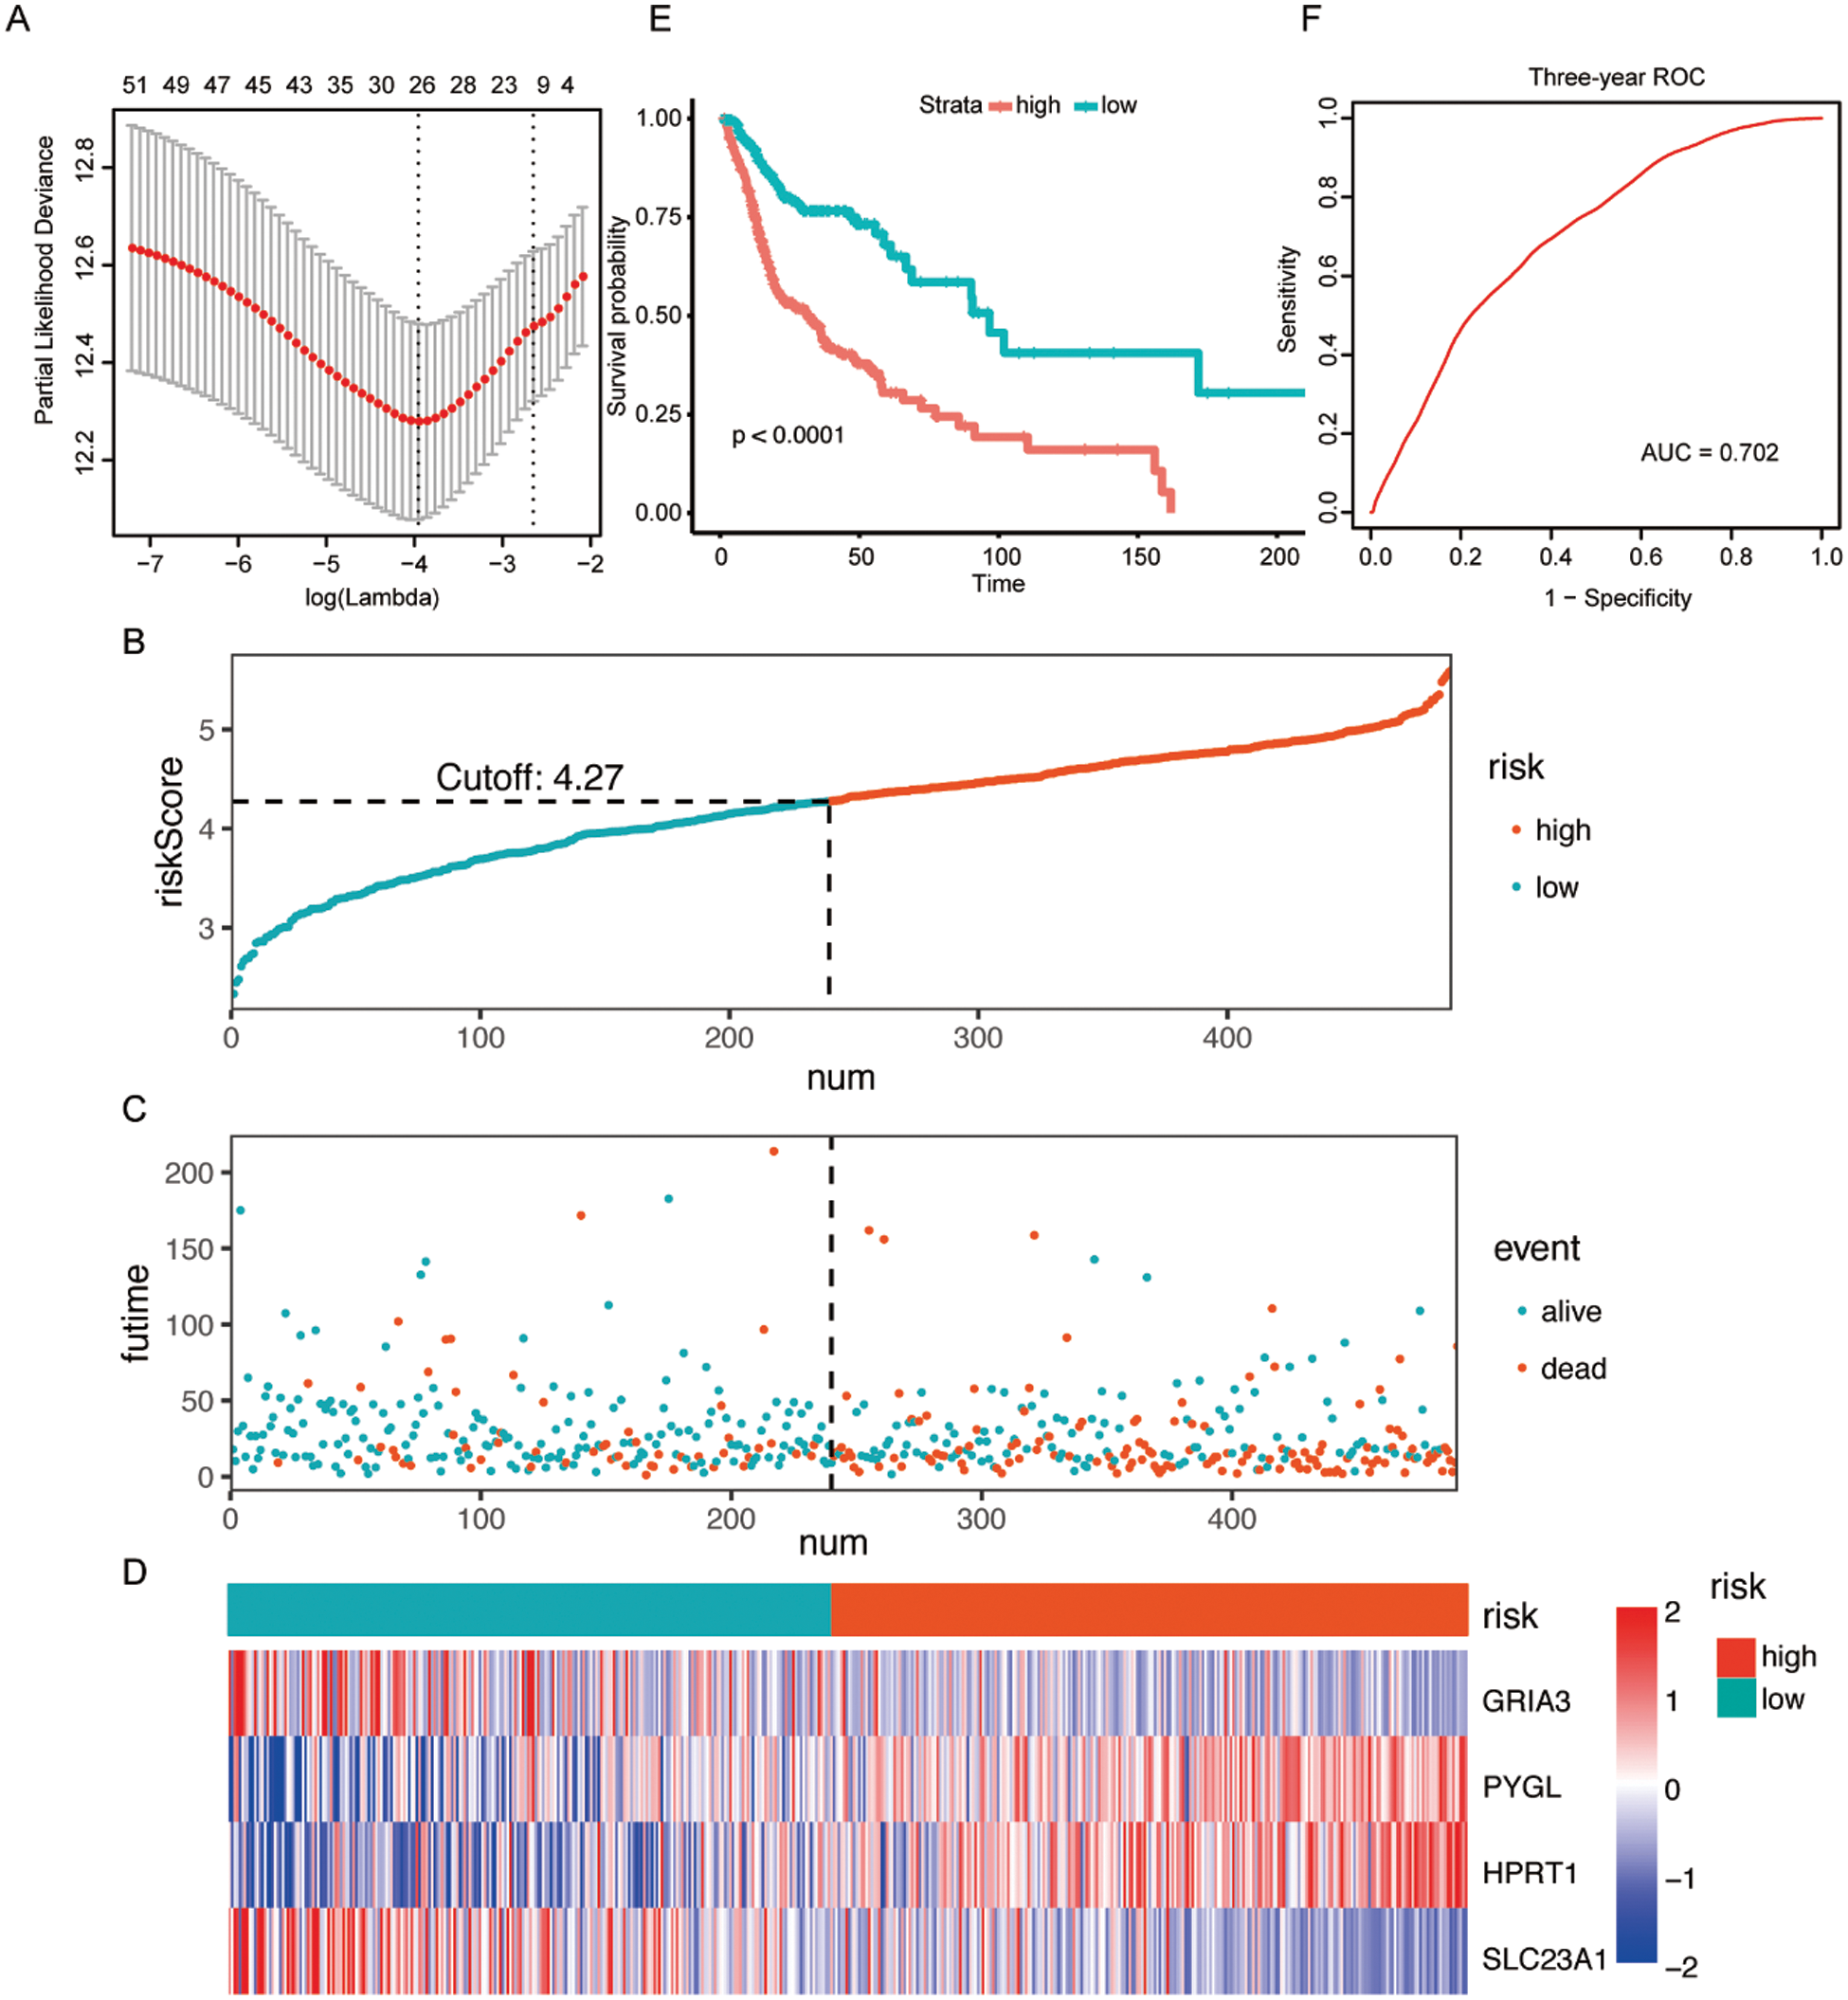
Figure 2: Construction of a metabolism-related signature in the TCGA dataset.
Similar analyses were conducted in other independent HNSCC series obtained from GEO (GSE41613 and GSE65858) to further validate the predictive value of this metabolism-related signature and confirm its reproducibility. The risk scores for 96 patients in the GSE41613 dataset and 251 patients in the GSE65858 dataset were imputed using the same formula as above. Consistently, patients with higher risk showed poorer prognosis in both the GSE41613 dataset (Fig. 3A) and the GSE65858 dataset (Fig. 3B). What’s more, the sensitivity and specificity evaluation of our metabolism-related signature for the 3-year OS in GSE41613 and GSE65858 was 0.642 and 0.573, respectively (Figs. 3C and 3D). These validation results of GEO datasets led to an identical conclusion with the initial analysis of the TCGA dataset, suggesting favorable reproducibility of this metabolism-related signature in HNSCC.
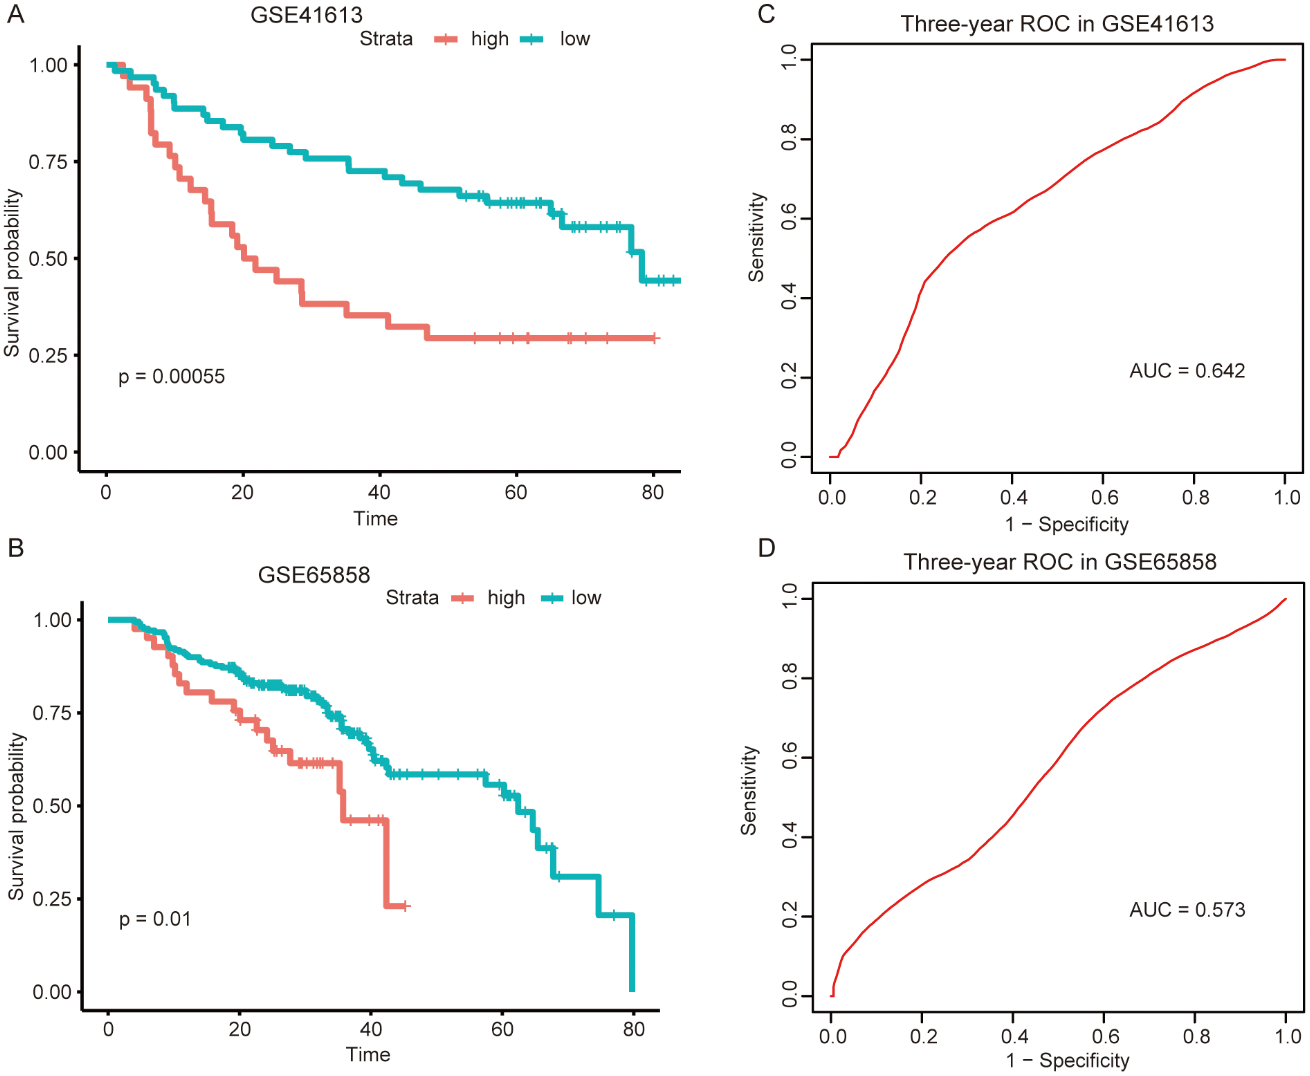
Figure 3: External validation of the metabolism-related signature in the two independent GEO datasets.
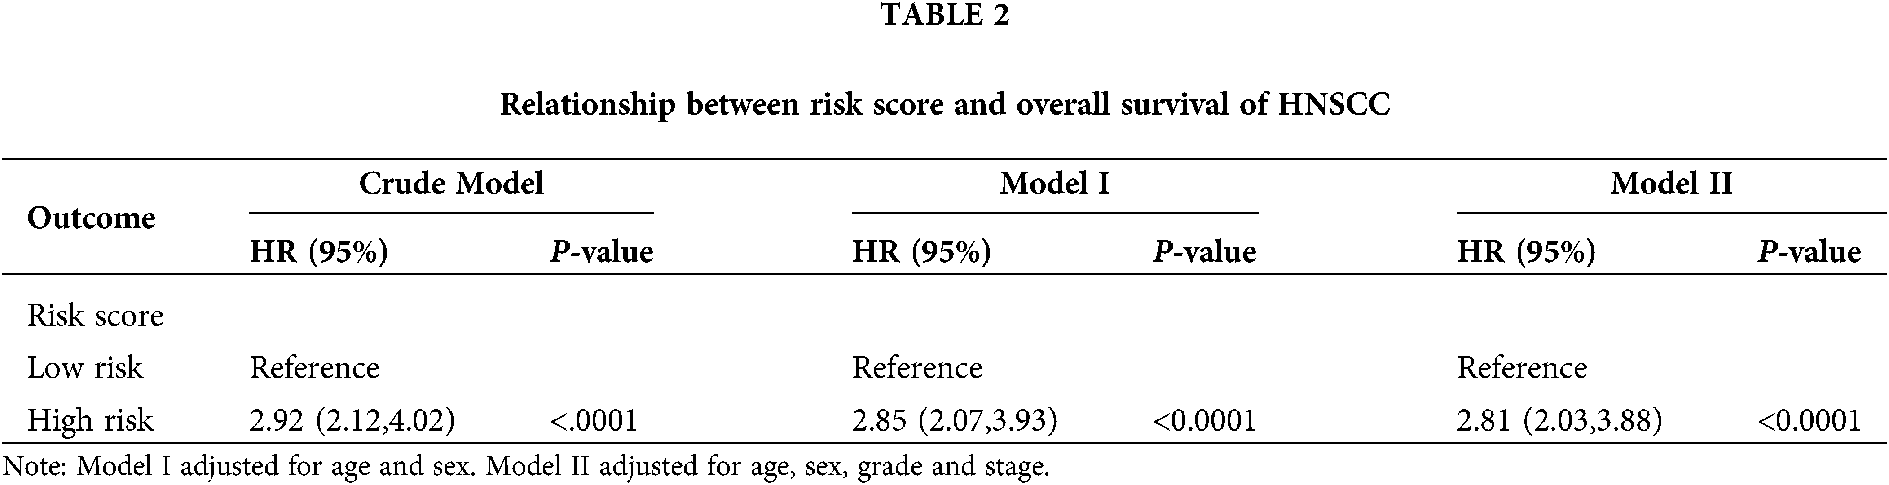
The risk score of the metabolism-related signature was independently associated with HNSCC mortality
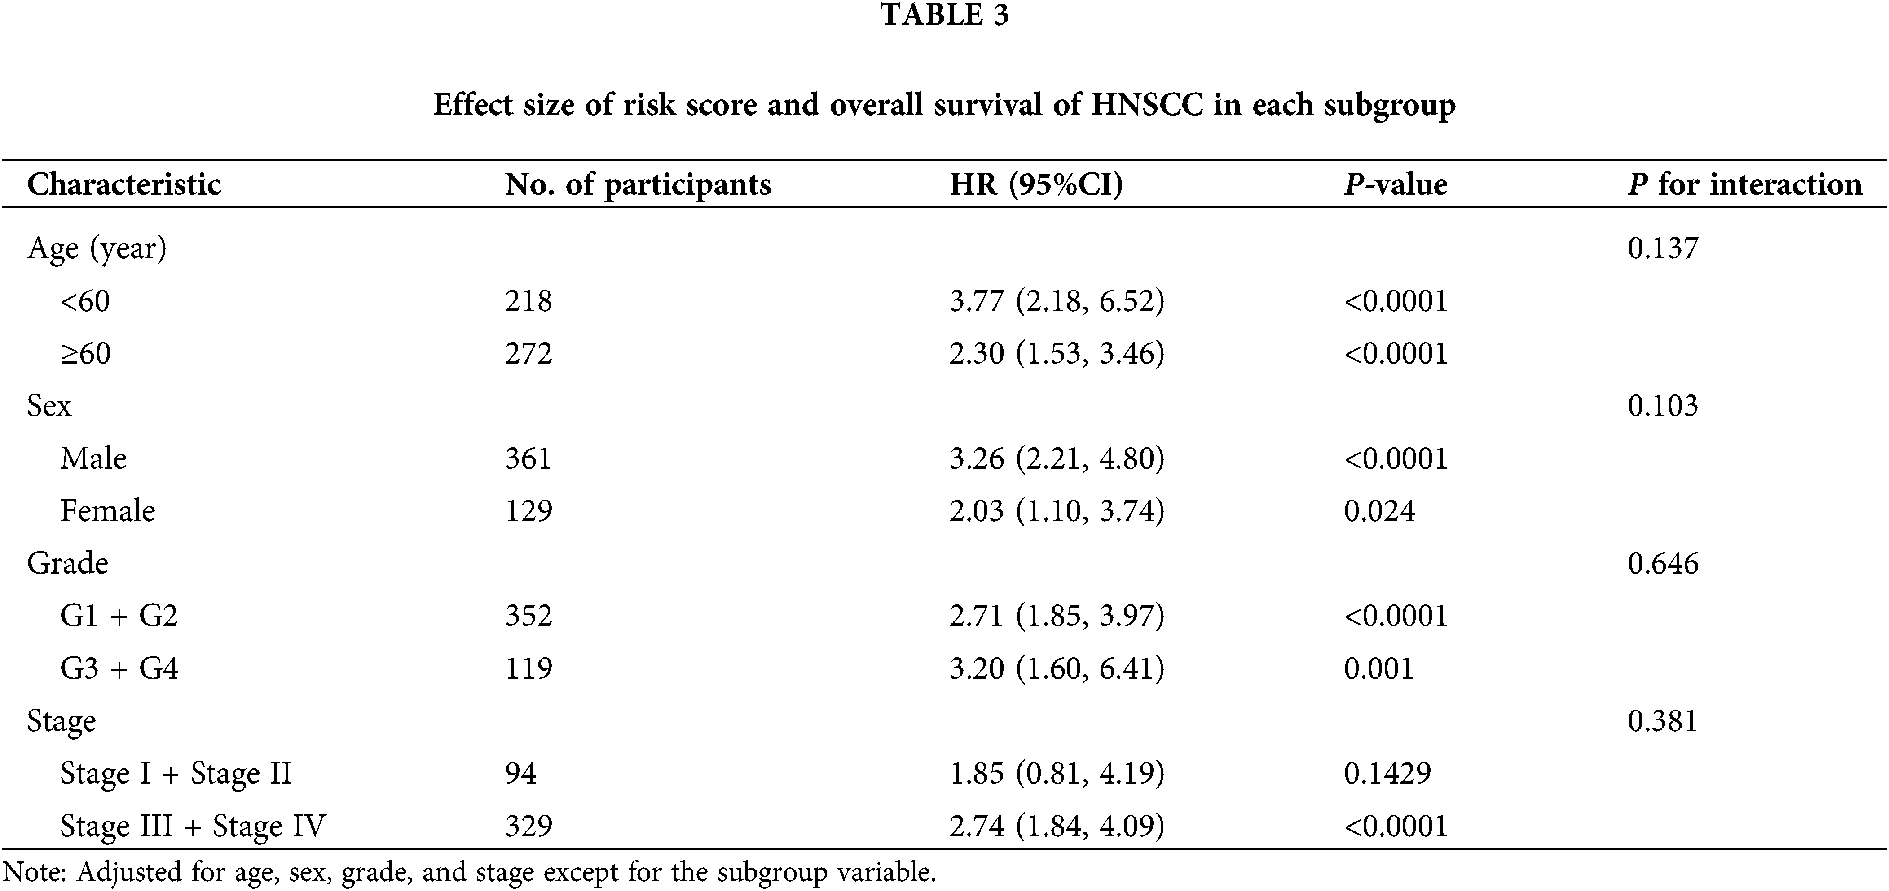
As seen in Tab. 2, Cox proportional hazards models adjusted for different variables indicated that patients with high risk had significantly higher mortality (2.85 [2.07, 3.93], P < 0.0001 in Model I; 2.81 [2.03, 3.88], P < 0.0001 in Model II) in comparison with those in the low-risk group. A stratified multivariate Cox analysis was carried out to further verify the robust relevance between the risk score of the metabolism-related signature and the mortality of these HNSCC patients. The results in Tab. 3 showed that the high-risk score was associated with high mortality of HNSCC in each subgroup (of age, sex, grade, and stage) except for the subgroup of Stages I + II. No interactions between risk score and other factors were found. Besides, there was no significant difference in the relative distribution of HPV (+) and HPV (−) between the high-/low-risk groups (Suppl. Fig. S1). In other words, HPV (+) tumors did not show enrichment in either population.
The high-/low-risk groups with distinct somatic mutations and signaling pathways
Somatic mutations were analyzed using TCGA database. The TP53 mutation was significantly enriched in the high-risk group. Mutations in CDKN2A, PLEC, CASP8, FAM135B, AHNAK, NSD1, PKDH1L1, S1, and FAT3 also exhibited different statuses in different risk groups (Fig. 4).
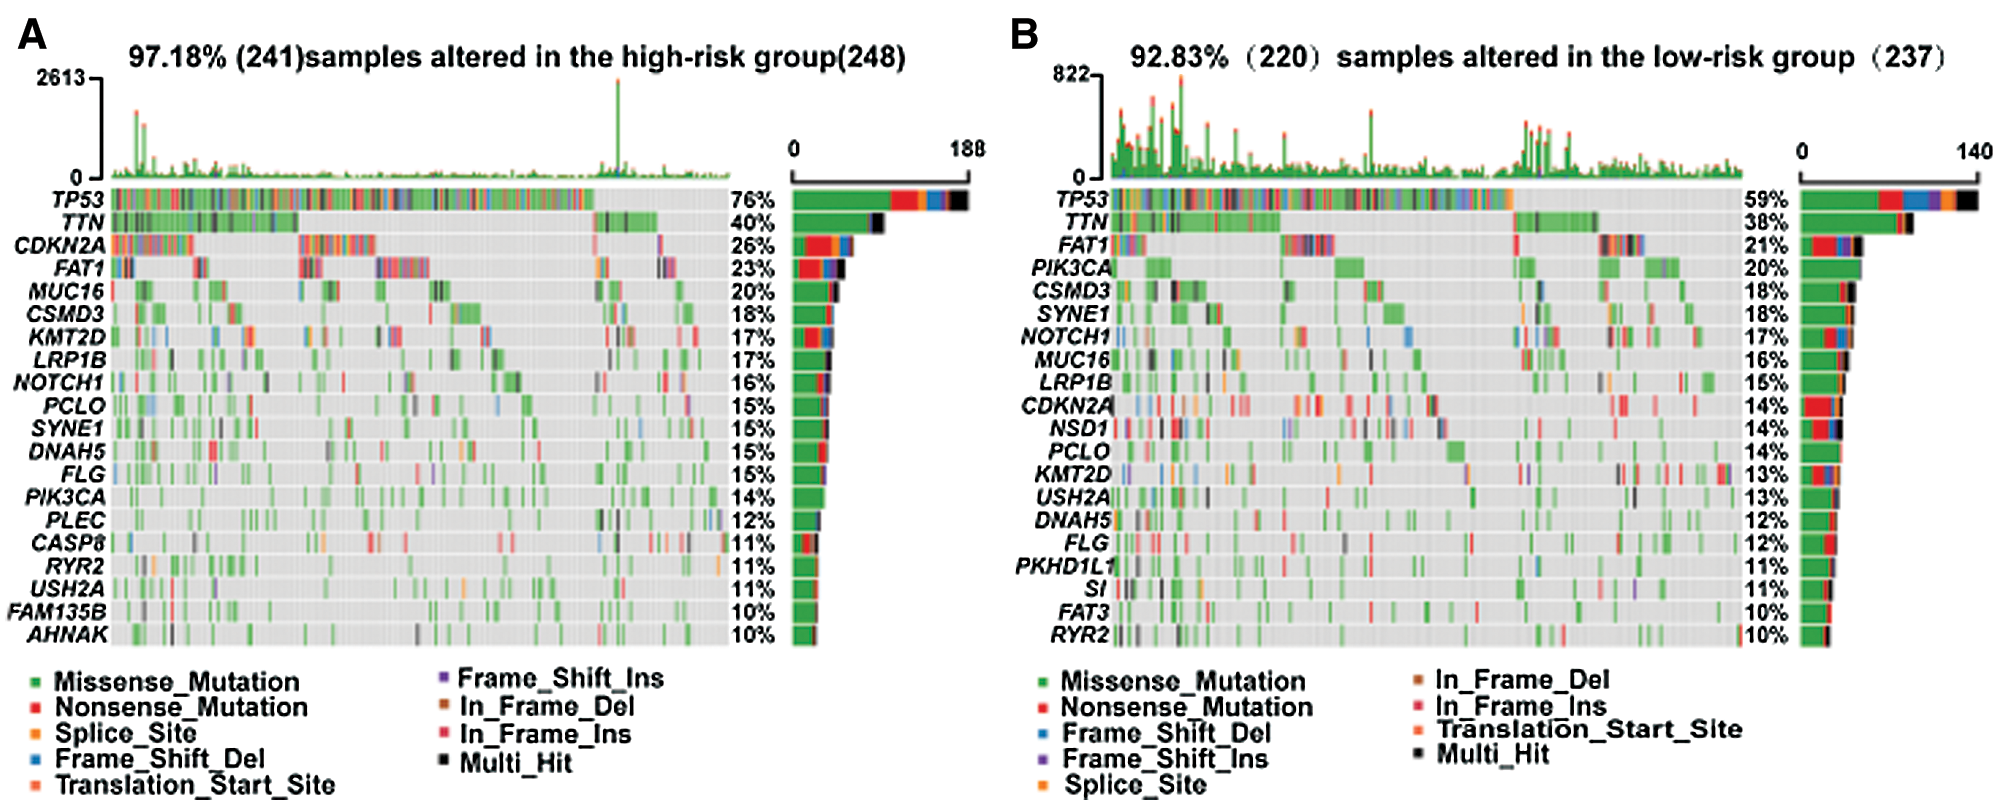
Figure 4: Different somatic mutations in the high-/low-risk groups.
GSEA analysis discovered five significant KEGG pathways and two hallmark pathways activated in the low-risk group, including linoleic acid metabolism, drug metabolism cytochrome P450, cell adhesion molecules (CAMs), primary immunodeficiency, neuroactive ligand-receptor interaction, allograft rejection, and KRAS signaling DN (Fig. 5). Consequently, it is reasonable to assume that the activation of these pathways could elucidate the underlying mechanisms of the better prognosis in the low-risk group from diverse aspects including metabolism.
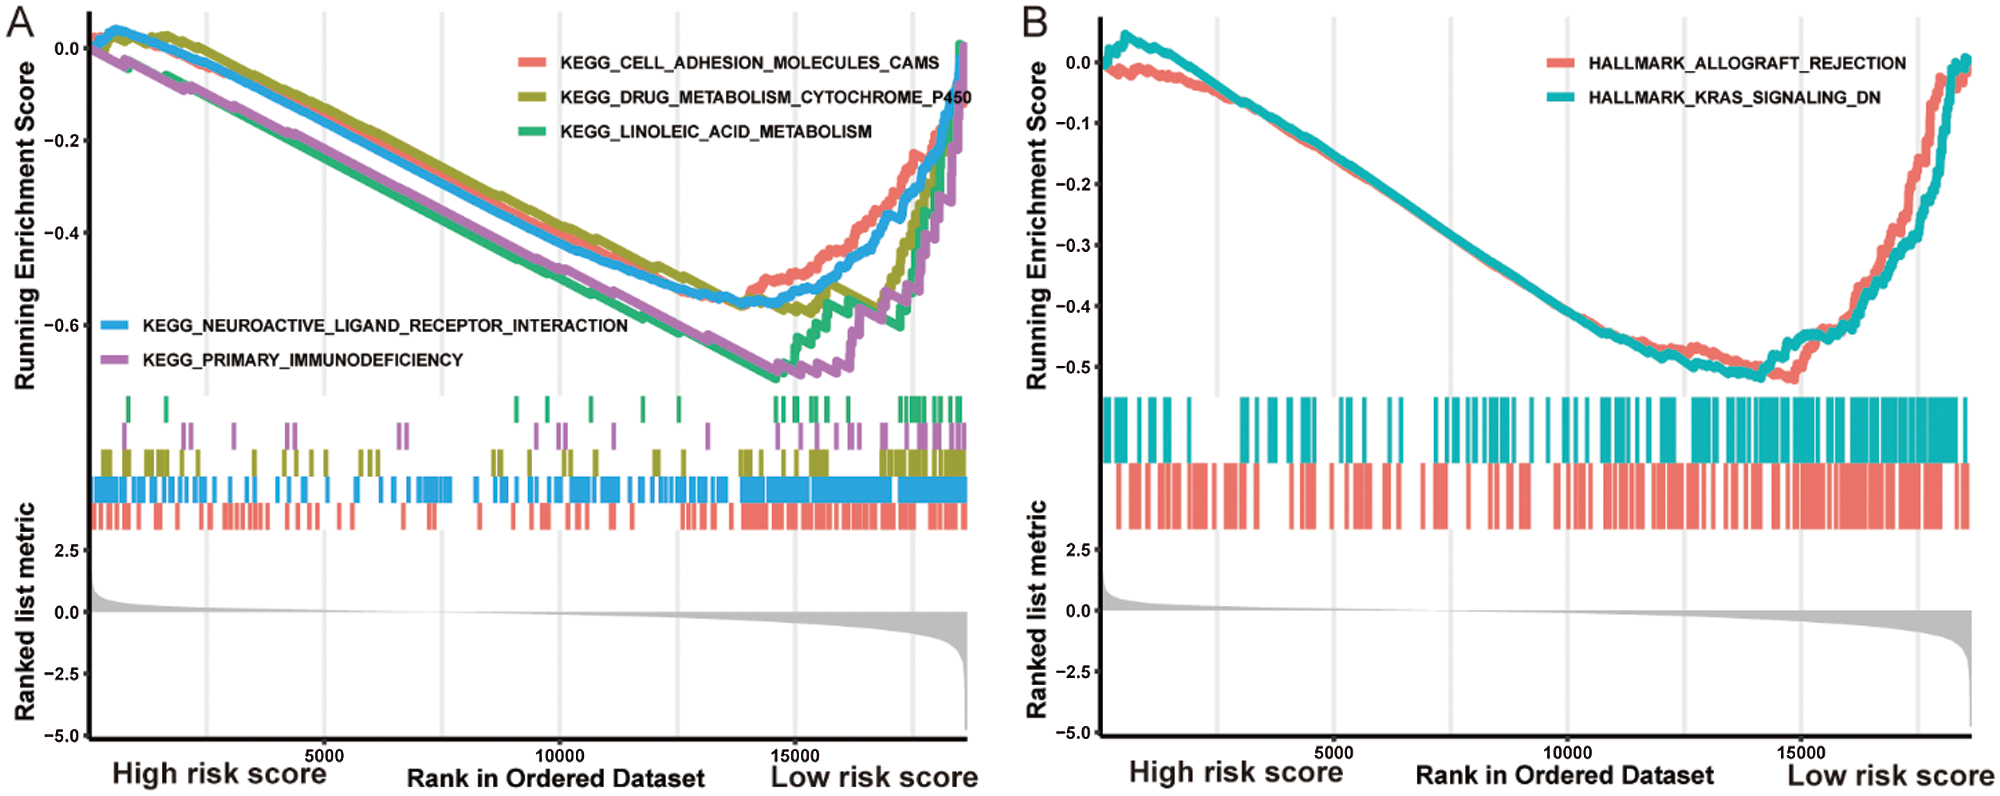
Figure 5: Gene Set Enrichment Analysis indicated distinct signaling pathways in the high-/low-risk groups.
The high-/low-risk groups with distinct metabolic characteristics
Given that the prognostic model was constructed based on metabolism-relevant genes, a feasible next step in delineating the underlying mechanisms is to explore the metabolic characteristics corresponding to different risk scores. As a result, scores of 26 metabolic pathways were acquired from the previous study while the subsequent analysis revealed a significant correlation between high risk and high metabolic characteristics. Glycolysis, glycogenolysis, glucose metabolism, gluconeogenesis, pyruvate metabolism, carbohydrate metabolism, steroid synthesis, amino acid (AA) metabolism, protein metabolism, purine metabolism, pyrimidine metabolism, ribonucleotide synthesis, mRNA metabolism, RNA metabolism, and nitric oxide metabolism were all higher in the high-risk group (Fig. 6). Similar results were obtained in the GSE41613 dataset (Suppl. Fig. S2A) and the GSE65858 dataset (Suppl. Fig. S3A).
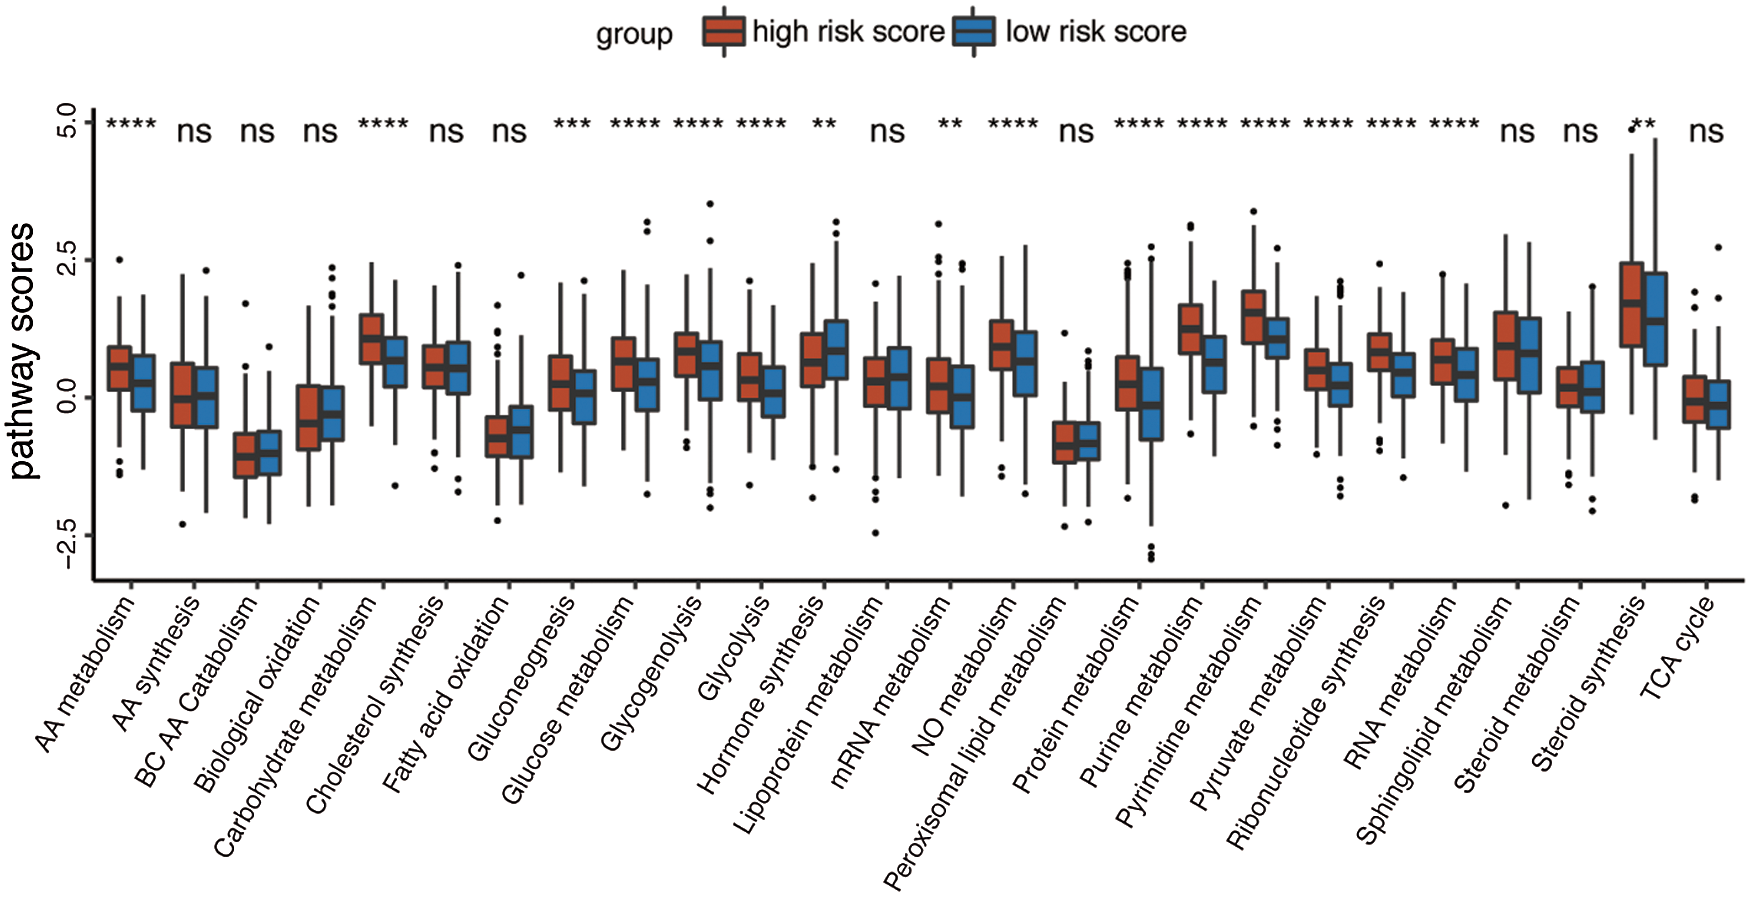
Figure 6: Boxplot of 26 metabolic pathways scores in the high-/low-risk groups (ns, non-significant, *P < 0.05, **P < 0.01, ***P < 0.0001, ****P < 0.0001).
The high-/low-risk groups with distinct immune characteristics
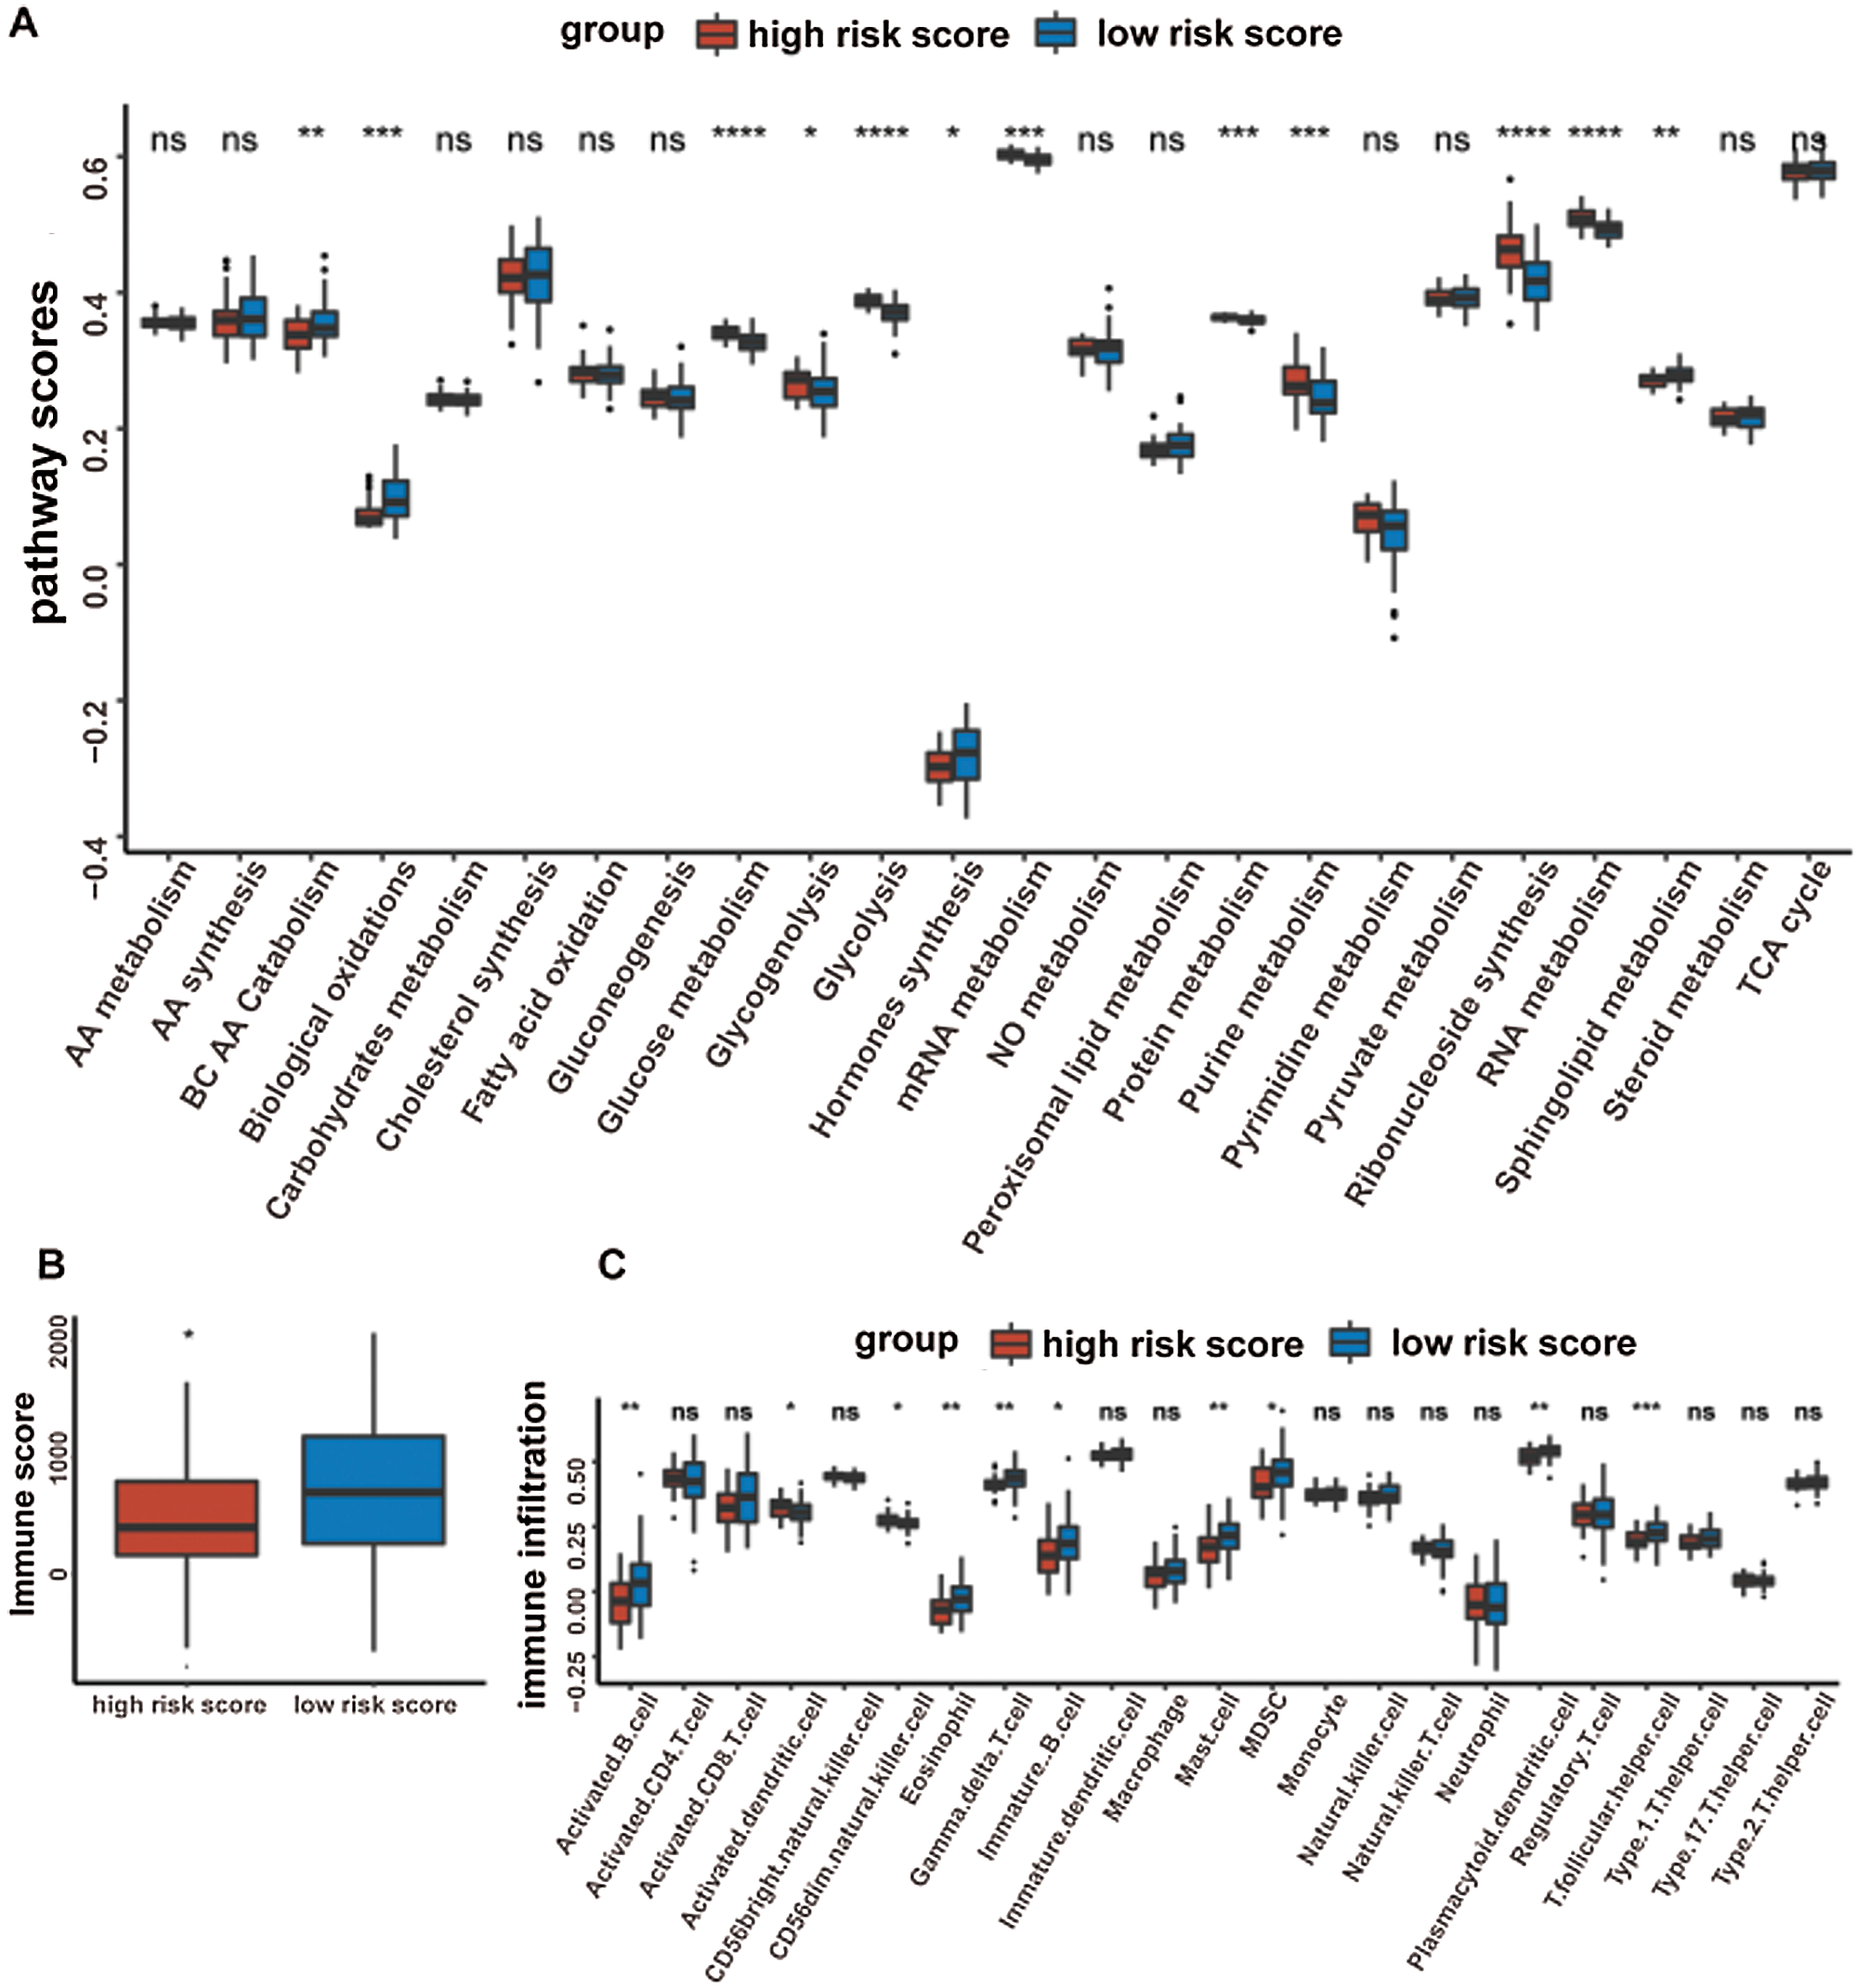
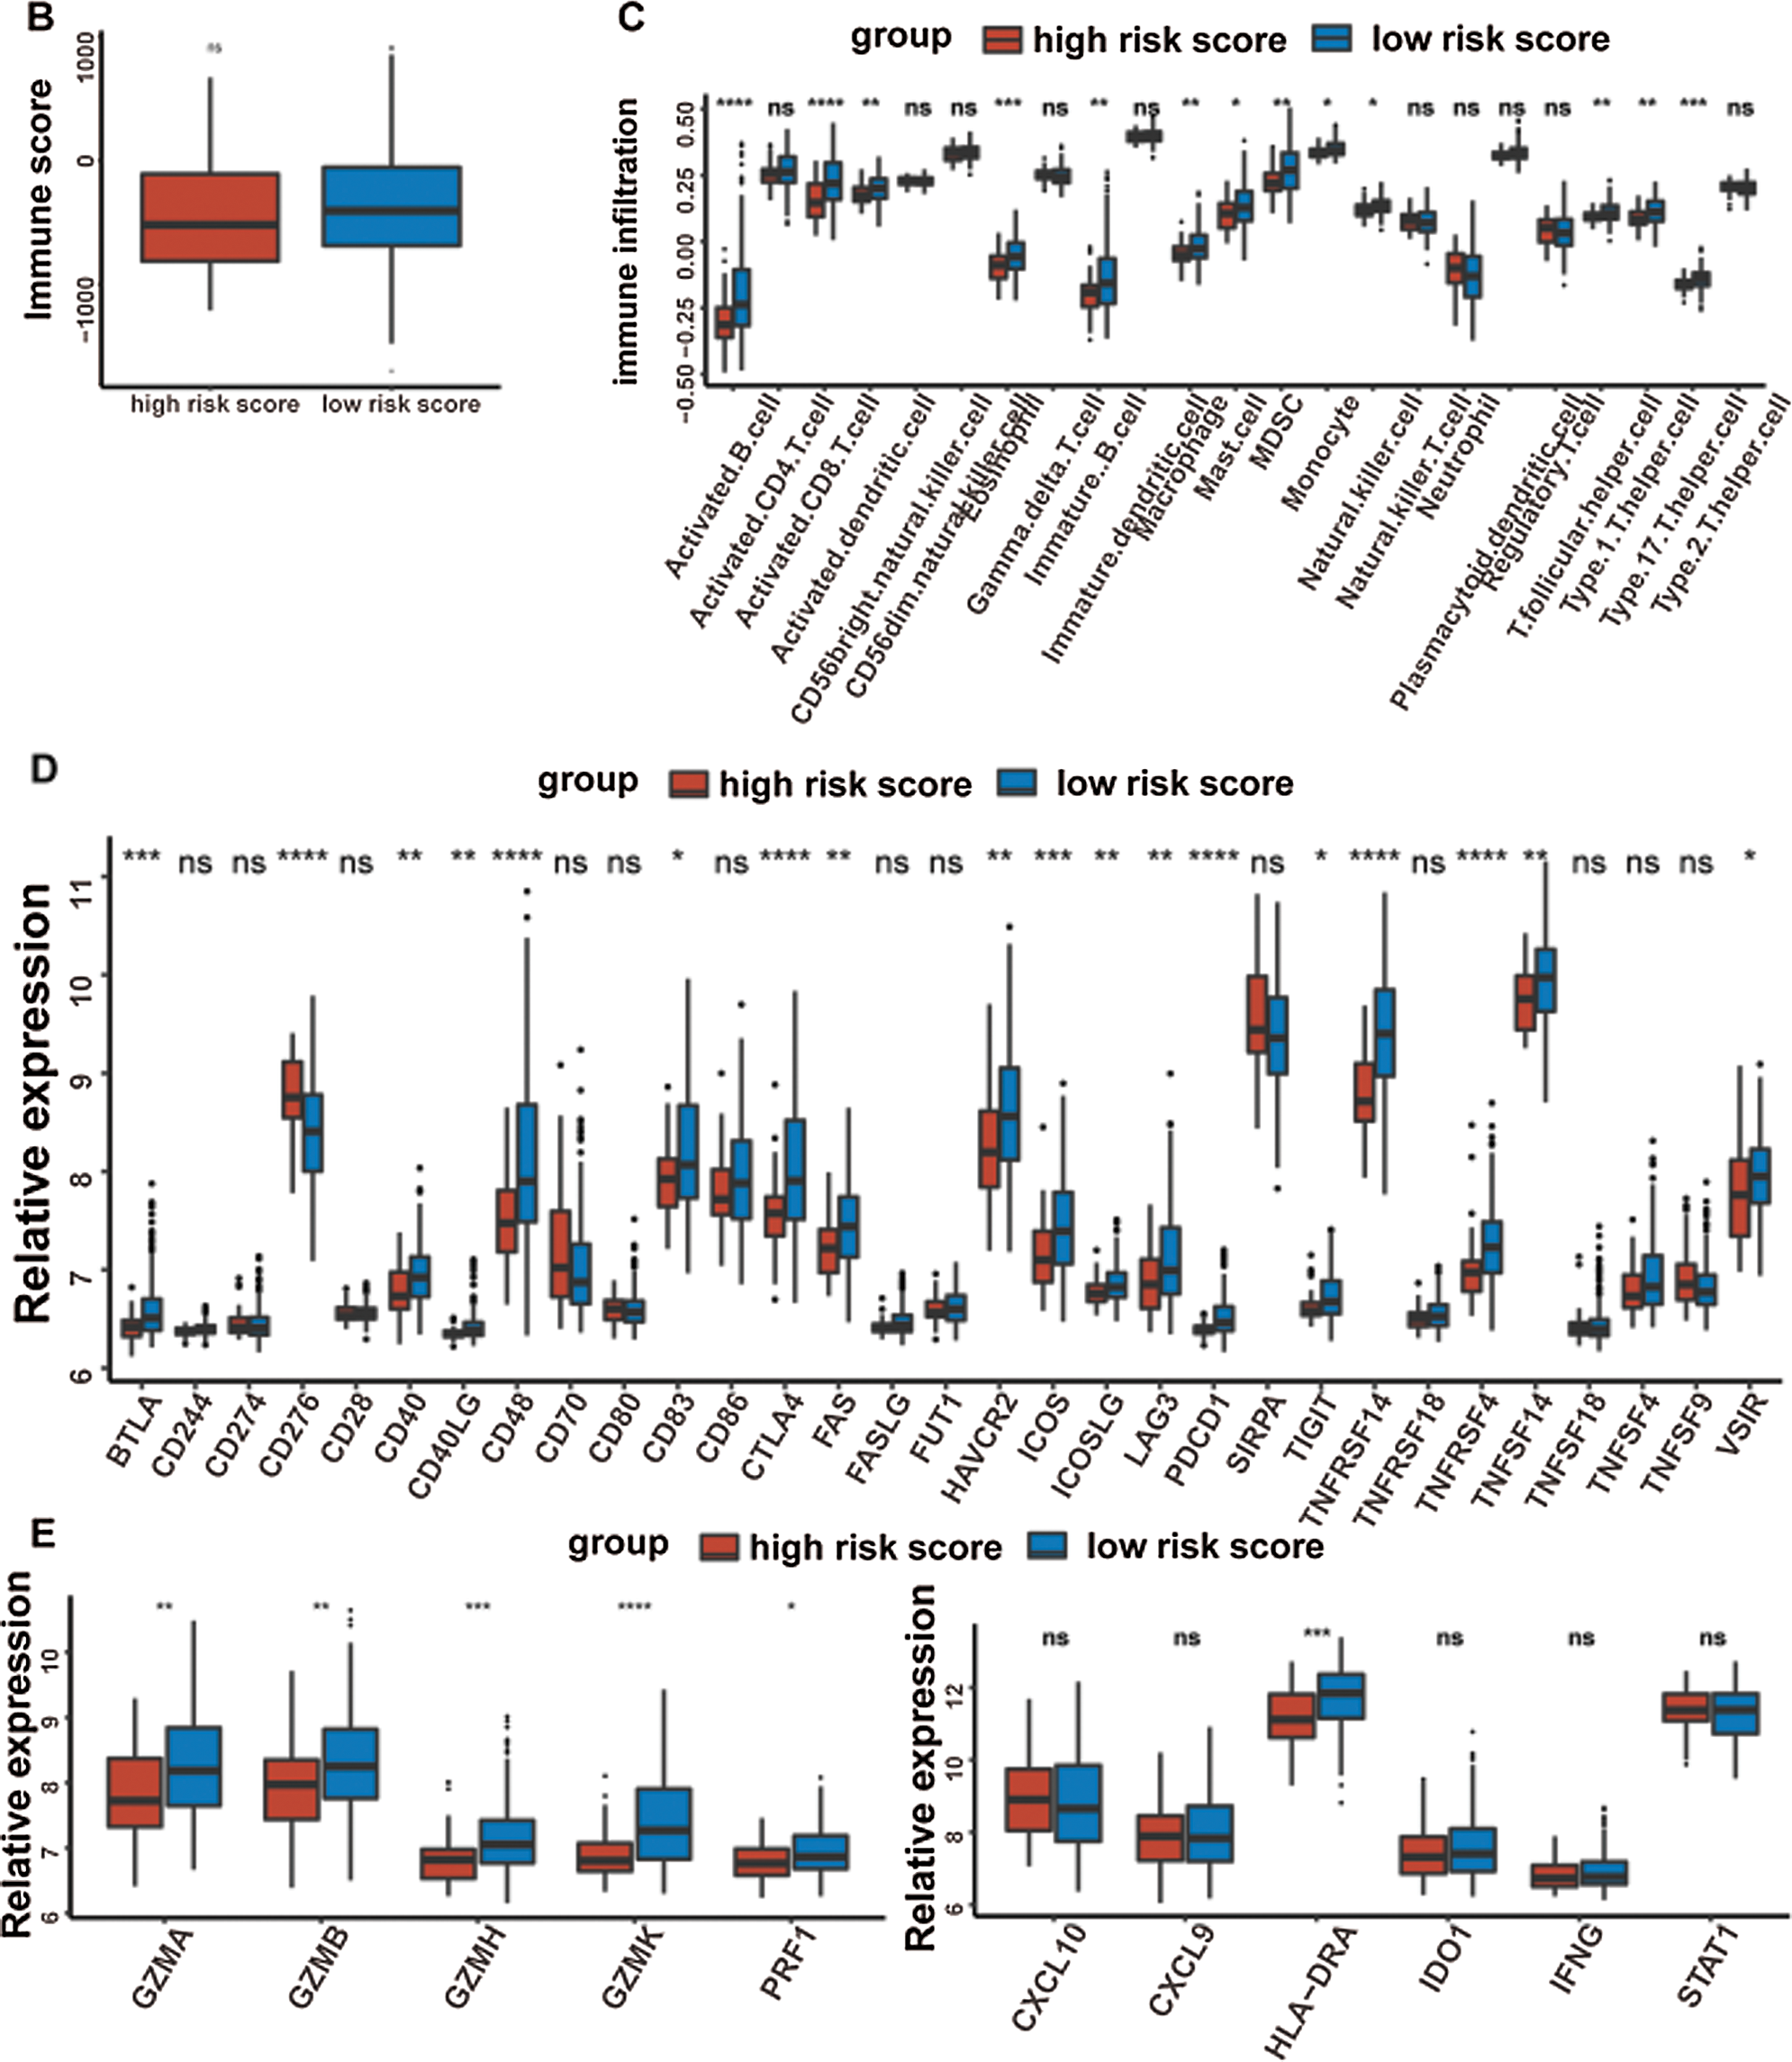
It was well accepted that metabolic reprogramming was critically associated with the immune microenvironment, so we further studied the immune characteristics of the high-/low-risk groups. Results demonstrated that the immune score and the stromal score of the high-risk group were both lower than those of the low-risk group (Fig. 7A).
Since the immune scores between the high-/low-risk groups were significantly different, the relative abundance of each TME infiltrating cell was further investigated with ssGSEA analysis. Accordingly, groups with different risks exhibited distinct immune infiltration. Specifically, 16 immune cell populations (activated B cell, activated CD8 T cell, activated dendritic cell, CD56 dim NK cell, eosinophil, immature B cell, macrophage, mast cell, MDSC, monocyte, NK cell, plasmacytoid dendritic cell, regulatory T cell, T follicular helper cell, Type 1 T helper cell, and Type 17 T helper cell) showed higher abundance in the low-risk group while CD56 bright natural killer cell showed higher abundance in the high-risk group (Fig. 7B). What’s more, the fraction of active immune cells like CD8+ T cell and follicular helper T cell was higher in the low-risk group, whereas the proportion of inactive immune cells like resting mast cell and naive CD4+ T cell was higher in the high-risk group (Fig. 7C).
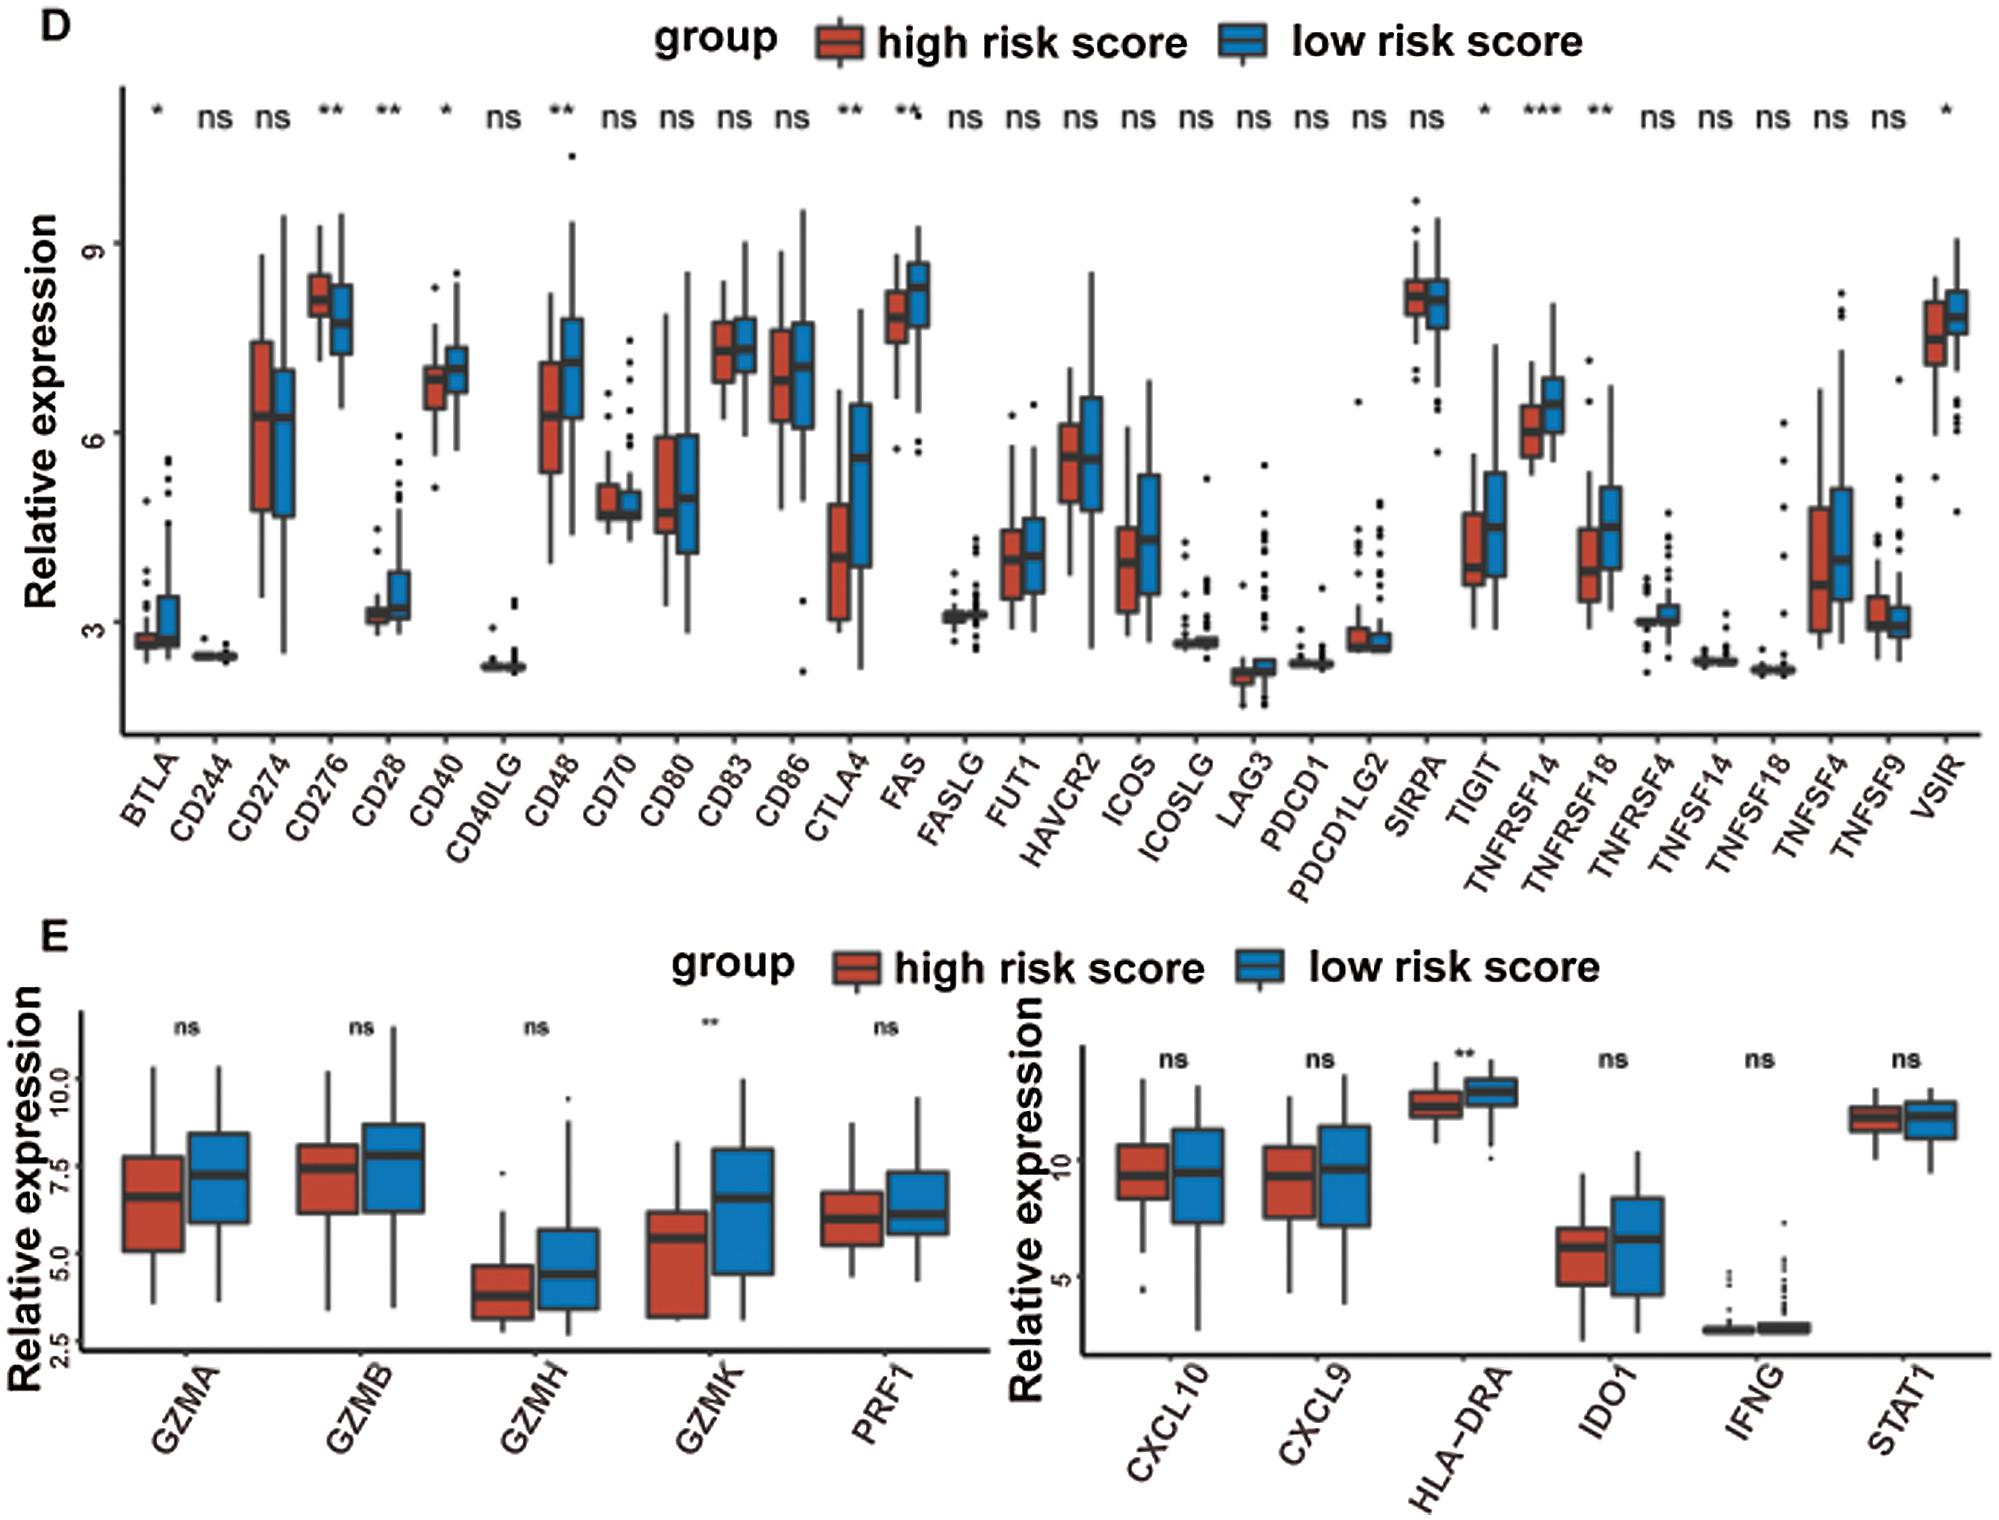
At last, the comparisons of some immune-related molecules between the high-/low-risk groups were achieved. Altogether, 32 immune checkpoint genes described in previous studies (Cao et al., 2018; Yu et al., 2020) were analyzed in this study and the results revealed that the expression levels of 22 immune checkpoint genes were higher in the low-risk group such as CTLA4, CD40, ICOS, TIGIT, and so on (Fig. 7D). Besides, cytotoxic effectors (GZMA, GZMB, GZMH, GZMK, and PRF1) and four out of six genes in the IFNG signature (CXCL9, HLA-DRA, IDO1, and IFNG) were higher in the low-risk group (Fig. 7E). Similar results were obtained in the GSE41613 dataset (Suppl. Figs. S2B–S2E) and the GSE65858 dataset (Suppl. Figs. S3B–S3E).
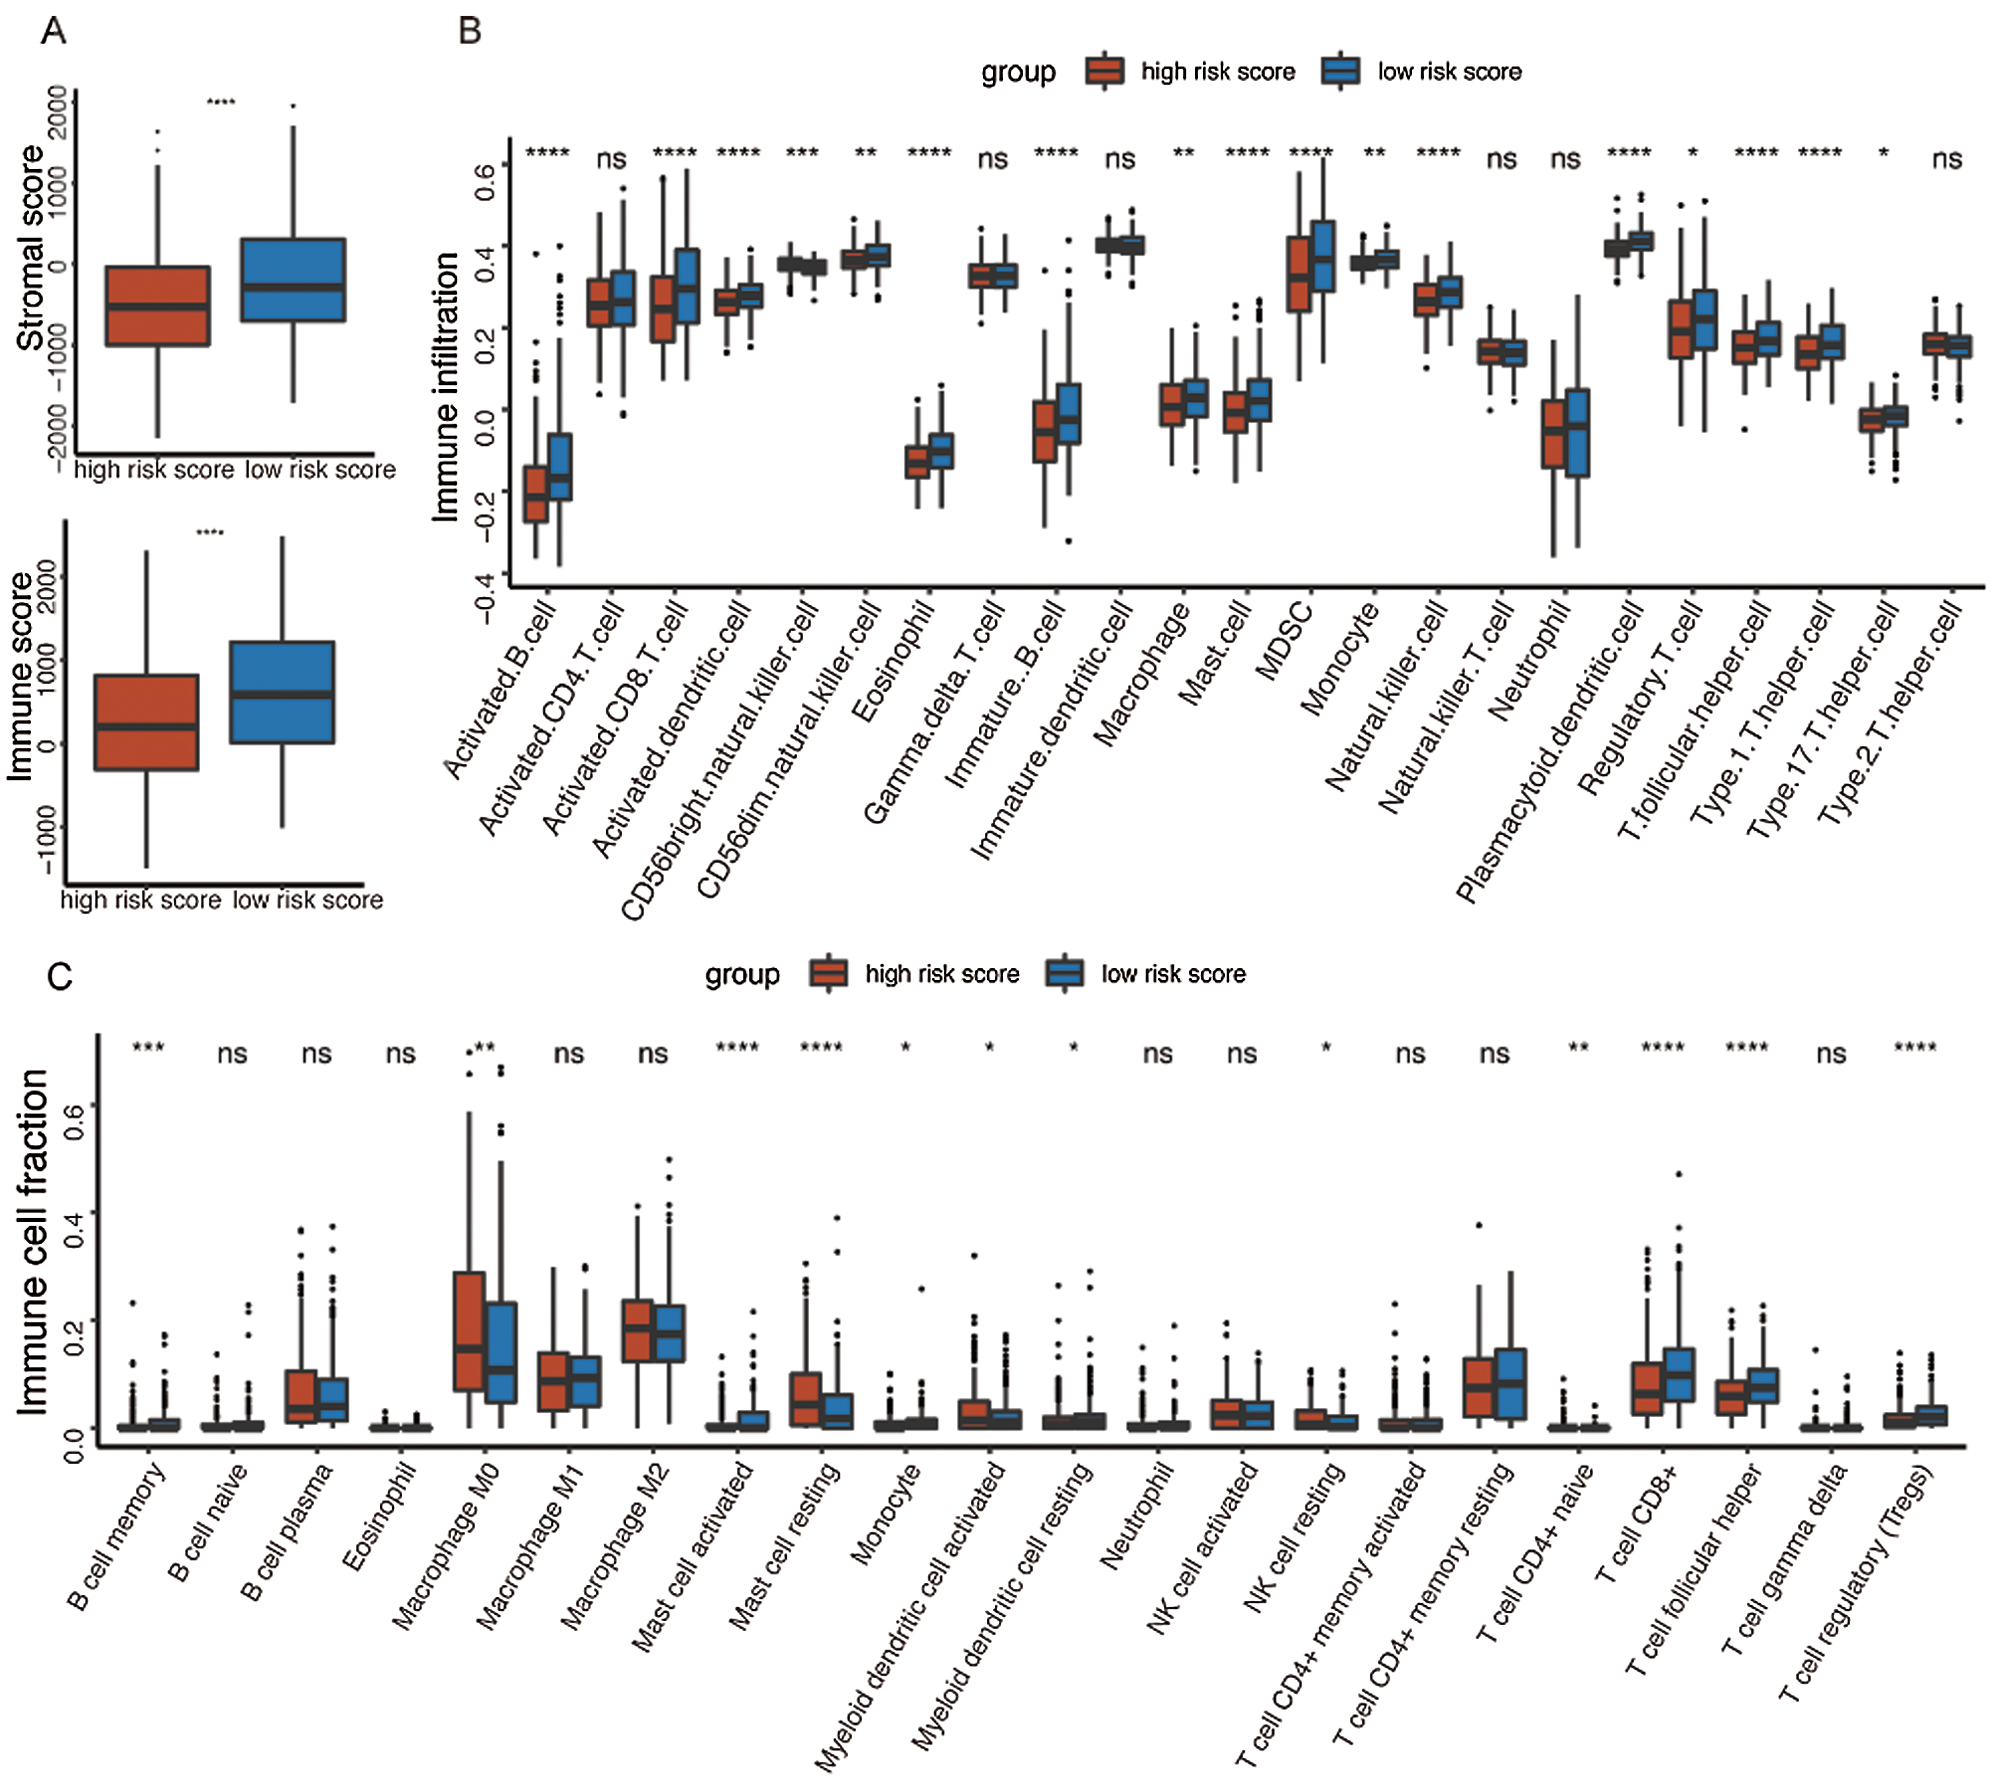
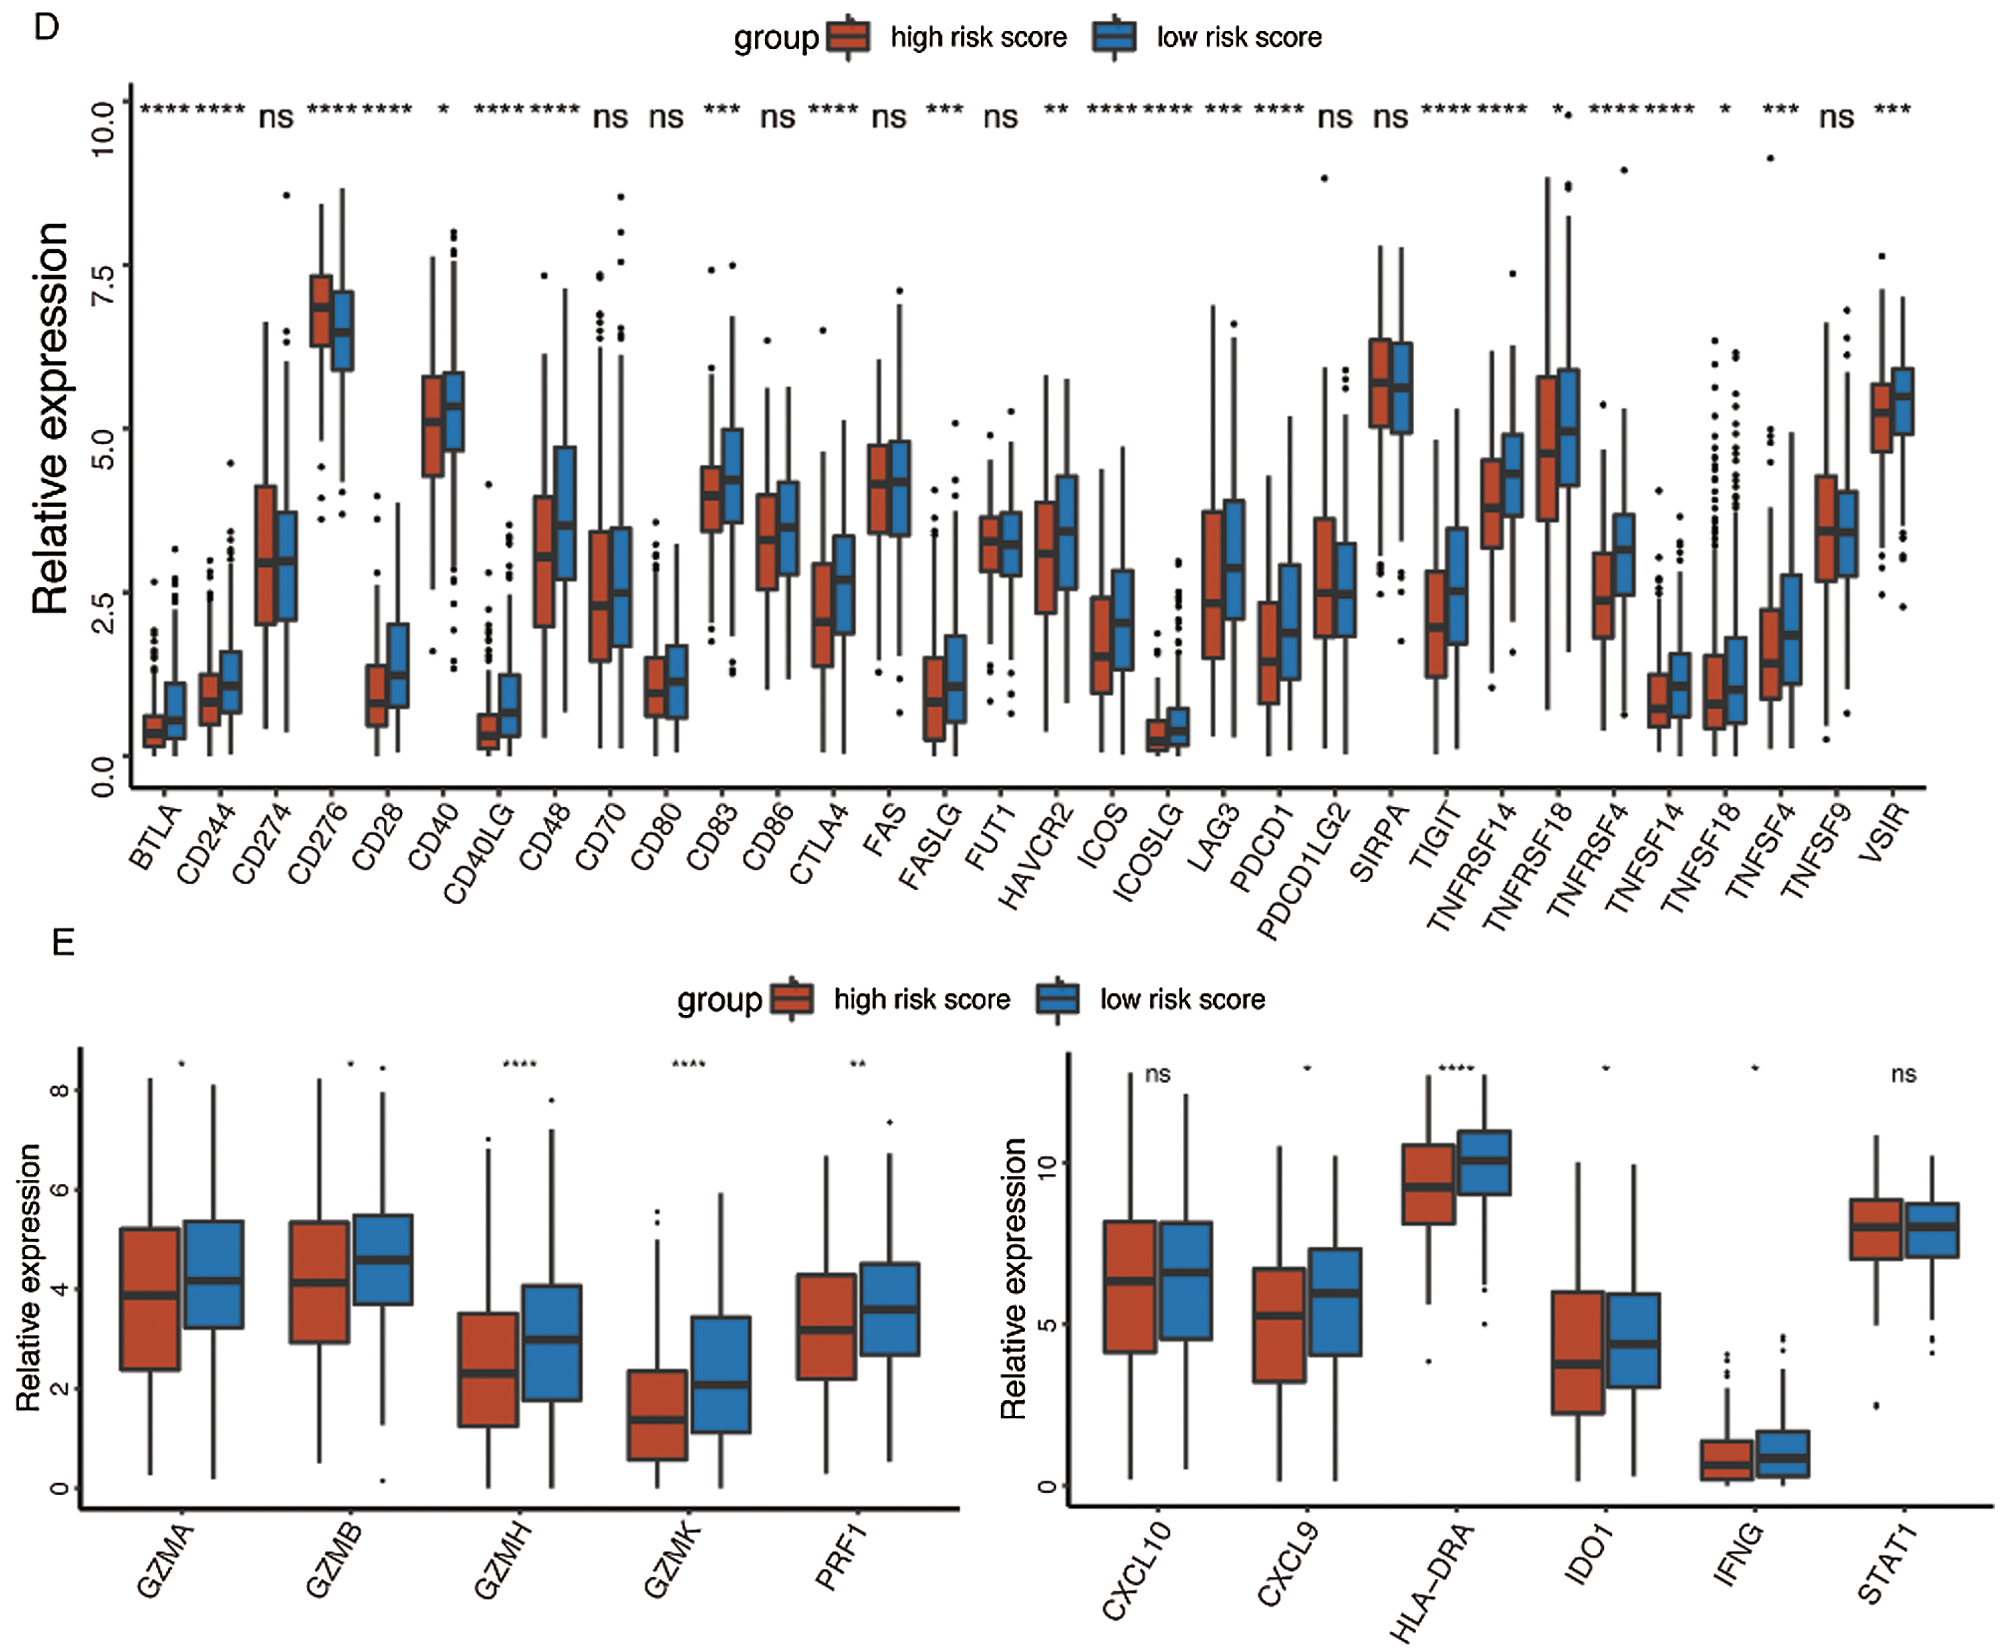
Figure 7: Immune characteristics in the high-/low-risk groups (ns, non-significant, *P < 0.05, **P < 0.01, ***P < 0.0001, ****P < 0.0001).
The correlation between the metabolism and the immune characteristics
Given that the high-risk group demonstrated higher metabolic activity and lower immune activity when analyzed separately, we further explore the correlation between metabolic pathways and immune cell infiltrations by the spearman correlation test. Consistent with the above unilateral results, most major metabolic processes promoting tumor progression had significantly negative correlations with the immune cells exerting antitumor function. For instance, the high-risk group possessed higher activity of glycolysis as well as lower infiltration of activated B cell, activated CD8 T cell, and activated dendritic cell. Correspondingly, the correlations between glycolysis and the above immune cell infiltrations were significantly negative as expected (Fig. 8).
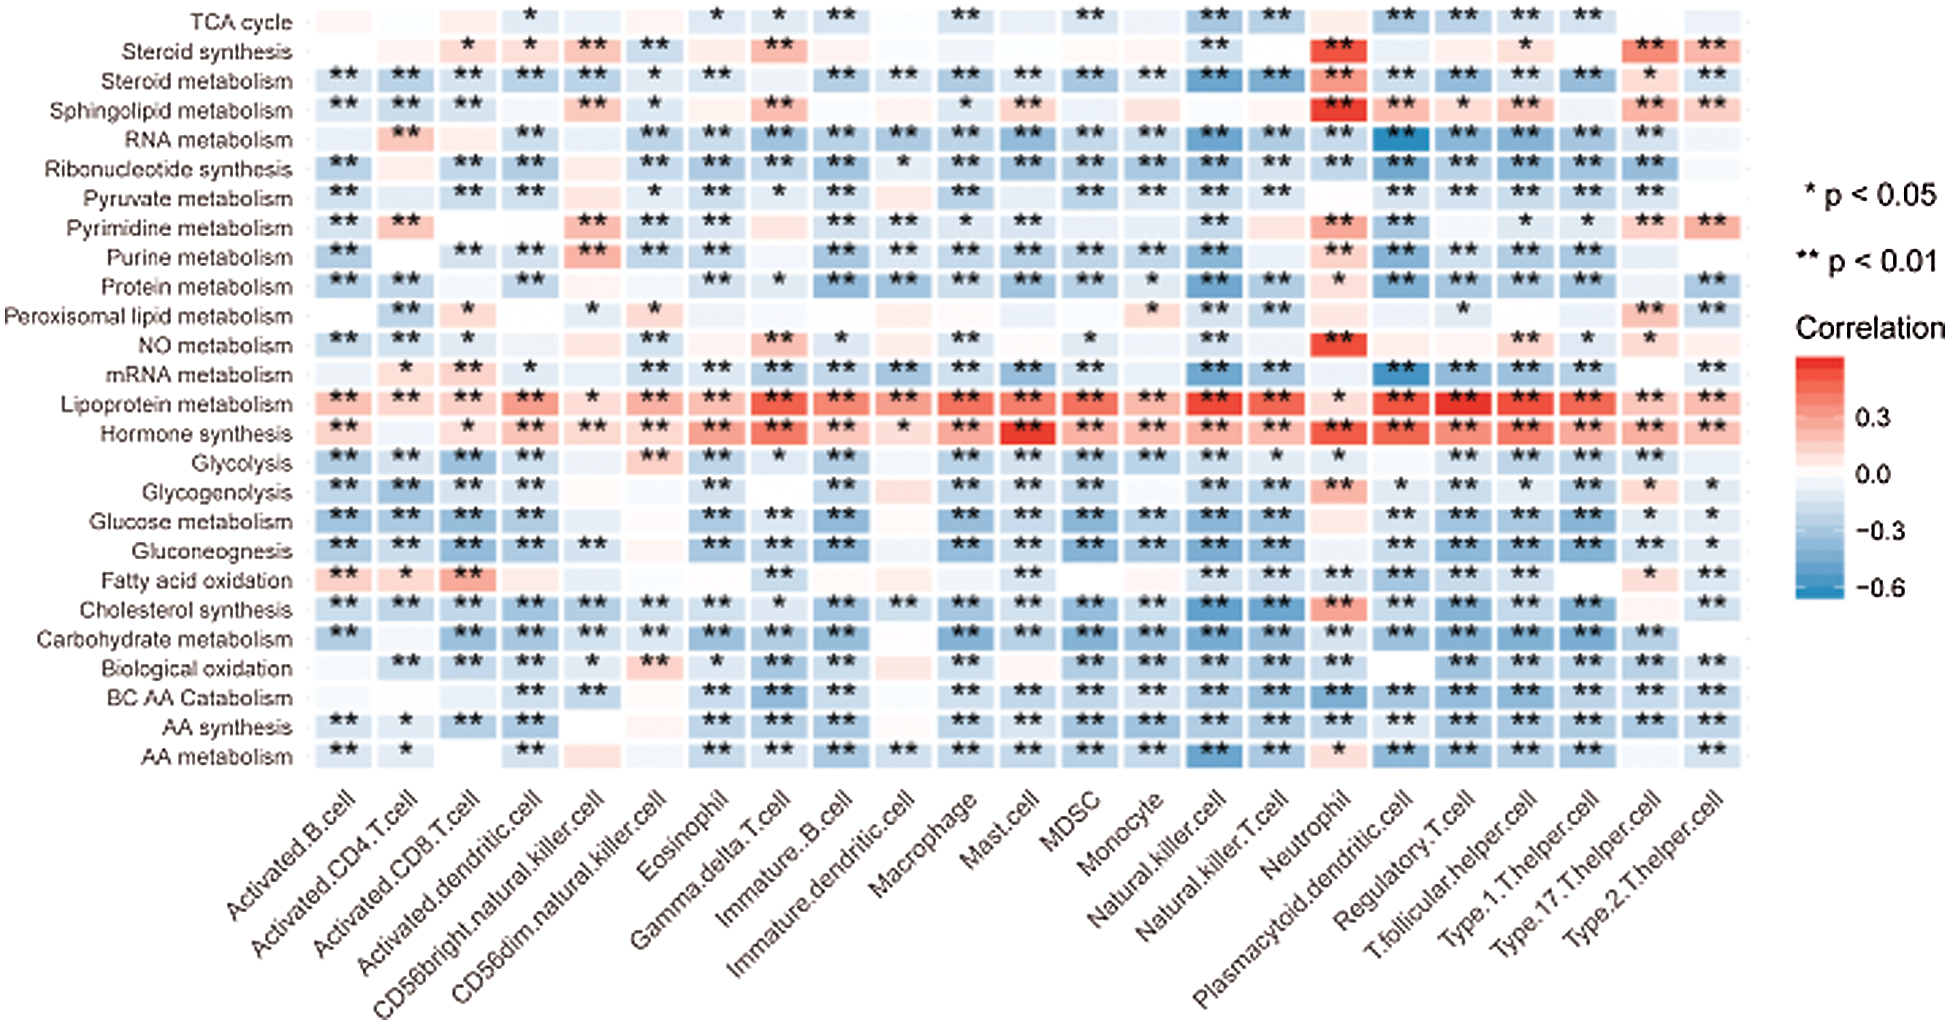
Figure 8: Correlation between the metabolic pathways and the immune cell infiltrations.
With the continuously updating understanding of molecular heterogeneity inherent within HNSCC, emerging biomarkers with prognostic value have been identified by genomic expression analyses from diverse perspectives such as transcription factors, lymph node metastases, radiomics, and so on (Zhang et al., 2019; Huang et al., 2019b; Huang et al., 2019a; Tonella et al., 2017; Chung et al., 2004). Considering metabolic reprogramming as a hallmark of cancer, some previous studies also constructed prognostic models based on genes related to specific metabolic pathways (Liu and Yin, 2020; Okazaki et al., 2019). To fully explore the metabolism reprogramming in HNSCC, we expanded the study scope to all the MRGs in HNSCC. Finally, a model containing 4 MRGs with favorable prognostic value was established using TCGA dataset and was further validated in two independent GEO datasets. This prognostic model could also serve as a gene classifier dividing the patients into different risk groups with altered metabolism and immune characteristics.
Among these 4 DEMRGs, solute carrier family 23 member 1 (SLC23A1) and glutamate ionotropic receptor AMPA type subunit 3 (GRIA3) were highly expressed in the low-risk group, indicating their potential roles of being protective MRGs in HNSCC. Similar protective properties of SLC23A1 also appear in gastric malignancy since SLC23A1 is a transporter mediating the electrogenic uptake of anti-cancer agent ascorbic acid (Wu et al., 2017; Wright et al., 2009). Nevertheless, overexpression of GRIA3 promotes the proliferation and migration of pancreatic cancer (Ripka et al., 2010), which seems to be contradicted with our results in HNSCC. Therefore, more functional investigations of GRIA3 in various cancers are necessary. The rest 2 DEMRGs act as risk-associated MRGs for HNSCC in this study, namely hypoxanthine-guanine phosphoribosyltransferase1 (HPRT1) and glycogen phosphorylase L (PYGL). Consistently, HPRT1 is not only widely used to assess cancer risk and determine possible carcinogens but also has the potential to act as a cancer biomarker and neoantigen with its overexpression leading to the dysregulation of nucleotide synthesis and protein production in the malignant environment (Townsend et al., 2018). Meanwhile, as a key role in glycogen metabolism, PYGL is up-regulated in most tumors to sustain cancer cell proliferation and is also identified as a novel p53 candidate target gene in various cancers as well as a metastasis-related metabolic gene in prostate cancer (Chen et al., 2018; Garritano et al., 2013; Favaro et al., 2012).
In this study, TP53 mutation was significantly higher in the high-risk group, which is consistent with the tumor suppressor role of TP53. Mutations of TP53 are the most frequent among all the somatic genomic alterations in HNSCC and have a significant correlation with poor outcomes in HNSCC patients indicated by short survival time and tumor resistance to radiotherapy and chemotherapy (Zhou et al., 2016). Therefore, TP53 mutation might also serve as an effective prognostic biomarker. GSEA analysis indicates that several pathways with anti-tumor activities are activated in the low-risk group, linoleic acid metabolism, CAMs, and KRAS signaling DN for instance. Linoleic acid has been identified as an anti-carcinogenic fatty acid with anti-obesogenic effects and anti-atherosclerotic properties (den Hartigh, 2019). CAMs are proteins that mediate cell-to-cell adhesion and cell-to-extracellular matrix interactions, which are essential to maintain homeostasis in healthy tissues (Janiszewska et al., 2020). The downregulation of KRAS signaling could also ubiquitously inhibit the activity of most tumors (Sexton et al., 2019). These might partly explain why low-risk patients exhibit a longer survival time.
The analysis results of 26 metabolic pathways reveal that the high-risk group tends to exhibit higher activity in some major metabolic processes such as glycometabolism, lipid metabolism, and AA metabolism. Increased glucose uptake and enhanced glycolysis are well-recognized hallmarks in HNSCC to meet the energy demands of highly proliferating cells (Yamamoto et al., 2017). Essential roles exerted by specific lipids in promoting growth and metastasis of cancer cells have been gradually unveiled in a myriad of research (Beloribi-Djefaflia et al., 2016), and our team also defined a 3-lipid metabolism-related genes signature as a biomarker for prognostic prediction in oral squamous cell carcinoma previously (Hu et al., 2019). Besides, the serum levels of specific amino acids such as valine, tyrosine, serine, and methionine were higher in HNSCC patients (Yonezawa et al., 2013). Therefore, tremendous efforts have been undertaken to develop anti-cancer schemes by targeting these hyperactive metabolic pathways in HNSCC with the hope of improving therapeutic efficiency (Boroughs and DeBerardinis, 2015).
Accumulating evidence has revealed the close relationship between metabolic characteristics and immune cells (Biswas, 2015). Considering the vital roles of immune landscapes in cancer progression and the immunosuppressive state of HNSCC, it is necessary to explore the immune microenvironment of different risk groups with different metabolism characteristics (Kang et al., 2015). As we expected, patients with low risk possess higher immune activity. The evaluation of immune infiltration shows a higher abundance of 16 immune cell populations in the low-risk group, further accompanied by higher fractions of active immune cells like activated B cell, activated CD8 T cell, and so on. On the contrary, patients from the high-risk group had higher proportions of inactive immune cells, confirming the promotion role of immunosuppressive status in HNSCC. Generally, the presence of abundant tumor-infiltrating lymphocytes is related to the improved prognosis due to immune activation (Canning et al., 2019). In other words, the dysfunction of the T cell, impairment of the NK cell activity, and a whole declination of the lymphocyte counts could deteriorate the prognosis in HNSCC patients (Solomon et al., 2018).
Immunotherapy provides a new option for the treatment of HNSCC, while currently, only a small percentage of patients respond well to immunotherapy (Oliva et al., 2019). Targeting checkpoint pathways achieves anti-tumor immunity in TME and encourages the development of potential targets in immunotherapy such as CTLA-4, TIGIT, ICOS, and CD40 (Marin-Acevedo et al., 2018). Moreover, as a critical role for host defense and tumor surveillance, IFNG can enhance the activity of some cytotoxic effectors and is proposed to be an important driver of programmed death ligand-1 (PD-L1) expression in HNSCC (Ayers et al., 2017). What’s exciting is that most immune checkpoint genes, cytotoxic effectors, and genes in the IFNG signature within our study have a higher expression in the low-risk group, which might predict promising results of immunotherapy in the low-risk group.
The last but not the least, our study suggested that many metabolic pathways with tumor-promoting function were negatively correlated with the immune activity, leading to the state of metabolic activation and immunologic suppression in the high-risk group. This immunosuppressive state to a higher degree might contribute to immune evasion in the high-risk group. The negative correlation between metabolism and immune here could be ascribed to the possibility that active metabolism would hinder the nutritional supply of immune cells. Therefore, it might be plausible to adopt a combination of anti-metabolism and immunotherapy drugs in the high-risk group to achieve better therapeutic effects than applied separately.
It is interesting that within the scope of our research, HPV (+) was not enriched in either the high-risk or the low-risk group, but the low-risk group tended to exhibit similar characteristics with HPV (+) HNSCC such as fewer p53 mutations and altered metabolism as well as immune landscape. Nevertheless, changes towards specific metabolic pathways or expression of immune genes were not exactly the same in the low-risk group and the HPV (+) population. Considering the samples of the HPV analysis are not big enough in this study, larger samples are necessary to further determine the association between the HPV (+) status and the low-risk group stratified by this model.
In summary, this study generates a robust metabolism-related prognostic model that classifies the HNSCC patients into the high-/low-risk groups each with different somatic mutations, signaling pathways, metabolic characteristics, and immune landscapes. The correlations between major metabolic pathways and the immune infiltrations also verify that the metabolic changes could impact the immune functions during cancer progression. These results provide a compelling rationale for MRGs to serve as candidate prognostic biomarkers and gene classifiers in HNSCC. Furthermore, this study offers a preclinical proof of concept that biomarker-driven cancer therapy and individualized treatment for HNSCC patients have promising prospects.
Acknowledgement: The authors thank TCGA and GEO for sharing the data of head and neck squamous cell carcinoma.
Availability of Data and Materials: The datasets analyzed analysed during the current study are available in the GEO (GSE41613 and GSE65858) and TCGA database (https://portal.gdc.cancer.gov/).
Author Contribution: The authors confirm contribution to the paper as follows: study conception and design: Jiayu Zhang, Ruoyan Cao; data collection: Jiayu Zhang, Ruoyan Cao, Jianmin Peng; analysis and interpretation of results: Jiayu Zhang, Ruoyan Cao, Qinchao Hu; draft manuscript preparation: Jiayu Zhang, Ruoyan Cao, Juan Xia, Bin Cheng. All authors reviewed the results and approved the final version of the manuscript.
Funding Statement: The design of the study was supported by the National Natural Science Foundation of China (No. 81630025). The collection, analysis and interpretation of the data were supported by the National Natural Science Foundation of China (No. 82001044). The composition of the manuscript was supported by the China Postdoctoral Science Foundation (2020M673019) and the Guangdong Basic and Applied Basic Research Foundation (2019A1515110071).
Conflicts of Interest: The authors declare that they have no conflicts of interest to report regarding the present study.
Ayers M, Lunceford J, Nebozhyn M, Murphy E, Loboda A et al. (2017). IFN-γ-related mRNA profile predicts clinical response to PD-1 blockade. Journal of Clinical Investigation 127: 2930–2940. [Google Scholar]
Beloribi-Djefaflia S, Vasseur S, Guillaumond F (2016). Lipid metabolic reprogramming in cancer cells. Oncogenesis 5: e189. [Google Scholar]
Biswas SK (2015). Metabolic reprogramming of immune cells in cancer progression. Immunity 43: 435–449. [Google Scholar]
Boroughs LK, DeBerardinis RJ (2015). Metabolic pathways promoting cancer cell survival and growth. Nature Cell Biology 17: 351–359. [Google Scholar]
Bose P, Brockton NT, Dort JC (2013). Head and neck cancer: From anatomy to biology. International Journal of Cancer 133: 2013–2023. [Google Scholar]
Canning M, Guo G, Yu M, Myint C, Groves MW et al. (2019). Heterogeneity of the head and neck squamous cell carcinoma immune landscape and its impact on immunotherapy. Frontiers in Cell and Development Biology 7: 52. [Google Scholar]
Cao B, Wang Q, Zhang H, Zhu G, Lang J (2018). Two immune-enhanced molecular subtypes differ in inflammation, checkpoint signaling and outcome of advanced head and neck squamous cell carcinoma. OncoImmunology 7: e1392427. [Google Scholar]
Charoentong P, Finotello F, Angelova M, Mayer C, Efremova M et al. (2017). Pan-cancer immunogenomic analyses reveal genotype-immunophenotype relationships and predictors of response to checkpoint blockade. Cell Reports 18: 248–262. [Google Scholar]
Chen J, Cao S, Situ B, Zhong J, Hu Y et al. (2018). Metabolic reprogramming-based characterization of circulating tumor cells in prostate cancer. Journal of Experimental & Clinical Cancer Research 37: 127. [Google Scholar]
Chen YP, Wang YQ, Lv JW, Li YQ, Chua MLK et al. (2019). Identification and validation of novel microenvironment-based immune molecular subgroups of head and neck squamous cell carcinoma: Implications for immunotherapy. Annals of Oncology 30: 68–75. [Google Scholar]
Choi H, Na KJ (2018). Pan-cancer analysis of tumor metabolic landscape associated with genomic alterations. Molecular Cancer 17: 150. [Google Scholar]
Chung CH, Parker JS, Karaca G, Wu J, Funkhouser WK et al. (2004). Molecular classification of head and neck squamous cell carcinomas using patterns of gene expression. Cancer Cell 5: 489–500. [Google Scholar]
den Hartigh LJ (2019). Conjugated linoleic acid effects on cancer, obesity, and atherosclerosis: A review of pre-clinical and human trials with current perspectives. Nutrients 11: 370. [Google Scholar]
Favaro E, Bensaad K, Chong MG, Tennant DA, Ferguson DJP et al. (2012). Glucose utilization via glycogen phosphorylase sustains proliferation and prevents premature senescence in cancer cells. Cell Metabolism 16: 751–764. [Google Scholar]
Ferlay J, Soerjomataram I, Dikshit R, Eser S, Mathers C et al. (2015). Cancer incidence and mortality worldwide: Sources, methods and major patterns in GLOBOCAN 2012. International Journal of Cancer 136: E359–E386. [Google Scholar]
Garritano S, Inga A, Gemignani F, Landi S (2013). More targets, more pathways and more clues for mutant p53. Oncogenesis 2: e54. [Google Scholar]
Hsieh Y, Chen Y, Lin S, Chang K, Li W (2019). Targeting cellular metabolism modulates head and neck oncogenesis. International Journal of Molecular Sciences 20: 3960. [Google Scholar]
Hu Q, Peng J, Chen X, Li H, Song M et al. (2019). Obesity and genes related to lipid metabolism predict poor survival in oral squamous cell carcinoma. Oral Oncology 89: 14–22. [Google Scholar]
Hu Y, Zheng M, Wang C, Wang S, Gou R et al. (2020). Identification of KIF23 as a prognostic signature for ovarian cancer based on large-scale sampling and clinical validation. American Journal of Translational Research 12: 4955–4976. [Google Scholar]
Huang C, Cintra M, Brennan K, Zhou M, Colevas AD et al. (2019a). Development and validation of radiomic signatures of head and neck squamous cell carcinoma molecular features and subtypes. EBioMedicine 45: 70–80. [Google Scholar]
Huang L, David O, Cabay RJ, Valyi-Nagy K, Macias V et al. (2019b). Molecular classification of lymph node metastases subtypes predict for survival in head and neck cancer. Clinical Cancer Research 25: 1795–1808. [Google Scholar]
Janiszewska M, Primi MC, Izard T (2020). Cell adhesion in cancer: Beyond the migration of single cells. Journal of Biological Chemistry 295: 2495–2505. [Google Scholar]
Kang H, Kiess A, Chung CH (2015). Emerging biomarkers in head and neck cancer in the era of genomics. Nature Reviews Clinical Oncology 12: 11–26. [Google Scholar]
Leemans CR, Snijders PJF, Brakenhoff RH (2018). The molecular landscape of head and neck cancer. Nature Reviews Cancer 18: 269–282. [Google Scholar]
Liu Y, Yin S (2020). A novel prognostic index based on the analysis of glycolysis-related genes in head and neck squamous cell carcinomas. Journal of Oncology 2020: 7353874. [Google Scholar]
Marin-Acevedo JA, Dholaria B, Soyano AE, Knutson KL, Chumsri S, Lou Y (2018). Next generation of immune checkpoint therapy in cancer: New developments and challenges. Journal of Hematology & Oncology 11: 39. [Google Scholar]
Mroz EA, Tward AM, Hammon RJ, Ren Y, Rocco JW (2015). Intra-tumor genetic heterogeneity and mortality in head and neck cancer: Analysis of data from the cancer genome atlas. PLoS Medicine 12: e1001786. [Google Scholar]
Okazaki S, Umene K, Yamasaki J, Suina K, Otsuki Y et al. (2019). Glutaminolysis-related genes determine sensitivity to xCT-targeted therapy in head and neck squamous cell carcinoma. Cancer Science 110: 3453–3463. [Google Scholar]
Oliva M, Spreafico A, Taberna M, Alemany L, Coburn B et al. (2019). Immune biomarkers of response to immune-checkpoint inhibitors in head and neck squamous cell carcinoma. Annals of Oncology 30: 57–67. [Google Scholar]
Possemato R, Marks KM, Shaul YD, Pacold ME, Kim D et al. (2011). Functional genomics reveal that the serine synthesis pathway is essential in breast cancer. Nature 476: 346–350. [Google Scholar]
Ripka S, Riedel J, Neesse A, Griesmann H, Buchholz M et al. (2010). Glutamate receptor GRIA3—Target of CUX1 and mediator of tumor progression in pancreatic cancer. Neoplasia 12: 659–IN6. [Google Scholar]
Sexton RE, Mpilla G, Kim S, Philip PA, Azmi AS (2019). Ras and exosome signaling. Seminars in Cancer Biology 54: 131–137. [Google Scholar]
Solomon B, Young RJ, Rischin D (2018). Head and neck squamous cell carcinoma: Genomics and emerging biomarkers for immunomodulatory cancer treatments. Seminars in Cancer Biology 52: 228–240. [Google Scholar]
Tonella L, Giannoccaro M, Alfieri S, Canevari S, de Cecco L (2017). Gene expression signatures for head and neck cancer patient stratification: Are results ready for clinical application? Current Treatment Options in Oncology 18: 32. [Google Scholar]
Townsend MH, Robison RA, O’Neill KL (2018). A review of HPRT and its emerging role in cancer. Medical Oncology 35: 89. [Google Scholar]
Wright ME, Andreotti G, Lissowska J, Yeager M, Zatonski W et al. (2009). Genetic variation in sodium-dependent ascorbic acid transporters and risk of gastric cancer in Poland. European Journal of Cancer 45: 1824–1830. [Google Scholar]
Wu X, Cheng J, Wang X (2017). Dietary antioxidants: Potential anticancer agents. Nutrition and Cancer 69: 521–533. [Google Scholar]
Yamamoto M, Inohara H, Nakagawa T (2017). Targeting metabolic pathways for head and neck cancers therapeutics. Cancer and Metastasis Reviews 36: 503–514. [Google Scholar]
Yonezawa K, Nishiumi S, Nishiumii S, Kitamoto-Matsuda J, Fujita T et al. (2013). Serum and tissue metabolomics of head and neck cancer. Cancer Genomics & Proteomics 10: 233. [Google Scholar]
Yoshihara K, Shahmoradgoli M, Martínez E, Vegesna R, Kim H et al. (2013). Inferring tumour purity and stromal and immune cell admixture from expression data. Nature Communications 4: 2612. [Google Scholar]
Yu Y, Zhang W, Li A, Chen Y, Ou Q et al. (2020). Association of long noncoding RNA biomarkers with clinical immune subtype and prediction of immunotherapy response in patients with cancer. JAMA Network Open 3: e202149. [Google Scholar]
Zhang B, Wang H, Guo Z, Zhang X (2019). A panel of transcription factors identified by data mining can predict the prognosis of head and neck squamous cell carcinoma. Cancer Cell International 19: 297. [Google Scholar]
Zhao X, Cui L (2019). Development and validation of a m(6)A RNA methylation regulators-based signature for predicting the prognosis of head and neck squamous cell carcinoma. American Journal of Cancer Research 9: 2156–2169. [Google Scholar]
Zhou G, Liu Z, Myers JN (2016). TP53 mutations in head and neck squamous cell carcinoma and their impact on disease progression and treatment response. Journal of Cellular Biochemistry 117: 2682–2692. [Google Scholar]
Supplementary files
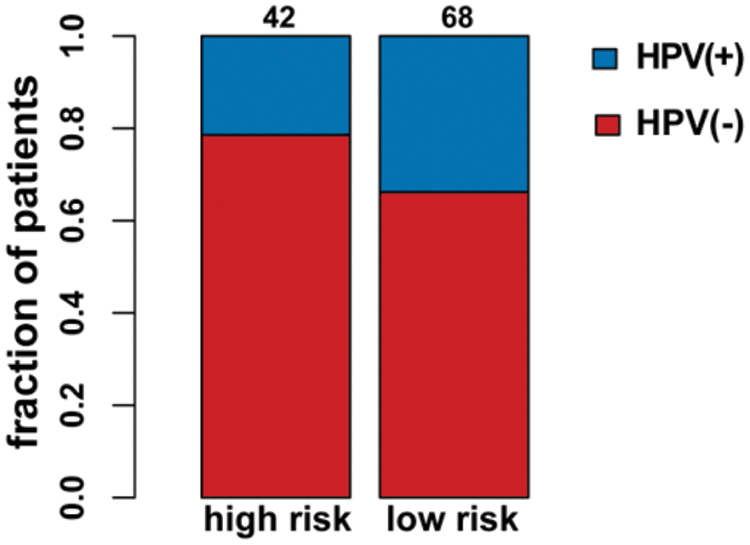
Supplementary Figure S1: HPV status in the high-/low-risk groups.
Supplementary Figure S2: The metabolic pathways scores and the immune characteristics in the high-/low-risk groups of the GSE41613 dataset (ns, non-significant, *P < 0.05, **P < 0.01, ***P < 0.0001, ****P < 0.0001).
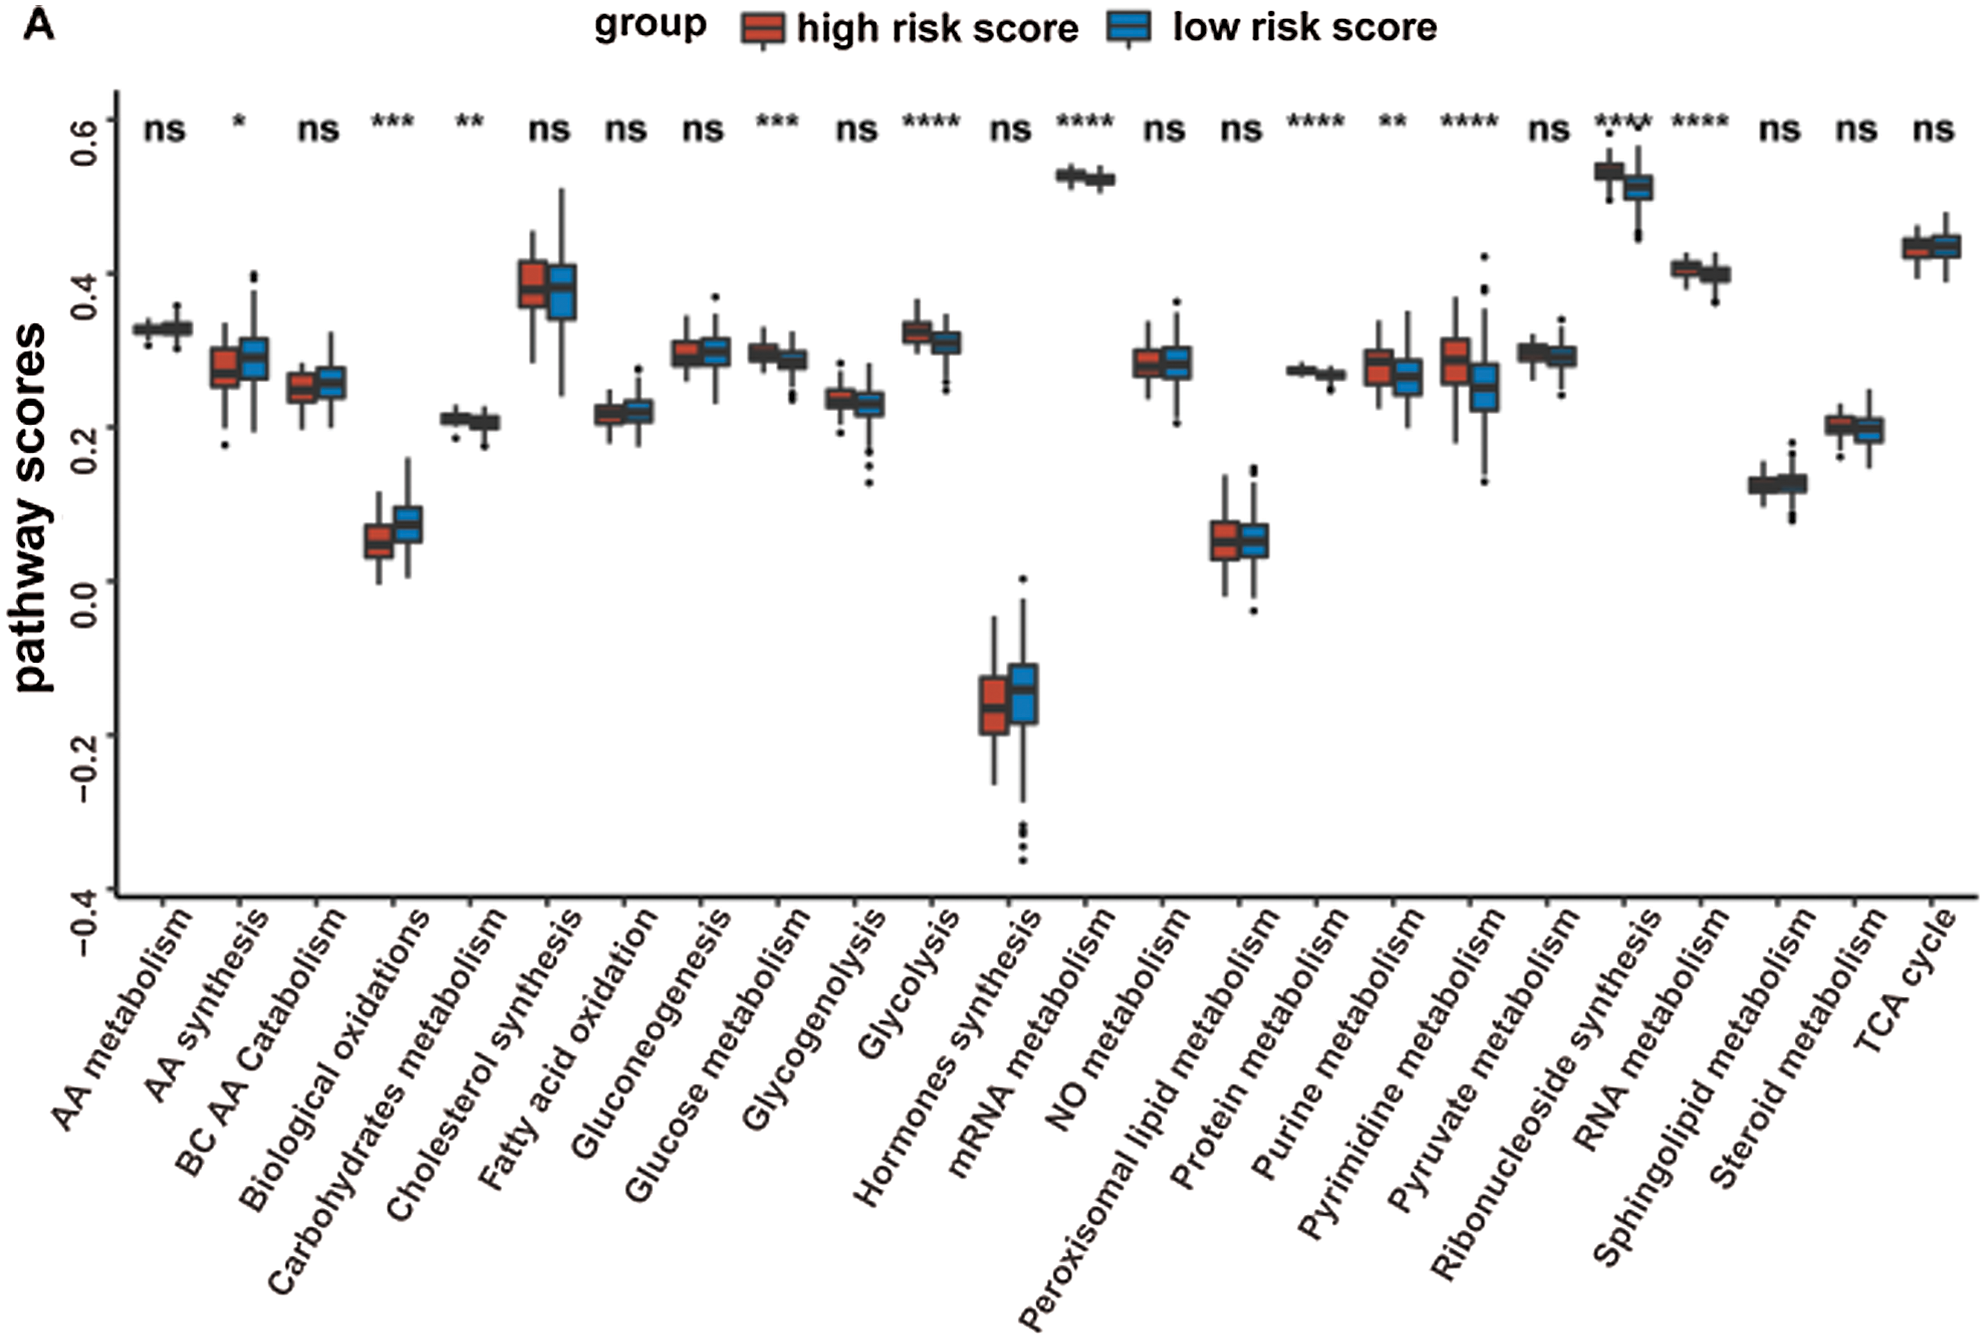
Supplementary Figure S3: The metabolic pathways scores and the immune characteristics in the high-/low-risk groups of the GSE65858 dataset (ns, non-significant, *P < 0.05, **P < 0.01, ***P < 0.0001, ****P < 0.0001).
 | This work is licensed under a Creative Commons Attribution 4.0 International License, which permits unrestricted use, distribution, and reproduction in any medium, provided the original work is properly cited. |