DOI:10.32604/biocell.2021.015608
| BIOCELL DOI:10.32604/biocell.2021.015608 | |
| Article |
Construction and validation of prognostic model based on autophagy-related lncRNAs in gastric cancer
1Department of General Surgery, The First Affiliated Hospital of Anhui Medical University, Hefei, 230022, China
2Anhui Medical University, Hefei, 230022, China
*Address correspondence to: Bo Chen, chenbo831116@163.com; Xin Xu, ahmuxx@163.com
Received: 30 December 2020; Accepted: 23 February 2021
Abstract: Gastric cancer (GC) is one of the most common cancer worldwide. Although emerging evidence indicates that autophagy-related long non-coding RNA (lncRNA) plays an important role in the progression of GC, the prognosis of GC based on autophagy is still deficient. The Cancer Genome of Atlas stomach adenocarcinoma (TCGA-STAD) dataset was downloaded and separated into a training set and a testing set randomly. Then, 24 autophagy-related lncRNAs were found strongly associated with the survival of the TCGA-STAD dataset. 11 lncRNAs were selected to build the risk score model through the least absolute shrinkage and selection operator (LASSO) regression. Every patient got a risk score (RS), and patients were separated into a high-risk group and a low-risk group due to the median RS. The multivariate Cox analysis showed that the RS could be an independent prognosis predictor. The Kaplan-Meier survival analysis and the Receiver Operating Characteristic (ROC) curve indicated the model had an excellent prediction effect. Gene Ontology (GO) and Kyoto Encyclopedia of Genes and Genomes (KEGG) analysis revealed that the mRNAs in the prognostic network were mainly involved in the autophagy and ubiquitin-like protein ligase binding. Gene Set Enrichment Analysis (GSEA) analysis uncovered that the differentially expressed genes (DEGs) in the high-risk group partially participated in the ECM receptor interaction and other signaling pathways. Our results indicated that the risk score model based on the autophagy-related lncRNAs performed well in the prediction of prognosis for patients with GC.
Keywords: Gastric cancer; Prognosis; Autophagy; Nomogram; Long non-coding RNAs
Gastric cancer (GC) is the fifth most prevalent tumor and one of the deadliest carcinomas worldwide (Bray et al., 2018), among which 90% are adenocarcinomas (Crew and Neugut, 2006). Although there has been a stable decrease in GC occurrence and mortality rates globally over several decades after the beginning of the 19th century (Bosetti et al., 2013; Kamangar et al., 2006), GC remains a high case fatality rate of 75% throughout the world (Fock, 2014). Due to the insufficient understanding of the molecular mechanism (Rocken, 2017) and the lack of relevant clinical prediction systems (Jemal et al., 2011), most patients with GC have already been in the advanced stage when they are diagnosed (Schmidt et al., 2005), which brings great trouble to the patient’s survival (Verdecchia et al., 2007) and clinical therapy. Therefore, it is critical to construct an accurate prediction system for GC, which has the ability for early diagnosis and to prevent the disease before premalignant lesions have developed.
Autophagy is a highly conserved and evolutionarily ancient catabolic process that can degrade the misfolded proteins and damaged organelles (Mizushima, 2007). For the past few years, knowledge about the function of autophagy has developed. It has been found that autophagy participated in plenty of physiological processes in mammals, including quality control of proteins and organelles, immunity, nutrient deprivation, hypoxia, drug stimuli, stress, and prevention of neurodegeneration (Mizushima and Komatsu, 2011). Autophagy can also regulate biological process including apoptosis, protein synthesis, cell growth, and proliferation through the AMPK/mTOR pathway, PI3K/Akt/mTOR pathway, P53 pathway, and other signaling pathways (Chang et al., 2017; Ren et al., 2016; Zhao et al., 2015). Furthermore, the role of autophagy in the progression of carcinoma also has several breakthroughs.
The effect of autophagy is considered controversial in tumorigenesis, which can both promote and suppress cancer development under different cell types or stress modes (Glick et al., 2010). It is thought that autophagy prevented carcinogenesis (Aita et al., 1999; Liang et al., 1999). Nevertheless, once the tumor is established, increased autophagic flux often promotes tumor cell growth by providing energy and vital compounds upon various stress stimuli (White, 2012). Similarly, growing studies have also proved that autophagy had a significant effect on the GC.
The role of autophagy in GC is also complex and contradictory. Some research supported that autophagy was a tumor promoter in GC. Cause autophagy inhibitor will destroy the protective mechanism of GC cell and promotes cell death induced by therapeutic drugs (Li et al., 2017b; Maes et al., 2014; Maes et al., 2013). However, PD-L1 expression was also found enhanced by autophagy inhibition in GC (Wang et al., 2019b). Moreover, a study has shown that autophagy inducers such as AMPK inducers could be used in the GC treatment, which will lead to autophagic cell death of tumor cells (Shen et al., 2014).
In recent years, the relationship between long non-coding RNA (lncRNA) and autophagy has several breaks in the diagnosis, treatment, and prognosis of GC. Pieces of evidence showed that lncRNA is vital for the occurrence, prognosis, and chemoresistance of GC by regulating autophagy-related mRNA (Hu et al., 2017; Zhao et al., 2014; Zhu et al., 2019). Some studies have demonstrated that silencing of LINC01419 and CCAT2 promotes autophagy through constraining the PI3K/Akt1/mTOR pathway, thus inhibiting the invasion and migration of GC cells (Li et al., 2019; Yu et al., 2018). Another study also revealed that autophagy was associated with the proliferation of GC cells, partially due to the MALAT1 promoted by downregulating miR-204 (Shao et al., 2020). However, most of these experiments only explored the role of one or a few lncRNAs in the autophagy of GC and could not fully explain the relevant mechanisms.
To be concluded, the role of autophagy-related lncRNA in GC is complicated and controversial, which involves hundreds of molecules in this process. Therefore, a model consisted of multiple autophagy-related lncRNAs will have a better prognosis predicting accuracy than the single. For this purpose, we built a risk score model based on the multiple autophagy-related lncRNAs, which also performed well in the prediction of prognosis for the GC patients in the clinic.
Screening for the autophagy-associated lncRNAs
Autophagy-associated genes were obtained through the Human Autophagy Database (HADb, http://www.autophagy.lu/). Pearson correlation coefficient was calculated using the “limma” package from R (http://www.bioconductor.org) to determine the correlation between the expression of the lncRNAs and the corresponding autophagy-related genes. Then, lncRNAs with Pearson correlation coefficient > 0.3 and p < 0.001 were filtered out to be the autophagy-related lncRNAs.
All 350 patients’ data of STAD were downloaded from The Cancer Genome Atlas (TCGA) website (https://portal.gdc.cancer.gov/). All the data was submitted to R software and randomly separated into the training set and testing set.
Identification of the prognostic autophagy-related lncRNAs
Kaplan-Meier and univariate Cox regression analysis was applied to select the prognostic autophagy-related lncRNA in the TCGA-STAD dataset (P < 0.05).
Least absolute shrinkage and selection operator (LASSO) regression was adopted to build the model using the R package “glmnet” with prognostic autophagy-related lncRNAs selected before. In this process, only the most potent prognostic markers were chosen and constituted the optimal panel of prognosis that achieved the best performance. Each patient got a risk score (RS) incorporating the expression of the lncRNAs
Network construction and pathway analysis
The mRNA expression data of these GC patients were downloaded from the TCGA database. The mRNAs co-expressed with the lncRNAs in the risk score model were selected from the mRNA expression data by using the correlation test through the “limma” package (http://www.bioconductor.org) with R software (Pearson correlation coefficient > 0.3, p < 0.001). The network was constructed and visualized through Cytoscape software (https://cytoscape.org/). The Sankey diagram was built using the R software. The Gene Ontology (GO) and Kyoto Encyclopedia of Genes and Genomes (KEGG) analysis were performed using the “clusterProfiler” package of R software (Gene ratio > 0.05, p < 0.05). The signaling pathways that the differentially expressed genes (DEGs) mainly participated in between two types of risk groups were distinguished through Gene Set Enrichment Analysis (GSEA).
A nomogram was constructed through the “rms” package for R (https://cran.r-project.org/web/packages/rms/), combining the risk type and other clinical features including age, gender, stage, and TNM stage to predict the individual’s survival probability.
TCGA-STAD dataset was patients diagnosed with stomach adenocarcinoma, which consisted of a total of 350 patients. Kaplan-Meier survival curves were plotted for the TCGA-STAD dataset regarding major clinical features (Suppl. Fig. S1).
Selecting of prognostic autophagy-related LncRNA for TCGA-STAD dataset
The autophagy-related lncRNAs were obtained by using the correlation test of autophagy-related genes (Pearson correlation coefficient > 0.3, p < 0.001). A total of 24 autophagy-related lncRNAs were significantly correlated with the survival for TCGA-STAD through Kaplan-Meier and univariate Cox regression analysis (p < 0.05) (Fig. 1).
Construction of prognostic risk score model based on autophagy-related lncRNAs
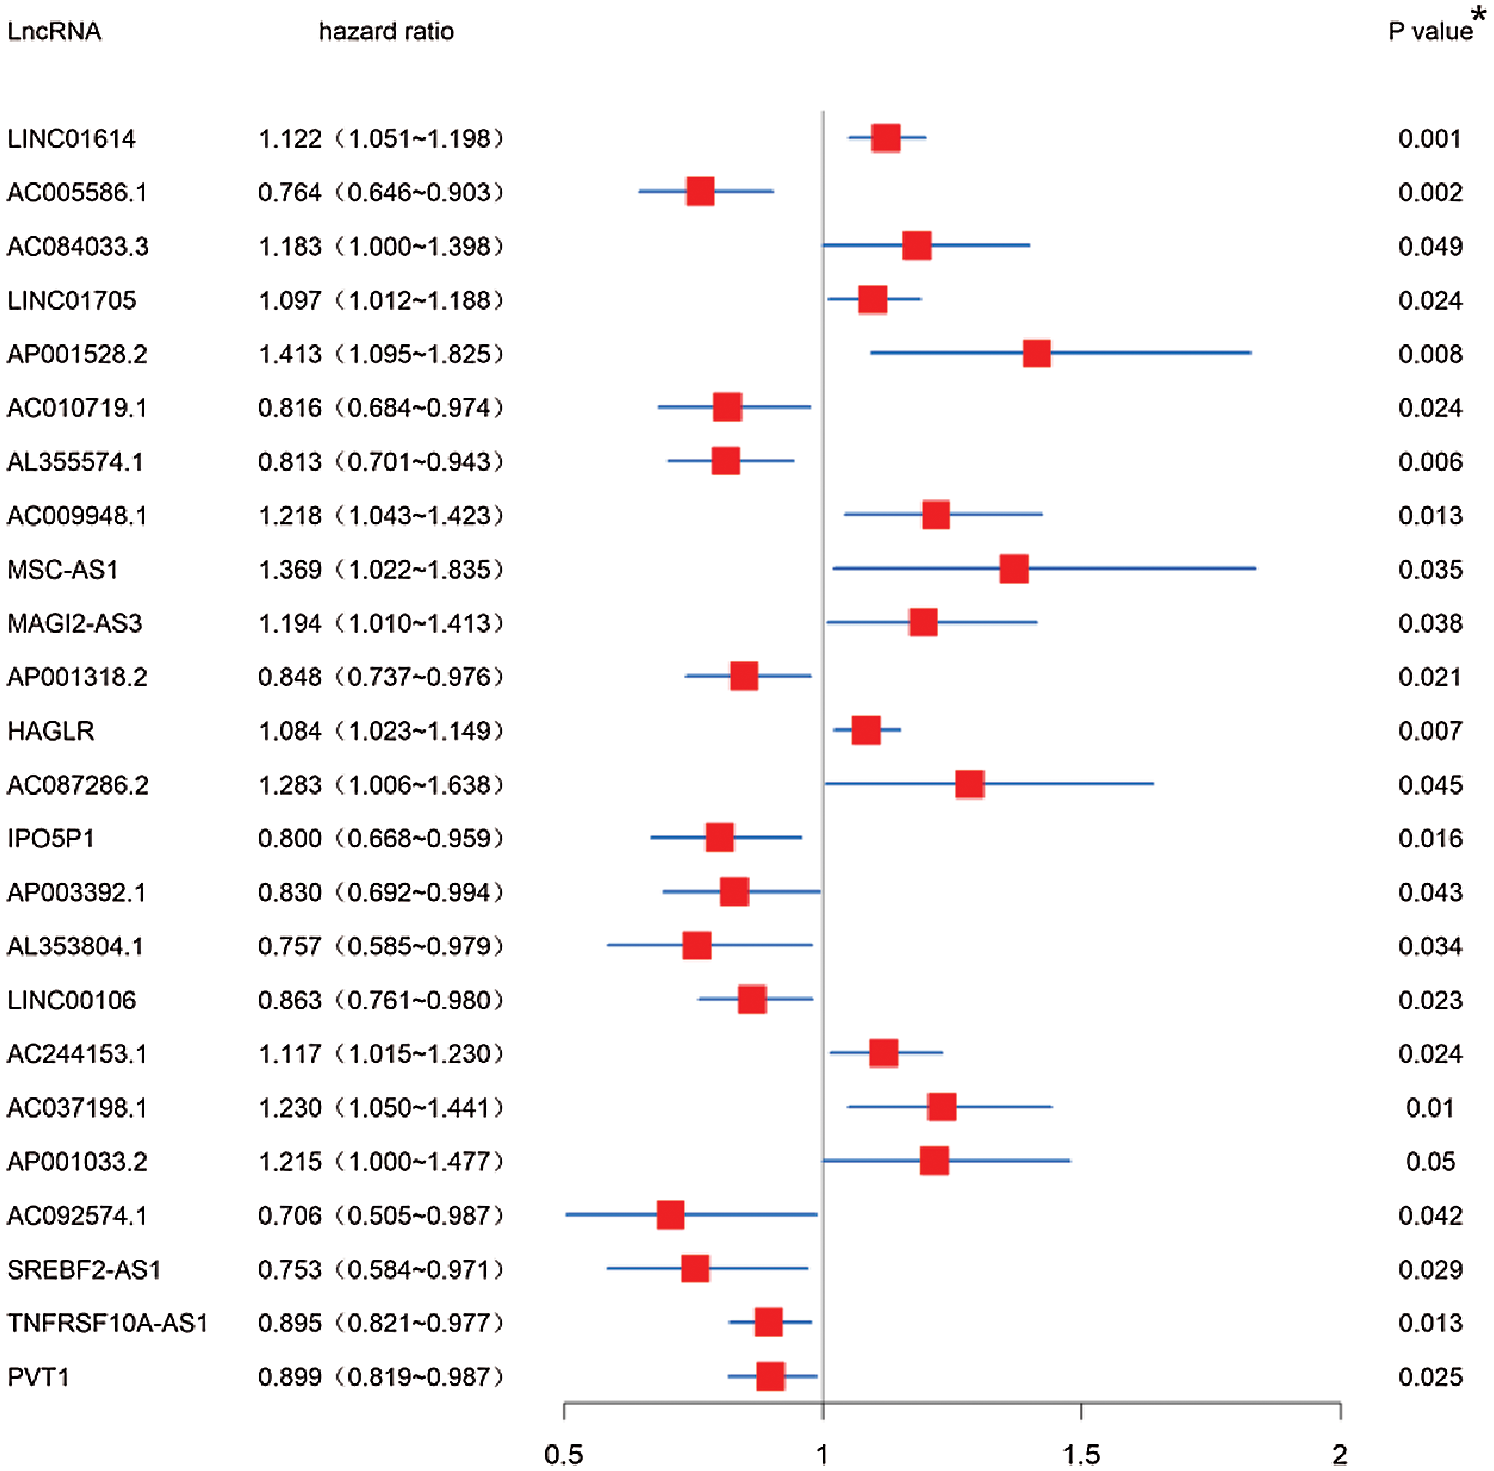
Figure 1: Screening of autophagy-related lncRNAs linked with the survival in GC. Forest plot of prognostic autophagy-related lncRNAs in TCGA-STAD dataset based on Kaplan-Meier and univariate Cox regression analysis. *p < 0.05.
All the patients from TCGA -STAD cohort were randomly separated into a training set and testing set (p > 0.05) (Tab. 1). Then all these 24 identified prognostic lncRNAs were analyzed with the LASSO regression analysis (Fig. 2A) and 3-fold positive cross-validation (Fig. 2B) in the training set. The regression coefficient was computed to select the optimal panel of prognosis. The model achieved the best performance while 11 autophagy-related lncRNAs were included. Combining the expression of the autophagy-related lncRNAs and LASSO coefficients (Tab. 2), each patient got an RS as a measure of survival risk.
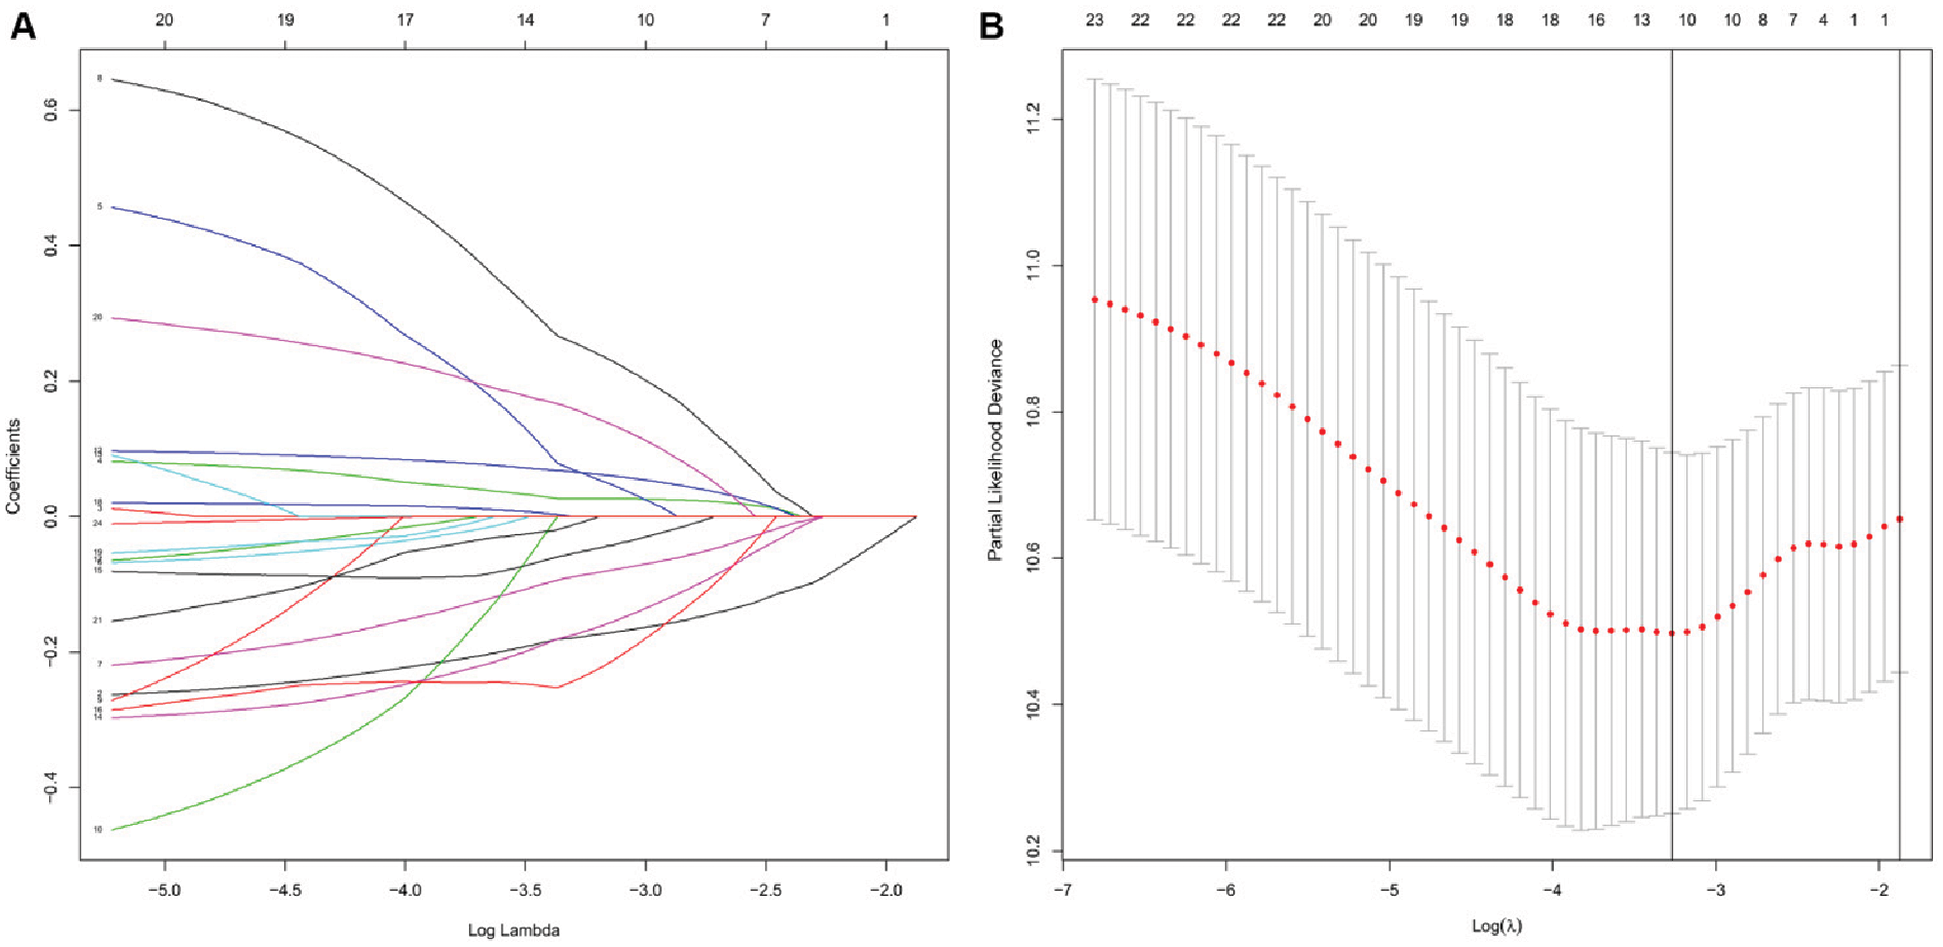
Figure 2: Construction of prognostic risk score model based on LASSO regression analysis. (A) Coefficient profile of each 24 prognostic autophagy-related lncRNA in the training set. (B) Selection of the optimal panel (lambda) for the model in the training set.


Validation of the risk score model for survival prediction in the training set, testing set and TCGA-STAD dataset
Based on the median RS, patients were divided into a high-risk group and a low-risk group. lncRNA AC005586.1, AL353804.1, IPO5P1, AP003392.1, AL355574.1 and AC092574.1 were considered as protective lncRNA (HR < 1, B < 0, LASSO coefficient < 0) while LINC01705, AP001528.2, AC009948.1, HAGLR and AP001033.2 were risk lncRNA (HR > 1, B > 0, LASSO coefficient > 0). The heatmap showed the LncRNA expression levels in the high-risk group and low-risk group in the training set (Fig. 3A), testing set (Fig. 3B), and TCGA-STAD dataset (Fig. 3C). As illustrated, the low-risk group tended to express protective lncRNA while the high-risk group was more likely to express risk lncRNA.
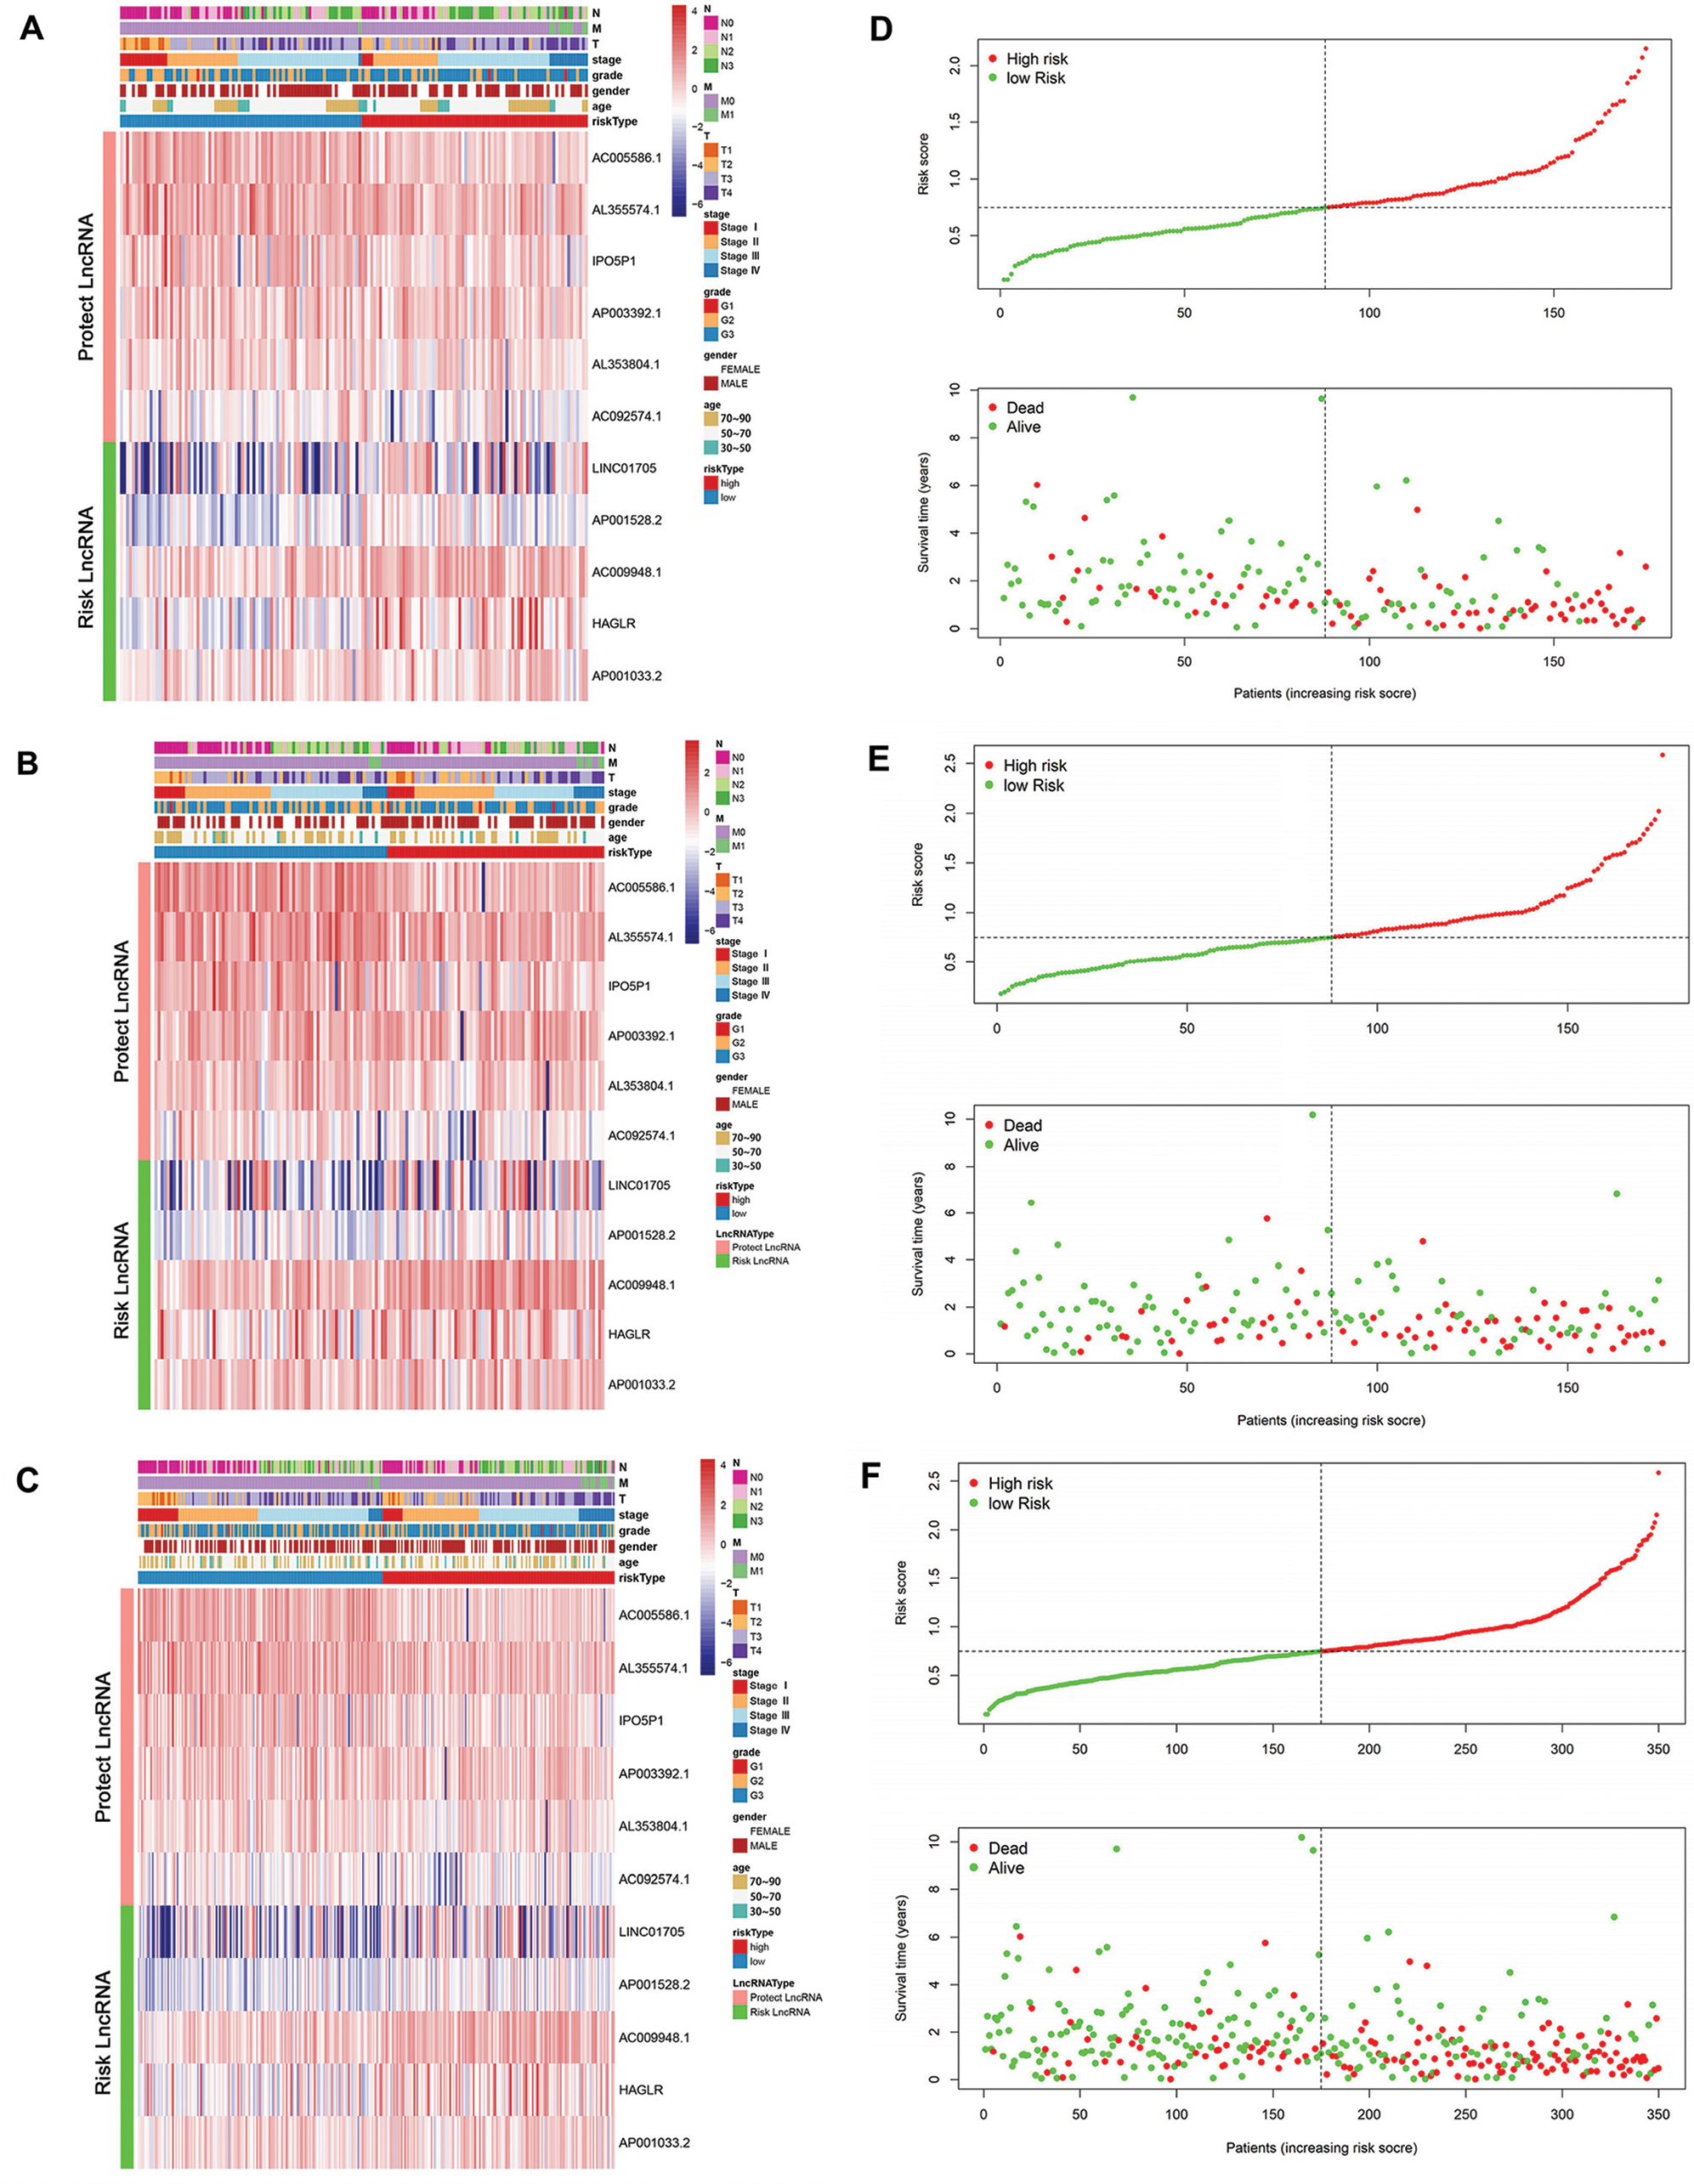
Figure 3: The link between clinical data and risk score. (A–C) Heatmap plot for the lncRNAs in the model in the training set, testing set, and TCGA-STAD dataset. (D–F) The relationship between the RS and survival time as well as status in the training set, testing set, and TCGA-STAD dataset.
The correlation between RS and survival time and status in STAD patients was also plotted in the training set (Fig. 3D), testing set (Fig. 3E), and TCGA-STAD dataset (Fig. 3F). In all these datasets, patients with higher RS tended to face a shorter survival time and worse survival status.
Multivariate Cox regression analysis was used to evaluate the independent prognostic indicators. The results of the multivariable analysis showed the RS was a robust and independent prognostic indicator in the training set (Fig. 4A), testing set (Fig. 4B), and TCGA-STAD dataset (Fig. 4C) (p < 0.05). Kaplan-Meier analysis was also conducted on the training set (Fig. 4D), testing set (Fig. 4E), and TCGA-STAD dataset (Fig. 4F). Distinctly, there is a strong and significant difference between the two types of risk groups (p < 0.0005). Furthermore, a ROC curve was adopted to appraise the accuracy of the model in the training set (Fig. 4G), testing set (Fig. 4H), and TCGA-STAD dataset (Fig. 4I). The area under the curve (AUC) was applied to evaluate the accuracy of the model’s prediction in 1-year, 3-year, and 5-year. The value of AUC prompts the model to predict well in prognostic prediction.
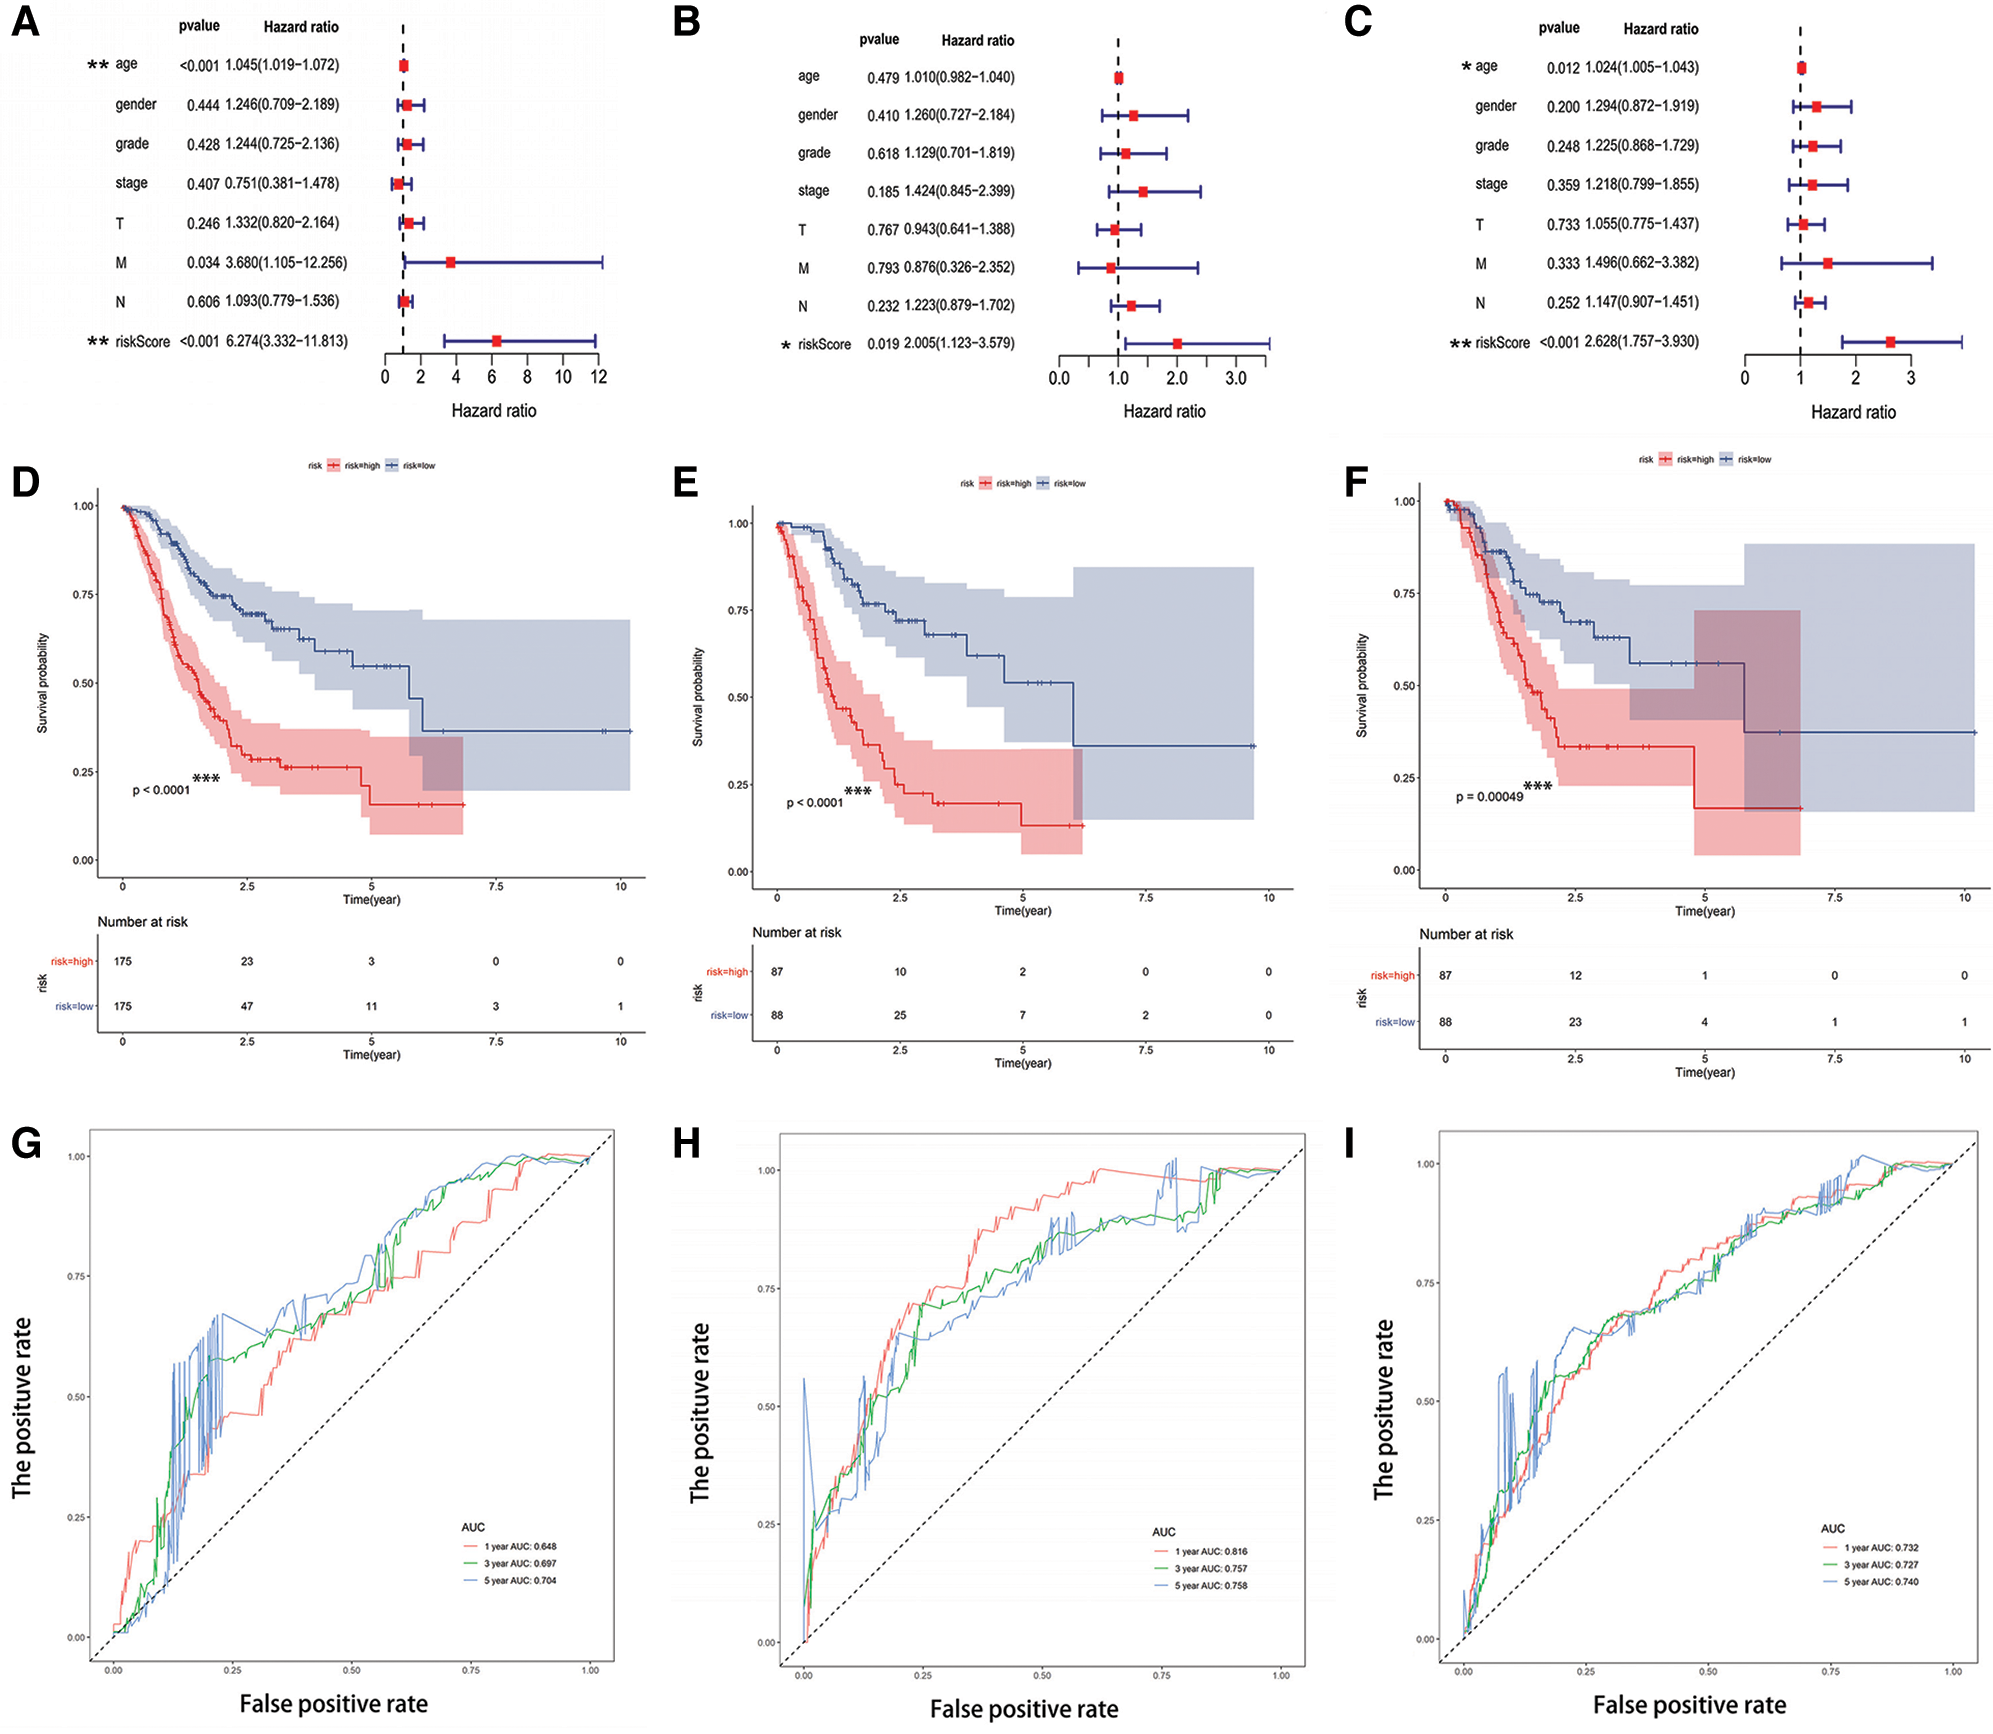
Figure 4: The risk score model performed well for survival prediction. (A–C) The RS was an independent prognostic predictor in the training set, testing set, and TCGA-STAD dataset. (D–F) Kaplan-Meier analysis based on risk type in the training set, testing set, and TCGA-STAD dataset. (G–I) The ROC curve and the value of AUC in 1-year, 3-year, and 5-year in the training set, testing set, and TCGA-STAD dataset. *p < 0.05, **p < 0.001, ***p < 0.0005.
Construction of the prognostic mRNA-LncRNA network and identification of involved signaling pathways
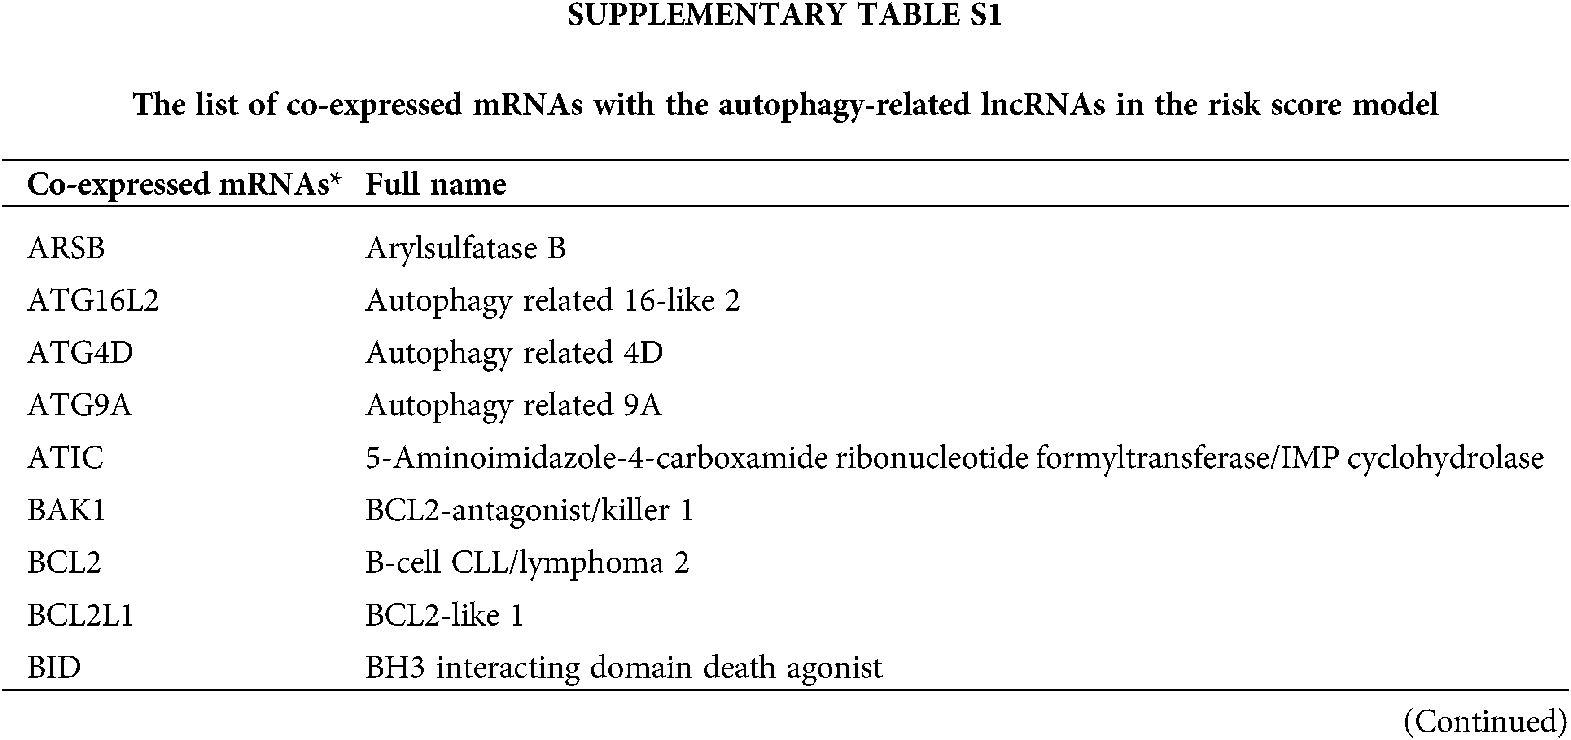
The mRNAs co-expressed with the lncRNAs in the model were obtained by using the correlation test with R (Suppl. Tab. S1). Then all these mRNAs and lncRNAs were used to construct the prognostic mRNA-lncRNA interaction network (Figs. 5A–5B). The most significant GO terms for biological process (BP) (Fig. 5C), cellular component (CC) (Fig. 5D), and molecular function (MF) (Fig. 5E), as well as KEGG pathways (Fig. 5F), were analyzed to reveal potential biological functions of the mRNAs in the network (Gene ratio >0.05, p < 0.05). The results showed that the mRNAs in the network were mainly involved in autophagy both in GO and KEGG analysis. GSEA analysis uncovered that the DEGs were significantly enriched in several common signaling pathways (Tab. 3).
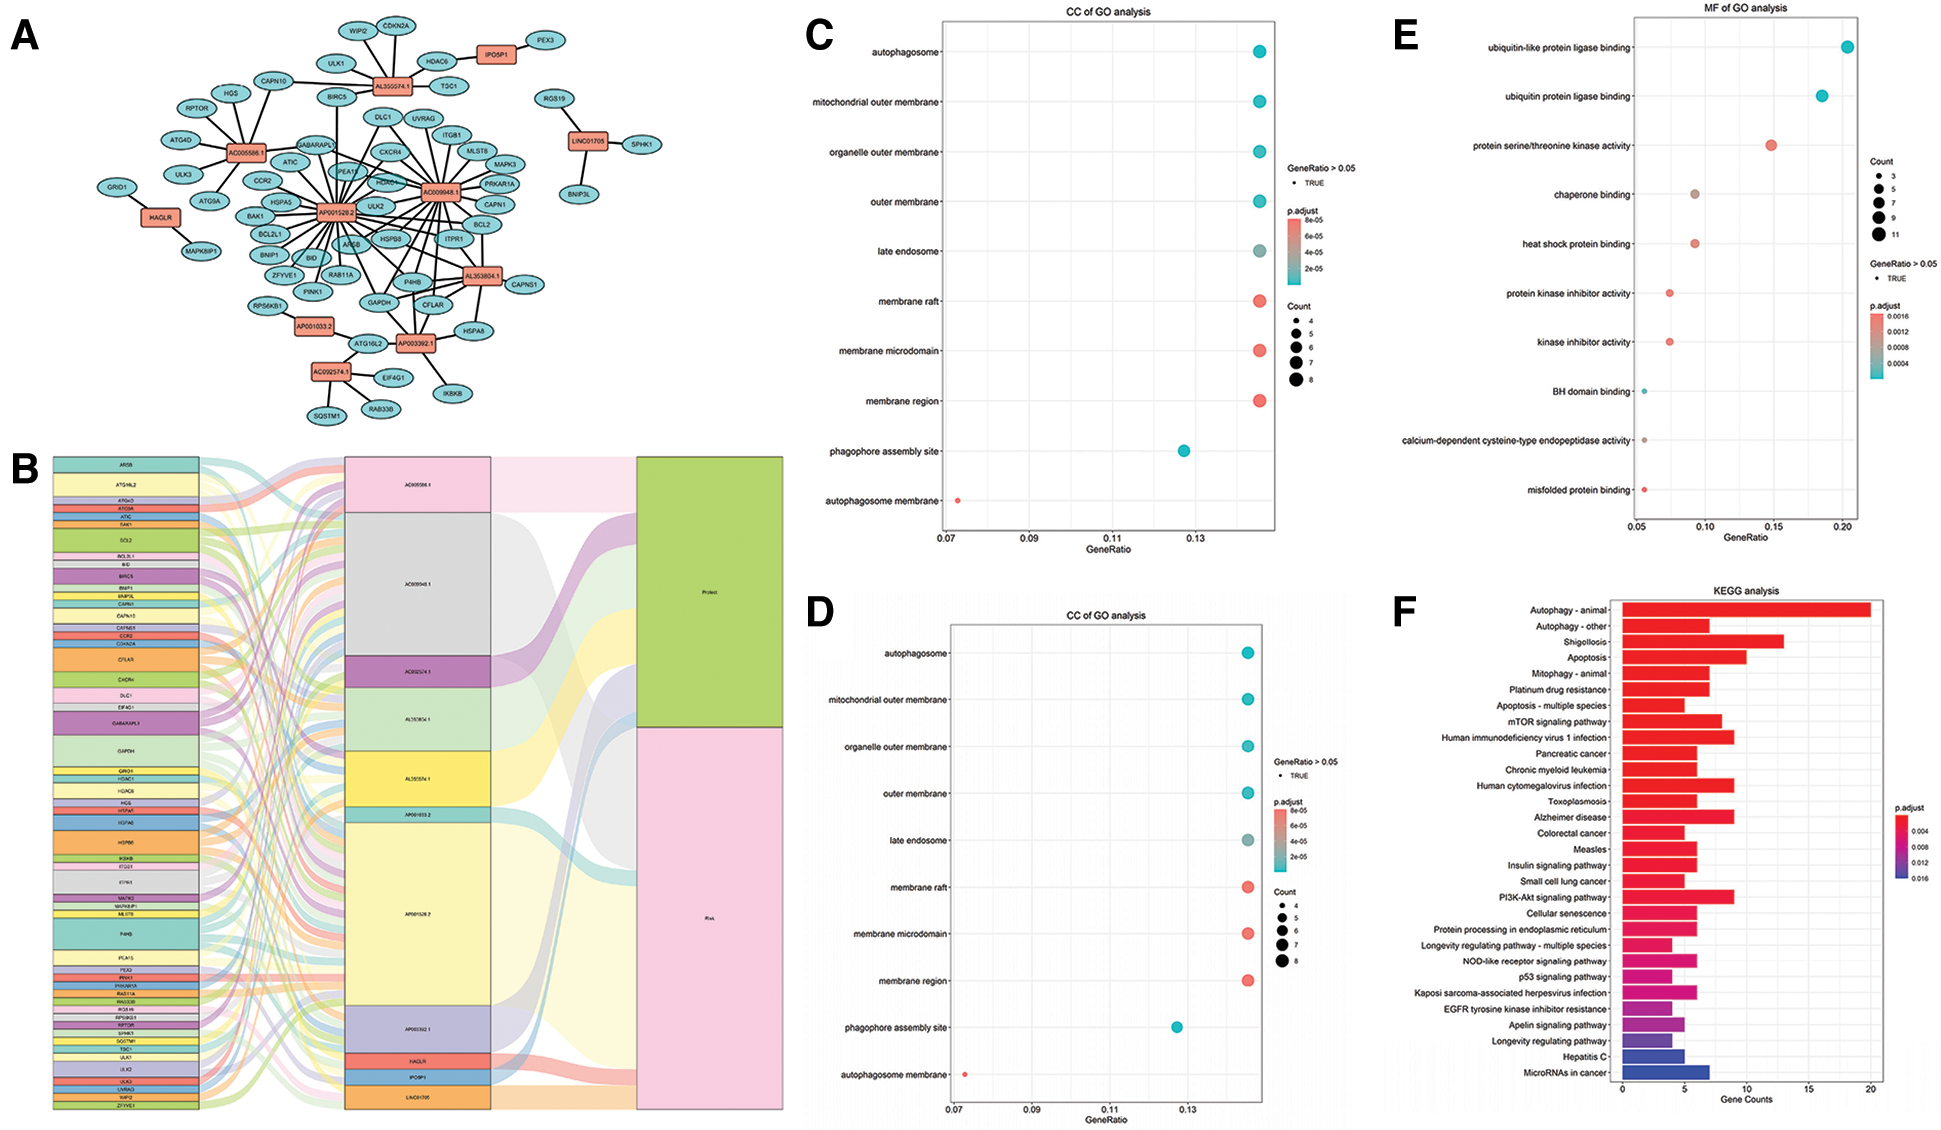
Figure 5: Construction of the prognostic mRNA-LncRNA interaction network and identification of involved signaling pathways. (A) The prognostic network based on the lncRNAs in the risk score model and the co-expressed mRNAs. (B) The Sankey diagram based on the prognostic network. (C–E) BP, CC, and MF of GO analysis for the mRNAs in the network. (F) KEGG analysis of the mRNAs in the network.

Nomograms for personalized prognostic prediction in STAD patients
A nomogram incorporating the risk type and clinical characters was built to estimate individual survival probability quantitatively of STAD patients. The concordance index (C-index) of the nomogram was 0.682. The plot showed the 1-year, 3-year, and 5-year survival probabilities in the TCGA-STAD dataset (Fig. 6).
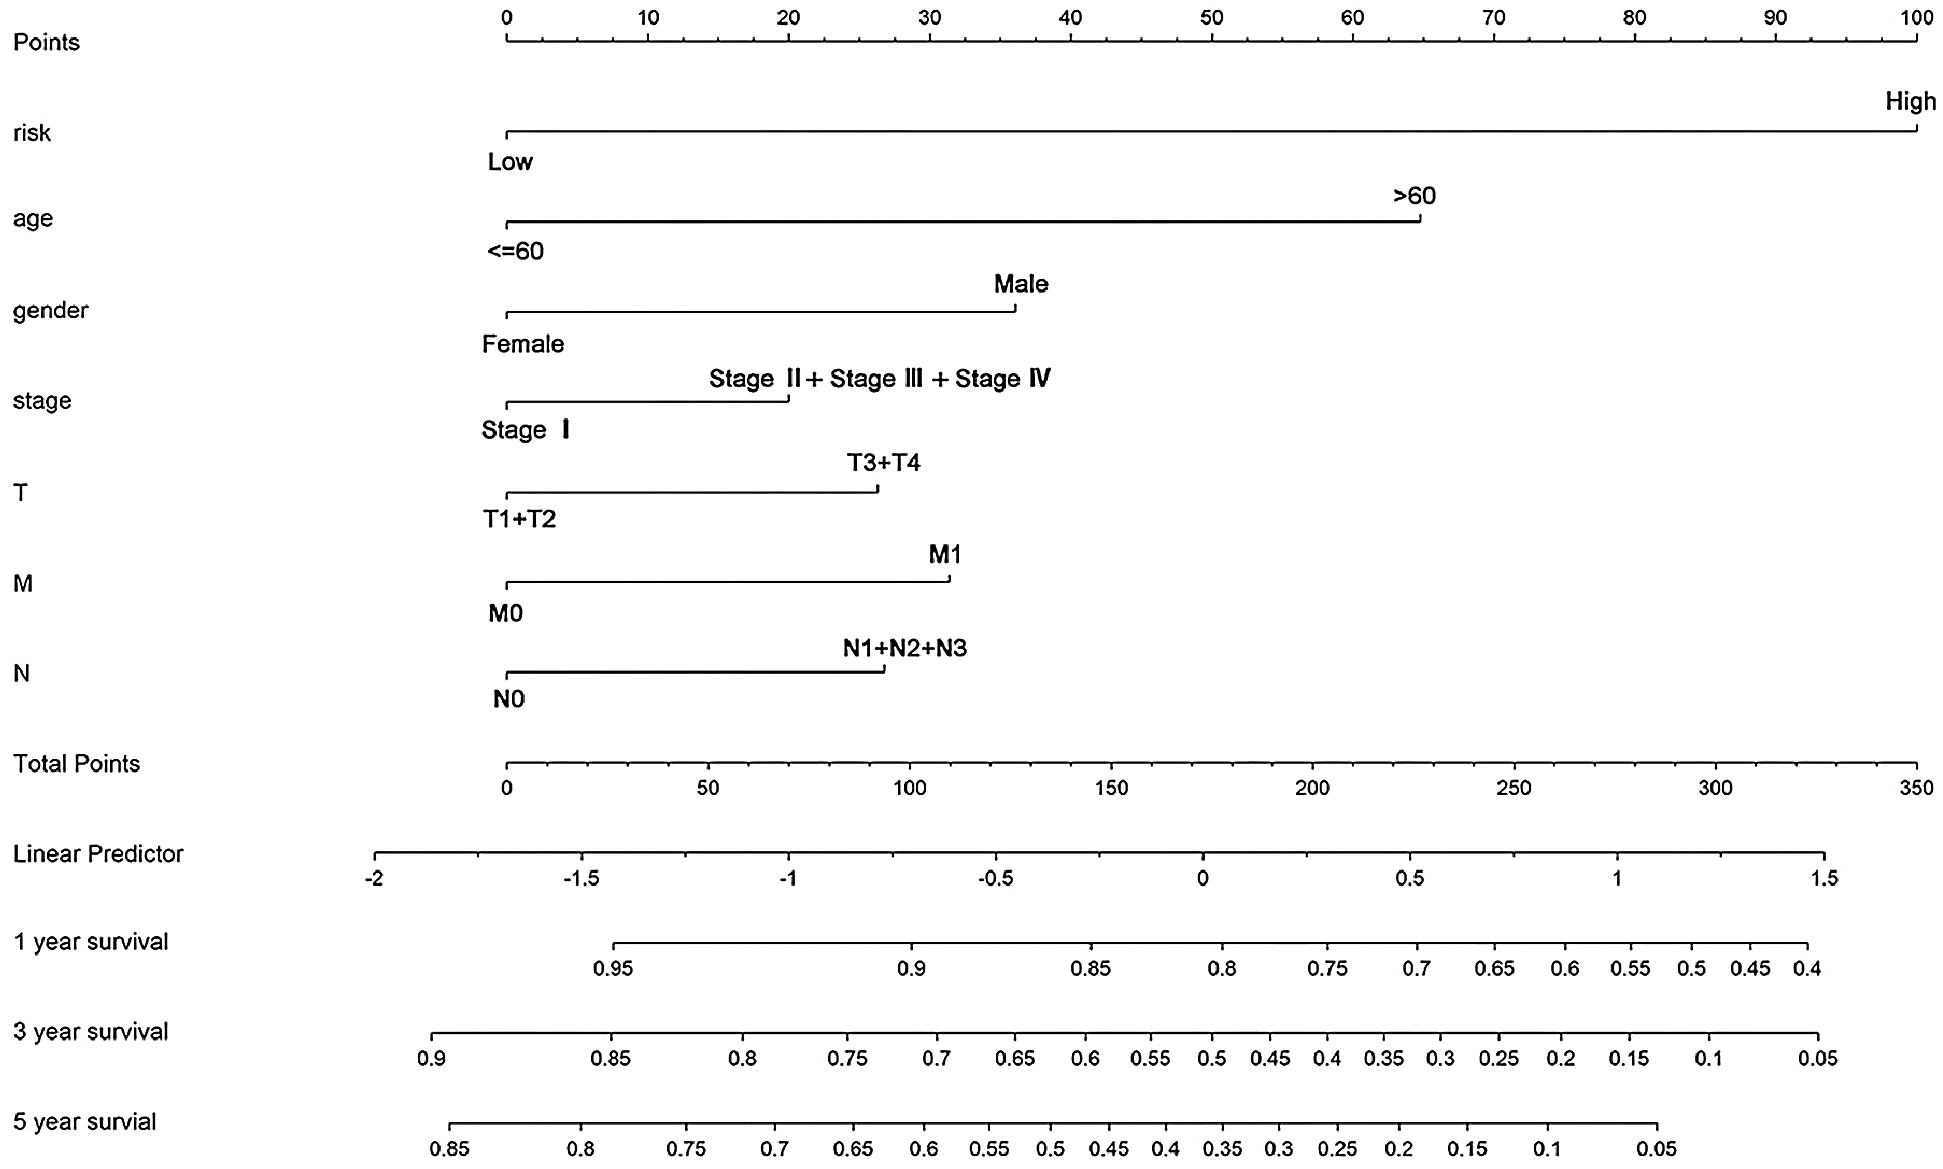
Figure 6: The nomogram for predicting an individual’s survival rates in the TCGA-STAD dataset. The nomogram is incorporated with the risk type and clinical features to predict personalized survival probabilities in 1-year, 3-year, and 5-year.
Autophagy is a self-degradative process that plays an essential role in equilibrating energy, eliminating misfolded or aggregated proteins, and reacting to stimuli (Ravanan et al., 2017). To date, three types of autophagy have been found: macroautophagy, microautophagy, and chaperone-mediated autophagy (Mizushima and Komatsu, 2011). Macroautophagy is considered the main form of autophagy, which is extensively studied compared to the other two types (Munz, 2017; Nishida et al., 2016; Wen and Klionsky, 2016). The process of autophagy is also classified into four critical steps: initiation, nucleation, maturation, and degradation (Feng et al., 2014). In the past decades, researchers have discovered 32 autophagy-related genes (Atgs) in yeast, most of which are also highly conserved in mammals significantly (Nakatogawa et al., 2009).
In recent years, some studies have reported that autophagy has a strong relationship between the prognosis and survival in GC. Qu et al. (2017) found that Beclin1 (protein homolog of the yeast ATG6) was much overexpressed in malignant tissues than the nonmalignant tissues in GC. Moreover, they also found that overexpression of Beclin1 was related to a poor prognosis for GC. Liao et al. (2014) discovered that the “stone-like” structure pattern of LC3A (an autophagosomal biomarker) was correlated with increased recurrence and worse survival possibilities in gastric carcinoma.
As recognized previously, lncRNAs such as H19 and HOTAIR played a key role as primary regulators in the carcinogenesis of GC (Cheng et al., 2018; Endo et al., 2013; Okugawa et al., 2014). Until now, numerous studies have proved that lncRNAs were highly active in plenty of pathological processes of GC, such as proliferation and metastasis. Among them, some lncRNAs were defined as protective factors while others were risk factors (Fanelli et al., 2018; Guo et al., 2014; Li et al., 2017a; Ma et al., 2016; Zhu et al., 2019). Furthermore, several studies have proved that lncRNAs participated in the progression, especially malignant progression of GC through regulating autophagy-related mRNAs (Chen et al., 2018; Shao et al., 2020; Wang et al., 2019a; Hu et al., 2017; Yu et al., 2018; Zhao et al., 2014; Zhu et al., 2019).
Although numerous studies have been performed and much is known about lncRNAs and autophagy in GC, previous studies mainly focused on the single lncRNA. The prognostic system that relied on the multiple autophagy-related lncRNAs is still not clear. More importantly, as one of the deadliest cancers all over the world, prognosis evaluation of patients with GC still depends too much on the pathological analysis currently, which also facing many challenges and inconvenience in the clinic.
In this study, we systematically analyzed the prognostic value of autophagy-related lncRNAs in GC using bioinformatics and statistical tools with R software. A total of 24 lncRNAs was found strongly linked with the survival of TCGA-STAD based on Kaplan-Meier and univariate Cox regression analysis. We used the LASSO regression analysis to build the model in the training set and found 11 prognostic signatures of lncRNAs. The RS was calculated by integrating lncRNAs expression levels and corresponding LASSO coefficients for each patient. AC005586.1, AL353804.1, IPO5P1, AP003392.1, AL355574.1 and AC092574.1 were considered as protective lncRNA while LINC01705, AP001528.2, AC009948.1, HAGLR, and AP001033.2 were risk lncRNA. The accuracy of the model was tested in the testing set, and the TCGA-STAD dataset and the RS were found to significantly correspond with patient outcomes in both the testing set and TCGA-STAD dataset.
GO analysis revealed that the mRNAs in the prognostic network were mainly involved in autophagy, which is consistent with the expected results. The MF of GO analysis uncovered that these mRNAs also had a link with ubiquitin or ubiquitin-like protein ligase binding. Ubiquitin (Ub) is a protein highly conserved in all eukaryotes and bears many potential sites for additional post-translational modifications (Komander and Rape, 2012). Ub was one of the most prominent factors in modifying protein substrates and degradation (Zheng and Shabek, 2017). The proteolytic system based on ubiquitin and autophagy is two prime systems in eukaryotic cells (Ciechanover, 2015; Ciechanover and Kwon, 2017). Studies have shown that ubiquitin, as a capital regulator, has participated in all processes in the autophagy flux (McEwan and Dikic, 2011). Atg8 was a ubiquitin-like protein, which was also found crucial for the autophagosome formation and consisted of the lipid conjugation system in autophagy (Nakatogawa et al., 2007).
KEGG analysis uncovered that the mRNAs were primarily involved in the apoptosis, mTOR pathway, p53 pathway, and PI3K-Akt pathway. There are two types of autophagy-related signaling pathways. One is the mTOR-dependent pathway, such as the AMPK/mTOR and PI3K/Akt/mTOR pathways, and the other is the non-mTOR-dependent pathway, such as the p53 pathway (Cao et al., 2019). The PI3K/AKT/mTOR pathway regulates many biological processes, including autophagy, and is frequently activated in various human cancers (Aoki and Fujishita, 2017). The molecular changes in the PI3K/Akt/mTOR signaling pathway were also found could increase the clinical stage and promote the recurrence in carcinoma (Aoki and Fujishita, 2017; Morgan et al., 2009). In GC, PI3K/Akt/mTOR activation was found significantly upregulated in GC cells, which results in the inhibition of autophagy of GC cells (Morgan et al., 2009). Additionally, inhibition of the PI3K/Akt/mTOR pathway increased the autophagic flux and promoted the apoptosis of cancer cells (Saiki et al., 2011).
The results of the GSEA analysis showed that the high-risk group was much active in the ECM receptor interaction. Some studies indicated that autophagy affected the extracellular matrix (ECM), thus participating in the invasiveness and metastasis of cancer cells. In a rapidly growing and aggressive tumor, biosynthesis is obviously highly demanded. And in this process, detachment-induced autophagy will help the cancer cells get rid of ECM contact and promoting the metastasis subsequently during the advanced cancer stage (Guadamillas et al., 2011; Lock and Debnath, 2008). Autophagy will also induce metastatic cancer cells to hibernation if a steady connection was not established between the new ECM microenvironment and the cancer cells (Lu et al., 2008; Su et al., 2015).
At last, we constructed a nomogram combining the risk type and other clinical features, including age, gender, stage, and TNM stage, which can predict an individual’s clinical outcome quantitatively. By using the nomogram, every patient will get total points based on his or her various indicators, respectively. The total points will predict the patient’s survival probability in 1, 3-, and 5-year. Obviously, the higher the total points are, the lower the survival probability is.
In conclusion, we identified a prognostic risk score model consisted of 11 autophagy-related lncRNAs based on the TCGA-STAD dataset. This model was an independent predictor and performed well for prognosis in the training set, testing set, and TCGA-STAD dataset. A nomogram incorporating the model and clinical features could accurately predict the survival rate for individual GC patients. Our finding suggests that the 11-autophagy lncRNA risk score model may help facilitate individual prediction of a patient’s prognosis with GC in the clinic.
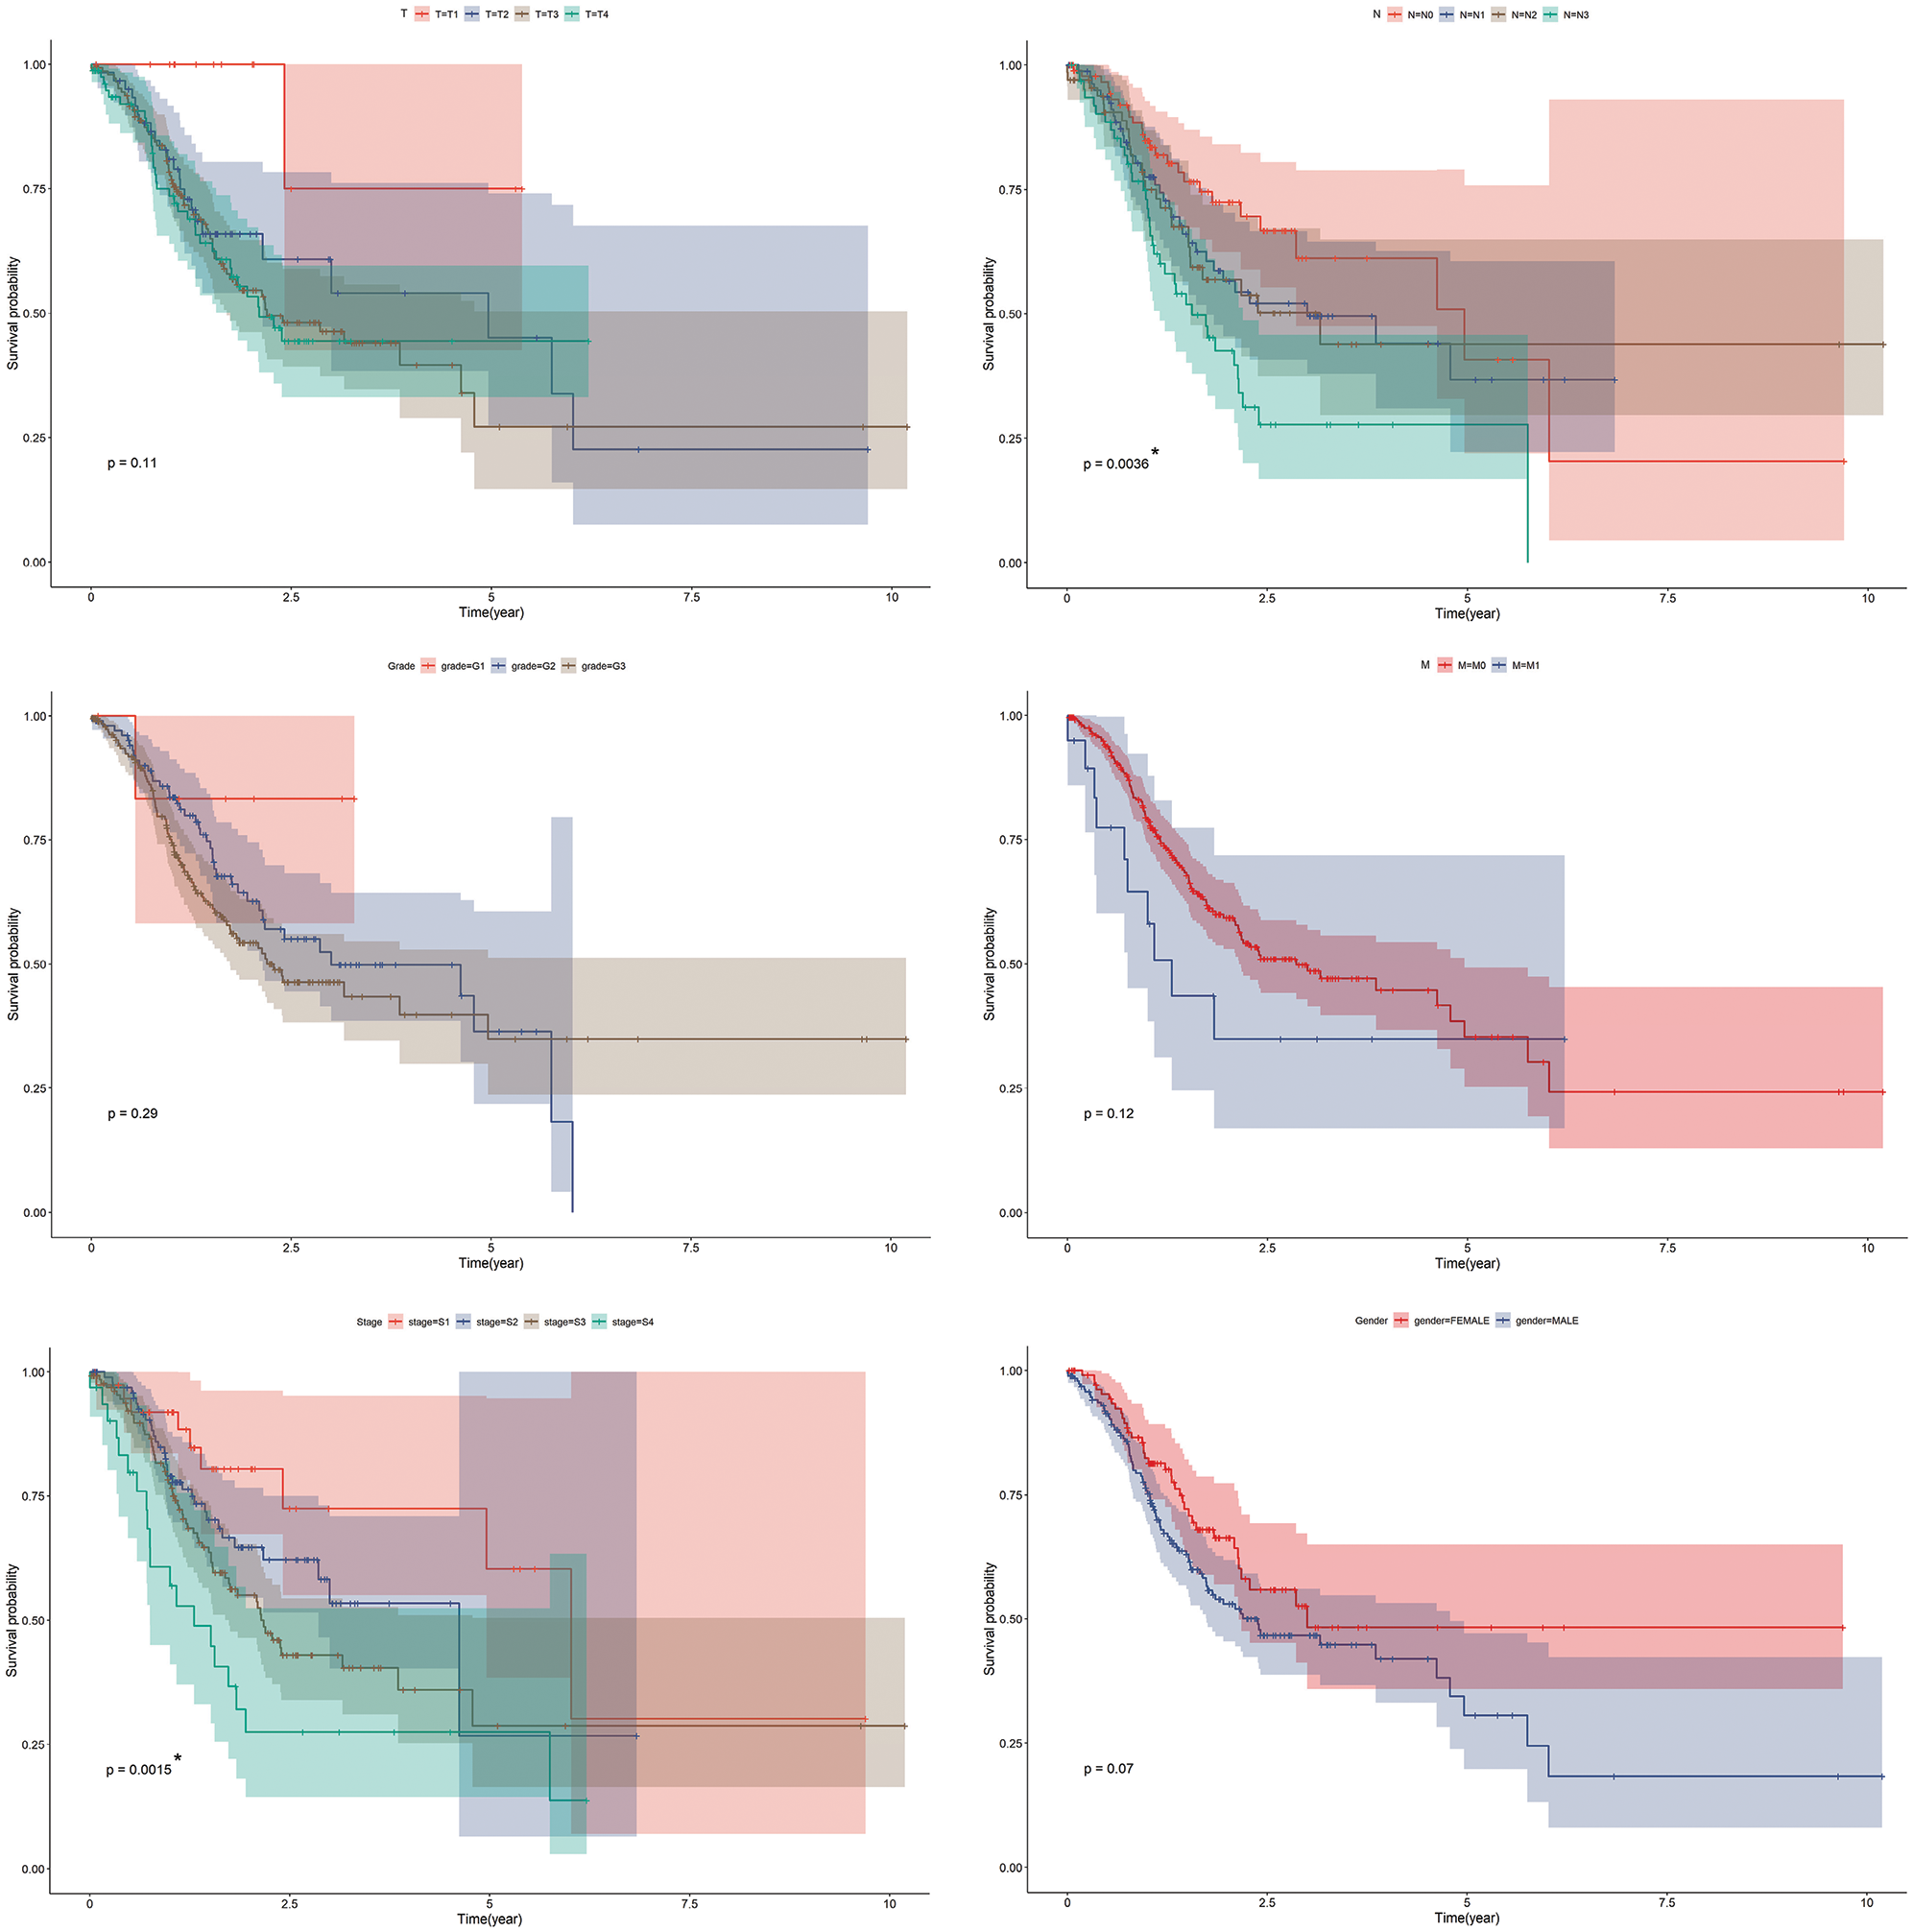
SUPPLEMENTARY FIGURE S1: Kaplan-Meier survival curves for TCGA-STAD dataset. Kaplan-Meier survival analysis regarding prime clinical features in GC. *p < 0.05.
Availability of Data and Materials: The datasets used and/or analysed during the current study are available from the corresponding author on reasonable request.
Author Contribution: The authors confirm contribution to the paper as follows: study conception and design: Bo Chen, Xin Xu and Mengqiu Cheng; data collection: Xin Xu, Wei Cao; analysis and interpretation of results: Mengqiu Cheng, Bo Chen, Guodong Cao; draft manuscript preparation: Mengqiu Cheng, Xin Xu. All authors reviewed the results and approved the final version of the manuscript.
Funding Statement: This work was supported by grants from Quality Engineering Project of Anhui Province (Nos. 2020jyxm0898; 2020jyxm0910; 2019kfkc334), Clinical research project of Anhui Medical University (No. 2020xkj176) and Soft health science research of Anhui province-Major project (No. 2020WR01003).
Conflicts of Interest: The authors declare that they have no conflict of interest.
Aita VM, Liang XH, Murty VVVS, Pincus DL, Yu W, Cayanis E, Kalachikov S, Gilliam TC, Levine B (1999). Cloning and genomic organization of beclin 1, a candidate tumor suppressor gene on chromosome 17q21. Genomics 59: 59–65. DOI 10.1006/geno.1999.5851. [Google Scholar] [CrossRef]
Aoki M, Fujishita T (2017). Oncogenic roles of the PI3K/AKT/mTOR Axis. In: Hunter E, Bister K (eds.Viruses, Genes, and Cancer. Current Topics in Microbiology and Immunology, vol. 407, pp. 153–189. Cham: Springer. [Google Scholar]
Bosetti C, Bertuccio P, Malvezzi M, Levi F, Chatenoud L, Negri E, La Vecchia C (2013). Cancer mortality in Europe, 2005–2009, and an overview of trends since 1980. Annals of Oncology 24: 2657–2671. DOI 10.1093/annonc/mdt301. [Google Scholar] [CrossRef]
Bray F, Ferlay J, Soerjomataram I, Siegel RL, Torre LA, Jemal A (2018). Global cancer statistics 2018: GLOBOCAN estimates of incidence and mortality worldwide for 36 cancers in 185 countries. CA: A Cancer Journal for Clinicians 68: 394–424. DOI 10.3322/caac.21492. [Google Scholar] [CrossRef]
Cao Y, Luo Y, Zou J, Ouyang J, Cai Z, Zeng X, Ling H, Zeng T (2019). Autophagy and its role in gastric cancer. Clinica Chimica Acta 489: 10–20. DOI 10.1016/j.cca.2018.11.028. [Google Scholar] [CrossRef]
Chang CH, Lee CY, Lu CC, Tsai FJ, Hsu YM, Tsao JW, Juan YN, Chiu HY, Yang JS, Wang CC (2017). Resveratrol-induced autophagy and apoptosis in cisplatin-resistant human oral cancer CAR cells: A key role of AMPK and Akt/mTOR signaling. International Journal of Oncology 50: 873–882. DOI 10.3892/ijo.2017.3866. [Google Scholar] [CrossRef]
Chen JF, Wu P, Xia R, Yang J, Huo XY, Gu DY, Tang CJ, De W, Yang F (2018). STAT3-induced lncRNA HAGLROS overexpression contributes to the malignant progression of gastric cancer cells via mTOR signal-mediated inhibition of autophagy. Molecular Cancer 17: 1298. DOI 10.1186/s12943-017-0756-y. [Google Scholar] [CrossRef]
Cheng C, Qin Y, Zhi Q, Wang J, Qin C (2018). Knockdown of long non-coding RNA HOTAIR inhibits cisplatin resistance of gastric cancer cells through inhibiting the PI3K/Akt and Wnt/beta-catenin signaling pathways by up-regulating miR-34a. International Journal of Biological Macromolecules 107: 2620–2629. DOI 10.1016/j.ijbiomac.2017.10.154. [Google Scholar] [CrossRef]
Ciechanover A (2015). The unravelling of the ubiquitin system. Nature Reviews Molecular Cell Biology 16: 322–324. DOI 10.1038/nrm3982. [Google Scholar] [CrossRef]
Ciechanover A, Kwon YT (2017). Protein quality control by molecular chaperones in neurodegeneration. Frontiers in Neuroscience 11: 2491. DOI 10.3389/fnins.2017.00185. [Google Scholar] [CrossRef]
Crew KD, Neugut AI (2006). Epidemiology of gastric cancer. World Journal of Gastroenterology 12: 354–362. DOI 10.3748/wjg.v12.i3.354. [Google Scholar] [CrossRef]
Endo H, Shiroki T, Nakagawa T, Yokoyama M, Tamai K, Yamanami H, Fujiya T, Sato I, Yamaguchi K, Tanaka N, Iijima K, Shimosegawa T, Sugamura K, Satoh K (2013). Enhanced expression of long non-coding RNA HOTAIR is associated with the development of gastric cancer. PLoS One 8: e77070. DOI 10.1371/journal.pone.0077070. [Google Scholar] [CrossRef]
Fanelli GN, Gasparini P, Coati I, Cui R, Pakula H, Chowdhury B, Valeri N, Loupakis F, Kupcinskas J, Cappellesso R, Fassan M (2018). LONG-NONCODING RNAs in gastroesophageal cancers. Non-coding RNA Research 3: 195–212. DOI 10.1016/j.ncrna.2018.10.001. [Google Scholar] [CrossRef]
Feng Y, He D, Yao Z, Klionsky DJ (2014). The machinery of macroautophagy. Cell Research 24: 24–41. DOI 10.1038/cr.2013.168. [Google Scholar] [CrossRef]
Fock KM (2014). Review article: the epidemiology and prevention of gastric cancer. Alimentary Pharmacology & Therapeutics 40: 250–260. DOI 10.1111/apt.12814. [Google Scholar] [CrossRef]
Glick D, Barth S, Macleod KF (2010). Autophagy: cellular and molecular mechanisms. Journal of Pathology 221: 3–12. DOI 10.1002/path.2697. [Google Scholar] [CrossRef]
Guadamillas MC, Cerezo A, Del Pozo MA (2011). Overcoming anoikis-pathways to anchorage-independent growth in cancer. Journal of Cell Science 124: 3189–3197. DOI 10.1242/jcs.072165. [Google Scholar] [CrossRef]
Guo X, Xia J, Deng K (2014). Long non-coding RNAs: emerging players in gastric cancer. Tumor Biology 35: 10591–10600. DOI 10.1007/s13277-014-2548-y. [Google Scholar] [CrossRef]
Hu YR, Yu YC, You SW, Li KQ, Tong XC et al. (2017). Long noncoding RNA MALAT1 regulates autophagy associated chemoresistance via miR-23b-3p sequestration in gastric cancer. Molecular Cancer 16: 5. DOI 10.1186/s12943-017-0743-3. [Google Scholar] [CrossRef]
Jemal A, Bray F, Center MM, Ferlay J, Ward E, Forman D (2011). Global cancer statistics. CA: A Cancer Journal for Clinicians 61: 69–90. DOI 10.3322/caac.20107. [Google Scholar] [CrossRef]
Kamangar F, Dores GM, Anderson WF (2006). Patterns of cancer incidence, mortality, and prevalence across five continents: defining priorities to reduce cancer disparities in different geographic regions of the world. Journal of Clinical Oncology 24: 2137–2150. DOI 10.1200/JCO.2005.05.2308. [Google Scholar] [CrossRef]
Komander D, Rape M (2012). The ubiquitin code. Annual Review of Biochemistry 81: 203–229. DOI 10.1146/annurev-biochem-060310-170328. [Google Scholar] [CrossRef]
Li H, Wei Z, Wang C, Chen W, He Y, Zhang C (2019). Gender differences in gastric cancer survival: 99,922 cases based on the SEER database. Journal of Gastrointestinal Surgery 64: 9. DOI 10.1007/s11605-019-04304-y. [Google Scholar] [CrossRef]
Li H, Zhu H, Zhou Y, Wang H, Niu Z, Shen Y, Lv L (2017a). Long non-coding RNA MSTO2P promotes the proliferation and colony formation in gastric cancer by indirectly regulating miR-335 expression. Tumor Biology 39: 1010428317705506. DOI 10.1177/1010428317705506. [Google Scholar] [CrossRef]
Li W, Zhou Y, Yang J, Li H, Zhang H, Zheng P (2017b). Curcumin induces apoptotic cell death and protective autophagy in human gastric cancer cells. Oncology Reports 37: 3459–3466. DOI 10.3892/or.2017.5637. [Google Scholar] [CrossRef]
Liang XH, Jackson S, Seaman M, Brown K, Kempkes B, Hibshoosh H, Levine B (1999). Induction of autophagy and inhibition of tumorigenesis by beclin 1. Nature 402: 672–676. DOI 10.1038/45257. [Google Scholar] [CrossRef]
Liao W, Sun L, Wang C, Huang H, Liu J, Liao W, Shi M (2014). LC3A-positive “stone-like” structures predict an adverse prognosis of gastric cancer. Anatomical Record 297: 653–662. DOI 10.1002/ar.22895. [Google Scholar] [CrossRef]
Lock R, Debnath J (2008). Extracellular matrix regulation of autophagy. Current Opinion in Cell Biology 20: 583–588. DOI 10.1016/j.ceb.2008.05.002. [Google Scholar] [CrossRef]
Lu Z, Luo RZ, Lu Y, Zhang X, Yu Q, Khare S, Kondo S, Kondo Y, Yu Y, Mills GB, Liao WS, Bast RC, Jr (2008). The tumor suppressor gene ARHI regulates autophagy and tumor dormancy in human ovarian cancer cells. Journal of Clinical Investigation 120: 159. DOI 10.1172/JCI35512. [Google Scholar] [CrossRef]
Ma Y, Liu L, Yan F, Wei W, Deng J, Sun J (2016). Enhanced expression of long non-coding RNA NEAT1 is associated with the progression of gastric adenocarcinomas. World Journal of Surgical Oncology 14: 192. DOI 10.1186/s12957-016-0799-3. [Google Scholar] [CrossRef]
Maes H, Kuchnio A, Peric A, Moens S, Nys K, De Bock K, Quaegebeur A, Schoors S, Georgiadou M, Wouters J, Vinckier S, Vankelecom H, Garmyn M, Vion AC, Radtke F, Boulanger C, Gerhardt H, Dejana E, Dewerchin M, Ghesquière B, Annaert W, Agostinis P, Carmeliet P (2014). Tumor vessel normalization by chloroquine independent of autophagy. Cancer Cell 26: 190–206. DOI 10.1016/j.ccr.2014.06.025. [Google Scholar] [CrossRef]
Maes H, Rubio N, Garg AD, Agostinis P (2013). Autophagy: shaping the tumor microenvironment and therapeutic response. Trends in Molecular Medicine 19: 428–446. DOI 10.1016/j.molmed.2013.04.005. [Google Scholar] [CrossRef]
McEwan DG, Dikic I (2011). The Three Musketeers of Autophagy: phosphorylation, ubiquitylation and acetylation. Trends in Cell Biology 21: 195–201. DOI 10.1016/j.tcb.2010.12.006. [Google Scholar] [CrossRef]
Mizushima N (2007). Autophagy: process and function. Genes & Development 21: 2861–2873. DOI 10.1101/gad.1599207. [Google Scholar] [CrossRef]
Mizushima N, Komatsu M (2011). Autophagy: renovation of cells and tissues. Cell 147: 728–741. DOI 10.1016/j.cell.2011.10.026. [Google Scholar] [CrossRef]
Morgan TM, Koreckij TD, Corey E (2009). Targeted therapy for advanced prostate cancer: inhibition of the PI3K/Akt/mTOR pathway. Current Cancer Drug Targets 9: 237–249. DOI 10.2174/156800909787580999. [Google Scholar] [CrossRef]
Münz C (2017). The macroautophagy machinery in endo- and exocytosis. Journal of Molecular Biology 429: 473–485. DOI 10.1016/j.jmb.2016.11.028. [Google Scholar] [CrossRef]
Nakatogawa H, Ichimura Y, Ohsumi Y (2007). Atg8, a ubiquitin-like protein required for autophagosome formation, mediates membrane tethering and hemifusion. Cell 130: 165–178. DOI 10.1016/j.cell.2007.05.021. [Google Scholar] [CrossRef]
Nakatogawa H, Suzuki K, Kamada Y, Ohsumi Y (2009). Dynamics and diversity in autophagy mechanisms: lessons from yeast. Nature Reviews Molecular Cell Biology 10: 458–467. DOI 10.1038/nrm2708. [Google Scholar] [CrossRef]
Nishida Y, Arakawa S, Fujitani K, Yamaguchi H, Mizuta T, Kanaseki T, Komatsu M, Otsu K, Tsujimoto Y, Shimizu S (2016). Corrigendum: discovery of Atg5/Atg7-independent alternative macroautophagy. Nature 533: 130–130. DOI 10.1038/nature16538. [Google Scholar] [CrossRef]
Okugawa Y, Toiyama Y, Hur K, Toden S, Saigusa S, Tanaka K, Inoue Y, Mohri Y, Kusunoki M, Boland CR, Goel A (2014). Metastasis-associated long non-coding RNA drives gastric cancer development and promotes peritoneal metastasis. Carcinogenesis 35: 2731–2739. DOI 10.1093/carcin/bgu200. [Google Scholar] [CrossRef]
Qu B, Yao L, Ma HL, Chen HL, Zhang Z, Xie J (2017). Prognostic significance of autophagy-related proteins expression in resected human gastric adenocarcinoma. Journal of Huazhong University of Science and Technology [Medical Sciences] 37: 37–43. DOI 10.1007/s11596-017-1691-2. [Google Scholar] [CrossRef]
Ravanan P, Srikumar IF, Talwar P (2017). Autophagy: the spotlight for cellular stress responses. Life Sciences 188: 53–67. DOI 10.1016/j.lfs.2017.08.029. [Google Scholar] [CrossRef]
Ren C, Ren T, Yang K, Wang S, Bao X, Zhang F, Guo W (2016). Inhibition of SOX2 induces cell apoptosis and G1/S arrest in Ewing’s sarcoma through the PI3K/Akt pathway. Journal of Experimental & Clinical Cancer Research 35: 1. DOI 10.1186/s13046-016-0321-3. [Google Scholar] [CrossRef]
Röcken C (2017). Molecular classification of gastric cancer. Expert Review of Molecular Diagnostics 17: 293–301. DOI 10.1080/14737159.2017.1286985. [Google Scholar] [CrossRef]
Saiki S, Sasazawa Y, Imamichi Y, Kawajiri S, Fujimaki T, Tanida I, Kobayashi H, Sato F, Sato S, Ishikawa K, Imoto M, Hattori N (2014). Caffeine induces apoptosis by enhancement of autophagy via PI3K/Akt/mTOR/p70S6K inhibition. Autophagy 7: 176–187. DOI 10.4161/auto.7.2.14074. [Google Scholar] [CrossRef]
Schmidt N, Peitz U, Lippert H, Malfertheiner P (2005). Missing gastric cancer in dyspepsia. Alimentary Pharmacology and Therapeutics 21: 813–820. DOI 10.1111/j.1365-2036.2005.02425.x. [Google Scholar] [CrossRef]
Shao G, Zhao Z, Zhao W, Hu G, Zhang L, Li W, Xing C, Zhang X (2019). Long non-coding RNA MALAT1 activates autophagy and promotes cell proliferation by downregulating microRNA-204 expression in gastric cancer. Oncology Letters 19: 805–812. DOI 10.3892/ol.2019.11184. [Google Scholar] [CrossRef]
Shen YC, Li CP, Yen CJ, Hsu C, Lin YL, Lin ZZ, Chen LT, Su WC, Chao Y, Yeh KH, Cheng AL (2014). Phase II multicentered study of low-dose everolimus plus cisplatin and weekly 24-hour infusion of high-dose 5-fluorouracil and leucovorin as first-line. [Google Scholar]
Shen YC, Li CP, Yen CJ, Hsu C, Lin Y L, Lin ZZ, Chen L T, Su WC, Chao Y, Yeh KH, Cheng AL (2014). Phase II multicentered study of low-dose everolimus plus cisplatin and weekly 24-hour infusion of high-dose 5-fluorouracil and leucovorin as first-line treatment for patients with advanced gastric cancer. Oncology 87: 104–113. DOI 10.1159/000362671. [Google Scholar] [CrossRef]
Su Z, Yang Z, Xu Y, Chen Y, Yu Q (2015). Apoptosis, autophagy, necroptosis, and cancer metastasis. Molecular Cancer 14: 48. DOI 10.1186/s12943-015-0321-5. [Google Scholar] [CrossRef]
Verdecchia A, Francisci S, Brenner H, Gatta G, Micheli A, Mangone L, Kunkler I, EUROCARE-4 Working Group (2007). Recent cancer survival in Europe: a 2000-02 period analysis of EUROCARE-4 data. Lancet Oncolgy 8: 784–796. DOI 10.1016/S1470-2045(07)70246-2. [Google Scholar] [CrossRef]
Wang LL, Zhang L, Cui XF (2019a). Downregulation of long noncoding RNA LINC01419 inhibits cell migration, invasion, and tumor growth and promotes autophagy via inactivation of the PI3K/Akt1/mTOR pathway in gastric cancer. Therapeutic Advances in Medical Oncology 11: 1758835919874651. DOI 10.1177/1758835919874651. [Google Scholar] [CrossRef]
Wang X, Wu WKK, Gao J, Li Z, Dong B, Lin X, Li Y, Li Y, Gong J, Qi C, Peng Z, Yu J, Shen L (2019b). Autophagy inhibition enhances PD-L1 expression in gastric cancer. Journal of Experimental & Clinical Cancer Research 38: 87. DOI 10.1186/s13046-019-1148-5. [Google Scholar] [CrossRef]
Wen X, Klionsky DJ (2016). An overview of macroautophagy in yeast. Journal of Molecular Biology 428: 1681–1699. DOI 10.1016/j.jmb.2016.02.021. [Google Scholar] [CrossRef]
White E (2012). Deconvoluting the context-dependent role for autophagy in cancer. Nature Reviews Cancer 12: 401–410. DOI 10.1038/nrc3262. [Google Scholar] [CrossRef]
Yu ZY, Wang Z, Lee KY, Yuan P, Ding J (2017). Effect of silencing colon cancer-associated transcript 2 on the proliferation, apoptosis and autophagy of gastric cancer BGC-823 cells. Oncology Letters 15: 3127–3132. DOI 10.3892/ol.2017.7677. [Google Scholar] [CrossRef]
Zhao GX, Pan H, Ouyang DY, He XH (2015). The critical molecular interconnections in regulating apoptosis and autophagy. Annals of Medicine 47: 305–315. DOI 10.3109/07853890.2015.1040831. [Google Scholar] [CrossRef]
Zhao Y, Guo Q, Chen J, Hu J, Wang S, Sun Y (2014). Role of long non-coding RNA HULC in cell proliferation, apoptosis and tumor metastasis of gastric cancer: a clinical and in vitro investigation. Oncology Reports 31: 358–364. DOI 10.3892/or.2013.2850. [Google Scholar] [CrossRef]
Zheng N, Shabek N (2017). Ubiquitin ligases: structure, function, and regulation. Annual Review of Biochemistry 86: 129–157. DOI 10.1146/annurev-biochem-060815-014922. [Google Scholar] [CrossRef]
Zhu L, Zhu Y, Han S, Chen M, Song P, Dai D, Xu W, Jiang T, Feng L, Shin VY, Wang X, Jin H (2019). Impaired autophagic degradation of lncRNA ARHGAP5-AS1 promotes chemoresistance in gastric cancer. Cell Death & Disease 10: 394. DOI 10.1038/s41419-019-1585-2. [Google Scholar] [CrossRef]
 | This work is licensed under a Creative Commons Attribution 4.0 International License, which permits unrestricted use, distribution, and reproduction in any medium, provided the original work is properly cited. |