DOI:10.32604/biocell.2022.021477
| BIOCELL DOI:10.32604/biocell.2022.021477 | |
| Article |
Significant changes in arbuscular mycorrhizal community and soil physicochemical properties during the saline-alkali grassland vegetation succession
College of Landscape Architecture, Northeast Forestry University, Harbin, 150040, China
*Address correspondence to: Chunxue Yang, senxiu99@163.com
Received: 16 January 2022; Accepted: 12 April 2022
Abstract: Arbuscular mycorrhizal (AM) fungi are widely distributed in various habitats, and the community composition varies in response to the changing environmental conditions. To explore the response of community composition to the succession of saline-alkali land, soil samples were collected from three succession stages of Songnen saline-alkali grassland. Subsequently, the soil characteristics were determined and the AM fungi in soil samples were analyzed by high-throughput sequencing. Then, the response relationship between community composition and soil characteristics was studied by Canonical correlation and Pearson analyses. The soil properties improved with the succession of saline-alkali grassland. There was no significant difference in alpha diversity between the first and second succession stage (Suaeda glauca and Puccinellia tenuiflora, respectively), and the microbial community had a dense association network at the third stage (Leymus chinensis); in addition, each succession stage had significantly enriched amplicon sequence variants (ASVs) and functional pathways. All the soil properties except cellulase activity had significant effects on community composition. Furthermore, the pH, organic carbon, organic matter, and sucrase activity significantly correlated with alpha diversity indices. These results provide a theoretical basis for realizing the significant changes in AM fungal community and soil properties during the saline-alkali grassland vegetation succession.
Keywords: AM fungal community; High-throughput sequencing; Succession of saline-alkali land; Soil physicochemical characteristics
Salinization has become a global problem that restricts the development of agriculture and husbandry (Garcia-Franco et al., 2021). About 950 million hectares (Ha) of the land worldwide is affected by salinization, of which 99.133 million Ha of land is salinized in China (Liu and Liu, 2002). Songnen plain is one of the three major saline-alkali land distribution regions globally, where its land area was threatened by the increase in salinization by 1.5 million Ha from 1950 to 2016 (Li et al., 2003; Sun and Wang, 2016). The degradation of Songnen saline-alkali grassland has led to the changes in soil physicochemical properties such as pH, total salt content, organic matter (OM) content, N, P, K content, etc. (Li et al., 2020; Zhai et al., 2021; Zhao et al., 2016), which thus inhibit plant growth and metabolism. In addition, the activities of soil enzymes (sucrase, urease, catalase, cellulase, etc.) are also altered under the influence of salinity (Su et al., 2020). As an important factor driving the degradation of Songnen saline-alkali grassland, salinization seriously restricts the sustainable development of this area (Zhao et al., 2018). Songnen saline-alkali grassland has a unique community composition and flora, mainly comprising Suaeda glauca, Puccinellia tenuiflora, Leymus chinensis, and other weeds, among which L. chinensis is the dominant grass. The communities, S. glauca, P. tenuiflora, L. chinensis mitigate the degree of soil salinization and are, respectively, the first, second, and third stage of succession (Yan and Sun, 2000). The process of salinization from S. glauca to P. tenuiflora is influenced by the monsoon period, and the earlier rainy season (before July) can successfully promote this succession. After 2–3 years of the growth of P. tenuiflora, L. chinensis and salt-intolerant grass invade the alkali-bare spot (Liu et al., 2018). Six years after these stages, L. chinensis may become the dominant population, causing a gradual decrease in the growth of P. tenuiflora and subsequent recovery of degraded grassland (Sun et al., 2002). A concentric circular succession sequence comprising communities of S. glauca, P. tenuiflora, and L. chinensis has often been seen in Songnen saline-alkali grassland (Yan and Sun, 2000), among which, S. glauca is located in the inner region, followed by P. tenuiflora and L. chinensis. The communities of S. glauca, P. tenuiflora, and L. chinensis jointly constitute the succession process of Songnen saline-alkali grassland. Thus, three succession stages exist in a small space, and every community is completely separate.
Arbuscular mycorrhiza (AM) fungi are obligate biotrophic species; they have a wide range of colonization abilities and establish symbiotic relations with more than 90% of vascular plants (Liu et al., 2017). A large number of grasses, including the three plants mentioned above, can act as hosts (Yang et al., 2015). AM fungal function of significantly improving the plant’s resistance to salt-alkali, heavy metals, drought, and other stresses has been proven earlier (Ghanbarzadeh et al., 2020; Garcia-Sanchez et al., 2019; Wang et al., 2019). AM fungi can also improve the soil physicochemical properties, including soil fertility and enzyme activities (Jia et al., 2020), change the morphology of heavy metals in the soil, and thus regulate its bioavailability (Manceau et al., 2008), thus affecting the sequestration of organic carbon (Ren et al., 2020), and promoting the formation of soil aggregates (Rilling and Mummey, 2006). These effects play an important role in the remediation of degraded soils. AM fungi exist in nature by constituting communities and play a variety of physiological, biochemical, and ecological functions for the host and environment directly or in a round-about way with its unique community composition, essentially different from the effect of a single AM fungus (Li et al., 2010). Songnen saline-alkali grassland has been reported to have abundant AM fungi resources (Yang et al., 2015). However, AM fungal communities in the soil were altered by the changing environmental conditions (Li et al., 2021; Vieira et al., 2018). Further research was needed to investigate whether its community responds to the succession of saline-alkali grassland.
Morphological identification and molecular techniques are the primary methods to analyze AM fungal diversity (Yang et al., 2019). The high-throughput sequencing, a molecular biological technique, is highly sensitive and can be considered an effective method for the detailed study of microorganisms (Li et al., 2019; van et al., 2006). While processing sequencing data, the features produced by clustering are known as operational taxonomic units (OTUs), which may be suboptimal and imprecise. Therefore, the amplicon sequence variants (ASVs), which only deduplicate the data, are more scientific in analyzing the AM fungal diversity. To elucidate the response of AM fungal community to the succession of saline-alkali land and explore the driving factors, the communities of S. glauca, P. tenuiflora, and L. chinensis were selected as the three stages of succession, respectively, and the research idea of “space instead of time” was adopted (Blois et al., 2013). The rhizosphere soils from the characteristic plant of grassland succession were collected to determine the pH, electrical conductivity (EC), the content of organic carbon (OC), OM, total phosphorus (Total P), carbonate, and total nitrogen (Total N), the ratio of carbon to nitrogen (C/N) and the activities of sucrase, urease, catalase, and cellulase. Furthermore, the DNA of the soil samples was extracted for high-throughput sequencing to analyze the AM fungal communities among different succession stages. Subsequently, the effects of soil properties on AM fungal community composition are discussed herein, and the response mechanism of AM fungal community to the succession of saline-alkali land is explained.
The following hypotheses were tested: (H1) AM fungal communities differ among three succession stages. (H2) The highest species abundance presents at the third stage (L. chinensis community). (H3) The soil properties gradually improve with the progress in succession. (H4) Changes in AM fungal communities are driven by physicochemical properties, and they are related to enzyme activities. (H5) The increased Total P content inhibits the AM fungal diversity.
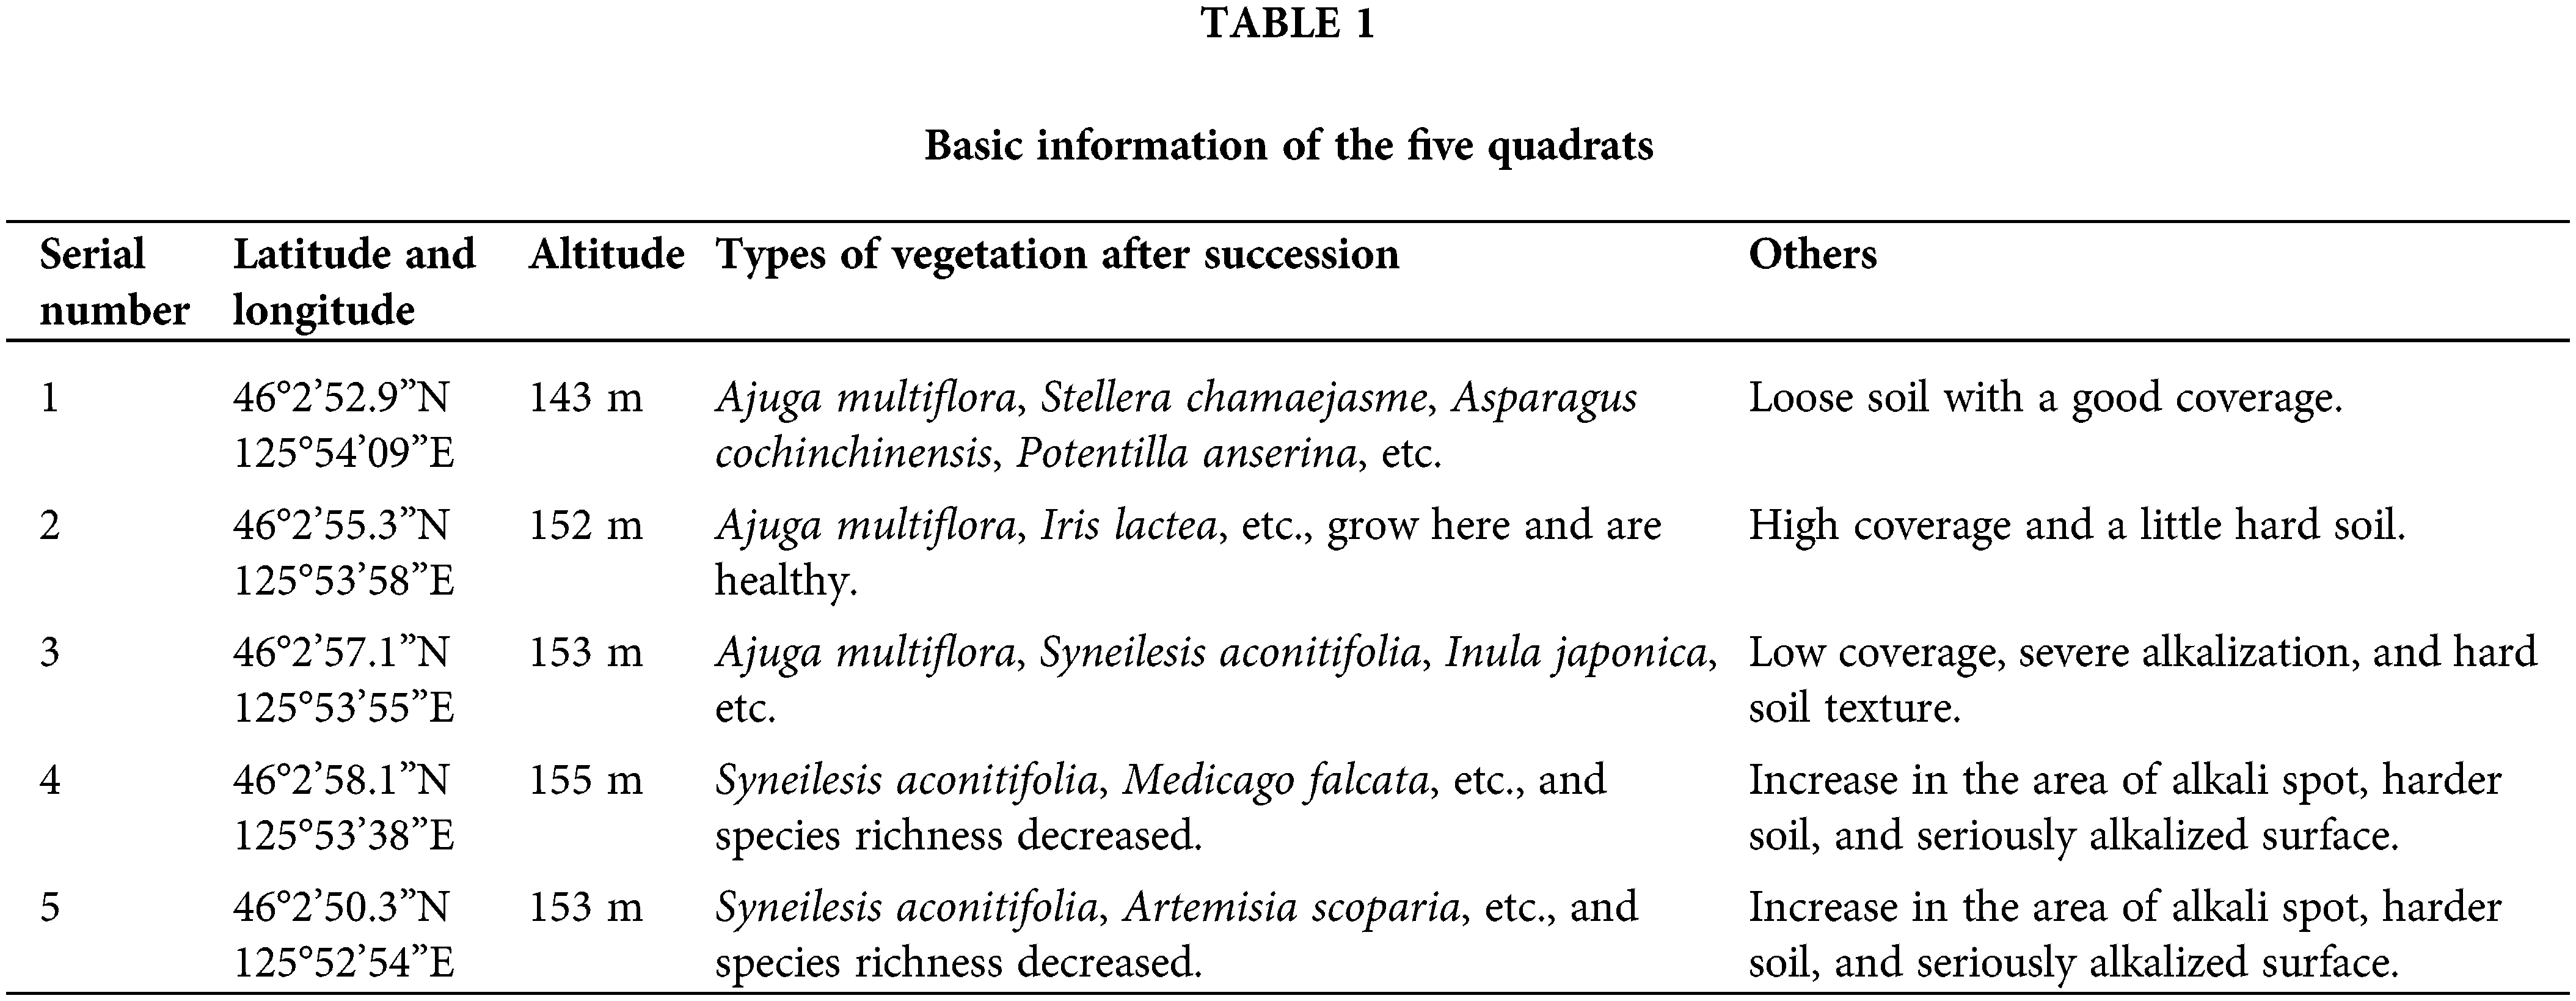
The research samples were collected from Zhaodong (Heilongjiang Province, China), located in the middle of Songnen plain with a temperate continental monsoon climate, and the weather is characterized by high temperature-rainy summers and dry cold winters. The terrain is flat, but the ground is threatened by salinization. Seasonal precipitation results in the alternation of soil desalting and salt accumulation in rainy and dry seasons, respectively, and the soil is salinized severely. The annual average temperature is 3.6–4.4°C, and the temperature exceeds 0°C for more than 210 days annually (Su et al., 2020). S. glauca, P. tenuiflora, and L. chinensis communities are the main vegetation types of Songnen saline-alkali grassland, among which the third stage of succession (L. chinensis communities) is the most abundant in this land. Besides, there are also a large number of alkali spots without vegetation growth before the first succession stage. Five large quadrats (50 m × 50 m) separated by roads were set in this area at a constant distance from each other. Three small sites (15 m × 15 m) within a quadrat were selected randomly. S. glauca, P. tenuiflora, and L. chinensis communities grew simultaneously in every small site, with no cross growth; therefore, each site possessed a complete succession sequence (Fig. 1). The information on the five large quadrats is shown in Table 1.
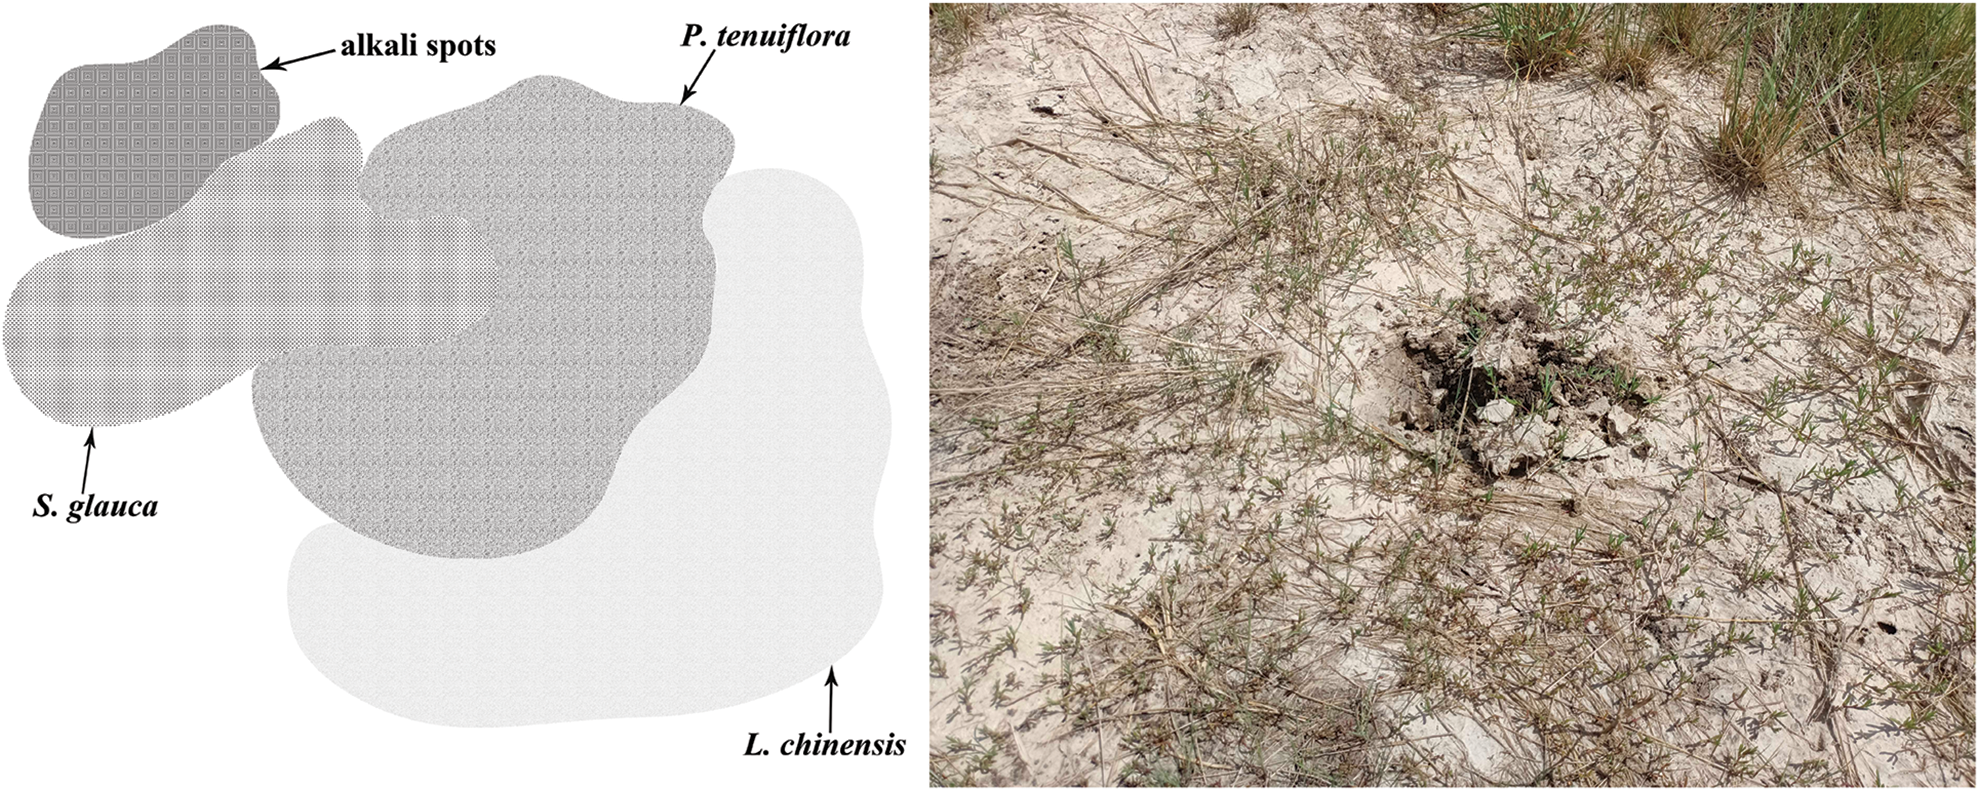
Figure 1: Plants distribution within a small site and were selected according to the “multi-point parallel sampling method” and “five-point sampling method”.
Sample collection and processing
Ten clumps of S. glauca, P. tenuiflora, and L. chinensis with different growth statuses and ages were selected within each small site according to the “multi-point parallel sampling method” and “five-point sampling method” on May 24, 2021 (Meng, 1996). The selected plants were shaken vigorously to remove excess soil. The rhizosphere soil still stuck to the roots, was removed using a sterile brush (Jin et al., 2021). Subsequently, the rhizosphere soils (about 1 kg) with the number of absorptive roots from depths of 0–30 cm were harvested from every small site. After this, 0.5 kg rhizosphere soil was retained by the quartering method, and three soil specimens of every succession stage collected from three small sites within a large quadrat were mixed into one sample so that five samples were collected from each of the three succession stages. Fifteen rhizosphere soil samples were obtained, which were respectively packed into sterilized sealed bags, numbered, and latitude and longitude were marked. The retrieved rhizosphere soils were sieved through 0.85 mm mesh after being air-dried and then divided into two parts. One portion was stored at 4°C for the determination of soil properties and enzyme activities, and the other was immediately submitted for DNA extraction and high-throughput sequencing of AM fungal communities.
Determination of soil properties and enzyme activities
Soil physicochemical properties were determined according to Bao (2000), and the soil enzyme activities were measured as described by Guan (1986). Soil alkalinity was explained in terms of the pH value of soil-water immersion liquid (1:5), and it was measured by a PHS-3C pH meter (Shanghai Lei Ci Scientific Instrument Factory). Soil salinity was illustrated by the conductivity of soil-water (1:4) saturated extract and was measured by a DDS-11A conductivity meter (Shanghai Precision Instrument Factory). The OC and OM were measured using the potassium chromate volumetric analysis method, carbonate content of soil-water immersion liquid (1:5) was estimated by the phenolphthalein-neutralization titration, and Total N was estimated by Kjeldahl’s semi-micro method after the soil samples were digested in the H2SO4 and accelerator at 410°C. Total P content was determined using the molybdenum antimony colorimetric method after the soil samples covered with NaOH were liquated at 450°C. Sucrase activity was determined by 3, 5-dinitrosalicylic acid colorimetry after 5 g soil and 15 ml 8% sucrose solution were cultured at 37°C for 24 h. Cellulase activity was determined by dinitrosalicylic acid colorimetry after 10 g soil and 20 ml 1% carboxymethyl cellulose solution was incubated at 37°C for 72 h. Five grams of soil and 10 ml of 10% urea were incubated at 37°C for 24 h. Then the NaClO-sodium phenolate colorimetry was used to measure urease activities. Catalase activity was determined by potassium permanganate volumetric analysis. All the above-mentioned indices were measured at least three times.
High-throughput sequencing of AM fungi in soil samples
Five grams of rhizosphere soil was accurately weighed from each of the 15 samples in aseptic conditions, placed into 10 ml sterilizing centrifuge tubes, and submitted to Personal Biotechnology Co., Ltd., Shanghai, China, for subsequent processing and sample sequencing. The Omega Mag-bind soil DNA kit (Omega M5635-02) was used for the soil-sample DNA extraction, and fragments were amplified using the AM fungal-specific primer AMV4.5NF (5’-AAGCTCGTAGTTGAATTTCG-3’) and AMDGR (5’-CCCAACTATCCCTATTAATTAT-3’) (fragment of about 280 bp length). Amplification system (25 μl) contained 5 × reaction buffer (5 μl), 5×GC buffer (5 μl), dNTP (2.5 mM, 2 μl), forward primer (10 µM, 1 μl), reverse primer (10 µM, 1 μl), DNA template (2 μl), ddH2O 8.75 μl, and Q5 DNA Polymerase (0.25 μl). The amplification conditions were set as follows: initial denaturation at 98°C for 2 min, then 30 cycles of denaturation at 98°C for 15 s, annealing at 55°C for 30 s, extension at 72°C for 30 s, and a final extension at 72°C for 5 min. The sequencing platform was Illumina (NovaSeq-PE250), and more than 80000 sequences were generated for each sample. QIIME2 was used to denoise the obtained sequences; the main steps were as follows: “qiime cutadapt trim-paired” was called to excise sequences and discard these with unmatched primers; then, DADA2 (“qiime dada2 denoise-paired”) was applied for qualitative control, denoising, splicing, and chimera removal. Subsequently, the clustering was performed at the level of 100% similarity (Callahan et al., 2016). After that, representative sequences of ASVs and their tables were merged. The “classify-sklearn algorithm” of QIIME2 (Bokulich et al., 2018) was used to align the characteristic sequence of each ASV to the MaarjAM database for species annotation.
SPSS version 25 was used to test the soil properties and enzyme activities among the three stages by one-way ANOVA. Pearson correlation analysis was performed between the above indices and alpha diversity of AM fungal community, and the significance of differences was marked according to Waller Duncan’s test results. The “qiime diversity alpha-rarefaction” function in QIIME2 was used to construct the Rarefaction Curve to predict the total species number and the relative abundance of each sample at a given sequence depth (Heck et al., 1975; Kemp and Aller, 2004). The Anosim function in the R4.1.1 Vegan package was used to test the significance of the difference in community composition between different stages. The decorana function was used to test the axis lengths of community data, and then the canonical correlation analysis (CCA) was constructed to explain the influence of soil characteristics on AM fungal community. QIIME2 was used to analyze the alpha diversity (Shannon’s and Simpson’s indices, Faith’s PD, Pielou’s evenness, Chao1 index, Observed species, and Good’s coverage indicated the richness, diversity, evolution-based diversity, evenness, and coverage, respectively, of AM fungal community) and then the boxplot was plotted using R4.1.1 ggplot2 package (Chao, 1984; Faith, 1992; Good, 1953; Pielou, 1966; Simpson, 1949; Shannon, 1948). The alpha diversity indices were tested by Dunn’s post-hoc test. The ggraph and ggplot2 packages were used to build taxonomic rank tree plots to illustrate the species composition of AM fungal community at different stages (Carrión et al., 2019). Vegan, ape, and ggtree packages were used for hierarchical clustering analysis to reveal the Beta diversity of AM fungal communities in the three stages. MetagenomeSeq package was used for the MetagenomeSeq analysis of AM fungal species that changed significantly among three stages (Zgadzaj et al., 2016). Metabolic pathway difference analysis, which was applied to identify the significantly enriched metabolic pathways among AM fungal communities, was performed with PICRUSt2 and MetagenomeSeq package in R4.1.1. Among these, PICRUSt2 predicted the functional pathways based on the abundance of pathways genes in sequencing data, as per the process described in https://github.com/picrust/picrust2/wiki. To test the stability of AM fungal community in changing environments, the igraph package was used to analyze the degree of distribution. Further, gephi software was used to elucidate interspecific relationships within AM fungal communities at the same succession stage (Bastian et al., 2009).
Rhizosphere soil properties and enzyme activities in different succession stages
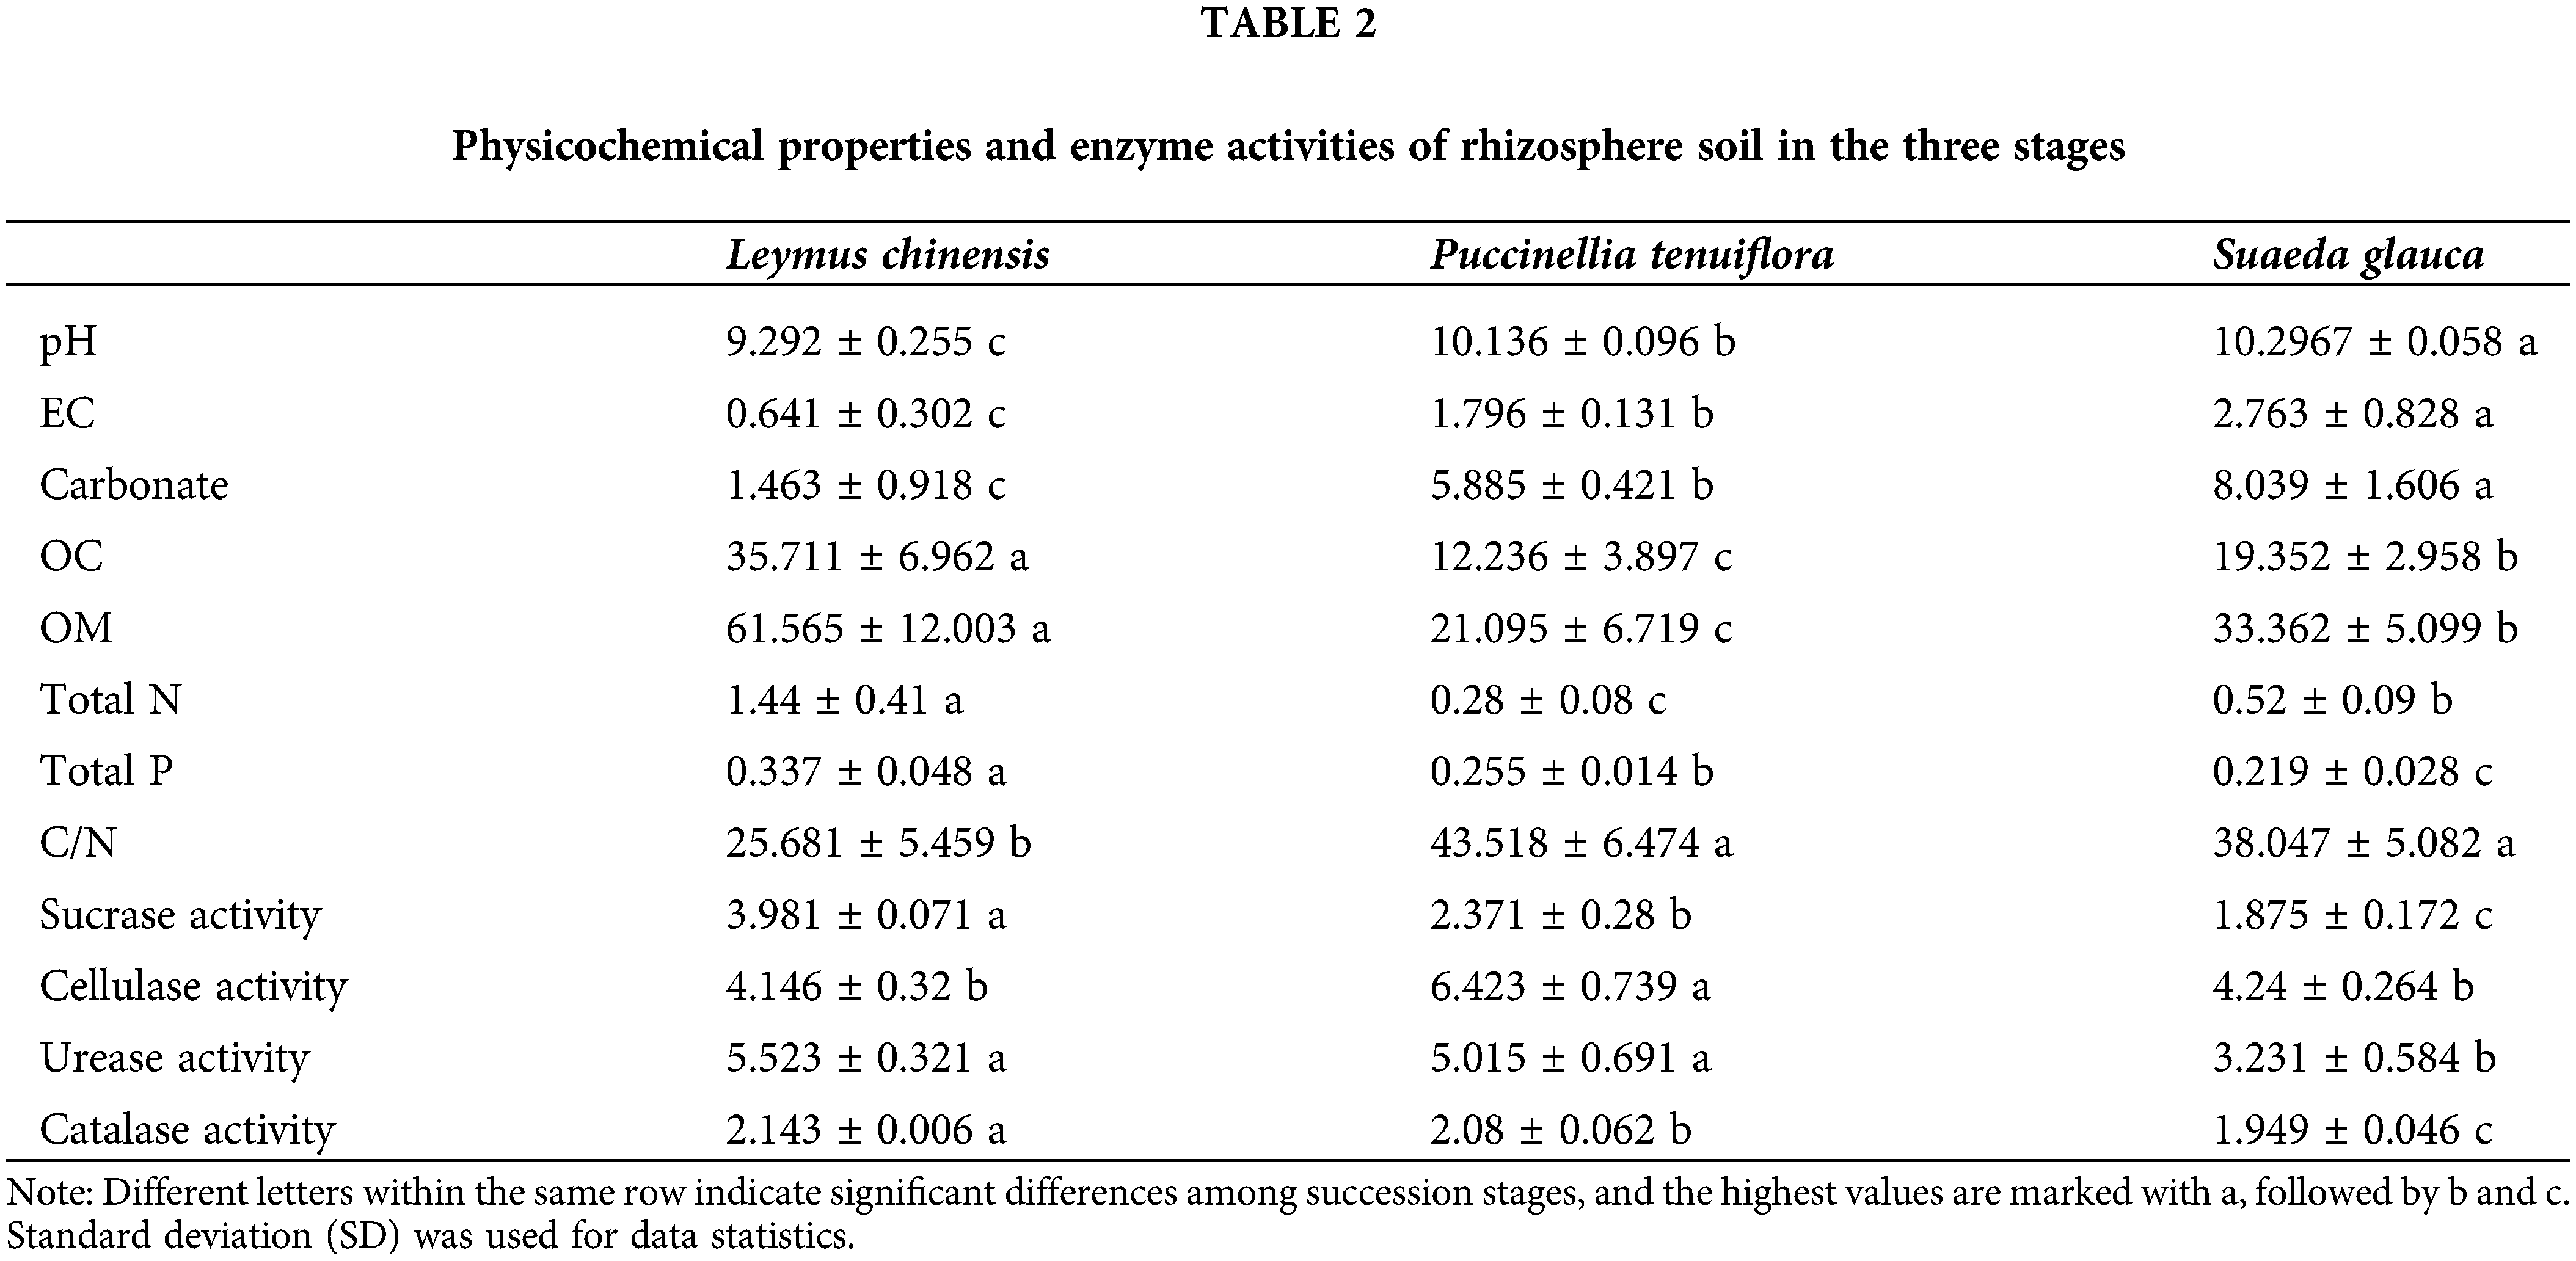
Soil physicochemical properties and enzyme activities differed among different succession stages (Table 2). The pH, EC, and carbonate were the maximum at the stage of S. glauca, while those at the L. chinensis were the lowest, indicating that the highest salinization appeared in the S. glauca stage, and the soil salinization gradually decreased as the succession progressed. Contrary to the above properties, Total P, sucrase activity, and catalase activity were the highest in the L. chinensis stage, followed by P. tenuiflora and S. glauca, contrary to the succession sequence in the Songnen saline-alkali grassland. The OC, OM, and Total N contents showed the same trend, and decreased gradually in the order of L. chinensis, S. glauca, and P. tenuiflora stages. C/N was the lowest in the L. chinensis stage, and was significantly different from that in the other two stages (p < 0.05), while there was no significant difference between L. chinensis and S. glauca (p > 0.05) in terms of cellulase activity; the value was significantly lower than that in the P. tenuiflora stage (p < 0.05). Furthermore, the difference in urease activities between L. chinensis and P. tenuiflora stages was not significant (p > 0.05), and that of the S. glauca stage was the lowest (p < 0.05).
Arbuscular Mycorrhiza fungal diversity in rhizosphere soils at different succession stages
The variation in AM fungal species diversity and total abundance with the increase in the number of sequences could be reflected by the dilution curve. Fig. 2 shows the relationship between Chao1 as well as Observed_species and sequencing depth. At the time when the depth reached 50000 sequences, the dilution curves constructed for 15 samples based on different indices flattened and reached 99.9% coverage, indicating that the sequencing data in this experiment could comprehensively reflect the AM fungal community composition. A total of 1024090 valid sequences were obtained after the unqualified bands were removed from 1389470 original sequences. In this study, 3916 ASVs were clustered, among which 2362 were from the rhizosphere soils of L. chinensis, 1063 were from that of P. tenuiflora, and 1078 ASVs were detected at the S. glauca stage. Ninety-eight ASVs were presented simultaneously in three phases, and the number of endemic ASVs in three stages was 2180, 584, and 609, respectively.
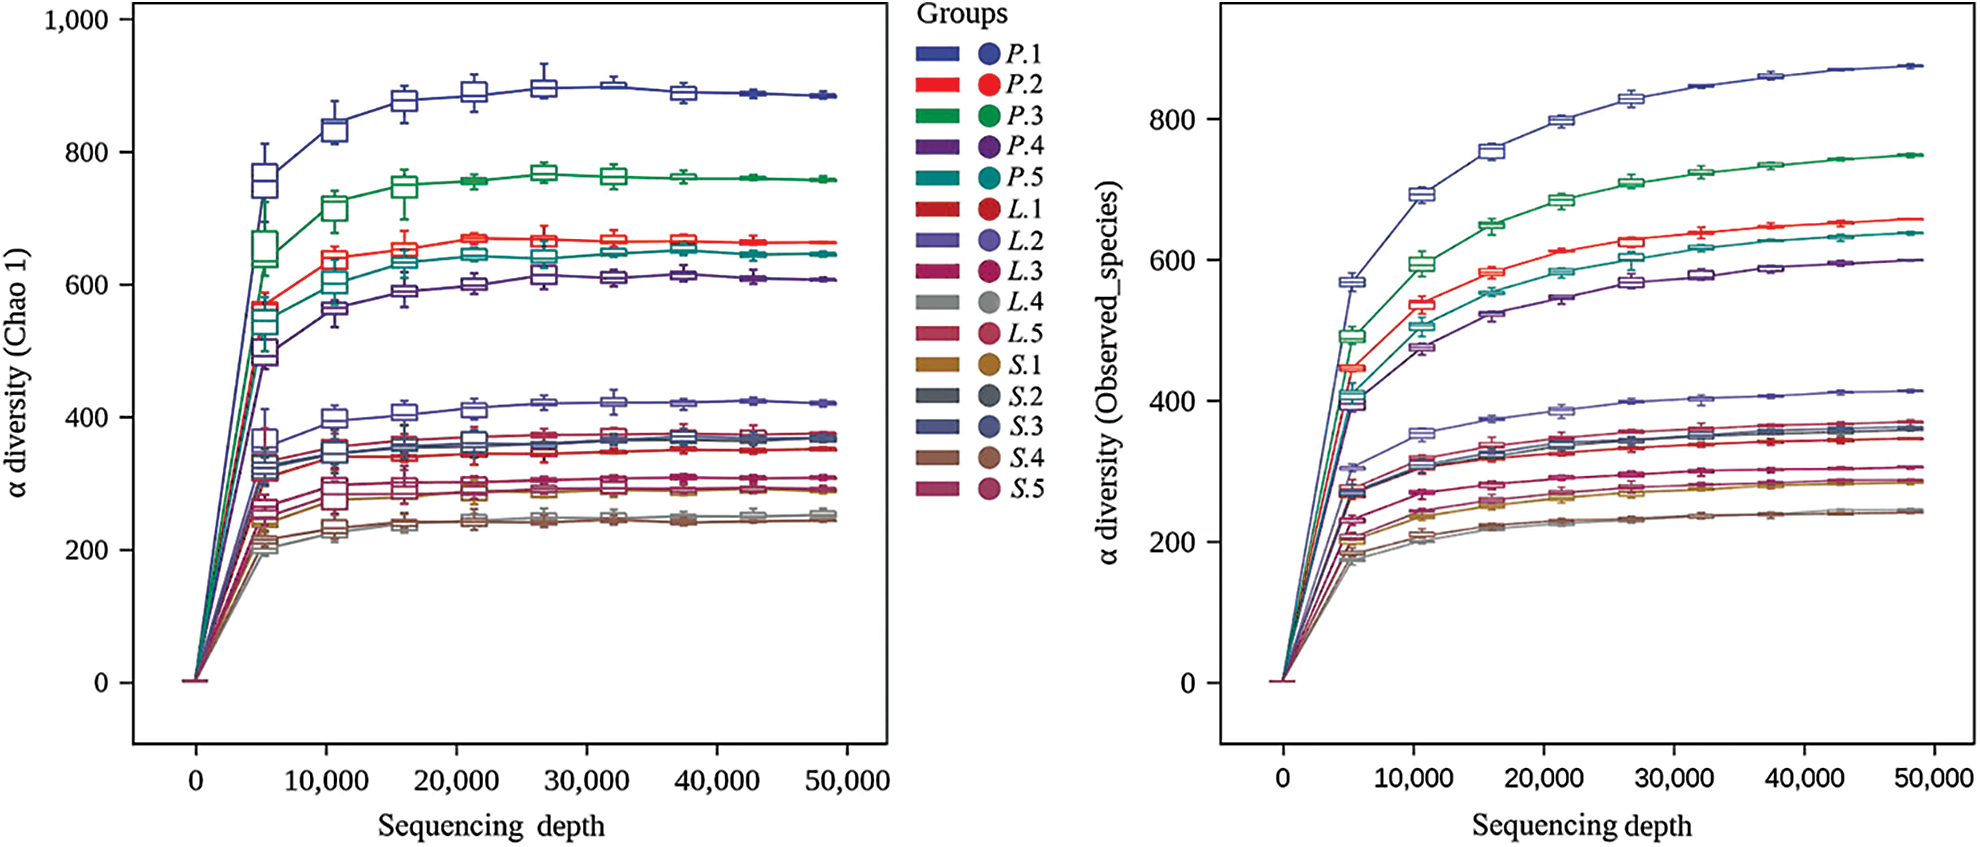
Figure 2: Dilution curve to show the variation in AM fungal species diversity and total abundance with the increase in the number of sequences. P.-Puccinellia tenuiflora; L.-Leymus chinensis; S.-Suaeda glauca. The figures indicated the serial number of quadrats.
Alpha diversity of Arbuscular Mycorrhiza fungal communities in three succession stages
AM fungal alpha diversity analysis (Fig. 3) for three succession stages showed a significantly higher species richness of the third stage (L. chinensis) than in other stages (p < 0.05), and its value of Chao1 and Observed_species at five sampling quadrats were 606.119–883.19 and 598.3–873.9, respectively, while these indices did not differ significantly between P. tenuiflora and S. glauca stages (p = 0.52). As indices reflecting the diversity of AM fungal community, large Shannon and Simpson indices indicated a greater species diversity within the community. The Shannon and Simpson indices varied significantly only between the L. chinensis and P. tenuiflora stages (p = 0.0034, p = 0.0056), and that of L. chinensis showed the highest average values of 7.14 and 0.98, respectively. That is, the AM fungal diversity was the highest in the succession stage of L. chinensis. Pielou_e removed the richness effect of the Shannon index and emphasized the uniformity of community; the large values indicated even community composition and significant differences between L. chinensis and P. tenuiflora stages (p = 0.0071); the mean Pielou_e value of the three succession stages (L. chinensis, P. tenuiflora, and S. glauca) were 0.76, 0.58, and 0.65, respectively. The phylogenetic diversity of the community was represented by Faith_PD, which evaluated the genetic diversity by calculating the full length of the clade that represented the ASV sequence in the constructed tree. There was no significant difference in the three succession stages in terms of Faith_PD (p > 0.05), indicating some similarities in the genetic diversity of different AM fungal communities.
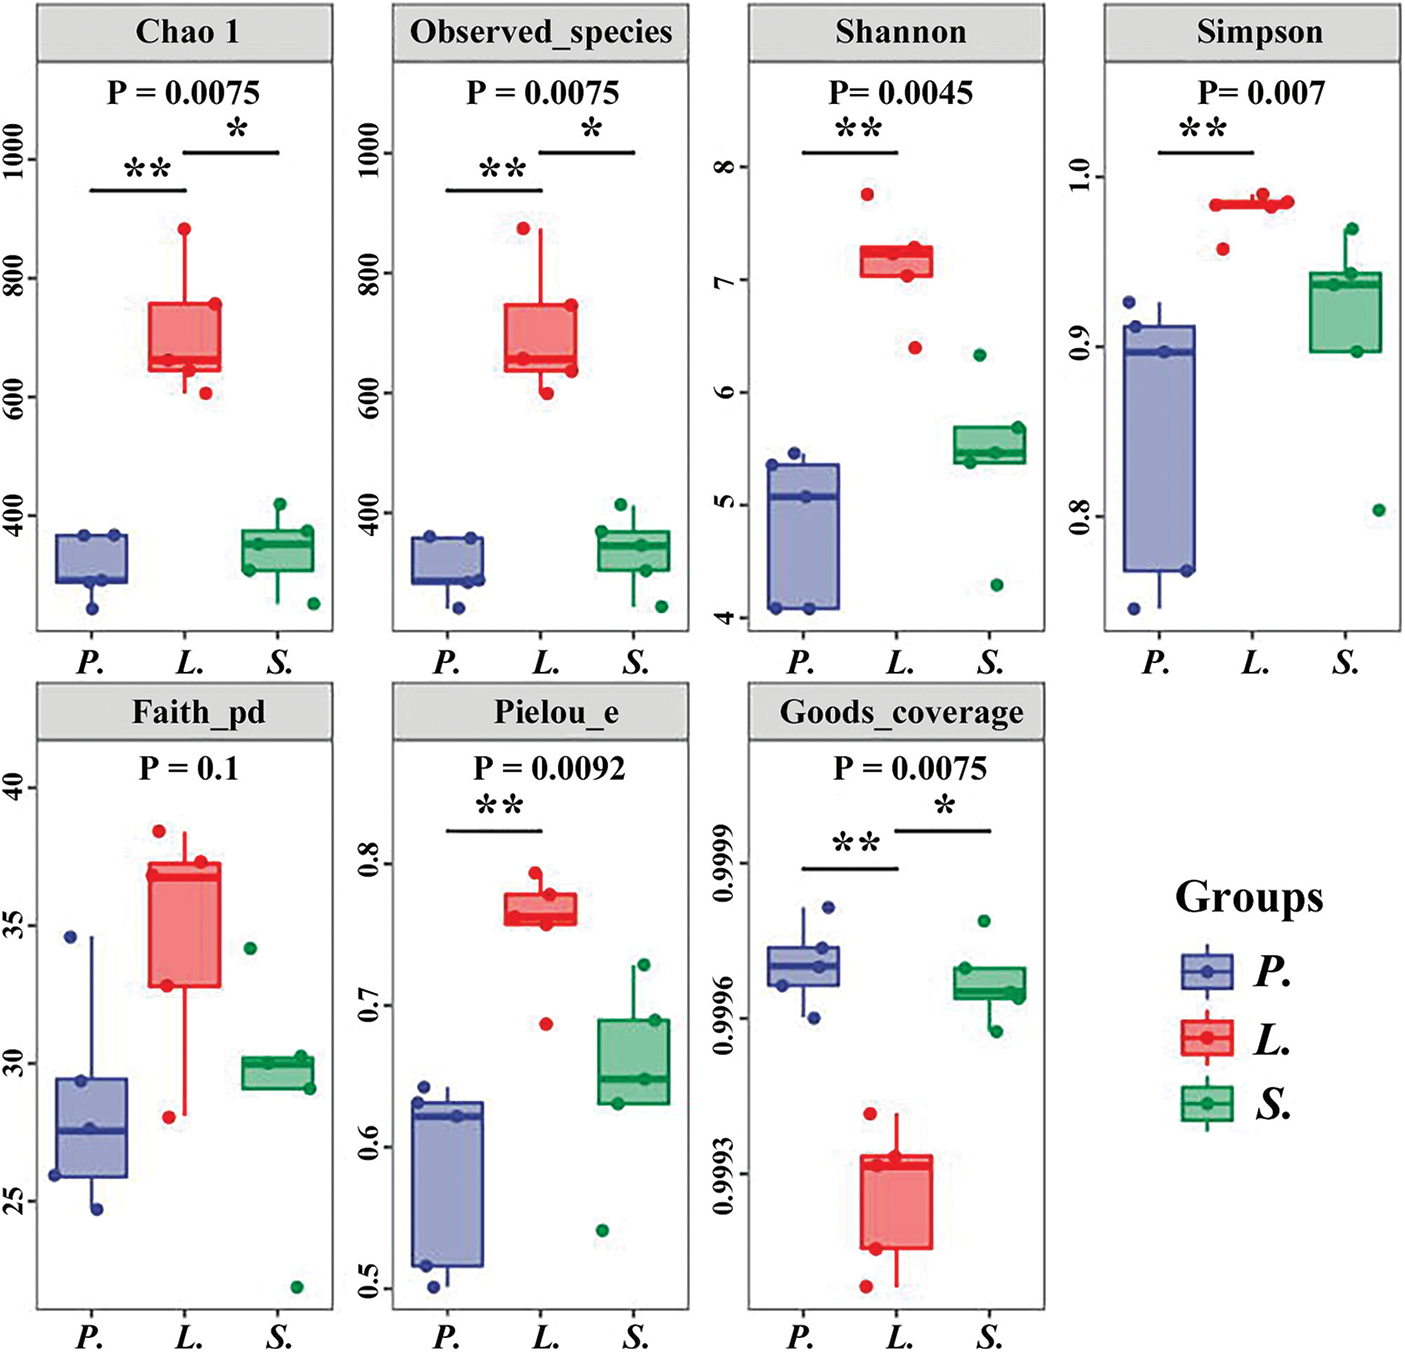
Figure 3: Boxplot of alpha diversity indices. P.-Puccinellia tenuiflora; L.-Leymus chinensis; S.-Suaeda glauca. The median line of the box represents the median; the upper and bottom edges are maximum and minimum values, respectively, and points outside the edges represent outliers.
Arbuscular Mycorrhiza fungal community composition and marker species in different succession stages
The significant difference in AM fungal community composition among three succession stages could be confirmed after the Anosim test (r = 0.6756, p = 0.002). Taxonomic hierarchy tree analysis (Fig. 4A) showed a larger number of unique species in the L. chinensis stage, while the AM species were more common in the adjacent succession stages (P. tenuiflora and S. glauca stages). In addition, in the top 100 ASVs, the most abundant AM fungal species appeared in the P. tenuiflora and S. glauca stages. Hierarchical clustering analysis (Fig. 4B) performed at the classification level of the family showed that Glomeraceae was the most dominant family with the largest proportion in all the succession stages, followed by Paraglomeraceae, which was distributed in the three succession stages and found in all 15 samples, and was thus the subdominant family. The distribution of Claroideoglomeraceae, Diversisporaceae, Ambisporaceae, Gigasporaceae, and Archaeosporaceae varied greatly among succession stages and samples; these AM fungal species might be more sensitive to the changing environmental conditions. Some quadrats of P. tenuiflora and S. glauca with a similar composition clustered together, consistent with the results of alpha diversity analysis, indicating that the species composition of adjacent succession stages was closely related.
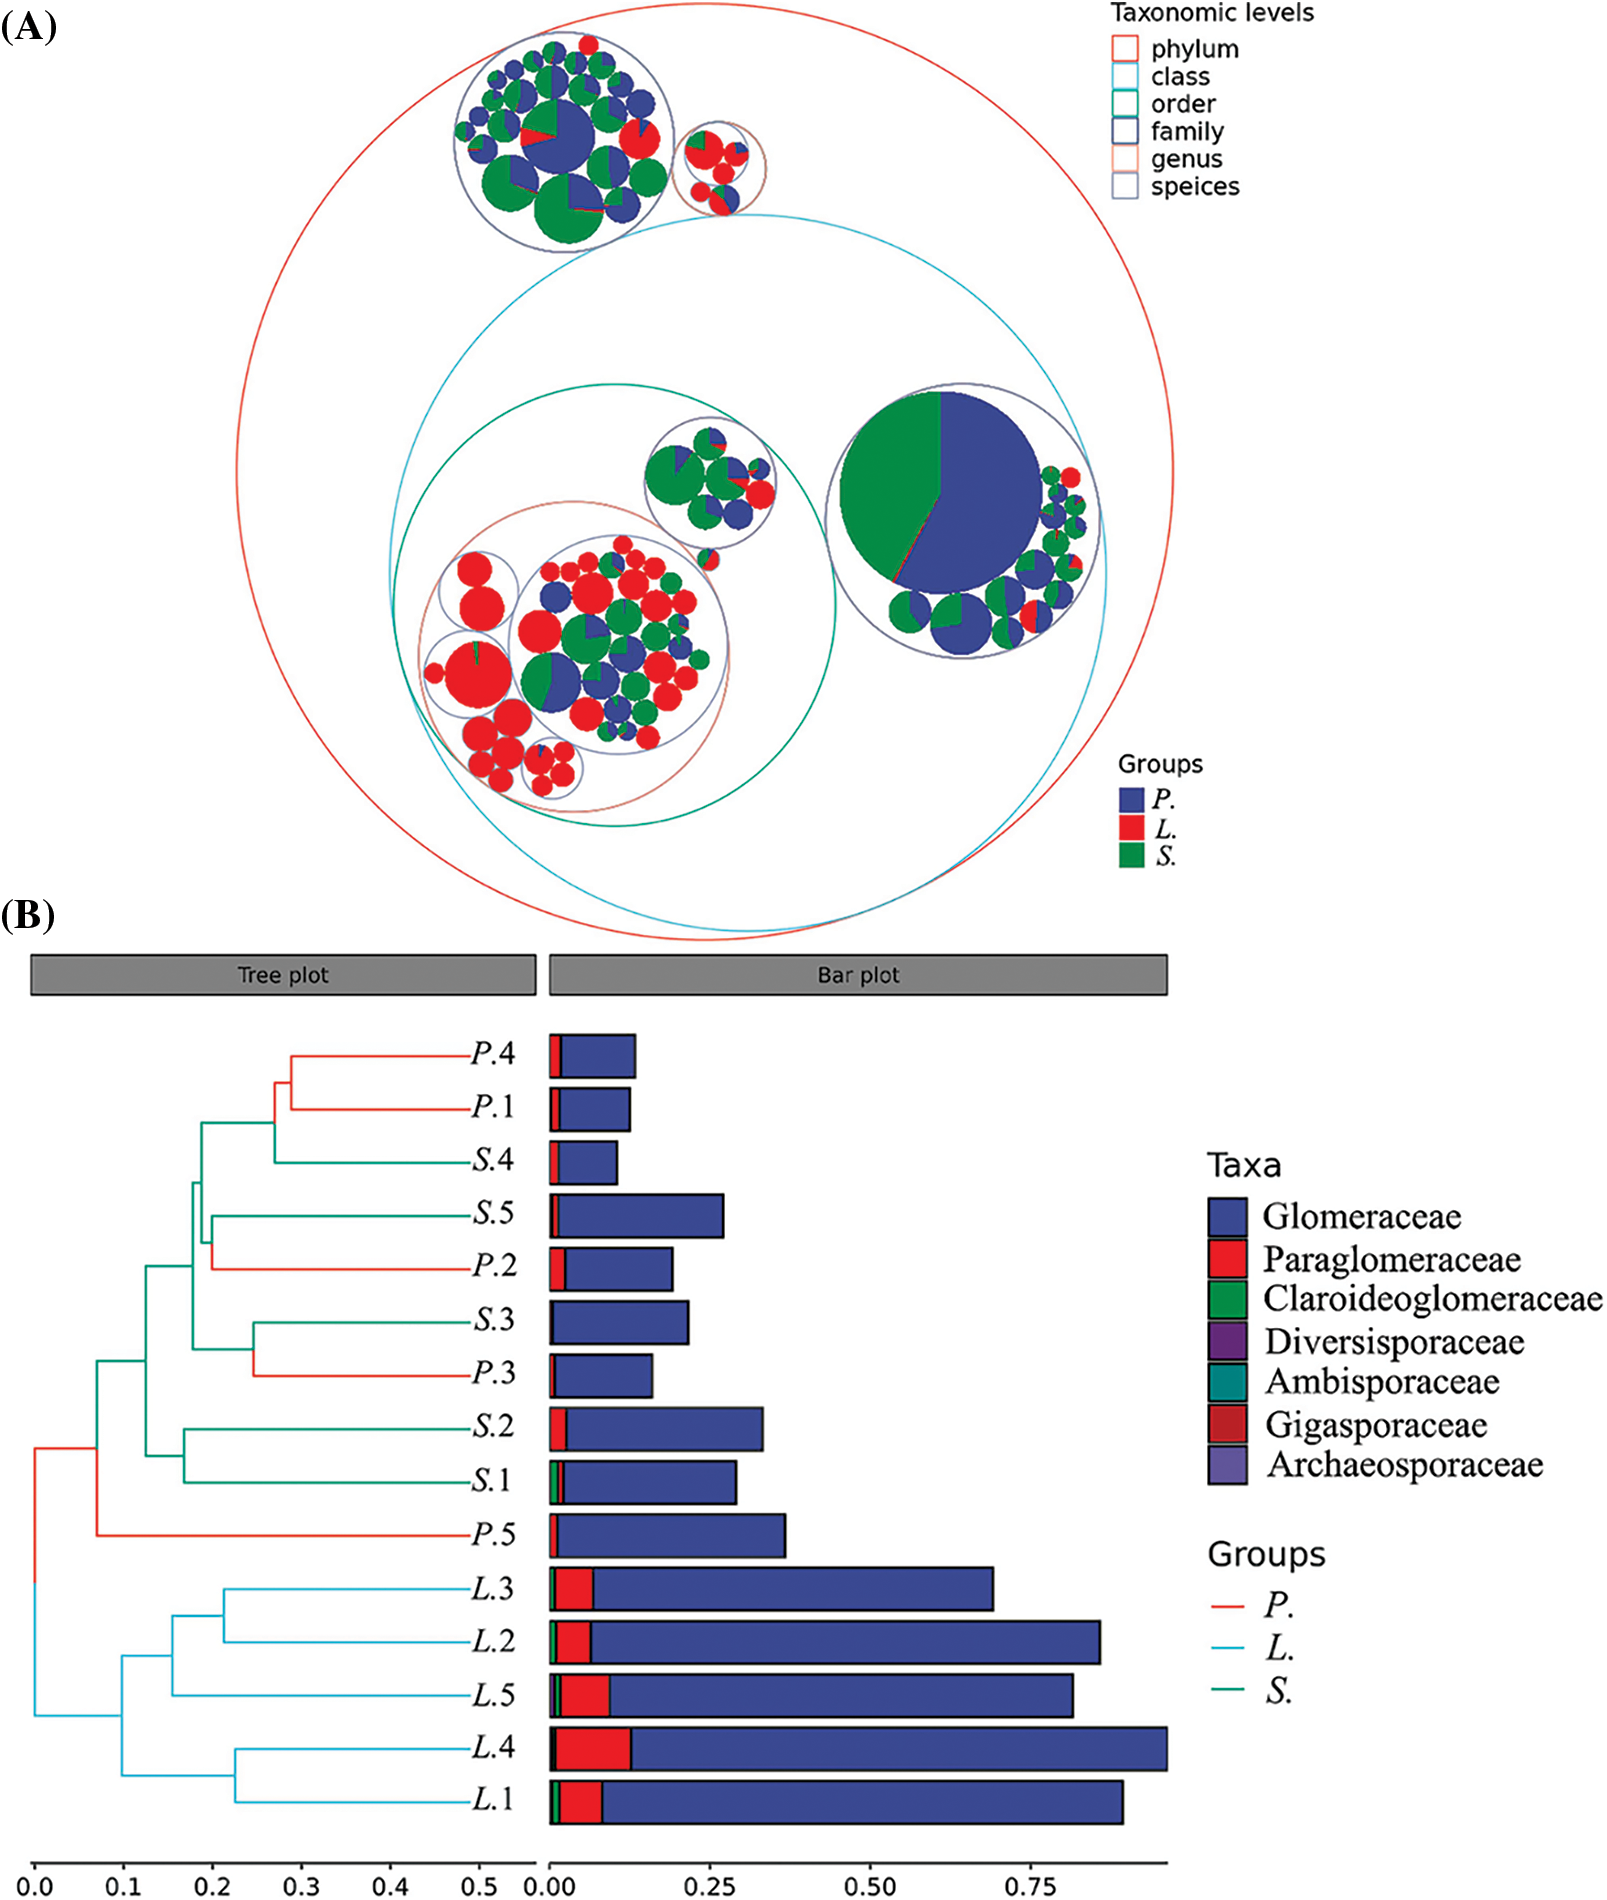
Figure 4: Taxonomic tree in packed circles and hierarchical clustering analysis. P.-Puccinellia tenuiflora; L.-Leymus chinensis; S.-Suaeda glauca. (A) Taxonomic levels are distinguished by circles with different colors. The innermost dot represents the top 100 amplicon sequence variants (ASVs) in abundance, with an area proportional to the abundance of that ASV. (B) Figures indicate the serial number of quadrats. Samples appear clustered according to their similarity. Branch length indicates the degree of similarity between the two samples. Digit indicates the serial number of quadrats.
Based on the results of the MetagenomeSeq analysis, the Manhattan plot was constructed, and the following figures (Fig. 5) showed the ASVs enriched in different succession stages. The results showed that four ASVs were enriched significantly in S. glauca compared with P. tenuiflora stage (Fig. 5A), among which one belonged to Paraglomus, two belonged to Glomus, and another one belonged to Glomeromycota, although the information about its family and genus was not apparent after species annotation. Compared with the L. chinensis stage (Fig. 5B), 90 ASVs were enriched significantly at the S. glauca stage, including 28 in Glomus and one in the Ambispora genus. The most enriched species was affiliated with Glomus. Compared with S. glauca, 129 ASVs were significantly enriched in the L. chinensis stage (Fig. 5C), and the enrichment effect of 32 ASVs was extremely significant. The significantly upregulated species were mainly distributed in the Glomus, Claroideoglomus, and Paraglomus (85, two, and five, respectively). One-hundred and fifteen ASVs were significantly enriched in the L. chinensis stage compared with that in the P. tenuiflora (Fig. 5D) stage, of which 107 coincided with the enriched ASVs of L. chinensis relative to those in the S. glauca stage. Significantly up-regulated species were also mainly distributed in Glomus, Claroideoglomus, and Paraglomus. Interestingly, MetagenomeSeq analysis of P. tenuiflora samples and its comparison to those of S. glauca showed that no ASV was enriched significantly (Fig. 5E), which further verified the similarity of AM fungal community composition in the first two stages of saline-alkali grassland succession. Sixty-three ASVs were enriched in the P. tenuiflora stage compared to the L. chinensis (Fig. 5F) stage, among which 17 belonged to Glomus, two belonged to Paraglomus, and 29 were the overlapping species that were significantly enriched in the S. glauca stage, in contrast to the L. chinensis stage. These significantly enriched species were considered the markers of different succession stages, and they might play a great impact on the response of the community to grassland succession.
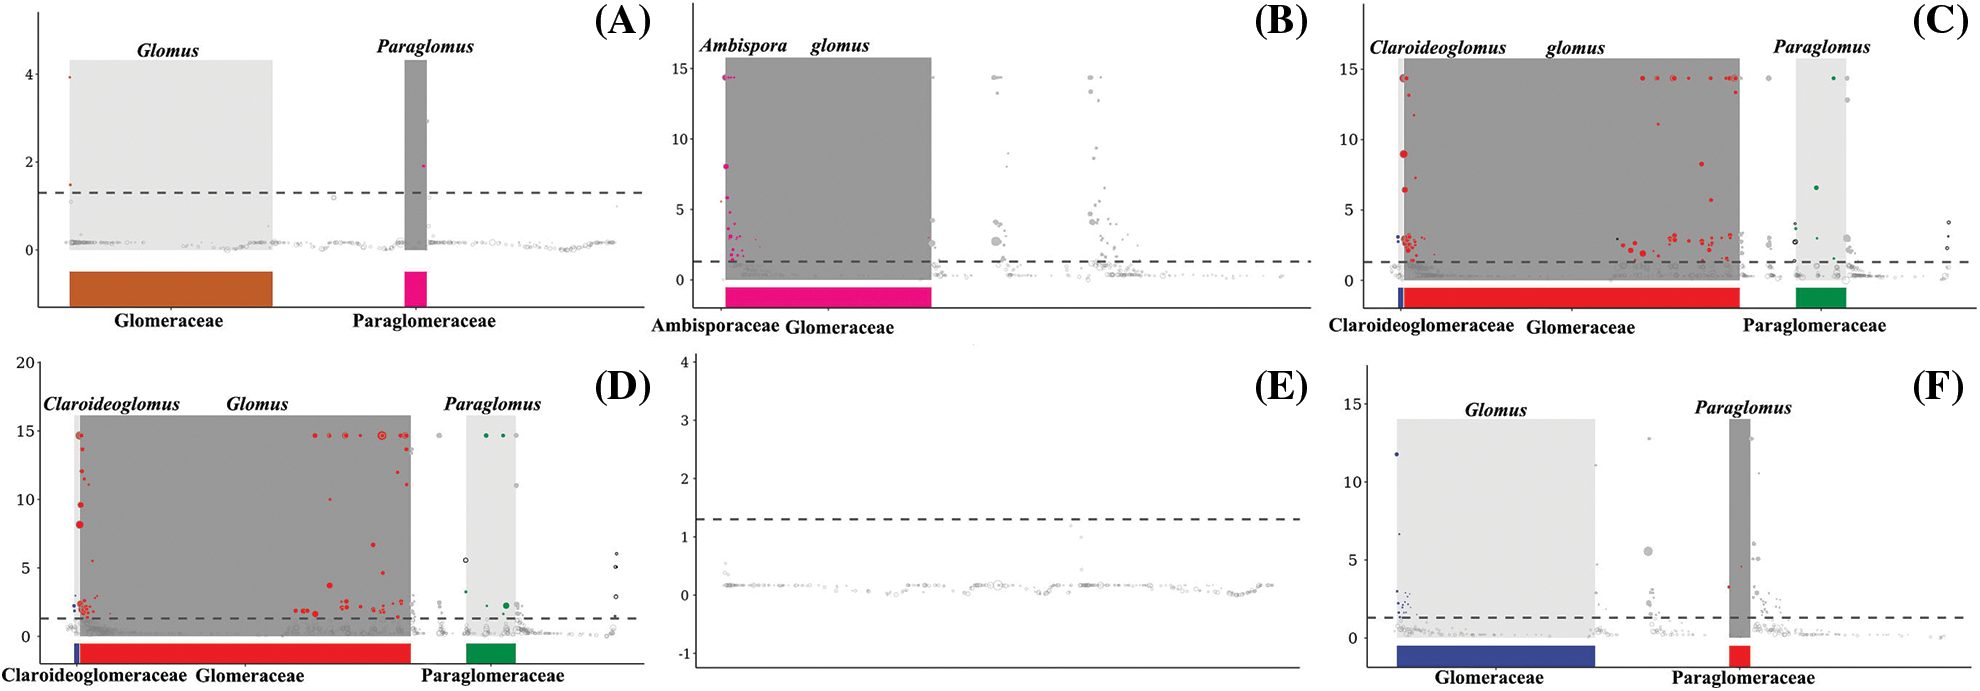
Figure 5: MetagenomeSeq analysis. A-Amplicon sequence variants (ASVs) enriched significantly in the Suaeda glauca stage compared with those in the Puccinellia Tenuiflora stage, B-A comparison of ASVs in S. glauca and Leymus chinensis stages, C-significantly enriched species in L. chinensis compared with those in the S. glauca stage, D-A comparison of ASVs in L. chinensis and P. tenuiflora stages, E- A comparison of P. tenuiflora and S. glauca stages, F- A comparison of P. tenuiflora and L. chinensis stages. The horizontal coordinate presents the taxonomic information; the ordinate is the -log10 (adj-p) value. Each dot or circle represents an ASV, the size represents its relative abundance, and the dotted line separates the significant differences from the insignificant ones. Gray background was added to the points in the top 10 genera, and the significantly up-regulated ASVs are shown by colored solid dots, while the insignificant ones are marked by gray rings.
Association network of Arbuscular Mycorrhiza fungi in different succession stages
The results of association networks analysis (Fig. 6A) of AM fungal community in different succession stages showed the closest association presented in the rhizosphere of L. chinensis, with a dense associated network having 38 nodes and 40 connections. The AM fungal community surrounding P. tenuiflora had the lowest association with only eight nodes, while the AM fungal community around S. glauca roots had 19 nodes and 18 lines. A high correlation suggested a close relationship between AM fungal species within the community. This also indicates that the community had low evolutionary diversity and was more vulnerable to dramatically changing conditions. Both the AM fungal composition in succession stages of S. glauca and P. tenuiflora had a lower correlation, indicating that their composition was diverse and the communities were stable. Moreover, the degree distribution analysis (Fig. 6B) of S. glauca and P. tenuiflora stages showed that the empirical network and random network possessed similar morphology and were presented as a regular bell shape, in line with the characteristics of the small-world network, equipped with high stability compared to the scale-free network that showed both random fault robustness and vulnerability to a targeted attack.
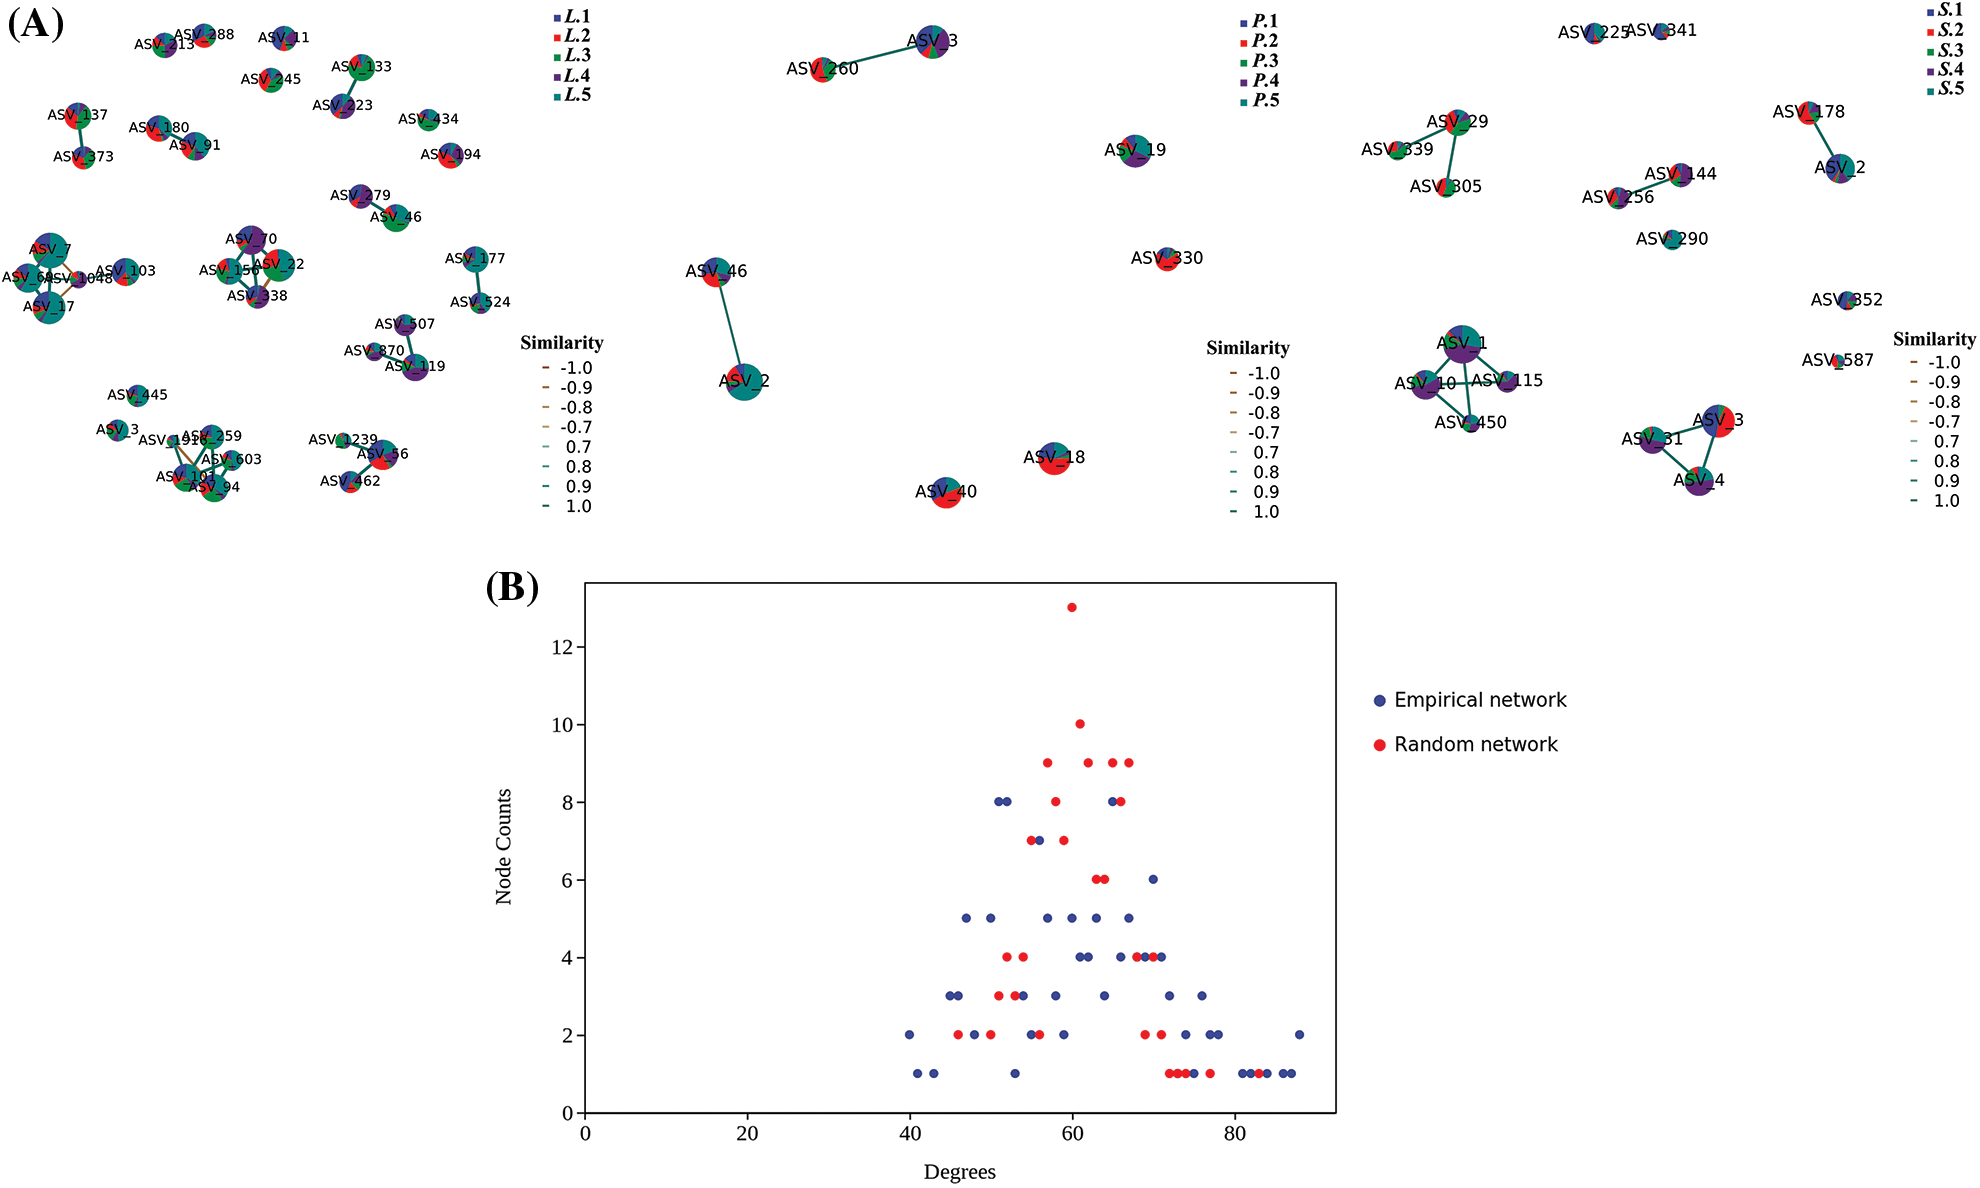
Figure 6: Association network of AM fungal communities and degree distribution analysis for Suaeda glauca and Puccinellia tenuiflora. L.-Leymus chinensis, S.-S. glauca, P.-P. tenuiflora. A-Various colors represent different samples, and digits indicate the serial number of quadrats. Each circle in the figures represents an ASV, and the associated line connects the ASVs. B-The Empirical network was constructed based on the sequencing data, and the Random network was constructed based on the Erdos Renyl model and the nodes and edges of the Empirical network.
Functional prediction of Arbuscular Mycorrhiza fungal communities in different succession stages
AM fungal communities often play ecological functions, which may be closely related to their metabolic pathways. Functional predictions (Fig. 7) were performed based on the pathway gene abundance of sequencing data to explore the functional differences in AM fungal communities in the three succession stages. No significant difference was observed between metabolic pathways of S. glauca and P. tenuiflora, which shared similarities in the community composition analysis. Seventy-eight differentially expressed metabolic pathways were observed in the L. chinensis stage compared to those in the S. glauca stage, 51 of which were significantly different (Fig. 7A). The metabolic pathways with the largest values of up-regulation and down-regulation were HSERMETANA-PWY and PWY-5754, respectively, and the metabolic processes involved were L-methionine biosynthesis III and 4-hydroxybenzoate biosynthesis I. The most significantly regulated metabolic process was palmitate biosynthesis I with the pathway number PWY-5994. A total of 77 differentially expressed metabolic pathways were observed in the L. chinensis stage compared with the P. tenuiflora stage, among which 46 were significantly different (Fig. 7B). The most significant difference was observed in the PWY-7007 pathway, whose primary function is methyl ketone biosynthesis. The largest up-regulation and down-regulation were observed in pathways PWY-6837 and PWY-5754, with respective functions of fatty acid beta-oxidation V (unsaturated, odd number, di-isomerase-dependent) and 4-hydroxybenzoate biosynthesis I (eukaryotes), respectively.
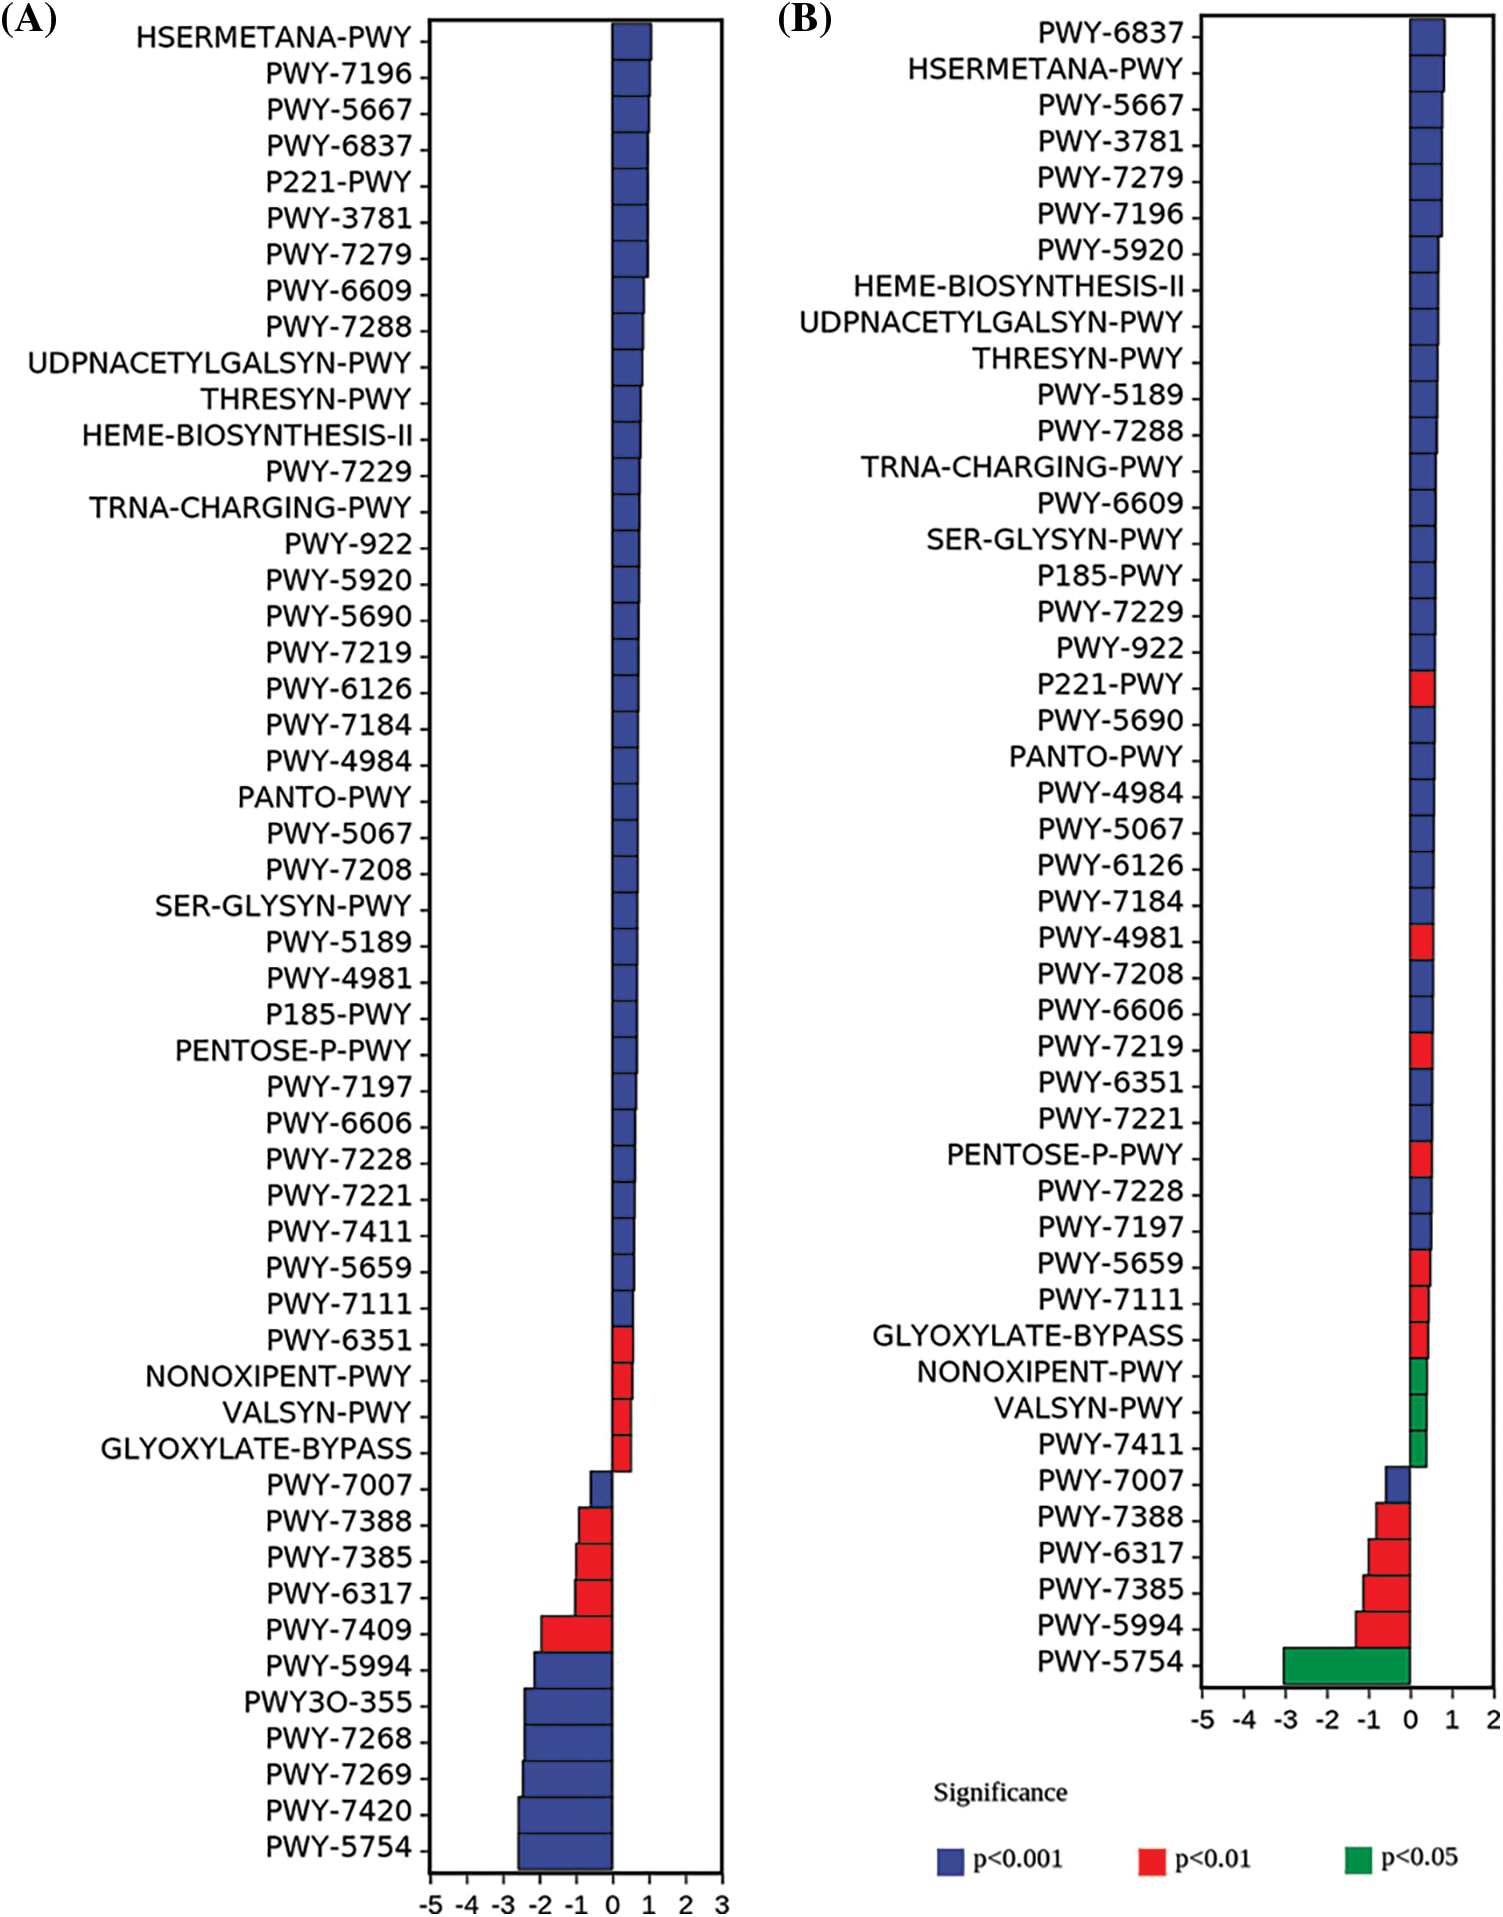
Figure 7: Differential analysis of metabolic pathway. A-Leymus chinensis compared with Suaeda glauca, B-L. chinensis stage compared with Puccinellia tenuiflora. Positive values on the horizontal axis represent up-regulation, while negative values indicate down-regulation; the ordinate presents the pathways and colors show the level of significance.
Response of Arbuscular Mycorrhiza fungal communities to the succession of saline-alkali grassland
The axis length of community data was 7.178 (> 4) so that CCA between AM fungal communities and soil properties were conducted to understand the response mechanism of AM fungal community to the succession of Songnen saline-alkali grassland (Fig. 8) and the characteristic values of CCA1 and CCA2 were 0.924 and 0.587, respectively. AM fungal communities in S. glauca and P. tenuiflora stages showed similarity, and that manifested as the relatively close distance in the figure. Cellulase activity exerted a slight and insignificant effect on AM fungal community, while the pH played the most significant effect (r = 0.977, p = 0.001). In addition, Total N content and sucrase activity also played a prominent impact on AM fungal community composition (r = 0.954, r = 0.94, p = 0.001). The directions of ASV_7, ASV_15, and ASV_17 were relatively consistent with Total N, Total P, OC, OM, and the activities of urease, sucrase, and catalase, showed a positive correlation, while ASV_1, ASV_2, ASV_3, ASV_4, ASV_5, ASV_6, and ASV_8 were negatively correlated with these indices but presented a positive correlation with cellulase activity, EC, carbonate, C/N, and pH. The arrows of these ASVs were lengthy and had a close projection distance with most of the quadrats, indicating that these ASVs played a great influence on the composition of AM fungal communities in different succession stages.
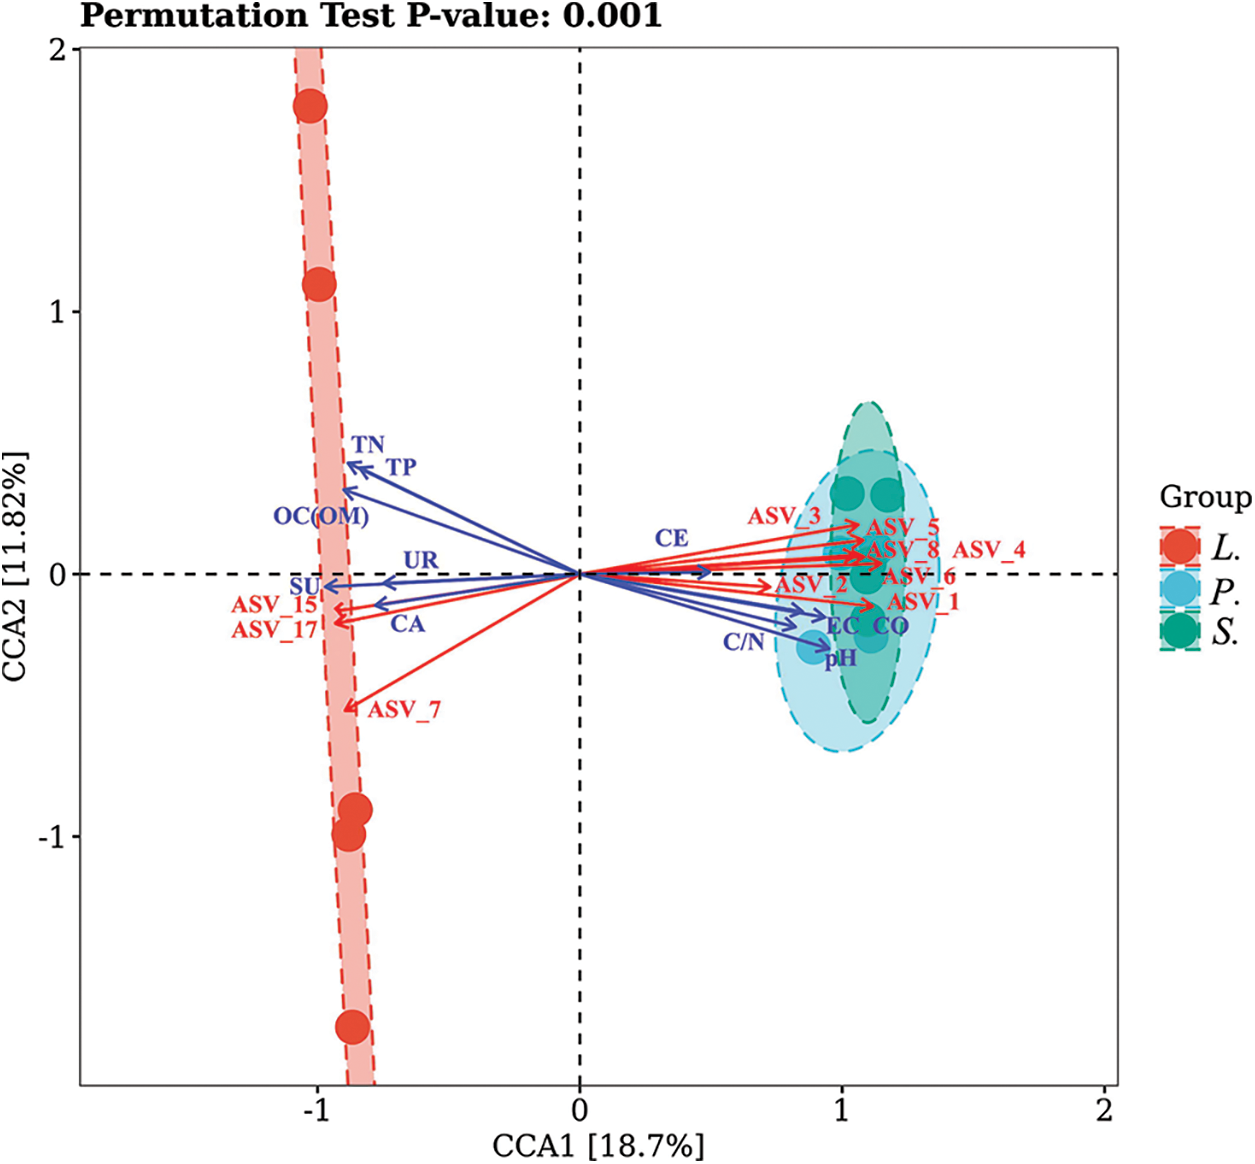
Figure 8: Canonical correlation analysis (CCA) between arbuscular mycorrhiza fungal community and different succession stages. TN-Total N, TP-Total P, CO-Carbonate, CE-Cellulase activity, UR-Urease activity, SU-Sucrase activity, CA-Catalase activity.
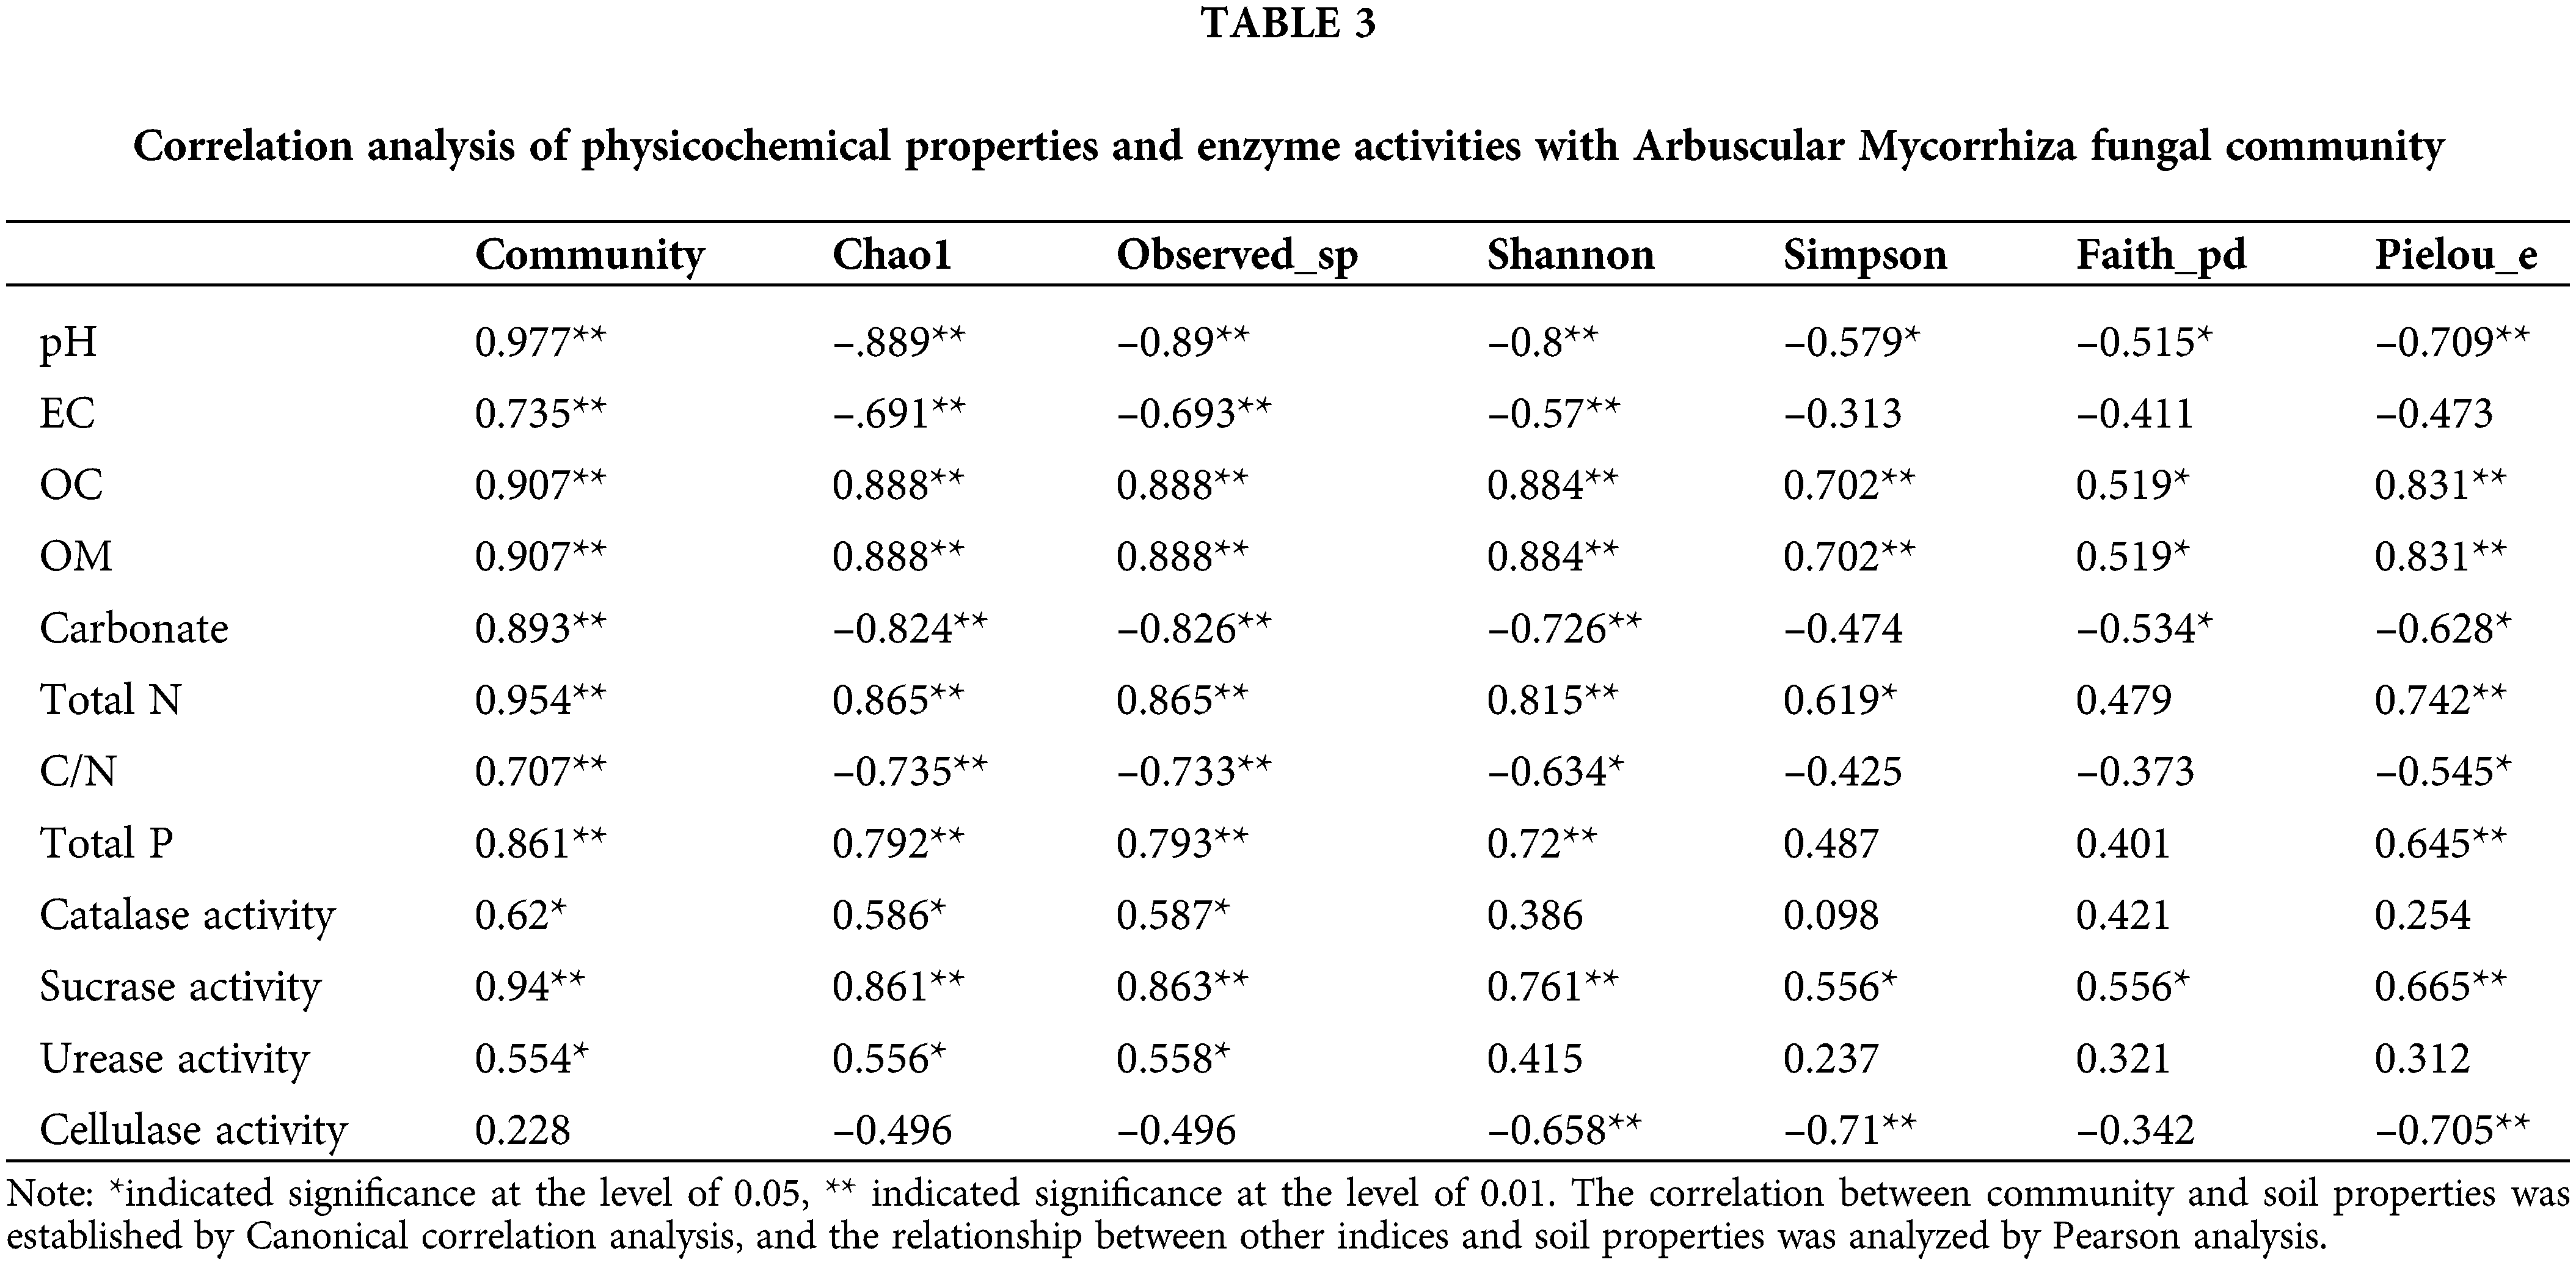
The correlation analysis (Table 3) between soil physicochemical properties and various alpha diversity indices showed the significant correlation of pH, OC, OM, and sucrase activity with all alpha diversity indices; among these, pH was negatively correlated with these indices. These properties not only affected the distribution of AM fungal species in the rhizosphere but also influenced the diversity within the communities. All the indicators except cellulase activity possessed significant or extremely significant associations with Chao1 and Observed_sp of AM fungal communities. The indices of eleven soil properties and enzyme activities jointly impacted the richness of AM fungal communities and the distribution of some species. Furthermore, various properties except for catalase activity and urease activity were significantly or extremely significantly associated with the Shannon index; among these, pH, OC, OM, Total N, and sucrase activity were also correlated with the Simpson index. These soil properties were important to drive the variation of communities. Pielou_e correlated with all the indices except for EC, catalase activity, and urease activity; the others exerted effects on the uniformity of AM fungal communities, among which the pH, carbonate, C/N, and cellulase activity were negatively associated with Pielou_e. The results also indicated that the pH, carbonate, C/N, and cellulase activity suppressed the homogeneous distribution of ASVs within the communities and exerted a selective role in the appearance of species.
Soil properties and enzyme activities in three succession stages
The salinization in Songnen saline-alkali grassland has aggravated in recent years compared with that reported in previous research (Chen, 2017; Yue, 2015). In the first succession stage after the alkali patch, the pH, EC, and CO content were the highest, confirming the highest degree of salinization. Furthermore, the soil quality improved, and the saline-alkali habitat was restored in the process of positive-going succession. The low-Total P content was observed at every stage, and it was related to the fact that the Songnen saline-alkaline soil has a high content of carbonates (Yan et al., 2015). The presence of abundant free calcium carbonate promotes the conversion of phosphorus to calcium phosphate (Bao, 2000). The gradual increase in the Total P content as the succession occurred, was in accordance with the variation in carbonate concentration in the three succession stages. The variation tendencies of OC, OM, and Total N were consistent, and the highest values were observed in the third stage (L. chinensis). Relevant studies have shown the C and N of different grassland types and natural zones were discrepant significantly (Wang et al., 2014). Moreover, these indicators were closely related to microbial activities. Interestingly, this investigation showed disparities in functional pathways and composition of AM fungal communities among three succession stages, which would affect the secretion and release of some substances. The comprehensive effect of the above factors may be the reason for the differences mentioned in OC, OM, and Total N. Furthermore, the changes in OC, OM, and Total N were also closely related to the activities of sucrase, cellulase, and urease. Sucrase improved the bioavailability of OM and OC (Xia et al., 2018), urease improved soil nitrogen supplement (Xie et al., 2017), and cellulase played an important role in the decomposition of plant residues to soil carbohydrates. The decomposition of hydrogen peroxide by catalase in the soil prevented its toxicity to organisms (Guan, 1986) so that catalase activity could act as an index to evaluate soil oxidation ability, and it also could be considered to associate with soil OM and microbes (Yang and Lu, 2022). Urease might manifest higher activity in response to the lacking Total N in the P. tenuiflora stage, ensuring N supply. Meanwhile, the salinity of Songnen saline-alkaline grassland showed dynamic variation among seasons (Su et al., 2020). As the intermediate stage of succession, P. tenuiflora might be more sensitive to environmental changes. The degradation or succession of grassland caused by the variation in salinity was brought about the residues decomposition of P. tenuiflora; subsequently, significantly high values of cellulase activity were presented at this stage. The variation in activities of catalase and sucrase showed a tendency that coincided with the succession sequence of Songnen saline-alkaline, indicating a possibly high correlation with salinity.
Arbuscular Mycorrhiza fungal diversity in different succession stages
The dominant AM fungal genus in all the three succession stages was Glomus. This was consistent with the previous research and the view that Glomus is a broad-spectrum symbiotic system (Araujo et al., 2021; Haug et al., 2021; Zhang et al., 1994). Furthermore, Paraglomus, Claroideoglomus, Diversispora, Ambispora, and Archaeospora were annotated in this study and accounted for some proportions. Due to the small size of the spores in these genera, their microspores produce a large number of spores in a short time and are easy to spread (Hepper, 1984). Community analysis showed that the alpha diversity, community composition, association network, and functional pathways of the L. chinensis stage differed significantly from the previous two stages. The consequence occurred due to environmental conditions, and the perspective that the composition of AM fungal community is highly influenced by environmental factors has been discussed in previous research (Davison et al., 2015; Dumbrell et al., 2010). The lowest salinization with higher environmental specialization presented in the L. chinensis stage, and its rhizosphere environment was more suitable than that of S. glauca and P. tenuiflora for the subsistence of AM fungi (Edwards et al., 2015). As a result, the AM fungi in the L. chinensis stage were highly diverse but with non-significant genetic diversity among the three stages. In the first two stages of succession (S. glauca and P. tenuiflora), while the soil properties and enzyme activities differed, the salinization was relatively serious in both, which might inhibit the colonization of AM fungi, resulting in insignificant differences in AM fungal community composition. Moreover, the succession in Songnen saline-alkali grassland was greatly affected by the rainy season (Yang et al., 2019); thus, the first two stages were unstable and prone to degradation, which resulted in the selection of AM fungi species. Therefore, less ASV was significantly enriched in S. glauca and P. tenuiflora stages compared to the L. chinensis stage. Community composition and functional pathways were often closely related to the function of AM fungi. The marker species and differential pathways at three stages might be related to the survival of AM fungal communities and hosts in special habitats. These fungi might play an important role in promoting saline-alkali succession, and the associated, distinct functional pathways should be further investigated. However, community analysis based on high-throughput sequencing technology lacked a complete database for species annotation, and some ASVs failed to be specifically classified. Classical morphological identification should be used to identify the AM fungi at different succession stages and to screen AM fungal species with high application value in later studies. The results of diversity analysis based on different sequencing targets were disparate (Justine et al., 2020). Internal transcribed spacer (ITS) possessed a 72% success rate in distinguishing fungi (Schoch et al., 2012), large subunit (LSU) worked better in the species annotation of some communities, and small subunit (SSU) was also commonly used in diversity analysis. It is more scientific and combines the sequencing results of different targets to analyze community diversity.
Arbuscular Mycorrhiza fungi responded to the succession of saline grassland
We observed a significant negative correlation between pH and alpha diversity, consistent with Adenan et al. (2020), and it verified the claim that pH directly affects the occurrence and population distribution of AM fungi (Adenan et al., 2020; Carvalho et al., 2003). The EC and carbonate content were also negatively correlated with multiple diversity indicators because saline stress limited the spore germination and mycelium growth (Medina et al., 2015). Besides, cellulase activity negatively correlated with AM fungal diversity because it participated in the decomposition of plant root residues (Wu et al., 2022) and could reduce the colonization sites of AM fungi; subsequently, some AM fungi died and the community diversity decreased. OC, OM, and sucrase activity are indicators related to soil nutrition, and they were associated with fungal community diversity in the rhizosphere of S. glauca, P. tenuiflora, and L. chinensis. Identical results were obtained in previous research (Ren et al., 2021); thus it could be interpreted that the areas with a richness of C sources and OM contribute to the growth and colonization of microorganisms (Li, 2012). Catalase activity was positively correlated with fungal diversity, and the possible reason was that the sample sites with high catalase activity cleared the hydrogen peroxide in the soil on time to avoid damage to plants and microorganisms. Conclusions for the impact of soil N content on AM fungal community diversity are confusing (Emery et al., 2022; Justine et al., 2020). Exogenous addition experiments showed that N application could increase the AM fungal richness and diversity in the condition of P deficiency (Louise et al., 2007), demonstrating a positive correlation between N and AM fungal diversity, consistent with the results of this study. Urease activity was associated with N supply and thus showed consistent results with N. It was noteworthy that Total P content was positively correlated with AM fungal diversity, contrary to the previous understanding (Jerbi et al., 2021; Chen et al., 2014); we hypothesize that the low P content in the experimental quadrats significantly inhibited the growth of plants. The P content increased within a certain range and guaranteed the nutrient supply of plants, thus ensuring the stability of symbiosis and increasing the diversity of AM fungi. These results are of great significance for the realization of the response of AM fungal community composition to the succession of saline-alkali land and lay a foundation for further research on the functional characteristics of AM fungal communities in different succession stages. These response mechanisms should be unraveled at the molecular level in future studies to thus provide technical support for artificial regulation of community composition and function.
Five hypotheses were tested in this study. First, the AM fungal community composition differed among different succession stages, though some similarities existed in the first and second stages (harboring S. glauca and P. tenuiflora), such as no significant difference in alpha diversity and functional pathways. Second, the highest species abundance presented at the third stage (L. chinensis community) with a significantly large alpha-value. The results also showed that the soil properties improved with the succession of saline-alkali grassland, and these soil characteristics drove the variation in AM fungal community composition and the enzyme activities correlated with the AM fungal distribution. Last but not least, we observed that Total P content did not inhibit the AM fungal diversity; on the contrary, the diversity increased with the augmented Total P content, indicating that this hypothesis was not correct.
Acknowledgement: The authors gratefully acknowledge the sequencing service provided by Personal Biotechnology Co., Ltd., Shanghai, China. And we are sincerely thankful to the help from Yunhui Zhou, Wenna Zhao and Jiamei Xu.
Availability of Data and Materials: All data generated or analyzed during this study are included in this published article.
Author Contribution: Yajie Liu-Completed the research and manuscript; Linlin Fang-Assisted in experiments and checked the manuscript; Chunxue Yang conceived the research, directed manuscript writing, and managed the acquisition of funds.
Funding Statement: This work was supported by the National Natural Science Foundation of China (31601986), Heilongjiang Postdoctoral Scientific Research Developmental Fund (LBH-Q16005).
Conflicts of Interest: The authors declare that they have no conflicts of interest to report regarding the present study.
Adenan S, Oja J, Alatalo JM, Shraim AM, Alsafran M et al. (2020). Diversity of arbuscular mycorrhizal fungi and its chemical drivers across dryland habitats. Mycorrhiza 31: 685–697. DOI 10.1007/s00572-021-01052-3. [Google Scholar] [CrossRef]
Araujo ASF, Melo VMM, Pereira APD, Lopes ACD, Rocha SMB et al. (2021). Arbuscular mycorrhizal community in soil from different Brazilian Cerrado physiognomies. Rhizosphere 19: 100375. DOI 10.1016/j.rhisph.2021.100375. [Google Scholar] [CrossRef]
Bao SD (2000). Soil agriculture chemical analysis. Beijing: China Agriculture Press. [Google Scholar]
Bastian M, Heymann S, Jacomy M (2009). Gephi: An open source software for exploring and manipulating networks. San Jose, USA. [Google Scholar]
Blois JL, Williams JW, Fitzpatrick MC, Jackson ST, Ferrier S (2013). Space can substitute for time in biodiversity. PNAS 110: 9374–9379. DOI 10.1073/pnas.1220228110. [Google Scholar] [CrossRef]
Bokulich NA, Kaehler BD, Rideout RJ, Dillon M, Bolyen E et al. (2018). Optimizing taxonomic classification of marker-gene amplicon sequences with qiime 2’s q2-feature-classifier plugin. Microbiome 6: 90. DOI 10.1186/s40168-018-0470-z. [Google Scholar] [CrossRef]
Callahan BJ, Mcmurdie PJ, Rosen MJ, Han AW, Johnson AJ et al. (2016). Dada2: High-resolution sample inference from illumina amplicon data. Nature Methods 13: 581–583. DOI 10.1038/nmeth.3869. [Google Scholar] [CrossRef]
Carrión VJ, PerezJaramillo J, Cordovez V, Tracanna V, Hollander M et al. (2019). Pathogen-induced activation of disease-suppressive functions in the endophytic root microbiome. Science 366: 606–612. DOI 10.1126/science.aaw9285. [Google Scholar] [CrossRef]
Carvalho LM, Correia PM, Caçador I, Martins-Loução MA (2003). Effects of salinity and flooding on the infectivity of salt marsh arbuscular mycorrhizal fungi in Aster tripolium L. Biology and Fertility of Soils 38: 137–143. DOI 10.1007/s00374-003-0621-6. [Google Scholar] [CrossRef]
Chao A (1984). Nonparametric estimation of the number of classes in a population. Scandinavian Journal of Statistics 11: 265–270. [Google Scholar]
Chen F (2017). Research of diversity and function of AM fungi from Puccinellia tenuiflora rhizosphere in Songnen alkaline grassland (M.D. Thesis). Northeast Forestry University, Harbin, China. [Google Scholar]
Chen YL, Zhang X, Ye JS, Han HY, Wan SQ et al. (2014). Six-year fertilization modifies the biodiversity of arbuscular mycorrhizal fungi in a temperate steppe in Inner Mongolia. Soil Biology and Biochemistry 69: 371–381. DOI 10.1016/j.soilbio.2013.11.020. [Google Scholar] [CrossRef]
Davison J, Moora M, Öpik M, Adholeya A, Ainsaar L et al. (2015). Global assessment of arbuscular mycorrhizal fungus diversity reveals very low endemism. Fungal Symbionts 349: 970–973. DOI 10.1126/science.aab1161. [Google Scholar] [CrossRef]
Dumbrell AJ, Nelson M, Helgason T, Dytham C, Fitter AH (2010). Relative roles of niche and neutral processes in structuring a soil microbial community. ISME Journal 4: 337–345. DOI 10.1038/ismej.2009.122. [Google Scholar] [CrossRef]
Edwards J, Johnson C, Santos-Medellín C, Lurie E, Podishetty NK et al. (2015). Structure, variation, and assembly of the root-associated microbiomes of rice. PNAS 112: 911–920. DOI 10.1073/pnas.1414592112. [Google Scholar] [CrossRef]
Emery SM, Bell-Dereske L, Stahlheber KA, Gross KL (2022). Arbuscular mycorrhizal fungal community responses to drought and nitrogen fertilization in switchgrass stands. Applied Soil Ecology 169: 104218. DOI 10.1016/j.apsoil.2021.104218. [Google Scholar] [CrossRef]
Faith DP (1992). Conservation evaluation and phylogenetic diversity. Biological Conservation 61: 1–10. DOI 10.1016/0006-3207(92)91201-3. [Google Scholar] [CrossRef]
Garcia-Franco N, Wiesmeier M, Hurtarte LCC, Fella F, Martinez-Mena M et al. (2021). Pruning residues incorporation and reduced tillage improve soil organic matter stabilization and structure of salt-affected soils in a semi-arid Citrus tree orchard. Soil and Tillage Research 213: 105129. DOI 10.1016/j.still.2021.105129. [Google Scholar] [CrossRef]
Garcia-Sanchez M, Cajthaml T, Filipova A, Tlustos P, Szakova J et al. (2019). Implications of mycoremediated dry olive residue application and arbuscular mycorrhizal fungi inoculation on the microbial community composition and functionality in a metal-polluted soil. Journal of Environmental Management 101: 756–765. DOI 10.1016/j.jenvman.2019.05.101. [Google Scholar] [CrossRef]
Ghanbarzadeh Z, Mohsenzadeh S, Rowshan V, Zarei M (2020). Mitigation of water deficit stress in Dracocephalum moldavica by symbiotic association with soil microorganisms. Scientia Horticulturae 272: 109549. DOI 10.1016/j.scienta.2020.109549. [Google Scholar] [CrossRef]
Good IJ (1953). The population frequency of species and the estimation of the population parameters. Biometrics 40: 237–246. DOI 10.1093/biomet/40.3-4.237. [Google Scholar] [CrossRef]
Guan YM (1986). Soil Enzymes and Research Methods. Beijing: China Agriculture Press. [Google Scholar]
Haug I, Setaro S, Suarez JP (2021). Global AM fungi are dominating mycorrhizal communities in a tropical premontane dry forest in Laipuna, South Ecuador. Mycological Progress 20: 837–845. DOI 10.1007/s11557-021-01699-4. [Google Scholar] [CrossRef]
Heck KL, van BG, Simberloff D (1975). Explicit calculation of the rarefaction diversity measurement and the determination of sufficient sample size. Ecology 56: 1459–1461. [Google Scholar]
Hepper CM (1984). Isolation and culture of VA mycorrhizal (VAM) fungi. In: Powell CL, Bagyaraj DJ (eds.VA Mycorrhizae. Florida: CRC Press. [Google Scholar]
Jerbi M, Labidi S, Bahri BA, Laruelle F, Tisserant B et al. (2021). Soil properties and climate affect arbuscular mycorrhizal fungi and soil microbial communities in Mediterranean rainfed cereal cropping systems. Pedobiologia 87-88: 150748. DOI 10.1016/j.pedobi.2021.150748. [Google Scholar] [CrossRef]
Jia HM, Fang Q, Zhang SH, Yan ZY, Liu M (2020). Effects of AM fungi on growth and rhizosphere soil enzyme activities of Salvia miltiorrhiza. Acta Prataculturae Sinica 29: 83–92. DOI 10.11686/cyxb2019494. [Google Scholar] [CrossRef]
Jin H, Yang XY, Liu HY, Zhao YH, Zheng WL et al. (2021). The structure of rhizosphere soil and endophytic fungal communities associated with Stipa purpurea and their correlation with soil environmental factors. Acta Microbiologica Sinica 61: 3520–3541. DOI 10.13343/j.cnki.wsxb.20210071. [Google Scholar] [CrossRef]
Justine K, Joshua W, Joseph DB, James F, Scott XC et al. (2020). Long-term nitrogen addition does not sustain host tree stem radial growth but doubles the abundance of high-biomass ectomycorrhizal fungi. Global Change Biology 27: 4125–4138. DOI 10.1111/gcb.15713. [Google Scholar] [CrossRef]
Kemp PF, Aller JY (2004). Bacterial diversity in aquatic and other environments: What 16S rDNA libraries can tell us. FEMS Microbiology Ecology 47: 161–177. DOI 10.1016/S0168-6496(03)00257-5. [Google Scholar] [CrossRef]
Li Q, Xiang XJ, Du YG, Li YK, Lin L et al. (2021). Arbuscular mycorrhizal fungal community structure following different grazing intensities in an alpine grassland. Soil Biology and Biochemistry 85: 1620–1633. DOI 10.1002/saj2.20218. [Google Scholar] [CrossRef]
Li QS, Li XJ, Li XJ, Wang ZC, Song CC et al. (2003). Sodium bicarbonate soil management and utilization in Sngnen Plain. Resources Science 25: 15–20. [Google Scholar]
Li X (2012). Effects of Different Control Measures on Cucumber Yield and Soil Environmental Quality in Solar Greenhouse (M.D. Thesis). Shandong Normal University, Jinan, China. [Google Scholar]
Li Y, Jiao H, Xu LJ, Zhao HH, Liu RJ (2010). Advances in the study of community structure and function of arbuscular mycorrhizal fungi. Acta Ecologica Sinica 30: 1089–1096. [Google Scholar]
Li YF, Gong HY, Li SJ, Zhang YS (2020). Ecological stoichiometry homeostasis of six microelements in Leymus chinensis growing in soda Saline-Alkali Soil. Sustainability 12: 4226. DOI 10.3390/su12104226. [Google Scholar] [CrossRef]
Li YH, Yao T, Gao YM, Zhang JG, Ma YC et al. (2019). Relationship between soil fungal community and soil environmental factors in degraded alpine grassland. Acta Microbiologica Sinica 59: 678–688. DOI 10.13343/j.cnki.wsxb.20180257. [Google Scholar] [CrossRef]
Liu RJ, Tang M, Chen YL (2017). Recent advances in the study of mycorrhizal fungi and stress resistance of plants. Journal of Fungal Research 15: 77–88. DOI 10.13341/j.jfr.2014.1711. [Google Scholar] [CrossRef]
Liu XJ, Liu MY (2002). Halophyte Utilization and Regional Sustainable Development of Agriculture. Beijing: Meteorological Press. [Google Scholar]
Liu XL, Liu YS, Sun LQ, Sun T (2018). Effect of grassland degradation on vegetation and soil properties in the middle of the Songnen Plain. Pratacultural Science 35: 2347–2353. [Google Scholar]
Louise M, Egerton W, Nancy CJ, Edith BA (2007). Mycorrhizal community dynamics following nitrogen fertilization: A cross-site test in five grasslands. Ecological Monographs 77: 527–544. DOI 10.1890/06-1772.1. [Google Scholar] [CrossRef]
Manceau A, Nagy KL, Marcus MA, Lanson M, Geoffroy N et al. (2008). Formation of metallic copper nanoparticles at the soil-root interface. Environmental Science and Technology 42: 1766–1772. DOI 10.1021/es072017o. [Google Scholar] [CrossRef]
Medina J, Meier S, Rubio R, Curaqueo G, Borie F et al. (2015). Arbuscular mycorrhizal status of pioneer plants from the mouth of lake Budi, Araucania Region. Chile Journal of Soil Science and Plant Nutrition 15: 142–152. DOI 10.4067/S0718-95162015005000012. [Google Scholar] [CrossRef]
Meng FR (1996). Forest Mycorrhizal Science. Harbin: Northeast Forestry University Press. [Google Scholar]
Pielou EC (1966). The measurement of diversity in different types of biological collections. Journal of Theoretical Biology 13: 131–144. DOI 10.1016/0022-5193(66)90013-0. [Google Scholar] [CrossRef]
Ren AT, Mickan BS, Li JY, Zhou R, Zhang XC et al. (2020). Soil labile organic carbon sequestration is tightly correlated with the abundance and diversity of arbuscular mycorrhizal fungi in semiarid maize fields. Land Degradation and Development 32: 1224–1236. DOI 10.1002/ldr.3773. [Google Scholar] [CrossRef]
Ren QX, Zeng Q, Zhang BX, Liu XL, Wang JH (2021). Analysis of dynamic changes of rhizospheric fungal community of soybean based on high-throughput sequencing. Journal of Plant Molecular Breeding 19: 4836–4845. DOI 10.13271/j.mpb.019.004836. [Google Scholar] [CrossRef]
Rilling CR, Mummey DL (2006). Mycorrhizal and soil structure. New Phytologist 171: 41–53. DOI 10.1111/j.1469-8137.2006.01750.x. [Google Scholar] [CrossRef]
Schoch CL, Seifert KA, Huhndorf S, Robert V, Spouge JL et al. (2012). Nuclear ribosomal internal transcribed spacer (ITS) region as a universal DNA barcode marker for Fungi. PNAS 109: 6241–6246. DOI 10.1073/pnas.1117018109. [Google Scholar] [CrossRef]
Shannon CE (1948). A mathematical theory of communication. Bell System Technical Journal 27: 623–656. DOI 10.1002/j.1538-7305.1948.tb00917.x. [Google Scholar] [CrossRef]
Simpson EH (1949). Measurement of diversity. Nature 163: 688–688. DOI 10.1038/163688a0. [Google Scholar] [CrossRef]
Su X, Lu M, Feng CC, Guo YL, Yue ZH (2020). Responses of seasonal dynamic of soil enzyme activity to soil salinity in Songnen Saline-Alkali grassland. Chinese Journal of Grassland 42: 127–134. DOI 10.16742/j.zgcdxb.20190091. [Google Scholar] [CrossRef]
Sun GY, Wang HX (2016). Large scale development to saline-alkali soil and risk control for the Songnen Plain. Resources Science 38: 407–413. [Google Scholar]
Sun GR, Yan XF, Li J, Yu ZZ (2002). Effects of growth of Puccinellia tenuiflora on the chemical properties of alkali soil. Acta Agrestia Sinica 3: 179–183. [Google Scholar]
van WA, van VJ, Smant W, Boschker HTS, Bloem J et al. (2006). Fungal biomass development in a chronosequence of land abandonment. Soil Biology and Biochemistry 38: 51–60. DOI 10.1016/j.soilbio.2005.04.017. [Google Scholar] [CrossRef]
Vieira CK, Marascalchi MN, Rodrigues AV, de Armas RD, Sturmer SL (2018). Morphological and molecular diversity of arbuscular mycorrhizal fungi in revegetated iron-mining site has the same magnitude of adjacent pristine ecosystems. Journal of Environmental Sciences 67: 330–343. DOI 10.1016/j.jes.2017.08.019. [Google Scholar] [CrossRef]
Wang JL, Zhong ZM, Wang ZH, Yu CQ, Shen ZX et al. (2014). Soil C/N distribution characteristics of alpine steppe ecosystem in Qinhai Tibetan Plateau. Acta Ecologica Sinica 34: 6678–6691. [Google Scholar]
Wang YN, Lin JX, Huang SC, Zhang L, Zhao WN et al. (2019). Isobaric tags for relative and absolute quantification-based proteomic analysis of Puccinellia tenuiflora inoculated with arbuscular mycorrhizal fungi reveal stress response mechanisms in alkali-degraded soil. Land Degradation and Development 30: 1584–1598. DOI 10.1002/ldr.3346. [Google Scholar] [CrossRef]
Wu JJ, Zhang Q, Zhang DD, Jia W, Chen J et al. (2022). The ratio of ligninase to cellulase increased with the reduction of plant detritus input in a coniferous forest in subtropical China. Applied Soil Ecology 170: 104269. DOI 10.1016/j.apsoil.2021.104269. [Google Scholar] [CrossRef]
Xia LL, Lam SK, Wolf B, Kiese R, Chen D et al. (2018). Trade-offs between soil carbon sequestration and reactive nitrogen losses under straw return in global agroecosystems. Global Change Biology 24: 5919–5932. DOI 10.1111/gcb.14466. [Google Scholar] [CrossRef]
Xie XF, Pu LJ, Wang QQ, Zhu M, Xu Y et al. (2017). Response of soil physicochemical properties and enzyme activities to long-term reclamation of coastal saline soil, Eastern China. Science of the Total Environment 607: 1419–1427. DOI 10.1016/j.scitotenv.2017.05.185. [Google Scholar] [CrossRef]
Yan NN, Cui GW, Zhang X, Li JX (2015). The influence of straw covering and reseeding on soil ion content in saline and alkaline grassland in Songnen Plain. Chinese Journal of Grassland 37: 112–116. [Google Scholar]
Yan XF, Sun GR (2000). Study on Physiology and Ecology of Puccinellia tenuiflora. Beijing: Science Press. [Google Scholar]
Yang CD, Lu SG (2022). Straw and straw biochar differently affect phosphorus availability, enzyme activity and microbial functional genes in an Ultisol. Science of the Total Environment 805: 150325. DOI 10.1016/j.scitotenv.2021.150325. [Google Scholar] [CrossRef]
Yang CX, Chen F, Yue YN, Yan XF (2015). Diversity characteristics of arbuscular mycorrhizal fungi in the rhizosphere of twenty six species of plants in Songnen saline-alkaline grassland. Prataculturae Science 32: 2008–2020. DOI 10.11829/j.issn.1001-0629.2015-2020. [Google Scholar] [CrossRef]
Yang F, Cao HM, Chen YY, Wang JL (2019). Research progress on structure and identification method of arbuscular mycorrhizal fungi. Modern Agricultural Science and Technology 16: 152–157. [Google Scholar]
Yue YN (2015). Effects of arbuscular mycorrhizal fungi on the salt tolerance of plants in saline-alkaline grassland of Songnen Plain. M.D Thesis of Northeast Forestry University, Harbin, China. [Google Scholar]
Zgadzaj R, Garridooter R, Jensen DB, Koprivova A, Schulzelefert P et al. (2016). Root nodule symbiosis in Lotus japonicus drives the establishment of distinctive rhizosphere, root, and nodule bacterial communities. PNAS 113: E7996–E8005. DOI 10.1073/pnas.1616564113. [Google Scholar] [CrossRef]
Zhai HL, Zhang LH, Wang G (2021). Effects of Saline-Alkali meadow vegetation degradation on soil nitrification intensity. Research of Soil and Water Conservation 28: 21–26. DOI 10.13869/j.cnki.rswc.2021.02.004. [Google Scholar] [CrossRef]
Zhang MQ, Wang YS, Zhang C, Huang L (1994). The ecological distribution characteristics of some genera and species of VAM fungi in Northern China. Mycosystema 13: 166–172. [Google Scholar]
Zhao DD, Wei JP, Ma HY, Li Y, Ning QR et al. (2018). Effects of degraded grassland soils on seed germination and seedling growth of Leymus chinensis in Songnen Plain. Soil Crop 7: 423–431. [Google Scholar]
Zhao L, Wang H, Liang ZW, Zhang ZH, Tang ZH et al. (2016). Leaf N and P stoichiometry of Leymus chinensis in relation to soil properties in Saline-alkali degraded grassland. Bulletin of Botanical Research 36: 768–774. [Google Scholar]
 | This work is licensed under a Creative Commons Attribution 4.0 International License, which permits unrestricted use, distribution, and reproduction in any medium, provided the original work is properly cited. |