DOI:10.32604/biocell.2022.016989
| BIOCELL DOI:10.32604/biocell.2022.016989 | |
| Article |
WGCNA and LASSO algorithm constructed an immune infiltration-related 5-gene signature and nomogram to improve prognosis prediction of hepatocellular carcinoma
1School of Medicine, Jianghan University, Wuhan, 430056, China
2Department of Mechanics and Engineering Structure, Wuhan University of Technology, Wuhan, 430070, China
*Address correspondence to: Han Zhao, zhaohan@mail.ustc.edu.cn
Received: 17 April 2021; Accepted: 14 May 2021
Abstract: Hepatocellular carcinoma (HCC) is a common immunogenic malignant tumor. Although the new strategies of immunotherapy and targeted therapy have made considerable progress in the treatment of HCC, the 5-year survival rate of patients is still very low. The identification of new prognostic signatures and the exploration of the immune microenvironment are crucial to the optimization and improvement of molecular therapy strategies. We studied the potential clinical benefits of the inflammation regulator miR-93-3p and mined its target genes. Weighted gene co-expression network analysis (WGCNA), univariate and multivariate COX regression and the LASSO COX algorithm are employed to identify prognostic-related genes and construct multi-gene signature-based risk model and nomogram for survival prediction. Support vector machine (SVM) based Cibersort’s deconvolution algorithm and gene set enrichment analysis (GSEA) is used to evaluate the changes in tumor immune microenvironment and pathway differences. The study found the favorable prognostic performance of miR-93-3p and identified 389 prognostic-related target genes. The risk model based on a novel 5-gene signature (cct5, cdk4, cenpa, dtnbp1 and flvcr1) was developed and has prominent prognostic significance in the training cohort (P < 0.0001) and validation cohort (P = 0.0016). The nomogram constructed by combining the gene signature and the AJCC stage further improves the survival prediction ability of the gene signature. The infiltration level of multiple immune cells (especially T cells, B cells and macrophages) were positively correlated with the expression of prognostic signature. In addition, we found that gene markers of T cells and B cells is monitored and regulated by prognostic signature. Meanwhile, several GSEA pathways related to the immune system are enriched in the high-risk group. In general, we integrated the WGCNA, LASSO COX and SVM algorithms to develop and verify 5-gene signatures and nomograms related to immune infiltration to improve the survival prediction of patients.
Keywords: Hepatocellular carcinoma; MicroRNA; Prognostic prediction; Gene signature; Nomogram; Immune infiltration
Liver cancer is the sixth most common malignant tumor, and its mortality ranks fourth among cancer-induced deaths in the world (Bray et al., 2018). Hepatocellular carcinoma (HCC) accounts for about 75–85%, which is the most frequent histological subtype in primary liver cancer (Lange and Dufour, 2019). The global burden of HCC is increasing and may soon exceed the incidence of 1 million cases per year (Llovet et al., 2018). The 5-year survival rate of HCC patients is less than 20% due to high recurrence frequency and heterogeneity (Buonaguro et al., 2019). Although early diagnosis is related to long-term survival, the diagnosis rate of early HCC patients is less than 60% through the current monitoring system (Zhao et al., 2020). Therefore, the development of new diagnostic and prognostic biomarkers is very necessary and urgent.
microRNA (miRNA) is a non-coding single chain RNA composed of about 22 nucleotides, which participates in the regulation of post-transcriptional gene expression (He and Hannon, 2004). The abnormal expression of various miRNAs has been found to play a key role in cell carcinogenesis and cancer progression. Furthermore, several miRNA-related clinical trials have been tried and achieved positive outcome (Liu et al., 2020b; Piasecka et al., 2018). Recently, miR-93-3p has been found to be a tumor-sensitive molecule that can affect the development of various cancers. For example, the silencing of miR-93-3p can reverse the promotion of long noncoding RNA ZNF667-AS1 on tumor invasion and metastasis in cervical cancer (Li et al., 2019). In addition, miR-93-3p was identified as a biomarker and potential therapeutic target because of the outstanding prognostic ability in clear cell renal cell carcinoma and triple-negative breast cancer (Li et al., 2017; Wang et al., 2017b). The anti-inflammatory effect and diagnostic performance of miR-93-3p have also been discovered in non-tumor diseases (Aguado-Fraile et al., 2015; Tang et al., 2018). Recently, several studies have exposed the potential regulatory role of miR-93-3p in liver cancer. The interaction between miR-93-3p and has_circ_0005075 is closely involved in cell adhesion, which may be a key part of the proliferation, invasion and metastasis of liver cancer cells (Shang et al., 2016). In addition, the abnormally high expression of miR-93-3p accompanies the whole process of colorectal cancer metastasis to liver cancer. And targeting CTGF and FOXP1 involved in cell migration and targeting RFNG and NFATC3 controlled Notch signaling pathway and tight junction may be potential mechanisms for accelerating tumor cell proliferation (Salehi et al., 2019). ZFX has been proven to promote the proliferation and migration of liver cancer cells (Wang et al., 2017a), and other studies have found that miR-93-3p promotes the proliferation and metastasis of keratinocytes through the ZFP36L1/ZFX axis (Feng et al., 2021). The specific molecular mechanism and clinical benefits of miR-93-3p in liver cancer are still unclear.
Molecular biomarkers show superior performance in tumor diagnostic, prognostic assessment, and identification of potentially high-risk patients. However, the predictive capability of single biomarker is usually defective. Conversely, the signature constructed by multiple prognostic biomarker show better prediction performance (Liu et al., 2020c; Zhang et al., 2020a). Prognostic gene signatures shown an advantage in the prognosis of HCC due to the development of genome sequencing technology (Liu et al., 2020a). Nonetheless, the clinical application of high-throughput sequencing technology is limited due to the heterogeneity of the tumor microenvironment. The immune response of tumor cells escaping from the host immune response and continuing to grow is widespread in human cancer (Fujita et al., 2020). At present, the treatment strategies based on the infiltration of immune cells have achieved considerable progresses in HCC patients (Chen and Mellman, 2013). The disadvantage is that the treatment strategy is only applicable to a small number of patients. The combination of immunotherapy and targeted therapy is expected to overcome the poor prognosis after standard treatment in cancer (Gotwals et al., 2017). Several immune-related events (mainly tumor-infiltrating lymphocytes) were reported to be closely related to the prognosis of HCC patients (Kim et al., 2018). Therefore, an extensive study of the immune microenvironment would help elucidate complex anti-tumor responses to provide guidance to effective treatment strategies.
In our previous studies, we investigated biophysical properties of nucleic acids computationally (Chi and Jiang, 2012; Chi et al., 2013), and a variety of biomarkers and potential therapeutic targets for inflammation regulation were identified by experimental and bioinformatics methods (Chi et al., 2020; Xu et al., 2019a; Xu et al., 2019b). The study used the cancer genome atlas (TCGA) database and analyzed the diagnosis and prognostic performance of miR-93-3p in HCC. Weighted gene co-expression network analysis (WGCNA) was employed to construct co-expression network based on target genes of miR-93-3p. Then, the univariate COX regression analysis and the least absolute shrinkage and selection operator (LASSO) algorithm were used to establish multi-gene signature-based risk score and nomogram to predict survival of patients. Finally, the correlation between prognostic signature and immune cell infiltration was explored through CIBERSORT, TIMER and GEPIA2. Gene set enrichment analysis (GSEA) were used to evaluate pathway differences in different risk groups. The whole flowchart of the study was shown in Fig. 1.
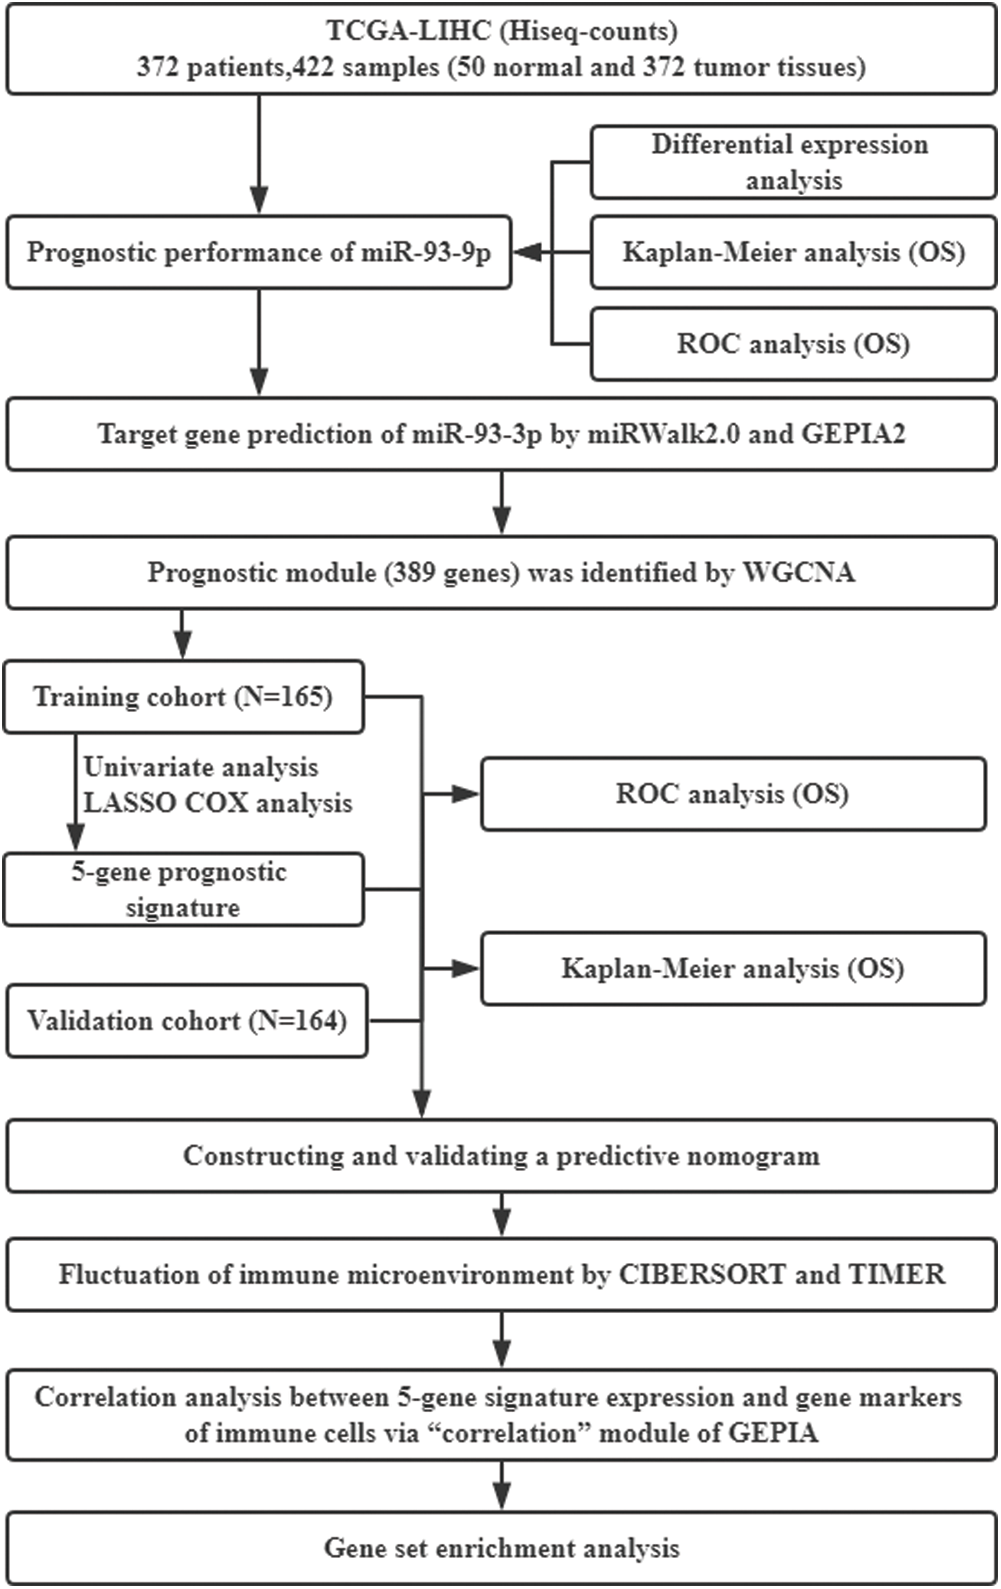
Figure 1: General flow chart of the paper. TCGA, The Cancer Genome Atlas; LIHC, Liver hepatocellular carcinoma; OS, Overall survival; ROC, Receiving operating characteristic; WGCNA, Weighted gene co-expression network analysis; LASSO, least absolute shrinkage and selection operator.
Data collection and preprocessing
Based on the keywords of liver cancer and miRNA, we searched and randomly selected 3 datasets (GSE40744, GSE98269 and GSE115016) with miR-93-3p expression levels in the GEO database. The RMA algorithm was used to extract the expression matrix from the original chip and complete the normalization process. Then, the R language package “Limma” was adopted to perform differential expression analysis (Tumor vs. Normal). MiR-93-3p was selected as the seed player in the follow-up analysis because it satisfies the differential miRNA screening conditions of P < 0.05 and |logFC| > 1 and has a good survival prediction effect.
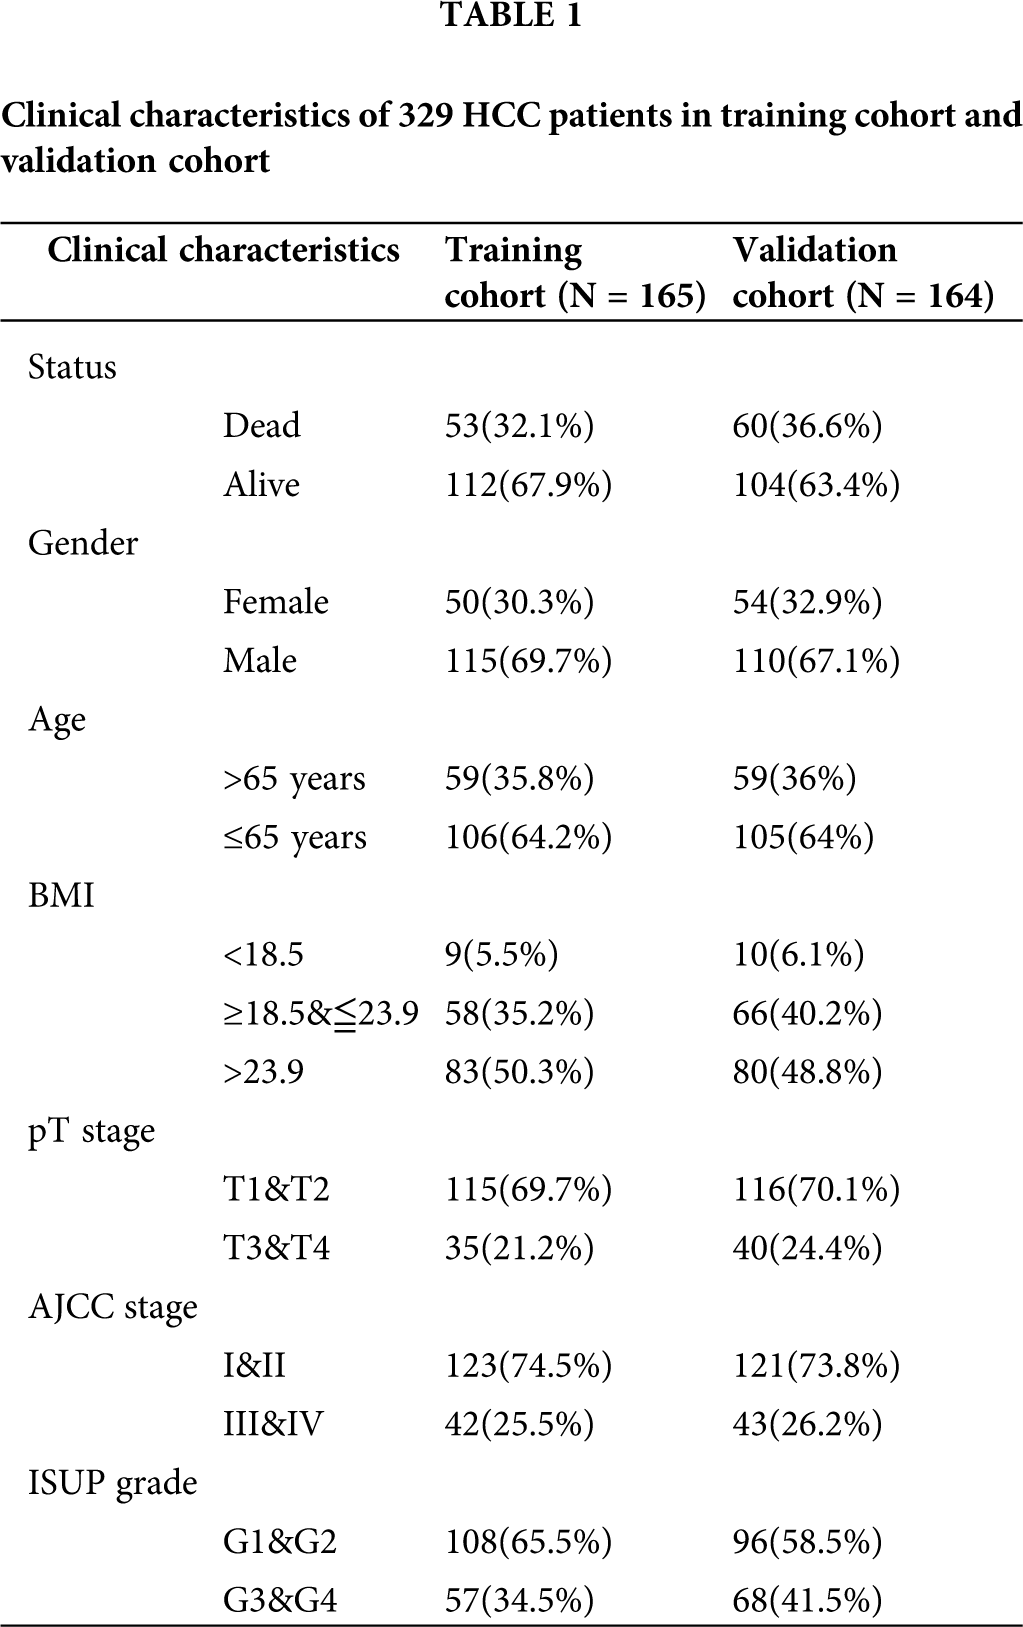
HCC-related genome-wide miRNA-seq and mRNA-seq expression data and corresponding clinical information in the TCGA database (https://cancergenome.nih.gov/; January 2020) were downloaded. And the data type of expression profile is level 3 transcriptome count data. The miRNA-seq data was extracted from 372 tumor tissues and 50 normal tissue samples. The mRNA expression profile contains 371 tumor tissues and 50 normal tissue samples. All count type expression data was preliminarily processed by log2 conversion. The survival information of 365 HCC patients was retained after excluding samples with survival time of 0. In addition, the clinical characteristics of 329 HCC patients with complete survival time, survival status, Gender, age, AJCC stage, and ISUP grade information were summarized to perform subsequent analysis (Tab. 1).
Clinical performance and target gene prediction of miR-93-3p
Student’s t-test was used to perform difference analysis based on miRNA expression profiling in HCC tumors and normal tissues. P < 0.05 was considered to have a significant difference. The R package “survminer v0.4.6” was utilized to plot the Kaplan-Meier (K-M) curve of patients. The log-rank test method was used to compare the prognosis difference between patients with high and low expression (*P < 0.05). The R package “survivalROC v1.0.3” was applied to implement time-dependent ROC analysis to quantify the predictive potential of miR-93-3p on survival events. The area under curve (AUC) of ROC curve was characteristic of the diagnostic performance. AUC should be greater than 0.5. And the closer to 1, the stronger the diagnostic ability.
A total of 12 databases (Microt4, miRWalk, mir-bridge, miRanda, miRDB, miRMap, Pictar2, PITA, MiRNAMap, RNAhybrid, RNA22 and Targetscan) of miRalk2.0 (http://zmf.umm.uni-heidelberg.de/apps/zmf/mirwalk2/; January 2020) were employed to predict the downstream target genes of miR-93-3p. Meanwhile, GEPIA2 (http://gepia2.cancer-pku.cn/; January 2020) was used to analyze the differential expression of the whole genome in tumors and normal tissues based on TCGA database. Genes satisfying the condition P < 0.01 and |logFC| > 1 were identified as differentially expressed genes (DEGs). Furthermore, the intersection of the target genes predicted by miRWalk2.0 and the DEGs was determined as the downstream target genes for miR-93-3p in HCC.
Weighted gene co-expression network analysis
An expression matrix was established based on the mRNA expression profile and the target genes obtained previously. The R package “WGCNA v1.69” was employed to construct a co-expression network of target genes of miR-93-3p. WGCNA is a systematic biology method used to describe patterns of gene association between different samples. It can cluster genes with similar expression patterns and analyze the association between different gene modules and specific traits or phenotypes. The algorithm steps are as follows:
Outlier samples were removed by hierarchical clustering. The similarity between any two genes was calculated by using Pearson’s correlation coefficient, which then establishes the correlation matrix S.
cor represents pearson’s correlation analysis. X and Y represent gene X and gene Y, respectively. Select the exponentialing coefficient β, and the screening criteria must meet the scale-free network law (fit value R^2 to 0.85). The relation index of any gene pair (X and Y) was measured based on the exponential Weighted β square of the correlation coefficient aXY. Then, a topological overlap matrix TOM is constructed based on the adjacency matrix A.
kx or ky indicate the sum of one node’s adjacency coefficients. The node is a gene (X or Y). The hierarchical clustering tree built using the dissimilarity coefficient
Module is identified in the dendrogram through dynamic hybrid tree cutting.
Furthermore, the correlation between each module and multiple clinical features (Gender, Age, BMI, pT stage, AJCC stage, and ISUP grade) were assessed by pearson’s correlation analysis (*P < 0.05). The module that showed significant clinical relevance was designated as the prognostic module that miR-93-3p affects the progression of HCC.
Risk prognosis signature and nomogram construction
Based on the simple sampling principle, 329 HCC cases were divided into training cohort and validation cohort (Tab. 1). The R package “survival v3.1-8” was employed to perform a univariate COX regression analysis on the prognostic module gene in the training cohort. P < 0.05 was used to screen for genes that were significantly correlated with the overall survival of the patient. Using R package “glmnet v3.0-2” to perform LASSO analysis to further optimize the results. The idea of LASSO is that an L1-norm is utilized to penalize the of the model parameters to avoid overfitting of the model.
Assuming a model has a set of parameters
The complexity of the model is controlled by λ. The greater the λ, the greater the penalty for linear models with more variables. LASSO can also be expressed as a constraint on the objective function.
An important feature of the LASSO regularization term is that it can force the parameter value to be 0. The Aim of LASSO is to generate a sparse parameter space, which is a desirable characteristic for feature selection.
Based on the results of LASSO analysis, a multi-gene signature is established. The formula of risk score is:
where RS is the patient’s risk score, β represents the LASSO coefficient, and Expi represents the expression of gene i. Survival and time-dependent ROC curve analysis were performed to assess the prognostic performance of the patient’s risk score in the training cohort. Similarly, P < 0.05 indicates a significant prognostic ability. In addition, survival analysis and time-dependent ROC curve analysis based on the validation cohort data were performed to verify the results.
The patient’s risk score and multiple clinical characteristics (Gender, Age, AJCC stage, and ISUP grade) were included in univariate and multivariate COX regression analysis. The variables satisfying P < 0.05 in both univariate and multivariate COX regression analysis were absorbed into the construction of nomogram. The R package “rms v5.1-4” was employed to construct a nomogram for survival prediction of patients.
SVM-based immune cell infiltration analysis
CIBERSORT is an SVM-based deconvolution algorithm based on gene expression, which is superior to other methods in the identification and detailed division of immune cells. This method uses a LM22 gene signature file (containing 547 genes) to specifically distinguish 22 human hematopoietic cell phenotypes, including B cells, T cells, natural killer cells, macrophages, dendritic cells, and myeloid subsets. Like other linear deconvolution methods, CIBERSORT only operates on expression values in non-log linear space. CIBERSORT uses Monte Carlo sampling to derive the P value for the deconvolution of each sample, thereby providing a measure of confidence in the result. We uploaded the gene expression data of 329 HCC samples to the CIBERSORT web portal (https://CIBERSORT.stanford.edu/; March 2020) and used the default feature matrix to run with 1000 permutations. In addition, the wilcoxon test was used to evaluate the infiltration differences of immune cells between high and low risk patients (*P < 0.05).
TIMER (https://cistrome.shinyapps.io/timer/) is an interactive web application that enables cancer biologists to analyze and visualize the abundance of tumor-infiltrating immune cells in a flexible manner. It uses a deconvolution algorithm to infer the number of immune cells from the gene expression profile. The TCGA database provides 10897 samples of 32 cancer types for TIMER for approximate calculation of immune infiltration. We analyzed the correlation between prognostic signature and immune cell infiltration. These immune cells include B cells, CD4+ T cells, CD8+ T cells, neutrophils, macrophages, and dendritic cells. Furthermore, the “Correlation Analysis” module of GEPIA2 was utilized to evaluate the correlation of the prognostic signature with the marker genes of immune cells.
The gseKEGG function in the R package “clusterprofiler v3.14.3” was applied to evaluate the signal pathways enriched by the differential expression of the whole genome in high- and low-risk groups. The patient samples from the training cohort and validation cohort were combined to establish a genome-wide mRNA expression matrix. The edgeR package was employed to perform gene differential expression analysis. The parameters of the gseKEGG function were set as follows: Perm = 1000, minGSSize = 50, and PvalueCutoff = 0.05.
All R packages were applied in the R (version: 3.6.3) environment. P < 0.05 was considered statistically significant.
The clinical performance and target genes of miR-93-3p
Compared with normal tissues, the expression of miR-93-3p was significantly up-regulated in tumor tissues (P = 6.4 × 10⁻⁶; Fig. 2A). Furthermore, miR-93-3p has excellent discrimination between tumor tissue and normal tissue (AUC = 0.664, P = 0.000158; Fig. 2B). Using the median expression of miR-93-3p in 367 tumor tissues as a cutoff, all patients were divided into low expression and high expression patients. Survival analysis showed that low expression of miR-93-3p can significantly improve the prognosis of patients (P = 0.0023; Fig. 2C). Time-dependent ROC curve analysis elucidated that the expression of miR-93-3p has a strong predictive ability for the prognosis of patients. The 1-year, 3-year, and 5-year AUCs were 0.611, 0.628, and 0.572, respectively (Fig. 2D). In addition, we found that high expression of miR-93-3p significantly prolonged the progression-free interval (PFI) (P = 0.0077; Fig. 2E), disease-specific survival (DSS) (P = 0.00081; Fig. 2F) and disease-free interval (DFI) (P = 0.01; Fig. 2G) of patients compared with low expression.
Based on 12 databases of miRWalk2.0, 15916 unique targets of miR-93-3p were identified. A total of 2206 DEGs were identified through GEPIA2. And 1399 intersection genes of targets and DEGs were considered as the target genes of miR-93-3p (Fig. 2H). The 1399 target genes include 411 down-regulated genes and 988 up-regulated genes (Fig. 2I).
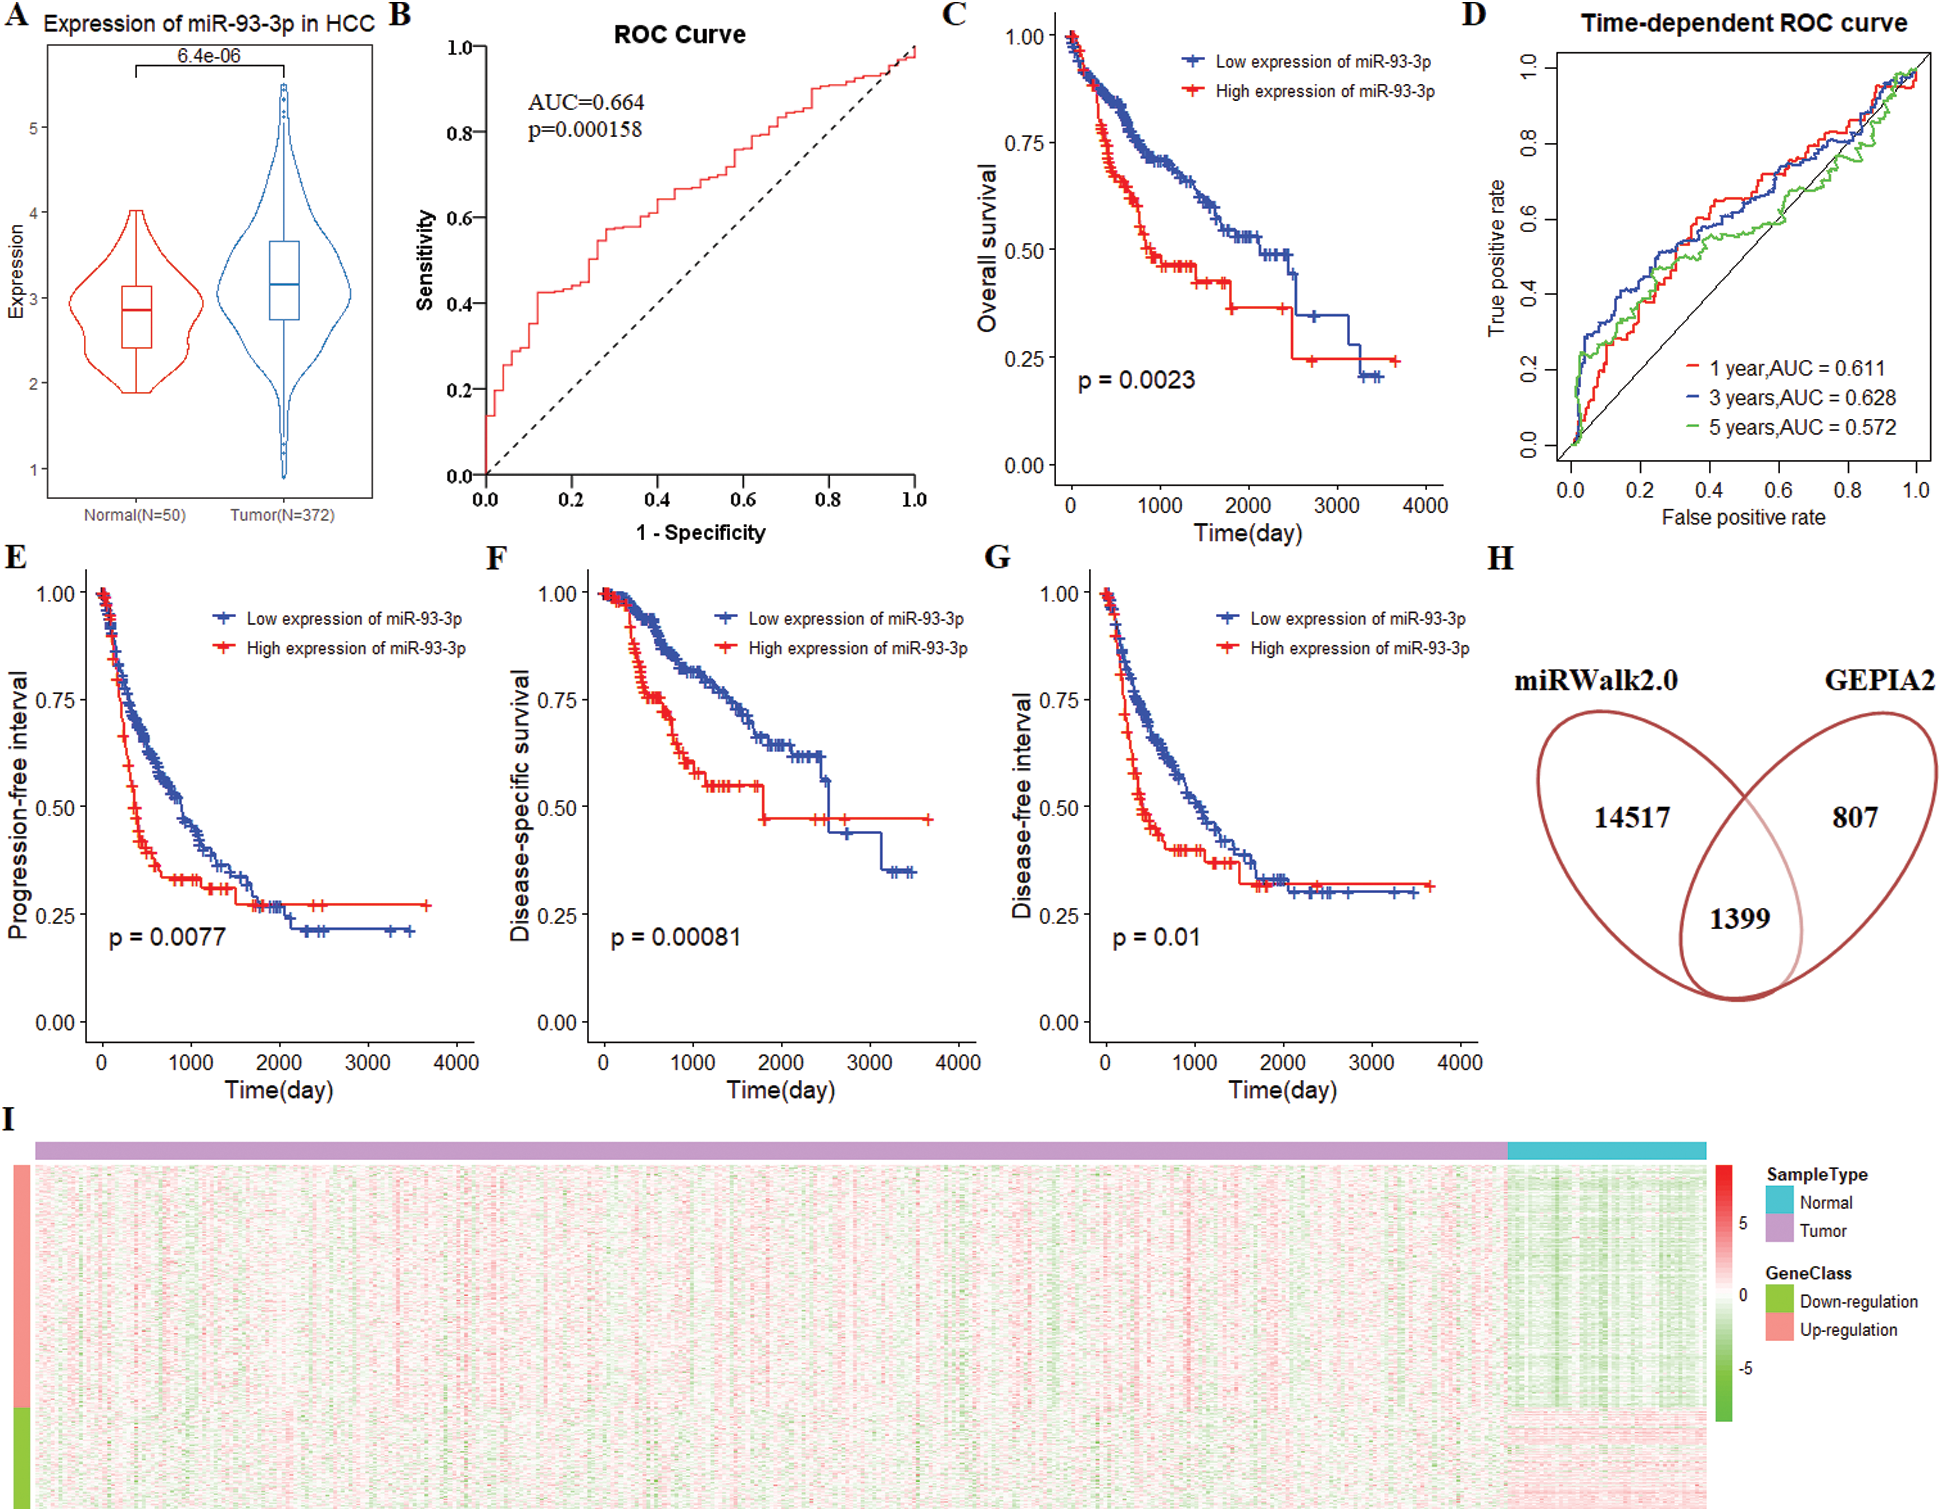
Figure 2: The clinical performance and target gene of miR-93-3p in hepatocellular carcinoma. (A) MiR-93-3p was differentially expressed in 372 tumors and 50 normal tissues. Student’s t-test was used for differential expression analysis. (B) MiR-93-3p can distinguish tumor and normal tissues excellently. (C) The Kaplan-Meier (K-M) curve for survival prediction, high expression of miR-93-3p leads to poor prognosis of patients. (D) Time-dependent receiver operating characteristic (ROC) curve analysis of the ability of miR-93-3p as a diagnostic factor to predict 1-year, 3-year, and 5-year survival rates of patients. (E) The high expression of miR-93-3p is a danger signal, and its low expression is associated with a higher progression-free interval of patients. (F) Compared with low expression, high expression of miR-93-3p was significantly correlated with lower disease-specific survival. (G) Compared with low expression, high expression of miR-93-3p is significantly correlated with shorter disease-free interval. (H) Combining target prediction of miRWalk2.0 and gene differential expression analysis of GEPIA2, 1399 target genes were identified. (I) The expression heatmap of 988 up-regulated and 411 down-regulated genes. The data derived from the TCGA database.
Determination of prognosis-related gene module
WGCNA was performed based on the mRNA expression data of 1399 target genes in 371 tumor tissues and 50 normal tissue samples. Three outlier samples were eliminated, and 418 qualified samples were retained by hierarchical clustering. Selecting soft threshold to 7 to comply with the scale-free network law (Fig. 3A). A total of 8 gene modules and 394 oligogenes were identified with the clustering criteria of minModuleSize = 30 and mergeCutH8 = 0.25 (Fig. 3B). The 8 gene modules were brown, black, turquoise, yellow, blue, red, green, and pink modules. And the number of genes in 8 modules was 89, 36, 389, 88, 266, 39, 50, and 34, respectively. The correlation analysis between the module and the clinical phenotype revealed that the turquoise module was significantly related to multiple prognostic parameters. The genes of turquoise module were closely related with Gender (cor = −0.17, P = 0.002), Age (cor = −0.15, P = 0.007), BMI (cor = −0.17, P = 0.003), pT stage (cor = 0.21, P = 3 × 10⁻⁴), AJCC stage (cor = 0.22, P = 8 × 10⁻⁵) and ISUP grade (cor = 0.31, P = 2 × 10⁻⁸) (Fig. 3C). Using the mean of the gene significance of all genes to characterize the correlation between the module and the cancer phenotype. And the turquoise module had the most prominent correlation with each phenotype (P = 2e−98) (Fig. 3D). Therefore, the turquoise module was determined to be a prognostic module for subsequent analysis.
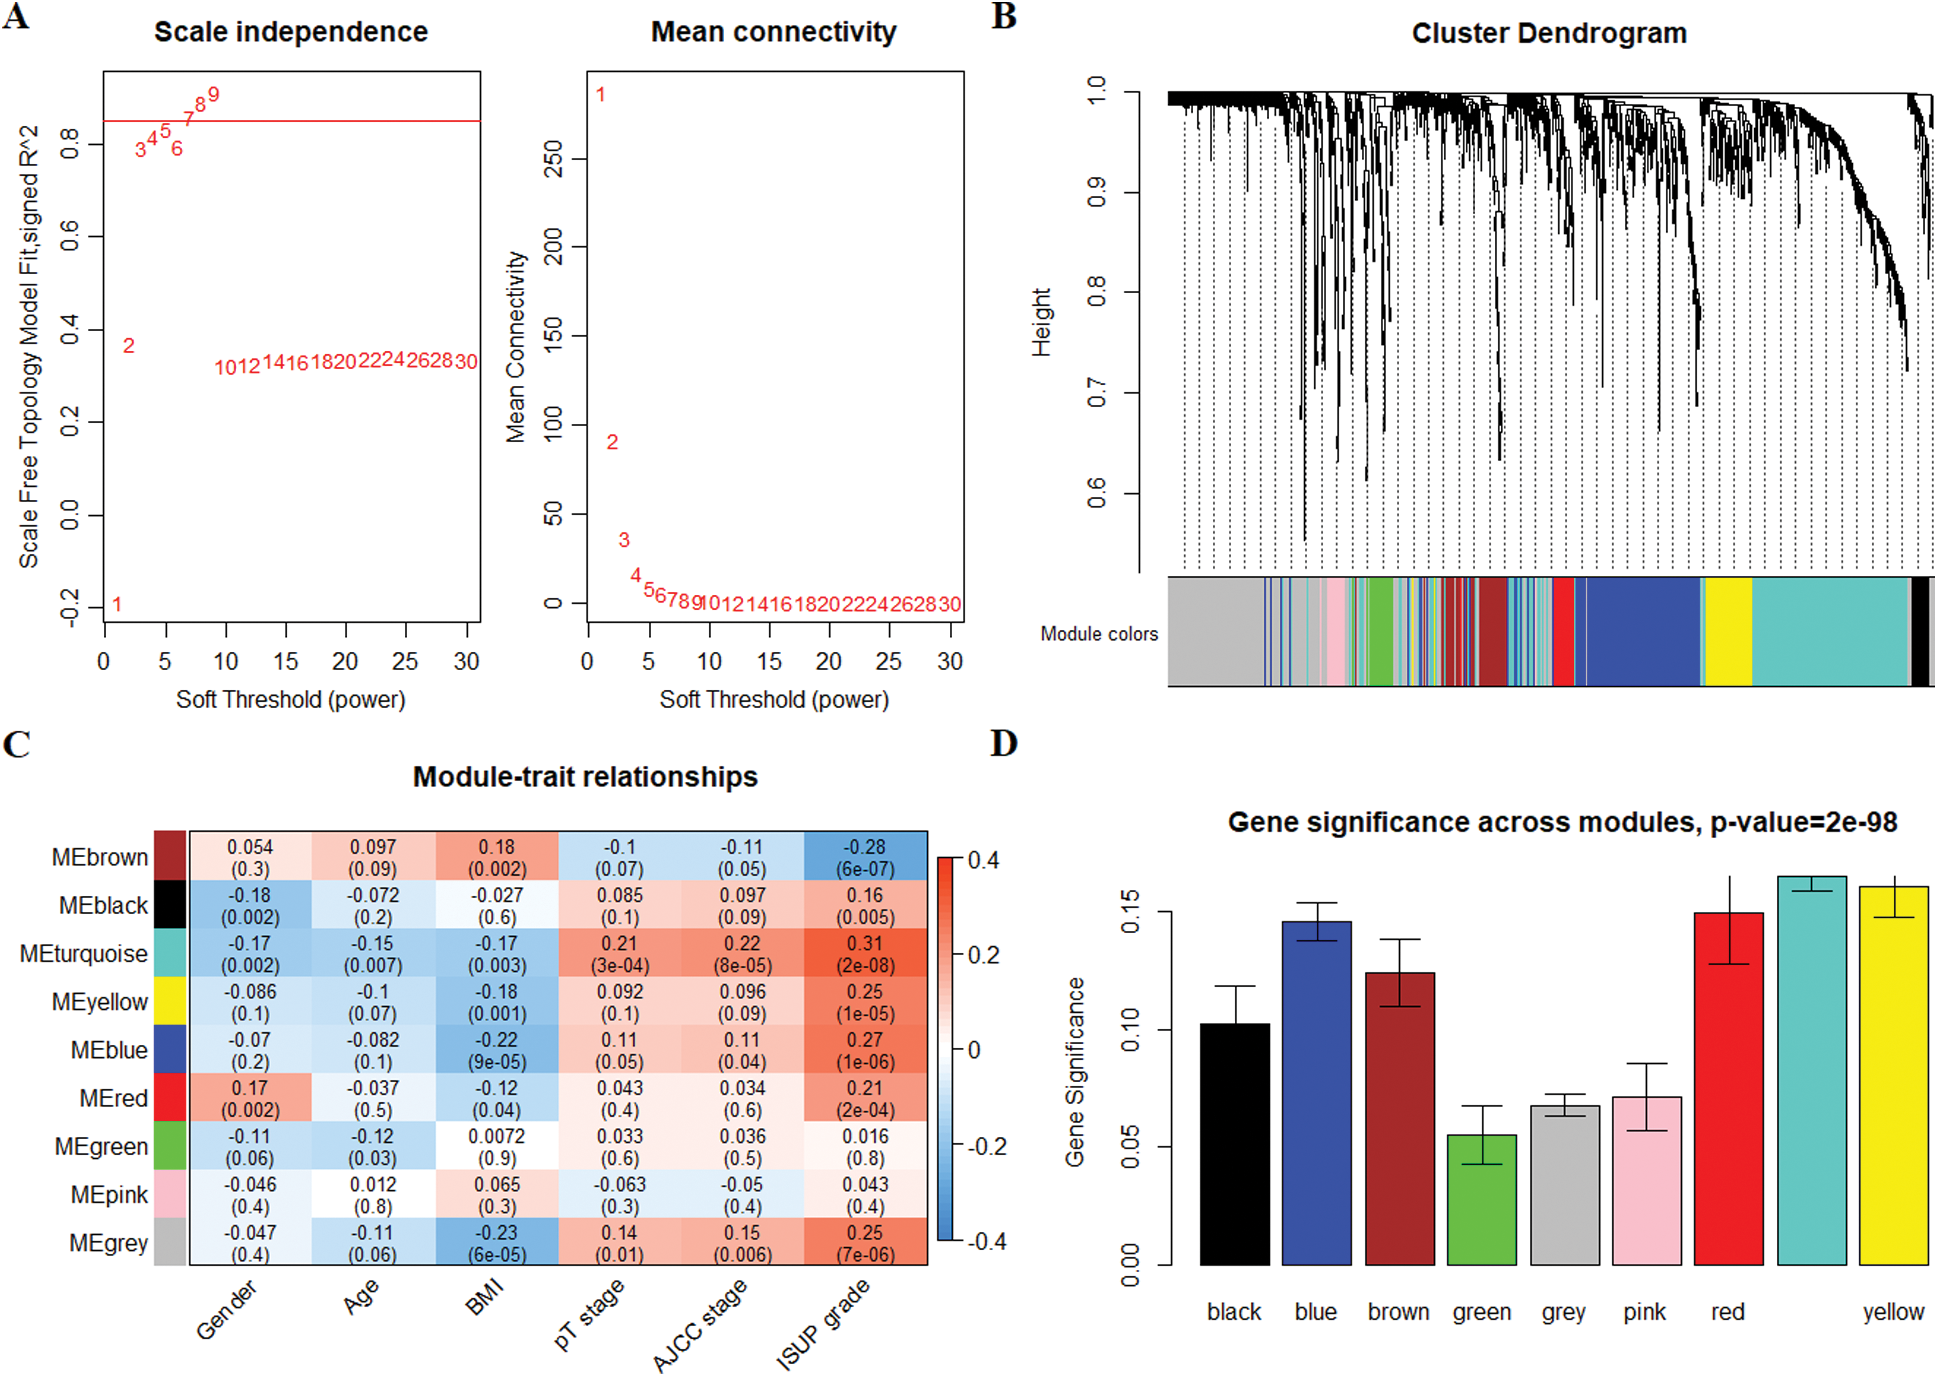
Figure 3: Co-expression network construction of 1399 target genes and identification of prognostic gene modules. (A) Determine β that satisfies the law of scale-free networks. (B) 8 modules were successfully clustered. Each branch of the dendrogram represents genes, and genes clustered into the same module are assigned the same module color. Genes assigned in gray indicate no clustering to any module. (C) The correlation analysis between the modules and clinical features, the turquoise module showed outstanding correlation. (D) Barplot of mean significance across modules. The higher mean gene significance represented the higher correlation between module and ISUP grade.
Risk prognosis signature and nomogram
The samples of 329 HCC patients were randomly divided into training and validation cohorts, and the number of samples was 165 and 164, respectively. There were 258 genes that significantly related to the overall survival were identified in the training cohort through univariate COX regression analysis (P < 0.05). Using LASSO COX analysis to further optimize the results. We finally obtained 5 genes (cct5, cdk4, cenpa, dtnbp1 and flvcr1) that significantly relevant to the survival of patients (Tab. 2, Figs. 4A–4B). A 5-gene signature was established based on the results of LASSO COX analysis. The formula is
RS = 0.0143 × CCT5 + 0.0032 × CDK4 + 0.0505 × CENPA + 0.0377 × DTNBP1 + 0.0400 × FLVCR1
All patients were divided into 117 low-risk patients and 48 high-risk patients by calculating the risk score of each patient in the training cohort. Correspondingly, the 164 patients were divided into 56 low-risk and 108 high-risk patients in the validation cohort. Compared with the high risk, low risk can significantly improve prognosis of patients (P < 0.0001; Fig. 4C). The risk prognosis signature had a prominent prognostic effect as confirmed by the 1-year, 3-year, and 5-year AUCs (0.795, 0.697, and 0.677) (Fig. 4D). The results of K-M curve analysis (P = 0.0016; Fig. 4E) and ROC analysis (Fig. 4F) also confirmed the above results in the validation cohort. The risk prognosis signature predicts AUCs of 1-year, 3-year, and 5-year survival rates were 0.732, 0.679, and 0.61 in the validation cohort, respectively.
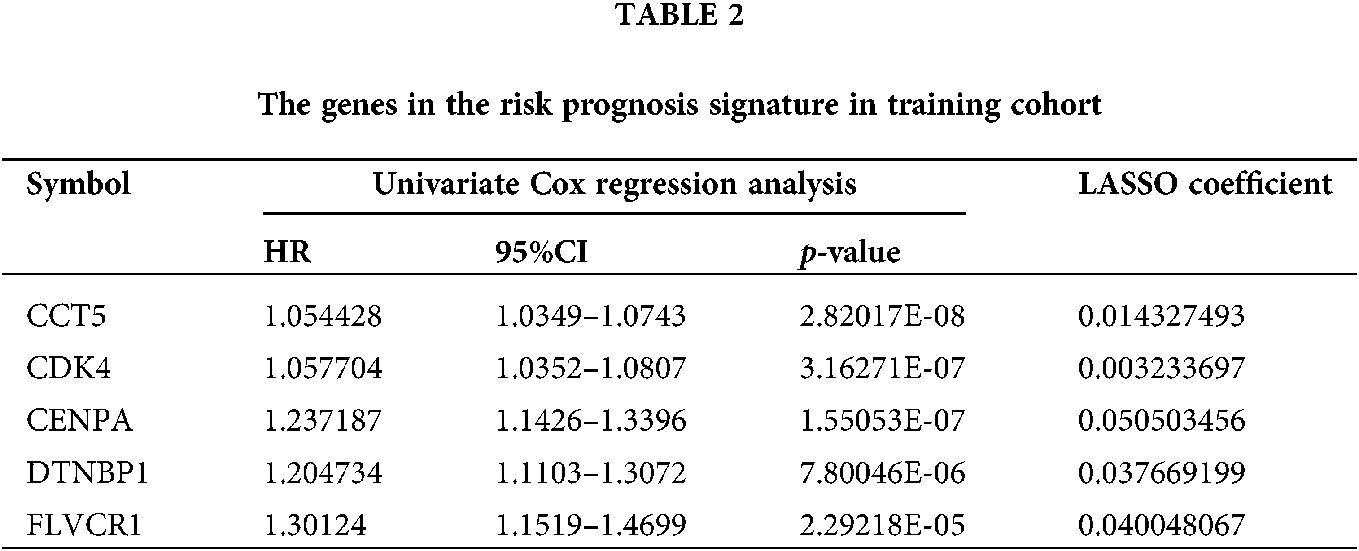
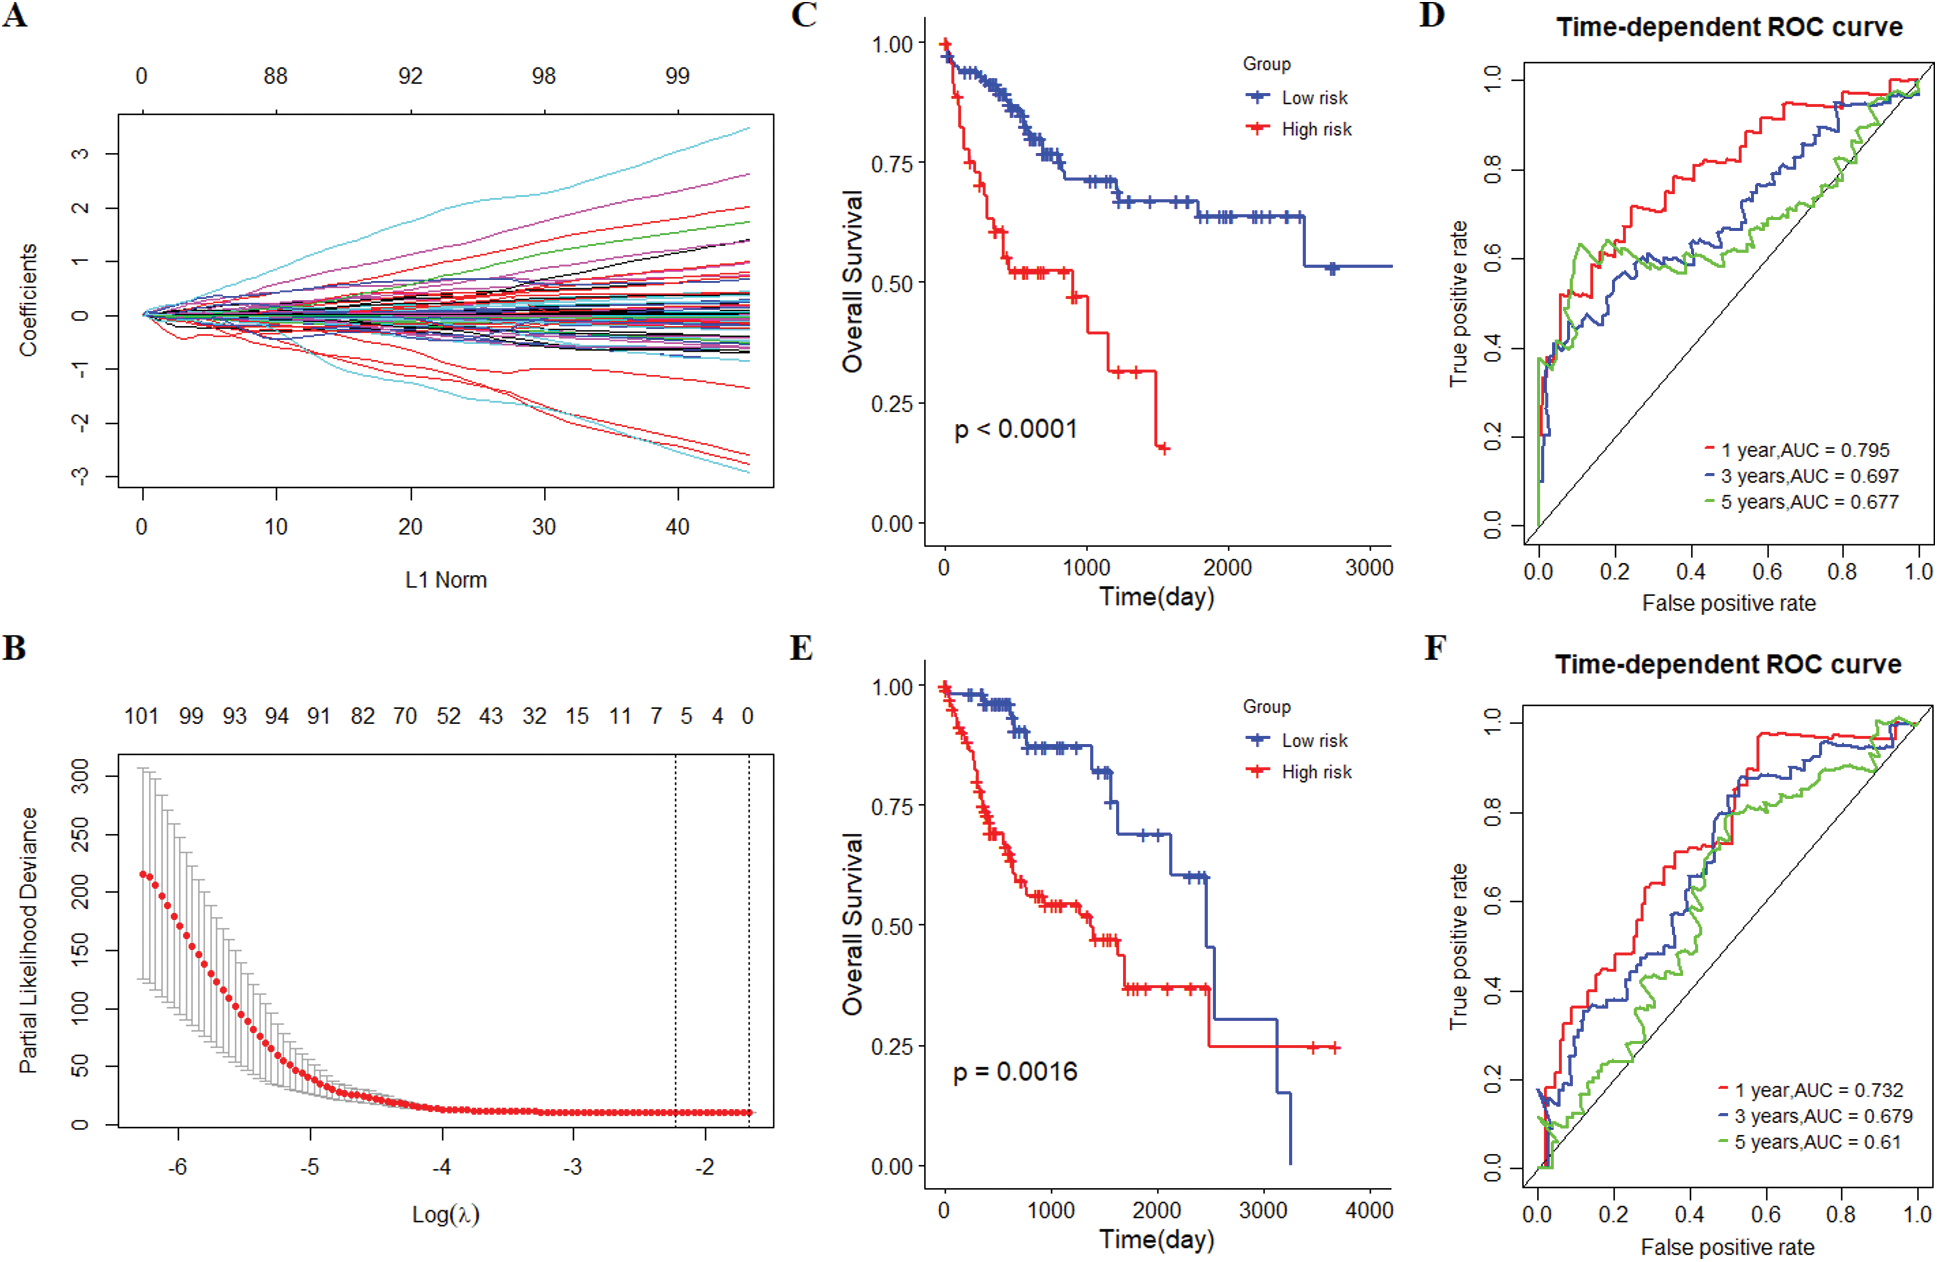
Figure 4: The establishment and verification of 5-gene prognostic signature. (A) The distribution of least absolute shrinkage and selection operator (LASSO) coefficients of 258 genes. (B) Partial likelihood of LASSO coefficient distribution deviation. The vertical dotted line indicates lambda.min and lambda.1se. (C) Kaplan-Meier (K-M) curve for predicting the survival of patients in the training cohort. The higher risk scores are associated with poor prognosis of patients. (D) The risk score as a prognostic factor has a strong predictive ability for the 1-year, 3-year, and 5-year survival rates of patients in the training cohort. (E) Verification of the difference in the prognosis of patients with the high or low risk score. (F) Verifying the predictive ability of the risk score on the survival of patients based on the validation cohort.
Next, we performed univariate and multivariate COX regression analysis on the risk score and multiple clinical characteristics. The results showed that both risk score and AJCC stage had a significant correlation with the overall survival in the training cohort and validation cohort (Tab. 3). Subsequently, the risk score and AJCC stage were incorporated into the construction of the nomogram. The prediction ability of nomogram established by combining the risk score and AJCC stage (C-index = 0.678; Fig. 5A) was obviously better than risk score (C-index = 0.665) and AJCC stage (C-index = 0.573). And the results of internal verification showed that the prediction ability of the nomogram closely matched the best prediction performance in the training cohort (Fig. 5B). Analogously, the nomogram established by combining the two prognostic factors (C-index = 0.691) had a better predictive ability than risk score (C-index = 0.664) and AJCC stage (C-index = 0.612) in the validation cohort (Fig. 5C). Furthermore, the results of the calibration curve also verified the prognostic and predictive performance of the nomogram in the validation cohort (Fig. 5D).
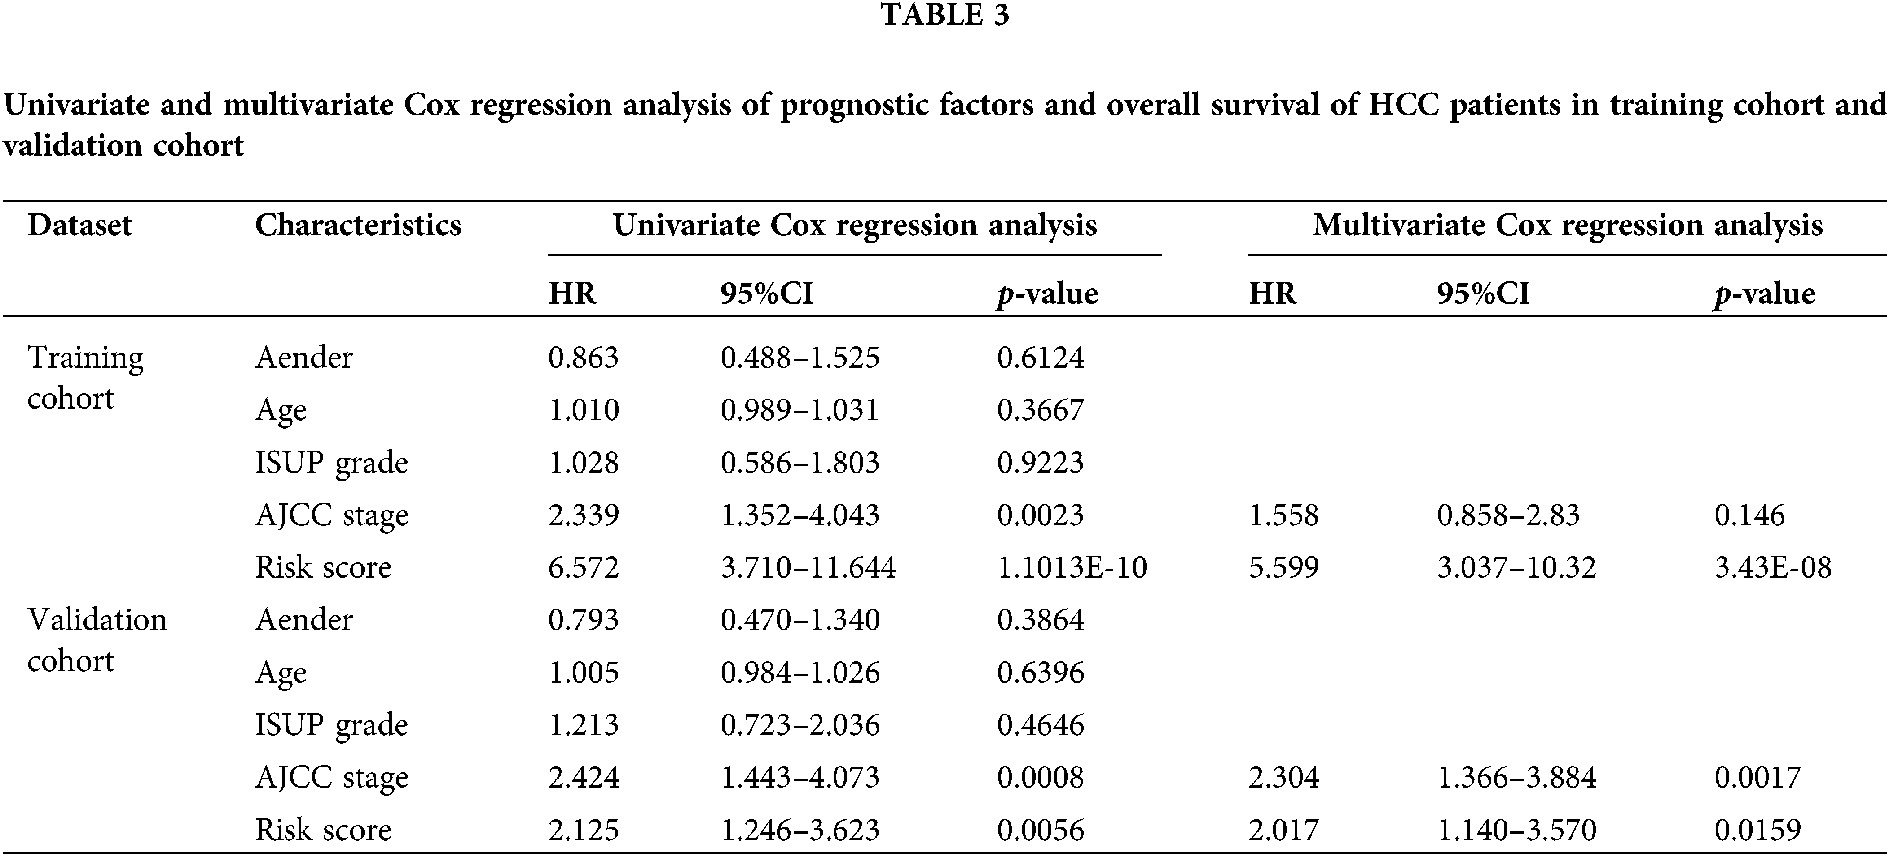
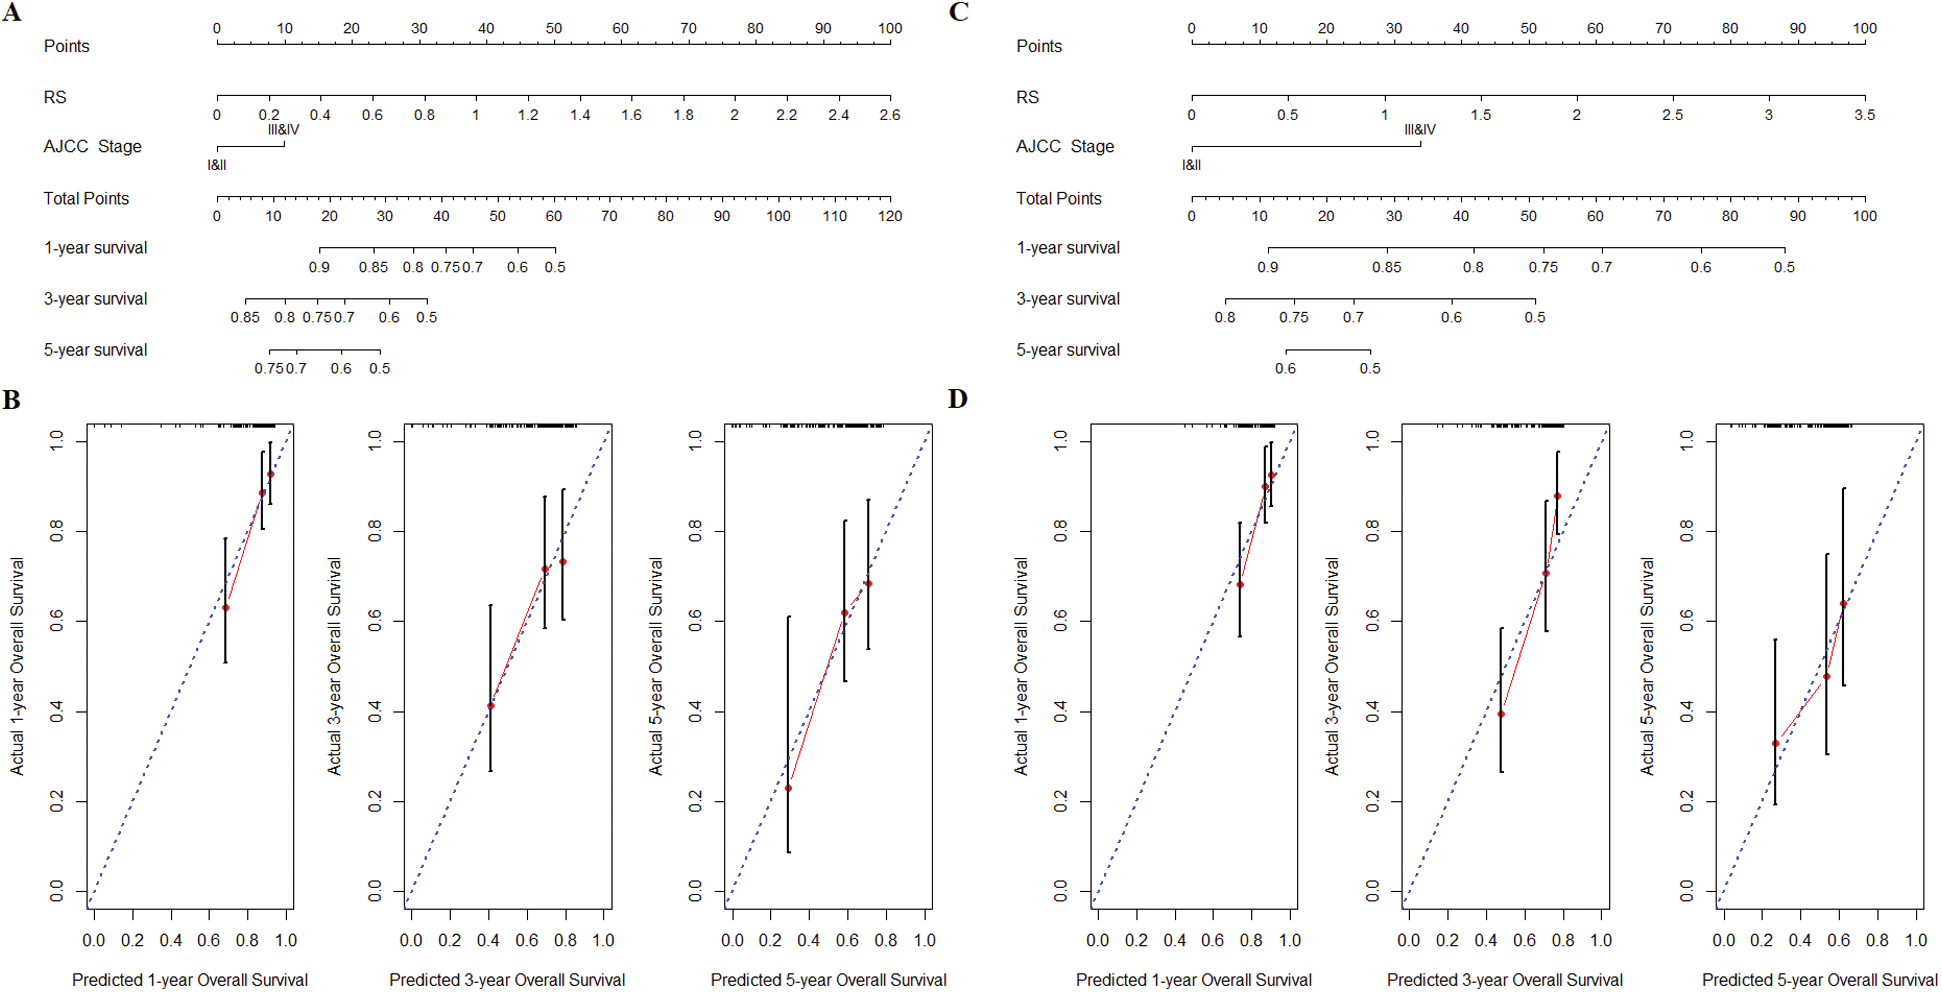
Figure 5: Nomogram construction and verification. (A) Nomogram of combining the risk score and AJCC stage was constructed in training cohort. (B) The internal verification calibration curve in the training cohort, the predicted survival closely matches the best prediction performance. (C) The verification of nomogram in validation cohort. (D) The calibration curve of nomogram in validation cohort.
SVM-based immune cell infiltration and GSEA pathway differences
The infiltrated proportion of 22 immune cells in 329 tumor tissues was obtained by SVM-based CIBERSORT algorithm. The results showed that the infiltrated proportion of 22 immune cells in the training cohort was similar to that in the validation cohort (Figs. 6A–6B). And the T cell CD4 memory resting, macrophage M2, macrophage M0, mast cell resting and macrophage M1 are the five immune cells with the largest number in the tumor microenvironment. Interestingly, macrophages and T cells have the largest infiltration ratio and accounting for about 60% of immune cells. T cells CD4 naïve, T cells follicular helper (Tfh), T cells regulatory (Tregs) and mast cells resting were found to have significant infiltration differences between high-risk and low-risk patients in the training cohort (Fig. 7A). Meanwhile, T cells CD4 memory resting, Tfh, Tregs, Monocyte, Macrophage M0 and mast cells resting represented infiltration differences in different risk groups in the validation cohort (Fig. 7B). The infiltrated proportion of Tfh, Tregs and Macrophage M0 significantly increased in the high-risk group compared with the low-risk group. And the abundance of T cells CD4 memory resting, monocyte and mast cells resting sharply decreased in the high-risk group compared with the low-risk group.
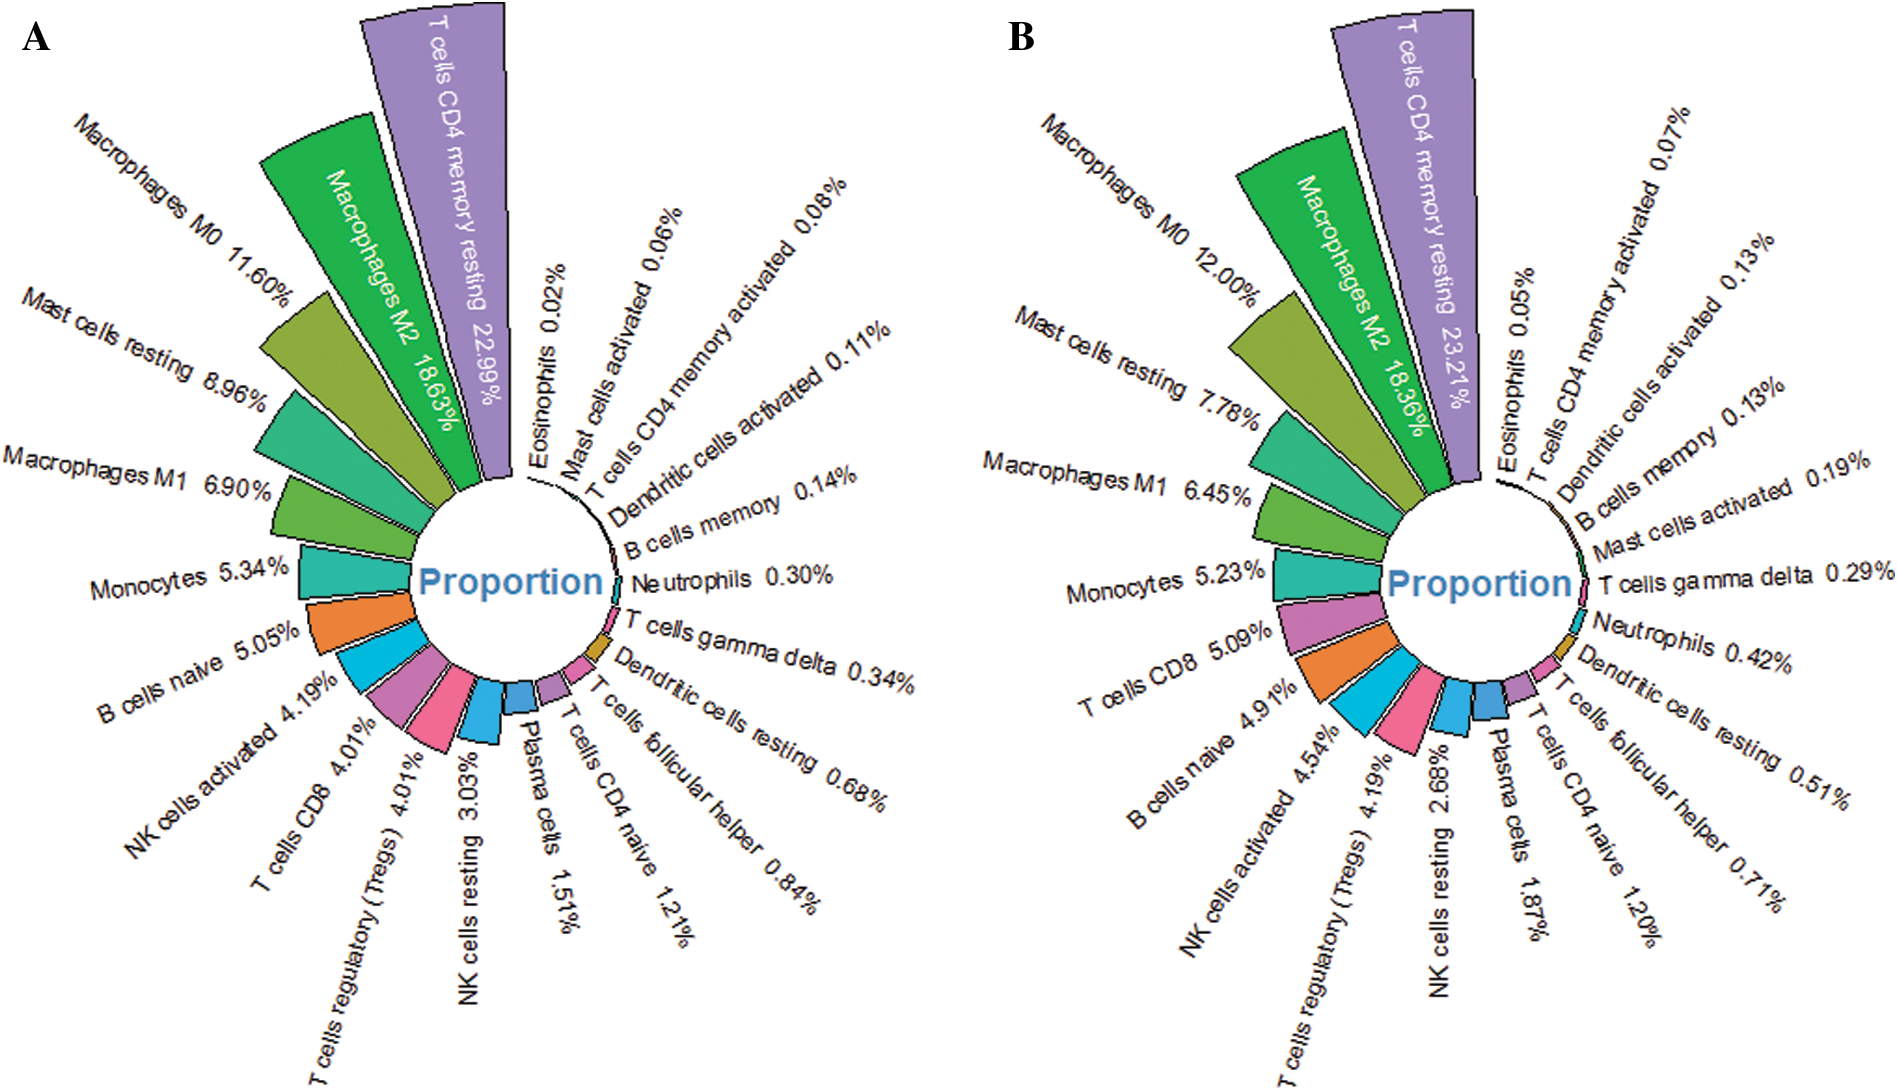
Figure 6: The relative proportion of 22 immune cells in HCC tumor tissue. (A) The average infiltration ratio of 22 immune cells is ranked in the training cohort. (B) The ranking of the average infiltration ratio of 22 immune cells in the validation cohort.
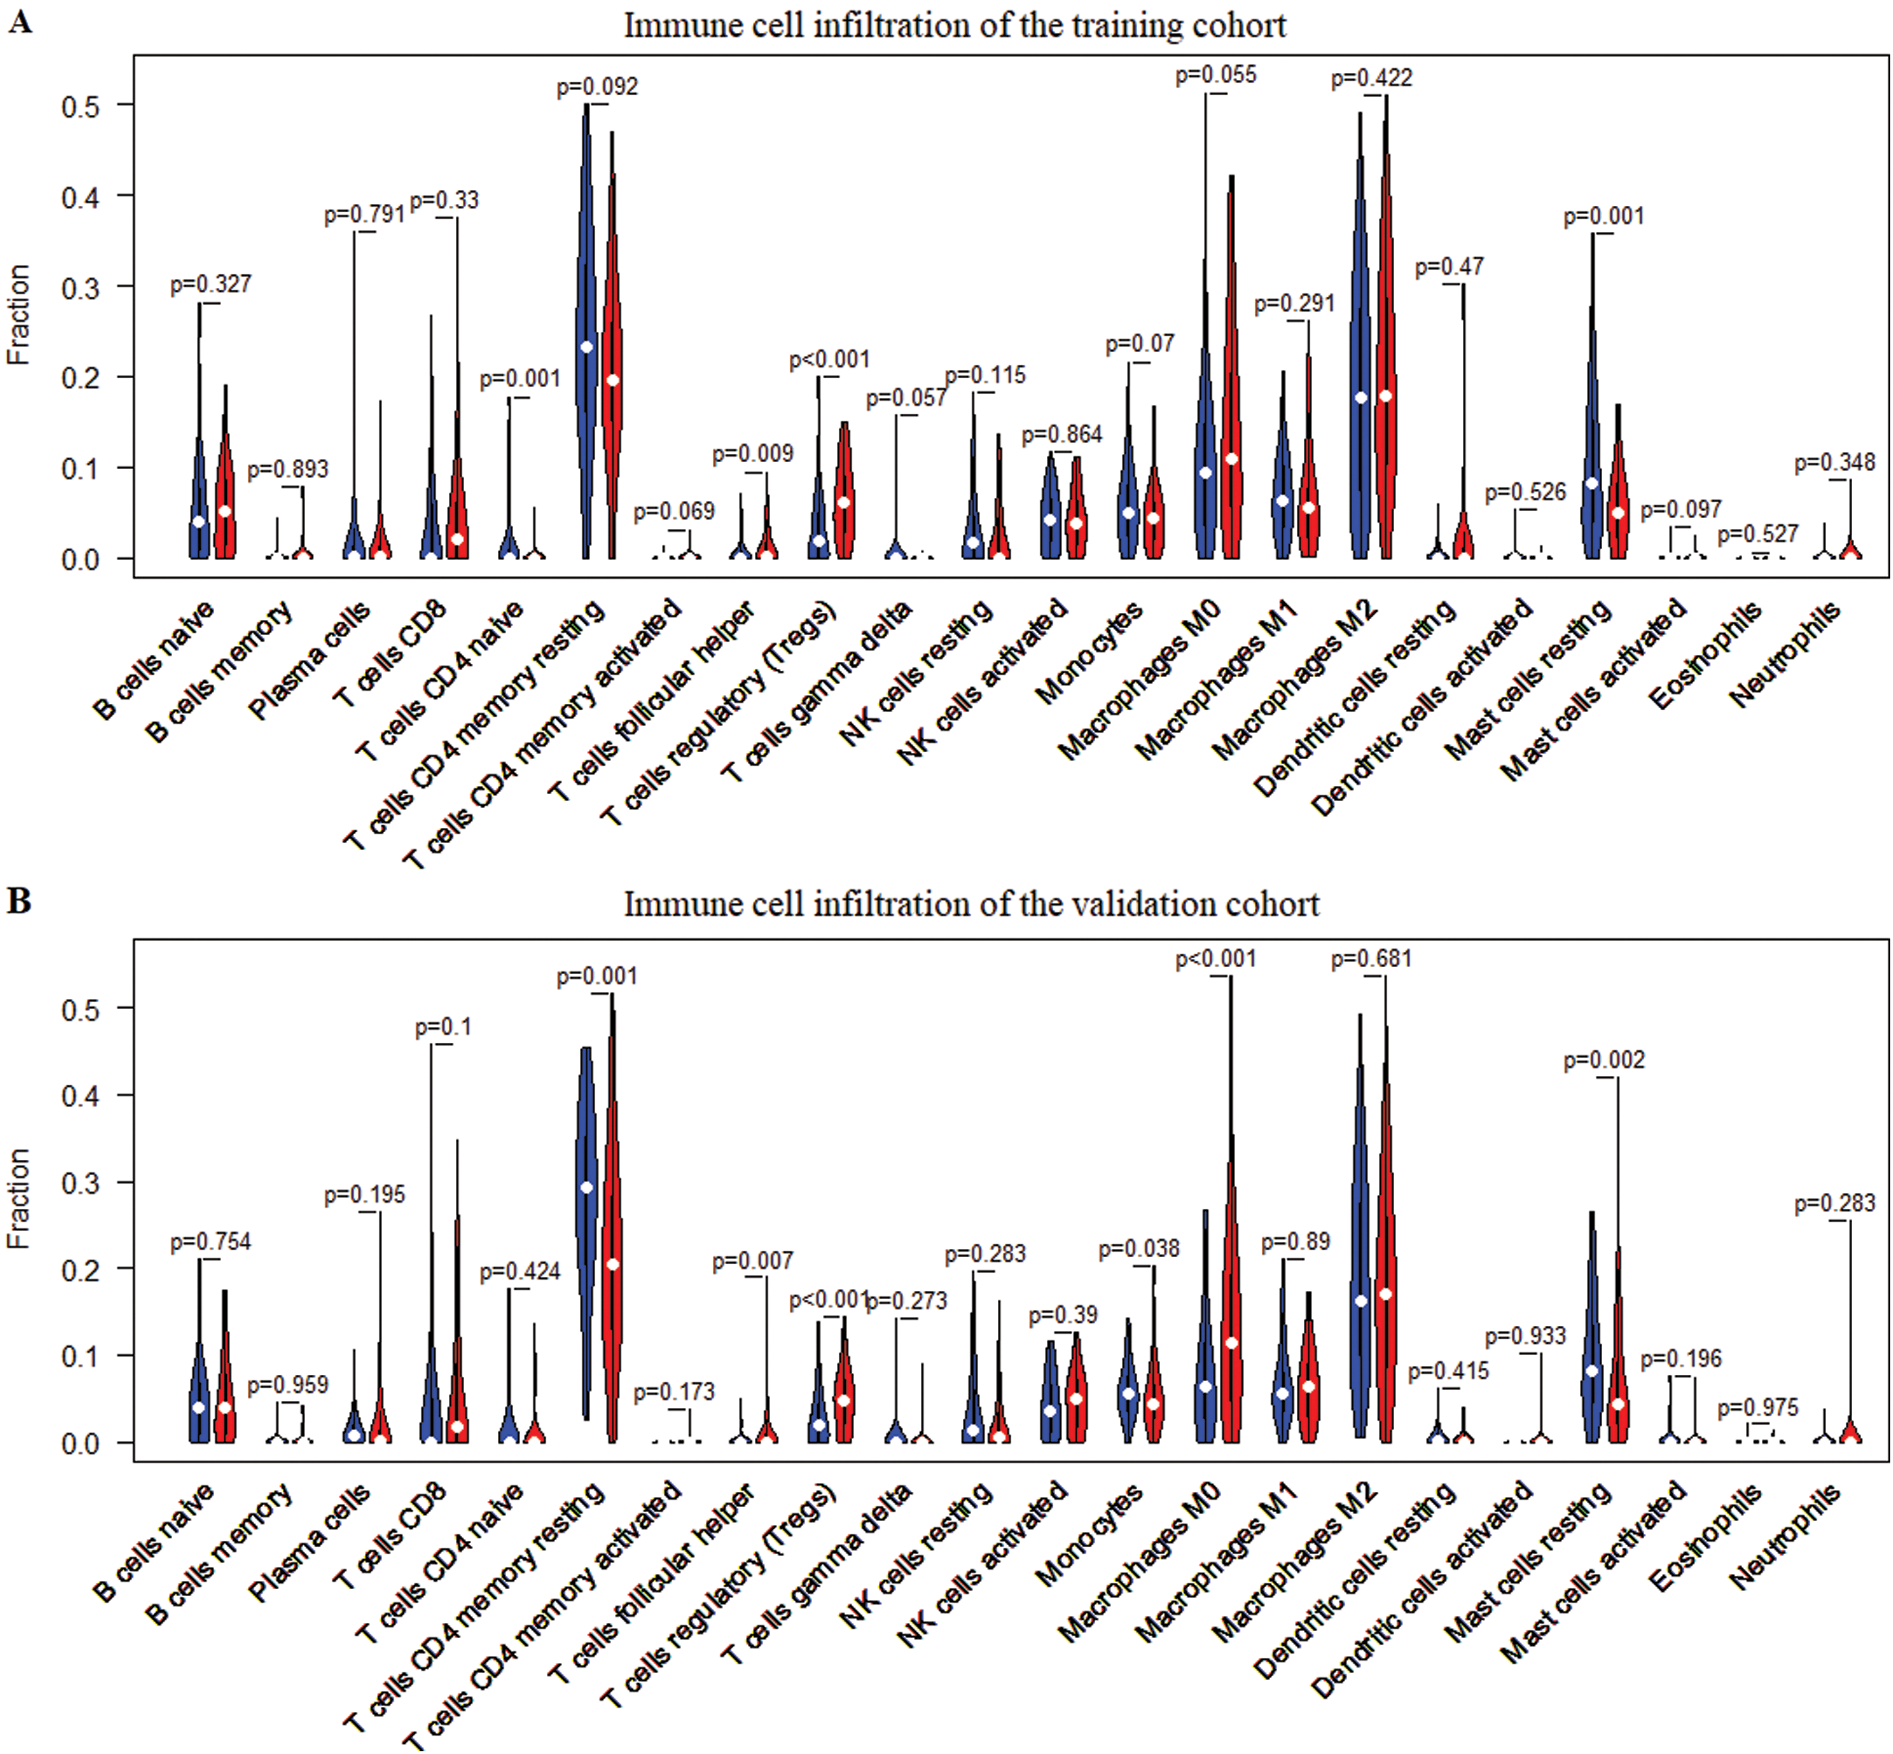
Figure 7: Differences of infiltration of 22 immune cells in high- and low-risk patients. (A) Differences in the infiltration of 22 immune cells between the high-risk group and the low-risk group in the training cohort. (B) Differences in the infiltration of 22 immune cells between the high-risk group and the low-risk group in the validation cohort. Wilcoxon test was used for infiltration difference analysis.
In order to demonstrate an intuitive gene regulation effect, the prognostic signature mediated immune infiltration changes were obtained by TIMER (Fig. 8). The results showed that the infiltration of 6 immune cells (B cell, CD8+ T cell, CD4+ T cell, macrophage, neutrophil, and dendritic cell) was significantly correlated with the expression of the 5 genes (cct5, cdk4, cenpa, dtnbp1, and flvcr1) in the prognostic signature. And the high expression of each gene significantly increased the infiltration level of 6 immune cells. In addition, the increased expression of cct5 and dtnbp1 showed an inhibitory effect on tumor purity. Inversely, the increased expression of cdk4, cenpa and flvcr1 promoted tumor purity.
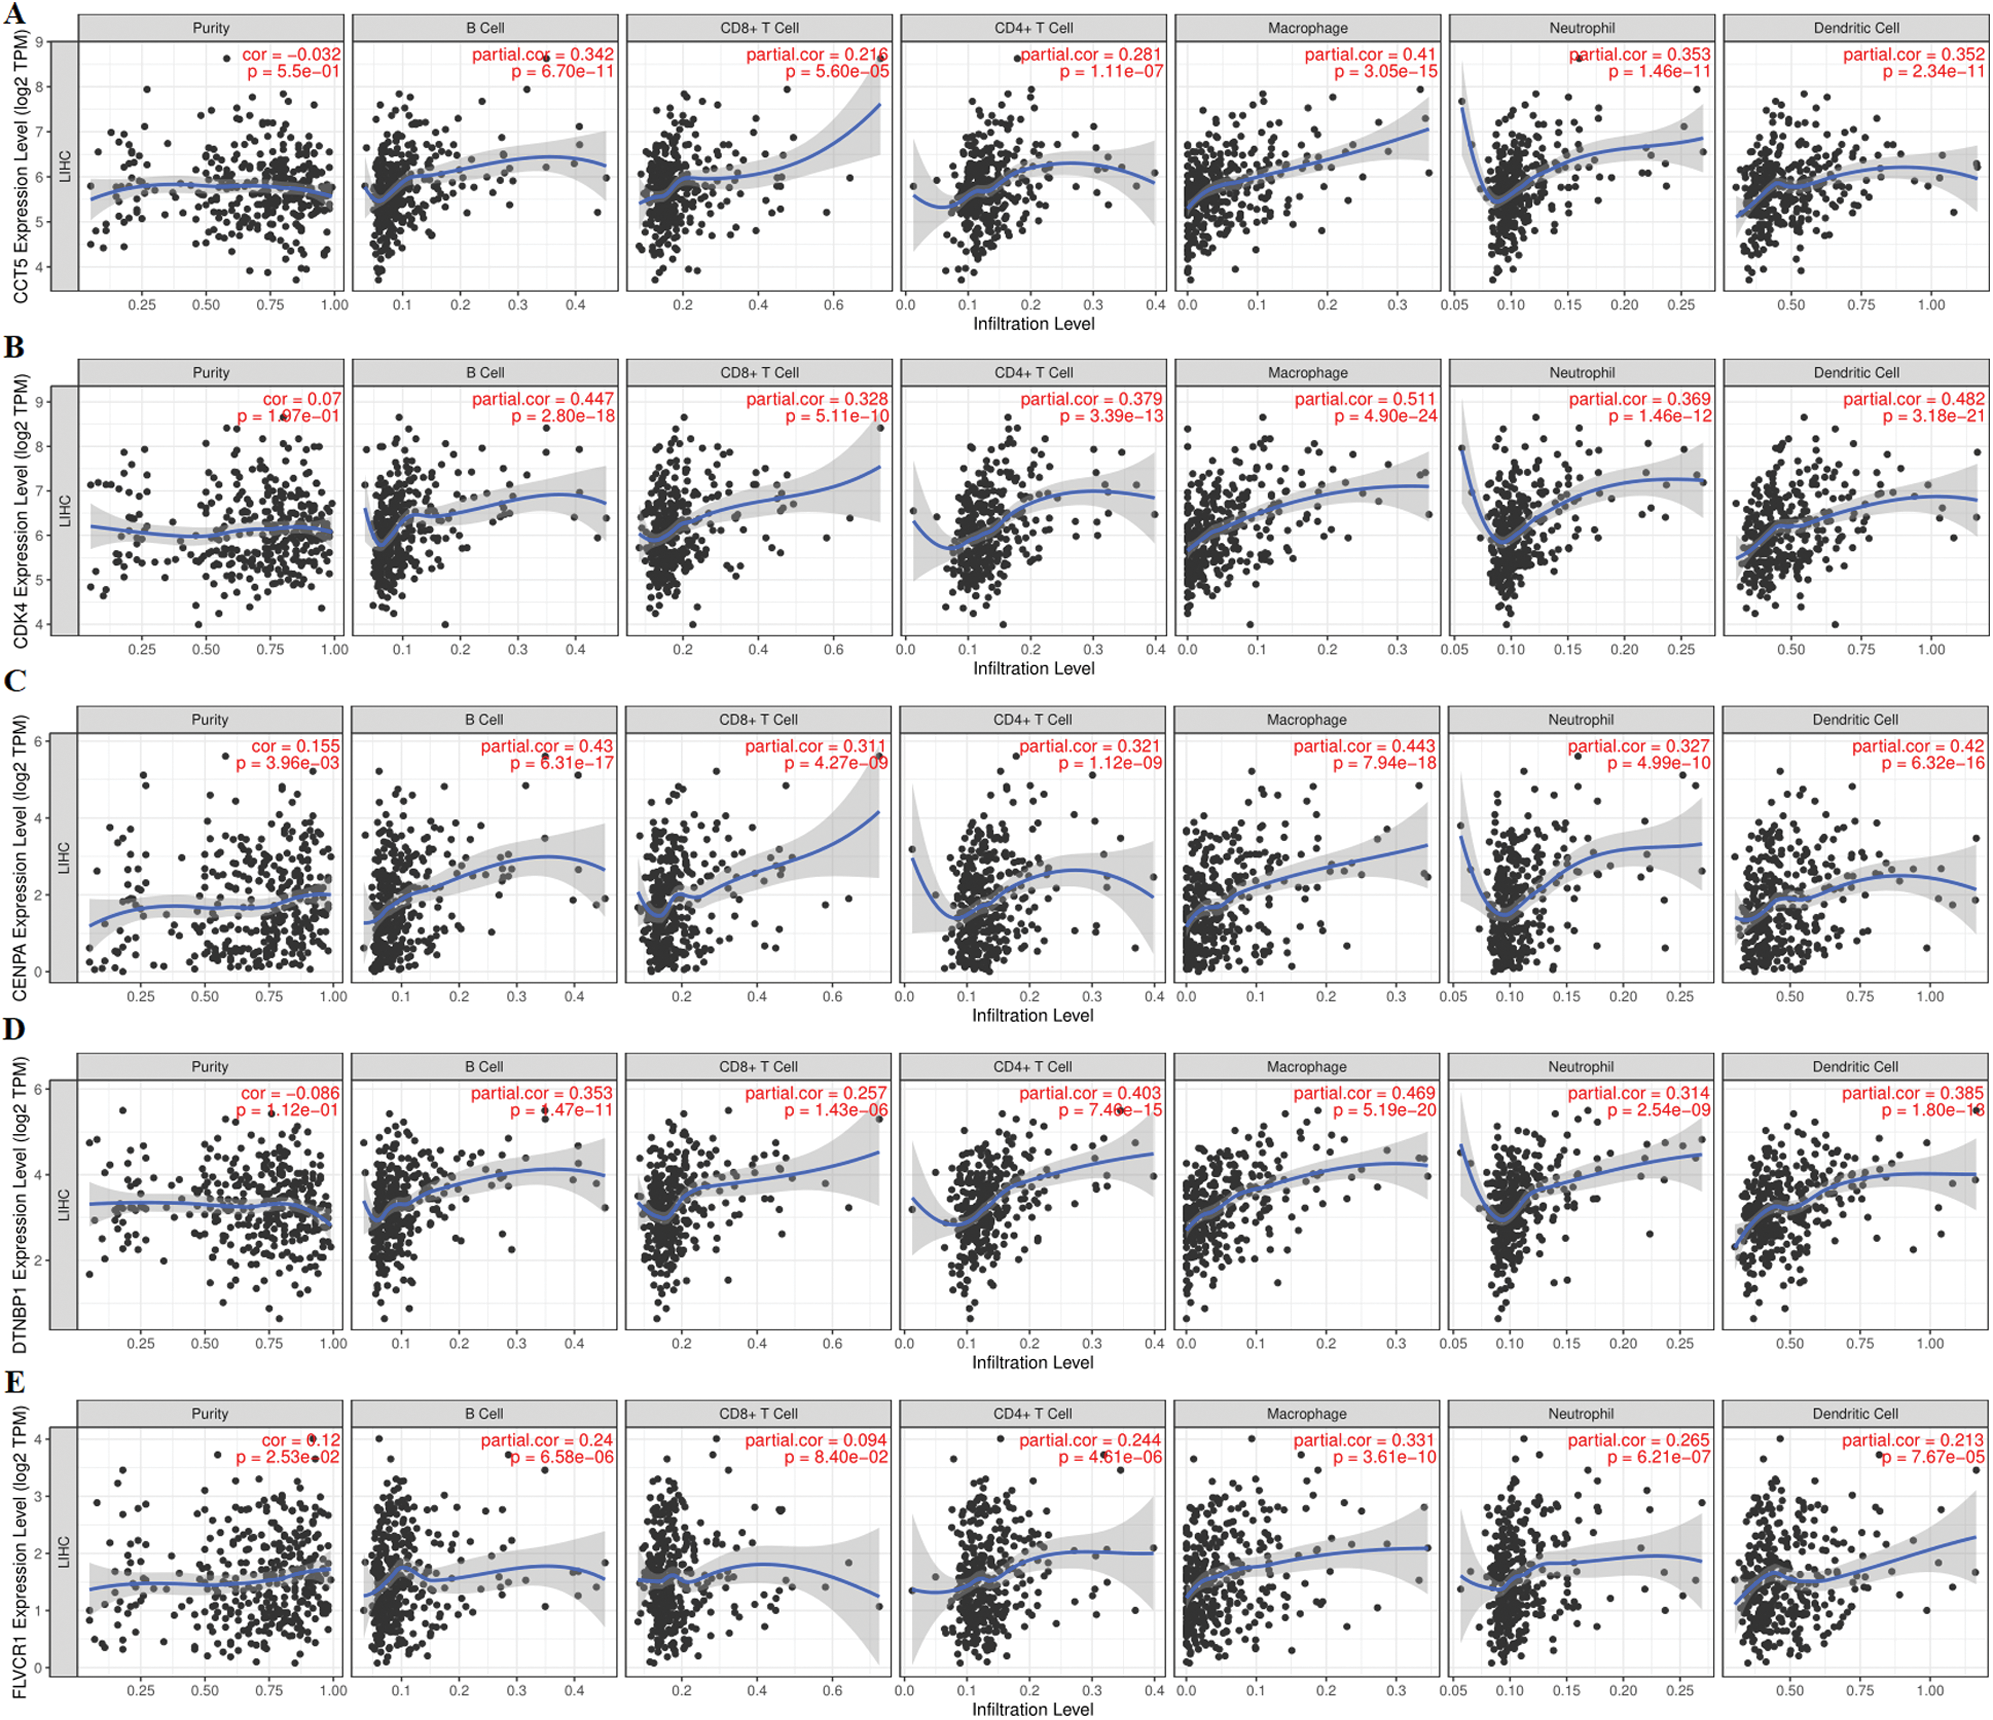
Figure 8: Correlation analysis between 5 prognostic gene expression and tumor-infiltrating immune cells based on the TIMER database. (A), (B), (C), (D) and (E) represent the expression of five prognostic genes (CCT5, CDK4, CENPA, DTNBP1, and FLVCR1), tumor purity, and six immune cells (B cells, CD4+ T cells, CD8+ T cells, neutrophils, macrophages, and dendritic cells). The expression of CCT5, CDK4, CENPA, DTNBP1, and FLVCR1 showed a significant correlation with tumor purity and infiltration of six immune cells.
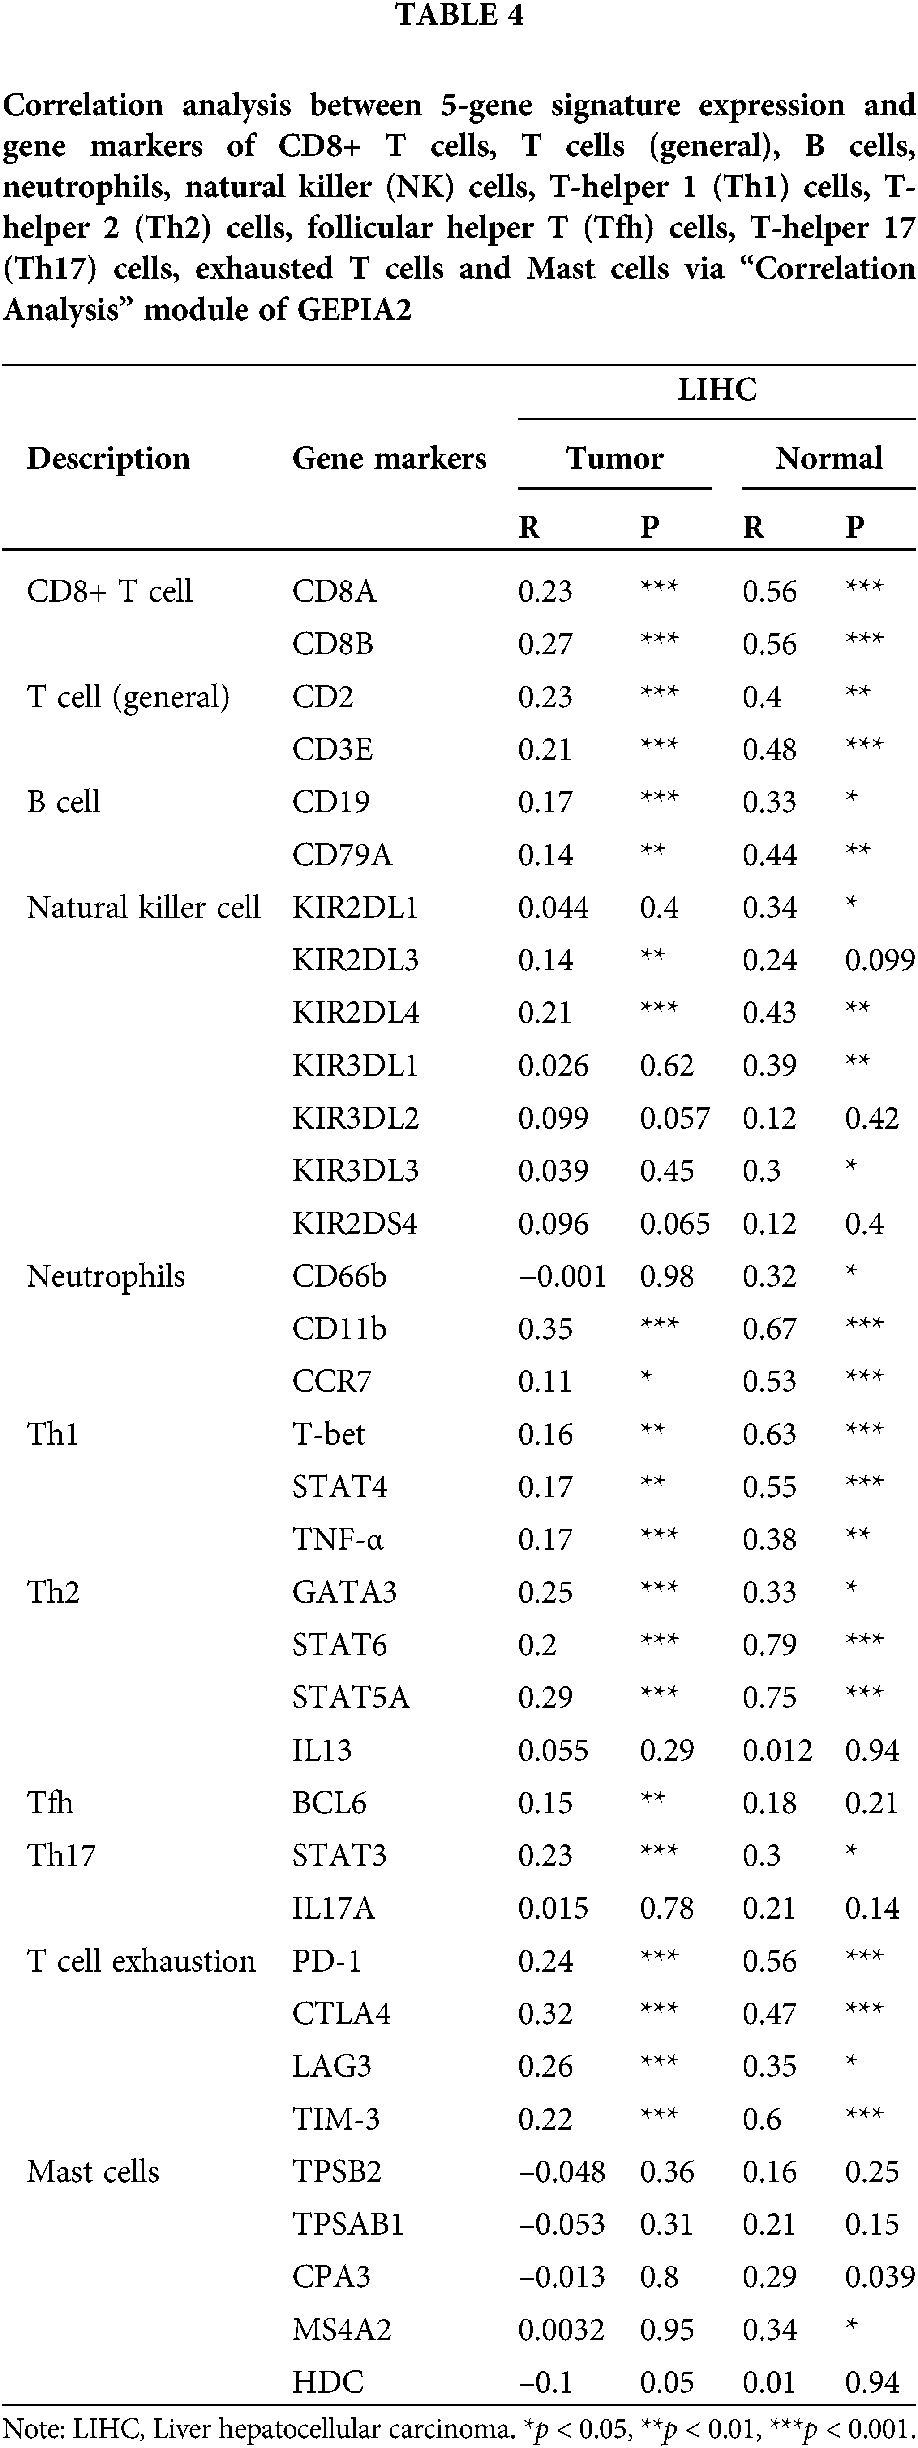
The expression of gene markers of immune cells determines the direction of the immune system. We analyzed the correlation between the 5-gene signature and the gene markers of 11 immune cells through the “correlation analysis” module of GEPIA2. The 11 immune cells were CD8+ T cells, T cells (general), B cells, neutrophils, natural killer (NK) cells, T-helper 1 (Th1) cells, T-helper 2 (Th2) cells, follicular helper T (Tfh) cells, T-helper 17 (Th17) cells, exhausted T cells and mast cells. The gene markers effected by 5-gene signature expression include CD8A and CD8B of CD8+ T cell, CD2 and CD3E of T cell (general), CD19 and CD79A of B cell, CD11b, CCR7 of neutrophils, T-bet, STAT4, TNF-α of Th1, GATA3, STAT6, STAT5A of Th2, BCL6 of Tfh, STAT3 of Th17, as well as PD-1, CTLA4, LAG3 and TIM-3 of T cell exhaustion (Tab. 4).
Six pathways were obtained Based on the genome-wide GSEA analysis (Figs. 9A–9C). The six pathways were cytokine-cytokine receptor interaction, oocyte meiosis, phagosome, cell cycle, ECM-receptor interaction, and hematopoietic cell lineage.
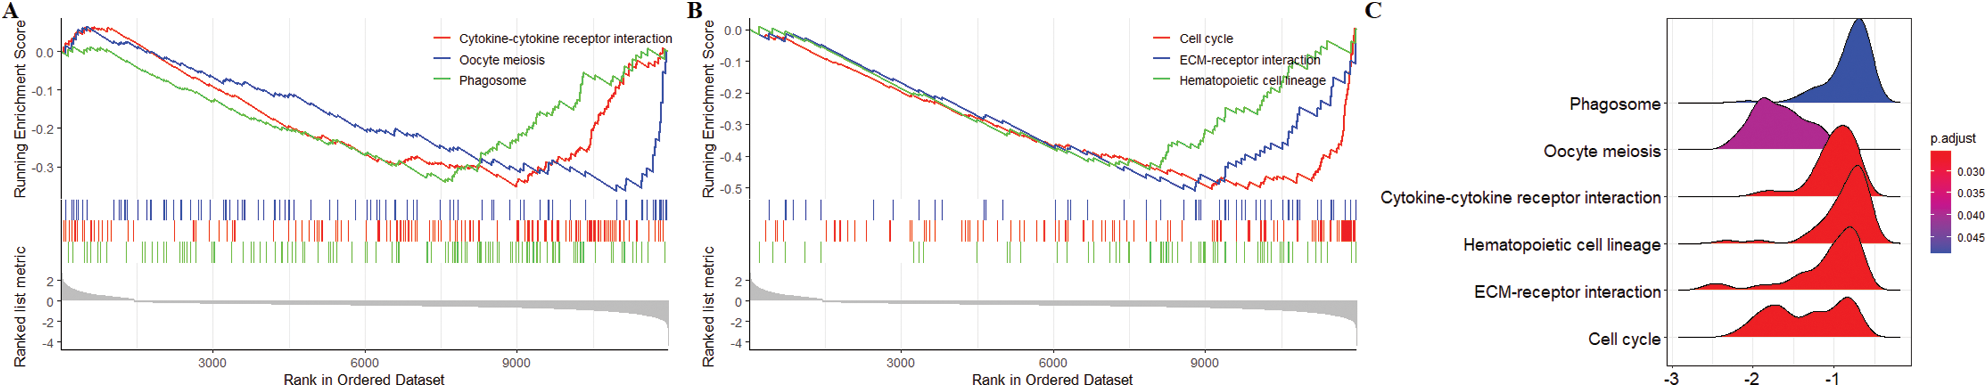
Figure 9: Gene set enrichment analysis (GSEA) obtained 6 KEGG pathways with differences between high-risk group and low-risk group. (A) Top 3 KEGG pathways sorted by EnrichmentScore. (B) Last 3 KEGG pathways sorted by EnrichmentScore. (C) The ridgeplot of 6 KEGG pathways.
MiR-93-3p is an inflammatory regulator active in several cancers and non-tumor diseases except liver cancer in prior studies (Aguado-Fraile et al., 2015; Li et al., 2017; Tang et al., 2018). Our study revealed the favorable diagnostic and prognostic capabilities of miR-93-3p in HCC for the first time. A co-expression network of target genes of miR-93-3p was constructed and a gene module significantly related to the prognosis was identified based on WGCNA algorithm. Next, a new 5-gene signature for prognostic stratification was established by univariate and LASSO COX analysis. Meanwhile, the prognostic signature-based risk score showed an excellent predictive effect on the overall survival of the patient. The high risk was related to the poor prognosis of the patient. Subsequently, a nomogram including risk score and AJCC stage was constructed to improve prognosis prediction. We found that the 5-gene signature had a strong correlation with immune infiltration through the exploration of the immune microenvironment. Particularly, the infiltration of T cells, B cells and macrophages was closely dependent on the expression of 5-gene signatures. Interestingly, the six pathways obtained by GSEA were all related to the immune system. Therefore, the novel 5-gene signature related to immune infiltration could serve as a promising prognostic marker.
As a tumor sensitive molecule, miR-93-3p has been found to be involved in the progression of many malignant diseases. In the pathological process of cardiomyocyte dysfunction, miR-93-3p reduced inflammation and apoptosis induced by lipopolysaccharide (LPS) by inhibiting toll-like receptor 4 (TLR4) (Tang et al., 2018) MiR-93-3p was found to be expected to regulate pigment epithelium-derived factor (PEDF), and then played a regulatory role on apoptosis, migration and invasion in clear cell renal cell carcinoma (ccRCC) (Wang et al., 2017b). MiR-93-3p was considered to be an important cancer signaling molecule not only in tissues, but also in the blood. The study found that circulating miR-93-3p may be occupied by surrounding tumor cells and activate the Wnt/β-catenin signaling pathway, which greatly improved the chemoresistance of triple-negative breast cancer (Li et al., 2017). These studies revealed the anti-tumor effects and possible regulatory biological mechanisms of miR-93-3p.
Based on prognostic module genes identified by WGCNA, we used univariate COX regression analysis and LASSO optimization to determine a novel 5-gene signature for prognostic prediction (cct5, cdk4, cenpa, dtnbp1 and flvcr1). Five genes are identified as independent prognostic factors of HCC. cct5, cdk4, cenpa, and flvcr1 have been widely reported as active tumorigenic genes in HCC. In particular, cdk4 has been widely known as one of the members of the cyclin-dependent kinase family that drives abnormal cell cycle progression in tumors (Hanahan and Weinberg, 2011). The combination of cdk4 and cyclin could control the DNA synthesis of cancer cells from G1 to S phase leading to rapid cell proliferation (Lim and Kaldis, 2013). Conversely, the competitive binding of some CDK inhibitory proteins and cdk4 plays a key role in inhibiting tumor cell growth (Yang et al., 2016). Compared with cct5, cdk4, cenpa, and flvcr1 directly regulate the progress of HCC less reported (Wei et al., 2020; Yao et al., 2019; Zhang et al., 2020b). Relevant studies on the impact of dtnbp1 on HCC progression and prognosis have not been reported. The prognostic performance of dtnbp1 obtained in the study may provide guidance for the relevant investigations.
With the popularity of genome sequencing technology, there have been endless developments of multi-feature signature and nomograms that enhance prognostic prediction in recent years. The results obtained based on different exploration directions and research methods are also different. A 4-regulator risk signature was established based on the results of N6-methyladenosine (m6A) RNA methylation involved in the pathogenesis and prognosis of cancer (Qu et al., 2020). Also, multi-gene signatures and nomograms derived from prognosis-related genes, cell senescence-related genes and differentially expressed genes have also been reported (Hu et al., 2020; Liu et al., 2019; Xiang et al., 2019). Unfortunately, the prognostic capabilities of these signature and nomograms are not ideal. On the contrary, our 5-gene signature and nomogram show robust prediction performance of survival of HCC. The AUCs of the ROC curve of the risk prognostic signature predicting 1-year, 3-year, and 5-year survival rates were 0.795, 0.697, and 0.677, respectively. Deep analysis algorithms, including WGCNA and LASSO, also increase the credibility of the results. In addition, a 4-gene prognostic signature with cenpa that predicts overall survival of HCC well confirmed our results to some extent (Long et al., 2018). Recently, a prognostic signature containing 5 lncRNAs, 11 miRNAs, 30 mRNAs, 4 methylations, and 3 proteins showed a possibility of reaching 89.32% accuracy (Kaushik et al., 2020). However, the practicability of the signature is controversial and has not been clinically verified.
So far, many molecular signatures for prognosis prediction have been developed. Similar to our research, Chen et al. (2019) and Wang et al. (2018) respectively constructed a 4-gene prognostic model and a 6-gene prognostic model for the survive prediction. However, both studies lack a quantitative assessment of the predictive ability of the prognostic model for survival prediction. Compared with previously identified genetic signatures, it seems that our risk score based on prognostic signatures has a higher AUC (AUC = 0.795 for 1 year; AUC = 0.697 for 3 years; AUC = 0.677 for 5 years). These signatures include Chang et al. (2019) (8-gene, AUC = 0.667 for 1 years; AUC = 0.630 for 3 years; AUC = 0.618 for 5 years), Zheng et al. (2018) (4-gene, AUC = 0.671 for 1 years; AUC = 0.666 for 3 years; AUC = 0.648 for 5 years) and Xiang et al. (2019) (7-gene, AUC = 0.686 for 1 years; AUC = 0.644 for 3 years; AUC = 0.615 for 5 years). Compared with previous prognostic signatures, our 5-gene signature maintains a high prognostic prediction accuracy while also taking into account the simplicity of the signature.
At present, AJCC stage is one of the most widely used prognostic indicators of HCC in clinical practice (Abdel-Rahman, 2018). The effective prognostic information and the matching selection of appropriate therapeutic schedule is a highlight of the AJCC stage system. The results of univariate and multivariate COX regression analysis show that AJCC stage is a powerful prognostic tool. Meanwhile, the new 5-gene signature shows a stronger prognostic ability than the AJCC stage and has no correlation with the AJCC stage. In addition, the nomogram constructed by combining the 5-gene signature-based risk score and the AJCC stage shows an excellent prognostic prediction effect. This further shows that the 5-gene signature is a compelling predictor of prognosis.
A noteworthy conclusion is that our prognostic signature is significantly related to the level of immune infiltration of the tumor microenvironment. We found that several T cells, macrophages M0 and mast cells resting have huge abundance differences in different risk groups based on CIBERSORT analysis. Likewise, the expression of the 5 genes in prognostic signature was obviously positively correlated with the infiltration levels of 6 immune cells (especially T cells and macrophages) in TIMER. Therefore, prognostic signature-based patients with high risk may be candidates for T cell and macrophage targeted therapies. In addition, we further found that the prognostic signature was significantly positively correlated with the expression of multiple gene markers of T cell and B cell. CD8+ T cell, Th1, Th2, Tfh, Th17 and T cell exhaustion are different functional T cells. The prognostic signature increases the infiltration level of T cell by stimulating the expression of CD8A, CD8B, CD2, CD3E, CCR7, T-bet, STAT4, TNF-α, GATA3, STAT6, STAT5A, BCL6, STAT3, PD-1, CTLA4, LAG3 and TIM-3. Furthermore, CD19 and CD79A may be bridges for prognostic signatures to regulate B cell infiltration. These findings indicate that 5-gene signatures play a key role in the regulation and recruitment of tumor-infiltrating immune cells in HCC.
At present, the research on the role of tumor infiltrating immune cells in human tumors is mainly focused on T cells. These reports are mainly concerned with the suppression of immune checkpoints and patient survival (Buchbinder and Mcdermott, 2015; Powles et al., 2014). This study complements the evidence of T cells as a positive prognostic factor. Previous studies have found that macrophages participate in immune responses by activating tumor antigens and presenting them to T cells. However, macrophages often promote tumor progression due to inadequate immune surveillance (Lamagna et al., 2006). B cells infiltrate, proliferate and develop driven by signals within the tumor microenvironment. And B cells secrete tumor-specific antibodies and promote T cell responses to exert anti-tumor immunity (Bruno et al., 2017; Campa et al., 2016). The high abundance of immune cells corresponds to the high risk, which indicates a possible mechanism by which the prognostic signature affects the overall survival of HCC. T cells are divided into two subgroups: CD4+ T cells and CD8+ T cells according to their functions and surface markers. The former functions as helper T cells, while the latter plays a killing and regulating role. The ratio of both is a sensitive indicator that reflects the immune balance of the body. Under normal circumstances, the ratio of the two maintains a dynamic balance (Han et al., 2014). When liver cancer occurs, the amount of the two will change. The number of CD4+ T cells decreases and the number of CD8+ T cells increases. At the same time, the decline of the CD4+ T cells makes the tumor immune escape, while CD8+ T cells exhibited immune suppression and caused cell damage (Mizukoshi and Kaneko, 2019; Pedroza-Gonzalez et al., 2013).
In addition, GSEA also revealed the different immune status of the high-risk group compared to the low-risk group. From low risk to high risk of patients, cancer deterioration generally accompanies the growth and metastasis of tumors. Previous studies have shown that cell cycle dysfunction and ECM receptors are significantly associated with cancer development (Kang et al., 2015). The 6 KEGG pathways (cytokine-cytokine receptor interaction, oocyte meiosis, phagosome, cell cycle, ECM-receptor interaction, and hematopoietic cell lineage) further provide evidence for the applicability of the prognostic signature.
The study revealed the favorable diagnostic and prognostic capabilities of miR-93-3p in HCC. And a novel 5-gene signature (cct5, cdk4, cenpa, dtnbp1, and flvcr1) based risk score and nomogram for prognostic prediction were established based on the combined application of WGCNA, LASSO Cox and SVM algorithms. In addition, the infiltration of T cells, B cells and macrophages is closely dependent on the expression of 5-gene signatures. Therefore, the 5-gene signature related to immune infiltration could serve as a promising prognostic marker.
Although abundant work has been done, some limitations still exist in the paper. The limitations are as follows: (1) the research data are from online databases, and experimental verification is lacked; and (2) there are several hard filtering criteria in the investigation, which may cause the omission of key genes involved in the progress of HCC.
Availability of Data and Materials: All data used during the study appear in the submitted paper and can be obtained from TCGA and GEO database.
Author Contribution: The authors confirm contribution to the paper as follows: study conception and design: Han Zhao, Qingjia Chi; data collection: Meng Fang, Jing Guo; analysis and interpretation of results: Meng Fang, Zichang Yang; draft manuscript preparation: Meng Fang, Haiping Wang. All authors reviewed the results and approved the final version of the manuscript.
Funding Statement: This work was supported by Health Commission of Hubei Province Scientific Research Project [WJ2021M217]; and the Scientific Research Foundation of Jianghan University [2020010].
Conflicts of Interest: The authors declare that they have no conflicts of interest to report regarding the present study.
Abdel-Rahman O (2018). Assessment of the discriminating value of the 8th AJCC stage grouping for hepatocellular carcinoma. HPB 20: 41–48. [Google Scholar]
Aguado-Fraile E, Ramos E, Conde E, Rodriguez M, Martin-Gomez L, Lietor A, Candela A, Ponte B, Liano F, Garcia-Bermejo ML (2015). A pilot study identifying a set of microRNAs as precise diagnostic biomarkers of acute kidney injury. PLoS One 10: e0127175. [Google Scholar]
Bray F, Ferlay J, Soerjomataram I, Siegel RL, Torre LA, Jemal A (2018). Global cancer statistics 2018: GLOBOCAN estimates of incidence and mortality worldwide for 36 cancers in 185 countries. CA: A Cancer Journal for Clinicians 68: 394–424. [Google Scholar]
Bruno TC, Ebner PJ, Moore BL, Squalls OG, Waugh KA et al. (2017). Antigen-presenting intratumoral B cells affect CD4+ TIL phenotypes in non-small cell lung cancer patients. Cancer Immunology Research 5: 898–907. [Google Scholar]
Buchbinder EI, Mcdermott DF (2015). Cytotoxic T-lymphocyte antigen-4 blockade in melanoma. Clinical Therapeutics 37: 755–763. [Google Scholar]
Buonaguro L, Mauriello A, Cavalluzzo B, Petrizzo A, Tagliamonte M (2019). Immunotherapy in hepatocellular carcinoma. Annals of Hepatology 18: 291–297. [Google Scholar]
Campa MJ, Moody MA, Zhang R, Liao HX, Gottlin EB, Patz EF (2016). Interrogation of individual intratumoral B lymphocytes from lung cancer patients for molecular target discovery. Cancer Immunology, Immunotherapy 65: 171–180. [Google Scholar]
Chang WH, Forde D, Lai AG (2019). A novel signature derived from immunoregulatory and hypoxia genes predicts prognosis in liver and five other cancers. Journal of Translational Medicine 17: 14. [Google Scholar]
Chen DS, Mellman I (2013). Oncology meets immunology: The cancer-immunity cycle. Immunity 39: 1–10. [Google Scholar]
Chen PF, Li QH, Zeng LR, Yang XY, Peng PL, He JH, Fan B (2019). A 4-gene prognostic signature predicting survival in hepatocellular carcinoma. Journal of Cellular Biochemistry 120: 9117–9124. [Google Scholar]
Chi Q, Geng X, Xu K, Wang C, Zhao H (2020). Potential targets and molecular mechanism of miR-331-3p in hepatocellular carcinoma identified by weighted gene coexpression network analysis. Bioscience Reports 40: BSR20200124. [Google Scholar]
Chi Q, Jiang J (2012). A bead-spring model and mean field theory-based re-calculation reveals uncertainty of rouse-type dna dynamics in dilute solution. Biomedical Engineering: Applications, Basis and Communications 24: 355–364. [Google Scholar]
Chi Q, Wang G, Jiang J (2013). The persistence length and length per base of single-stranded DNA obtained from fluorescence correlation spectroscopy measurements using mean field theory. Physica A: Statistical Mechanics and Its Applications 392: 1072–1079. [Google Scholar]
Feng X, Zhou S, Cai W, Guo J (2021). The miR-93-3p/ZFP36L1/ZFX axis regulates keratinocyte proliferation and migration during skin wound healing. Molecular Therapy-Nucleic Acids 23: 450–463. [Google Scholar]
Fujita M, Yamaguchi R, Hasegawa T, Shimada S, Arihiro K et al. (2020). Classification of primary liver cancer with immunosuppression mechanisms and correlation with genomic alterations. EBioMedicine 53: 102659. [Google Scholar]
Gotwals P, Cameron S, Cipolletta D, Cremasco V, Crystal A et al. (2017). Prospects for combining targeted and conventional cancer therapy with immunotherapy. Nature Reviews Cancer 17: 286–301. [Google Scholar]
Han Y, Chen Z, Yang Y, Jiang Z, Gu Y et al. (2014). Human CD14+ CTLA-4+ regulatory dendritic cells suppress T-cell response by cytotoxic T-lymphocyte antigen-4-dependent IL-10 and indoleamine-2, 3-dioxygenase production in hepatocellular carcinoma. Hepatology 59: 567–579. [Google Scholar]
Hanahan D, Weinberg RA (2011). Hallmarks of cancer: The next generation. Cell 144: 646–674. [Google Scholar]
He L, Hannon GJ (2004). MicroRNAs: Small RNAs with a big role in gene regulation. Nature Reviews Genetics 5: 522–531. [Google Scholar]
Hu B, Yang XB, Sang XT (2020). Development of an immune-related prognostic index associated with hepatocellular carcinoma. Sedentary Life and Nutrition 12: 5010. [Google Scholar]
Kang N, Shah VH, Urrutia R (2015). Membrane-to-nucleus signals and epigenetic mechanisms for myofibroblastic activation and desmoplastic stroma: Potential therapeutic targets for liver metastasis? Molecular Cancer Research 13: 604–612. [Google Scholar]
Kaushik AC, Mehmood A, Wei DQ, Dai X (2020). Robust biomarker screening using spares learning approach for liver cancer prognosis. Frontiers in Bioengineering and Biotechnology 8: 241. [Google Scholar]
Kim HD, Song GW, Park S, Jung MK, Kim MH et al. (2018). Association between expression level of PD1 by tumor-infiltrating CD8+ T cells and features of hepatocellular carcinoma. Gastroenterology 155: 1936–1950. [Google Scholar]
Lamagna C, Aurrand-Lions M, Imhof BA (2006). Dual role of macrophages in tumor growth and angiogenesis. Journal of Leukocyte Biology 80: 705–713. [Google Scholar]
Lange N, Dufour JF (2019). Changing epidemiology of HCC: How to screen and identify patients at risk? Digestive Diseases and Sciences 64: 903–909. [Google Scholar]
Li HY, Liang JL, Kuo YL, Lee HH, Calkins MJ et al. (2017). miR-105/93-3p promotes chemoresistance and circulating miR-105/93-3p acts as a diagnostic biomarker for triple negative breast cancer. Breast Cancer Research 19: 133. [Google Scholar]
Li YJ, Yang Z, Wang YY, Wang Y (2019). Long noncoding RNA ZNF667-AS1 reduces tumor invasion and metastasis in cervical cancer by counteracting microRNA-93-3p-dependent PEG3 downregulation. Molecular Oncology 13: 2375–2392. [Google Scholar]
Lim S, Kaldis P (2013). Cdks, cyclins and CKIs: Roles beyond cell cycle regulation. Development 140: 3079–3093. [Google Scholar]
Liu GM, Xie WX, Zhang CY, Xu JW (2020a). Identification of a four-gene metabolic signature predicting overall survival for hepatocellular carcinoma. Journal of Cellular Physiology 235: 1624–1636. [Google Scholar]
Liu GM, Zeng HD, Zhang CY, Xu JW (2019). Identification of a six-gene signature predicting overall survival for hepatocellular carcinoma. Cancer Cell International 19: 138. [Google Scholar]
Liu J, Ke F, Chen T, Zhou Q, Weng L et al. (2020b). MicroRNAs that regulate PTEN as potential biomarkers in colorectal cancer: A systematic review. Journal of Cancer Research and Clinical Oncology 146: 809–820. [Google Scholar]
Liu Q, Wang K, Huang R, Tong X, Jiang T, Wang J, Yang P (2020c). A novel DNA damage response signature of IDH-mutant grade II and grade III astrocytoma at transcriptional level. Journal of Cancer Research and Clinical Oncology 146: 579–591. [Google Scholar]
Long J, Zhang L, Wan X, Lin J, Bai Y, Xu W, Xiong J, Zhao H (2018). A four-gene-based prognostic model predicts overall survival in patients with hepatocellular carcinoma. Journal of Cellular and Molecular Medicine 22: 5928–5938. [Google Scholar]
Llovet JM, Montal R, Sia D, Finn RS (2018). Molecular therapies and precision medicine for hepatocellular carcinoma. Nature Reviews Clinical oncology 15: 599–616. [Google Scholar]
Mizukoshi E, Kaneko S (2019). Immune cell therapy for hepatocellular carcinoma. Journal of Hematology & Oncology 12: 52. [Google Scholar]
Pedroza-Gonzalez A, Verhoef C, Ijzermans JN, Peppelenbosch MP, Kwekkeboom J, Verheij J, Janssen H, Sprengers D (2013). Activated tumor-infiltrating CD4+ regulatory T cells restrain antitumor immunity in patients with primary or metastatic liver cancer. Hepatology 57: 183–194. [Google Scholar]
Piasecka D, Braun M, Kordek R, Sadej R, Romanska H (2018). MicroRNAs in regulation of triple-negative breast cancer progression. Journal of Cancer Research and Clinical Oncology 144: 1401–1411. [Google Scholar]
Powles T, Eder JP, Fine GD, Braiteh FS, Loriot Y et al. (2014). MPDL3280A (anti-PD-L1) treatment leads to clinical activity in metastatic bladder cancer. Nature 515: 558–562. [Google Scholar]
Qu N, Qin S, Zhang X, Bo X, Liu Z, Tan C, Wen G, Jiang H (2020). Multiple m6A RNA methylation modulators promote the malignant progression of hepatocellular carcinoma and affect its clinical prognosis. BMC Cancer 20: 165. [Google Scholar]
Salehi Z, Hadadi P, Tavallaei O (2019). Prediction of biomarker miRNAs signature in colorectal cancer metastasis to liver cancer. Electronic Journal of General Medicine 16: em100. [Google Scholar]
Shang X, Li G, Liu H, Li T, Liu J, Zhao Q, Wang C (2016). Comprehensive circular RNA profiling reveals that hsa_circ_0005075, a new circular RNA biomarker, is involved in hepatocellular crcinoma development. Medicine 95: e3811. [Google Scholar]
Tang B, Xuan L, Tang M, Wang H, Liu J, Wu S, Li M, Wang X, Zhang H (2018). miR-93-3p alleviates lipopolysaccharide-induced inflammation and apoptosis in H9c2 cardiomyocytes by inhibiting toll-like receptor 4. Pathology-Research and Practice 214: 1686–1693. [Google Scholar]
Wang C, Fu SY, Wang MD, Yu WB, Cui QS et al. (2017a). Zinc finger protein X-linked promotes expansion of EpCAM+ cancer stem-like cells in hepatocellular carcinoma. Molecular Oncology 11: 455–469. [Google Scholar]
Wang L, Yang G, Zhu X, Wang Z, Wang H et al. (2017b). miR-93-3p inhibition suppresses clear cell renal cell carcinoma proliferation, metastasis and invasion. Oncotarget 8: 82824. [Google Scholar]
Wang Z, Teng D, Li Y, Hu Z, Liu L, Zheng H (2018). A six-gene-based prognostic signature for hepatocellular carcinoma overall survival prediction. Life Sciences 203: 83–91. [Google Scholar]
Wei X, Ke J, Huang H, Zhou S, Guo A et al. (2020). Screening and identification of potential biomarkers for hepatocellular carcinoma: An analysis of TCGA database and clinical validation. Cancer Management and Research 12: 1991. [Google Scholar]
Xiang XH, Yang L, Zhang X, Ma XH, Miao RC et al. (2019). Seven-senescence-associated gene signature predicts overall survival for Asian patients with hepatocellular carcinoma. World Journal of Gastroenterology 25: 1715. [Google Scholar]
Xu K, Huang Y, Zhou T, Wang C, Chi Q, Shi J, Zhu P, Dong N (2019a). Nobiletin exhibits potent inhibition on tumor necrosis factor alpha-induced calcification of human aortic valve interstitial cells via targeting ABCG2 and AKR1B1. Phytotherapy Research 33: 1717–1725. [Google Scholar]
Xu K, Sha Y, Wang S, Chi Q, Liu Y, Wang C, Yang L (2019b). Effects of Bakuchiol on chondrocyte proliferation via the PI3K-Akt and ERK1/2 pathways mediated by the estrogen receptor for promotion of the regeneration of knee articular cartilage defects. Cell Proliferation 52: e12666. [Google Scholar]
Yang H, Zhao X, Zhao L, Liu L, Li J, Jia W, Liu J, Huang G (2016). PRMT5 competitively binds to CDK4 to promote G1-S transition upon glucose induction in hepatocellular carcinoma. Oncotarget 7: 72131. [Google Scholar]
Yao L, Zou X, Liu L (2019). The TCP1 ring complex is associated with malignancy and poor prognosis in hepatocellular carcinoma. International Journal of Clinical and Experimental Pathology 12: 3329. [Google Scholar]
Zhang BH, Yang J, Jiang L, Lyu T, Kong LX et al. (2020a). Development and validation of a 14-gene signature for prognosis prediction in hepatocellular carcinoma. Genomics 112: 2763–2771. [Google Scholar]
Zhang Y, Yang L, Shi J, Lu Y, Chen X, Yang Z (2020b). The oncogenic role of CENPA in hepatocellular carcinoma development: evidence from bioinformatic analysis. BioMed Research International 2020: 3040839. [Google Scholar]
Zhao C, Xing F, Yeo YH, Jin M, Le R, Le M, Jin M, Henry L, Cheung R, Nguyen MH (2020). Only one-third of hepatocellular carcinoma cases are diagnosed via screening or surveillance: A systematic review and meta-analysis. European Journal of Gastroenterology & Hepatology 32: 406–419. [Google Scholar]
Zheng Y, Liu Y, Zhao S, Zheng Z, Shen C, An L, Yuan Y (2018). Large-scale analysis reveals a novel risk score to predict overall survival in hepatocellular carcinoma. Cancer Management and Research 10: 6079. [Google Scholar]
Supplementary Figure
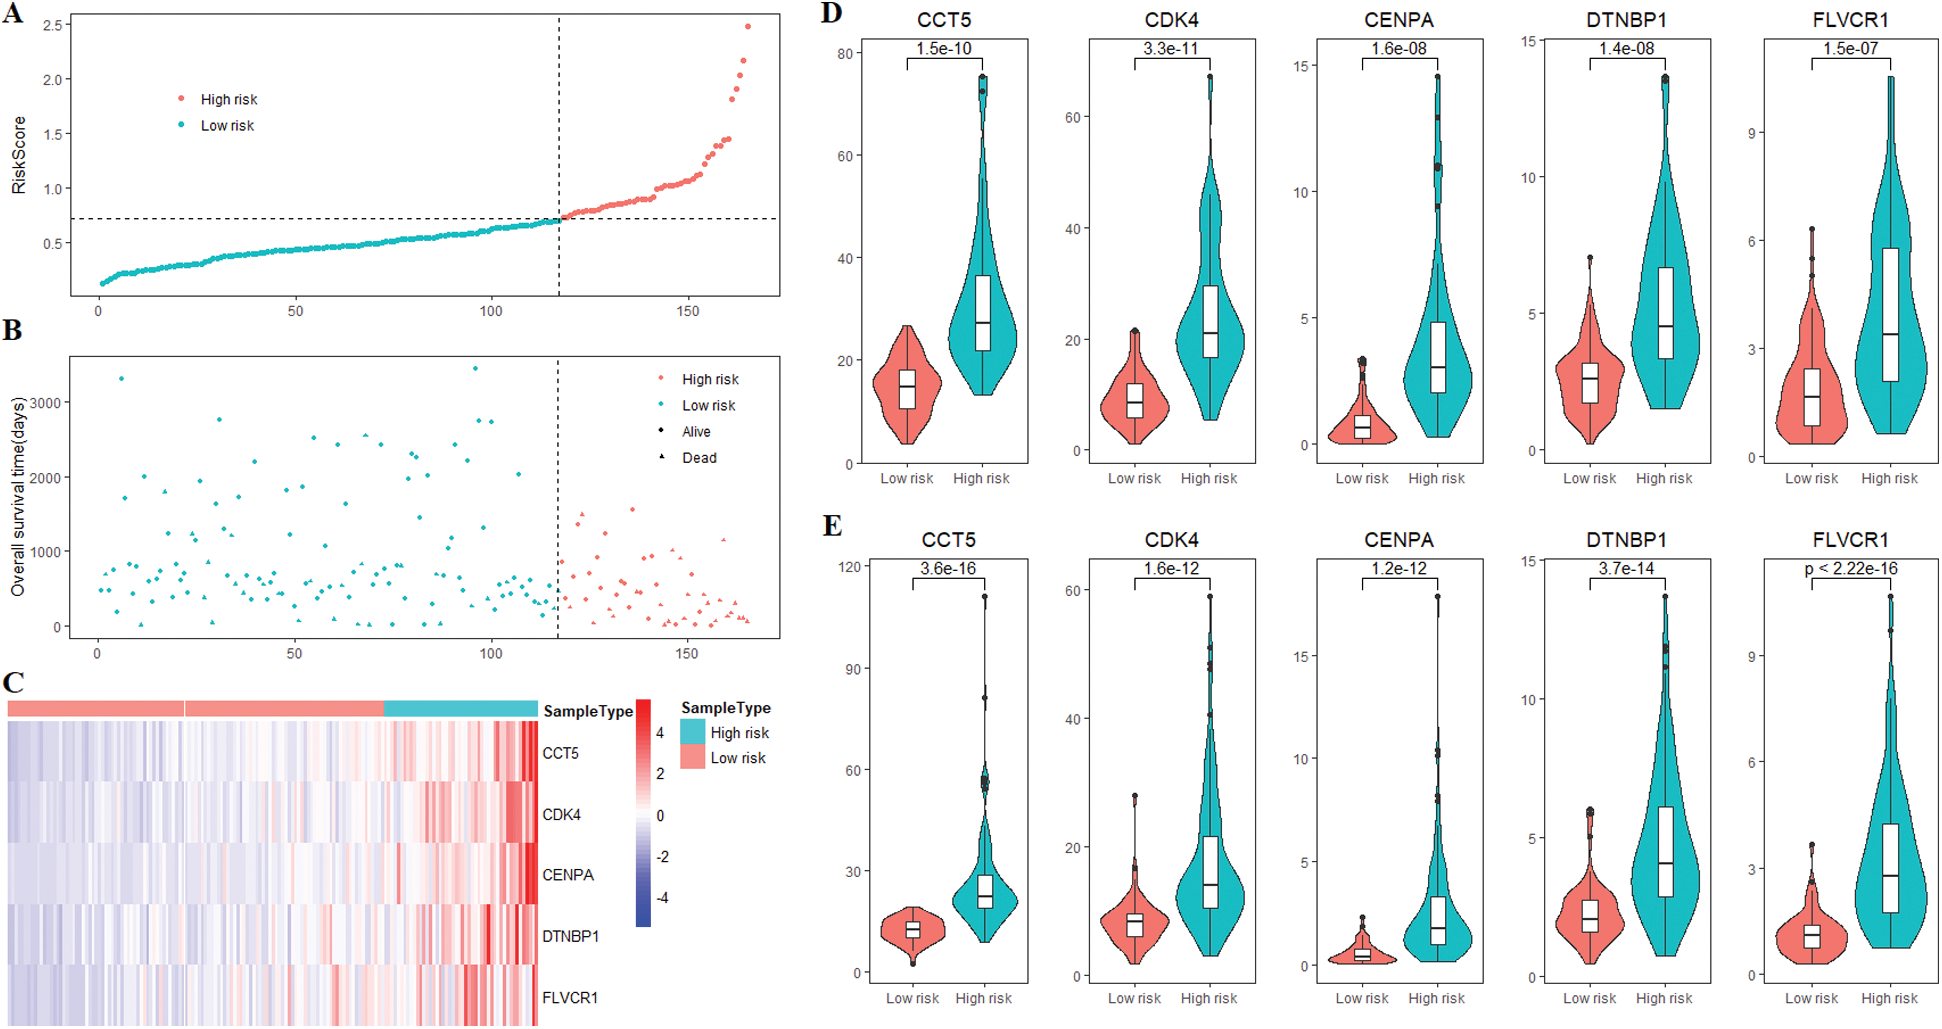
Supplementary Figure 1: The risk score and 5 prognostic genes expression of HCC patients. (A) The risk scores of 165 patients in the training cohort. (B) Survival status of 165 patients in the training cohort. (C) The heatmap of the expression of 5 prognostic genes in the training cohort. (D) Compared with the low-risk group, all 5 genes were highly expressed in the high-risk group of patients in the training cohort. (E) Compared with the low-risk group, all 5 genes were highly expressed in the high-risk group of patients in the validation cohort.
 | This work is licensed under a Creative Commons Attribution 4.0 International License, which permits unrestricted use, distribution, and reproduction in any medium, provided the original work is properly cited. |