DOI:10.32604/biocell.2022.017004
| BIOCELL DOI:10.32604/biocell.2022.017004 | |
| Article |
Identification of a 10-pseudogenes signature as a novel prognosis biomarker for ovarian cancer
1State Key Laboratory of Respiratory Disease, Institute for Chemical Carcinogenesis, Collaborative Innovation Center for Environmental Toxicity, Guangzhou Medical University, Guangzhou, 510182, China
2Research Center of Medical Sciences, Guangdong Academy of Medical Sciences, Guangzhou, 510080, China
3Department of Obstetrics and Gynecology, Guangzhou Women and Children’s Medical Center, Guangzhou, 510000, China
4Department of Obstetrics and Gynecology, The Third Affiliated Hospital, Guangzhou Medical University, Guangzhou, 510150, China
*Address correspondence to: Fuman Qiu, fumanqiu@gzhmu.edu.cn
#These authors contributed equally to this work
Received: 19 April 2021; Accepted: 07 June 2021
Abstract: The outcomes of ovarian cancer are complicated and usually unfavorable due to their diagnoses at a late stage. Identifying the efficient prognostic biomarkers to improve the survival of ovarian cancer is urgently warranted. The survival-related pseudogenes retrieved from the Cancer Genome Atlas database were screened by univariate Cox regression analysis and further assessed by least absolute shrinkage and selection operator (LASSO) method. A risk score model based on the prognostic pseudogenes was also constructed. The pseudogene-mRNA regulatory networks were established using correlation analysis, and their potent roles in the ovarian cancer progression were uncovered by functional enrichment analysis. Lastly, ssGSEA and ESTIMATE algorithms was used to evaluate the levels of immune cell infiltrations in cancer tissues and explore their relationship with risk signature. A prediction model of 10-pseudogenes including RPL10P6, AC026688.1, FAR2P4, AL391840.2, AC068647.2, FAM35BP, GBP1P1, ARL4AP5, RPS3AP2, and AMD1P1 was established. The 10-pseudogenes signature was demonstrated to be an independent prognostic factor in patient with ovarian cancer in the random set (hazard ratio [HR] = 2.512, 95% confidence interval [CI] = 2.03–3.11, P < 0.001) and total set (HR = 1.71, 95% CI = 1.472–1.988, P < 0.001). When models integrating with age, grade, stage, and risk signature, the Area Under Curve (AUC) of the 1-year, 3-year, 5-year and 10-year Receiver Operating Characteristic curve in the random set and total set were 0.854, 0.824, 0.855, 0.805 and 0.679, 0.697, 0.739, 0.790, respectively. The results of functional enrichment analysis indicated that the underlying mechanisms by which these pseudogenes influence cancer prognosis may involve the immune-related biological processes and signaling pathways. Correlation analysis showed that risk signature was significantly correlated with immune cell infiltration and immune score. We identified a novel 10-pseudogenes signature to predict the survival of patients with ovarian cancer, and that may serve as novel possible prognostic biomarkers and therapeutic targets for ovarian cancer.
Keywords: Pseudogene; Ovarian cancer; Prognosis; Risk signature; Immune infiltration
Ovarian cancer is one of the most common malignant tumors in female genitals (Siegel et al., 2020). On account of the fact that ovary is located in the deep pelvic cavity, it is not easily detected at the early stage (Stewart et al., 2019; Vargas, 2014). As a result, substantial cases accounting for approximately 70% of newly patients was diagnosed with distant metastasis, and thus resulted in a high mortality rate (Hudson et al., 2008; Lengyel, 2010). Although the improved therapeutics such as the traditional radical surgery combined with adjuvant chemotherapy were extensively applied, the patients with ovarian cancer eventually show easy relapse after surgery and become drug resistant, leading to a low probability of overall five-year survival (Jayson et al., 2014; Li et al., 2018). Therefore, identifying the molecular markers in ovarian cancer prognosis is of significance to guide appropriate treatment and improve survival outcome of patients with ovarian cancer (Qazi and Raza, 2021; Zhang et al., 2021).
Pseudogenes are genomic DNA sequences that are similar to the corresponding functional genes, but they lose their original function to code for proteins due to the accumulation of various mutations (Proudfoot, 1980). Pseudogenes are evolutionally conserved, and are present in diverse organisms (Stensmyr, 2016; Wen et al., 2011). Although initially considered as non-functional fragments (Proudfoot, 1980; Zhang et al., 2003b), in the past few years, pseudogenes have been certified to be ubiquitous and crucial in regulating a variety of cellular processes via acting as key regulators at transcriptional and post-transcriptional levels (An et al., 2017; Groen et al., 2014). Accumulating evidence has extensively investigated and established that dysregulation of pseudogenes plays critical roles in development and human diseases progression, and these deregulated pseudogenes may serve as promising therapeutic targets for diseases, especially in cancers (Lou et al., 2019b; Yue et al., 2019). For example, PTENP1, the first identified pseudogene, was reported to be down-regulated in numerous cancers including breast cancer, melanoma, and endometrioid endometrial carcinoma (Chen et al., 2018; Gao et al., 2019; Poliseno et al., 2011). Besides, methylation of the PTENP1 as potential epigenetic marker was associated with a more favorable prognosis for endometrial cancer (Kovalenko et al., 2021). Epigenetic modifications have been reported to be widely involved in the development of ovarian cancer and can be used as a potential biomarker as well as a therapeutic target for the disease (Qazi et al., 2021; Rattanapan et al., 2018; Singh et al., 2019). A study indicated that LDHAP5 was upregulated and played an unfavorable role in overall survival of ovarian serous cystadenocarcinoma by regulating the EGFR expression (Lin et al., 2020). Another evidence shown that MYC-regulated pseudogene HMGA1P6 was one of the overexpressed pseudogenes in ovarian cancer, and its expression was negatively correlated with patient survival. Mechanistically, HMGA1P6 promoted ovarian cancer cell malignancy by acting as a ceRNA to enhance HMGA1 and HMGA2 expression (Tian et al., 2020). All these findings suggest that abnormal alterations of pseudogenes occur broadly in multifarious cancers, and they may serve as fulfilling markers for accurately prognosticating clinical outcome in patients with ovarian cancer.
In this study, we performed a comprehensive analysis of pseudogene expression with disease prognosis in a total of 373 ovarian cancer patients from The Cancer Genome Atlas (TCGA) project. Finally, we identified a relevant 10-pseudogenes signature-based risk score with a distinguished ability to predict the survival prognosis of patients with ovarian cancer in the random cohort and validated its prognostic value in the total cohort. Additionally, the potential roles and molecular mechanisms of these survival-related pseudogenes in the carcinogenesis and progressions of ovarian cancer were further elucidated by functional enrichment analysis.
Data source and pre-processing
Gene expression profiles and clinical information of serous ovarian carcinoma were downloaded from the TCGA data portal (https://portal.gdc.cancer.gov/). Pseudogenes were annotated based on the Ensembl Genomes (http://ensemblgenomes.org/). The raw data were normalized with log2(x+1) transformation. After excluding cases without complete survival information and genes whose missing rates were more than 50% in total samples, a total of 373 patients and 6113 pseudogenes were utilized in the current study. Samples were randomly separated into a random set (accounting for 60%) and a total set via the R caret package. The random set was used to identify survival-related pseudogenes and structure a pseudogenes risk signature, and all samples were taken for internal validation.
Establishment of pseudogenes risk signature
Univariate Cox regression analysis was applied to screen candidate prognostic pseudogenes, which was considered statistically significant with a threshold value of P < 0.01. The LASSO-Cox regression analysis was conducted to filter the pool of survival-related pseudogenes. Subsequently, the stepwise multivariate Cox regression analysis was used to further select pseudogenes. A risk signature was established according to the stepwise Cox regression coefficient multiplied with its pseudogene expression. The risk score formula was constructed as follows:
risk score =
Construction of the pseudogene-mRNA regulatory network
As the previous evidence indicates that the Pearson correlation coefficient is one of the mostly adopted and moderate methods for measuring the interactions among genes based on their expression levels (Song et al., 2012), we then utilized this methodology to construct the regulatory networks between the pseudogenes and mRNAs. The coefficient values of Pearson correlation analysis can range from +1 to −1, and if the coefficient value lies between ±0.50 and ±1, then it means to be a strong correlation (Mukaka, 2012). So potential target mRNAs with |r|-value ≥0.5 was finally selected, and then Cytoscape 3.5.1 was applied to construct pseudogene-mRNA regulatory networks.
Functional enrichment analysis
To investigate the biological roles of the 10-pseudogenes signature in ovarian cancer, gene ontology (GO) and Kyoto encyclopedia of genes and genomes (KEGG) pathway enrichment analysis were performed for the identified genes related to the candidate pseudogenes in the regulatory networks by using the clusterProfiler package in R (Yu et al., 2012). All three GO categories, i.e., biological process (BP), cellular component (CC), and molecular function (MF) were analyzed. GO terms and KEGG pathways with BH-corrected P < 0.05 were considered as significant.
Correlation analysis of immune cell infiltration
The single-sample gene set enrichment analysis (ssGSEA) was applied to calculate the infiltration data of multiple immune cells in the samples. The immune score, tumor purity, estimate score and stromal score of each cancer sample were calculated with the ESTIMATE algorithm (Yoshihara et al., 2013). Pearson correlation analysis was used to analyze the relationship between risk scores and immune infiltration level, as well as immune scores.
The baseline characteristics of ovarian cancer patients were described using summary statistics. Continuous variables were shown as mean ± standard deviation and categorical variables were expressed as counts (percentages). The differences comparison of categorical variables and continuous variables between the groups were analyzed using χ2 test and independent Student’s t-test, respectively. The Kaplan–Meier survival curves were adopted to evaluate the overall survival time between high-risk group and low-risk group. Hazard ratio (HR) and 95% confidence intervals (CI) were estimated by Cox proportional hazards regression model. The area under the curve (AUC) of the receiver-operator characteristic (ROC) was calculated and compared to estimate the performance of the prognostic classifier and factors in predicting survival outcome of patients with ovarian cancer. The time-dependent ROC curve analysis was performed by using survival ROC package, and LASSO regression was conducted using glmnet R package. ssGSEA analysis was performed with GSVA R package. Nomogram plots and calibration curve were done with the rms package. The prognostication value of the nomogram was verified internally using 1,000 bootstrap samples. Decision curve analysis (DCA) were performed to verify the clinical role of the nomogram for the 10- pseudogenes signature with ggDCA package. All statistical analyses were performed using R software version 4.0.2 and P < 0.05 was considered statistically significant.
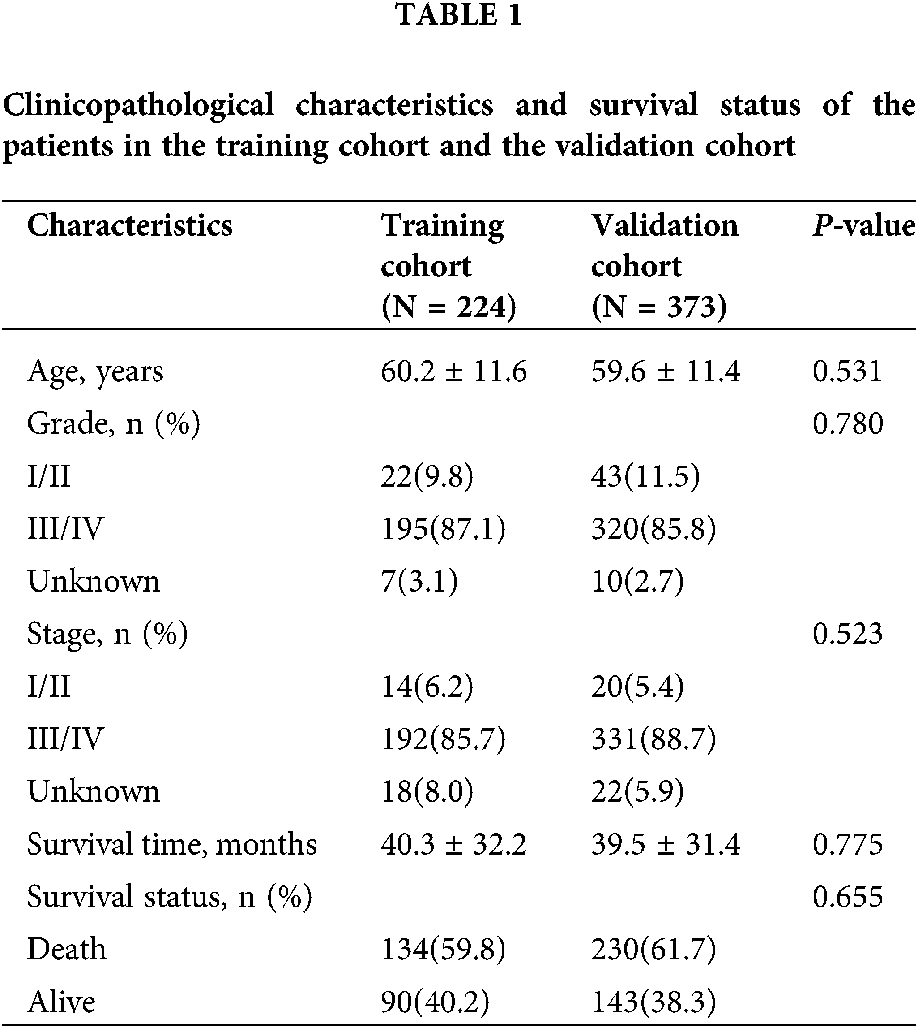
After removal of the samples with inadequate survival information, a total of 373 patients with ovarian cancer were analyzed in the present study. The clinicopathological characteristics and survival status of the patients were summarized in Table 1. Patients were randomly divided into a random cohort (N = 224) and all patients served as an internal validation cohort.
Prognosis-related pseudogenes selection
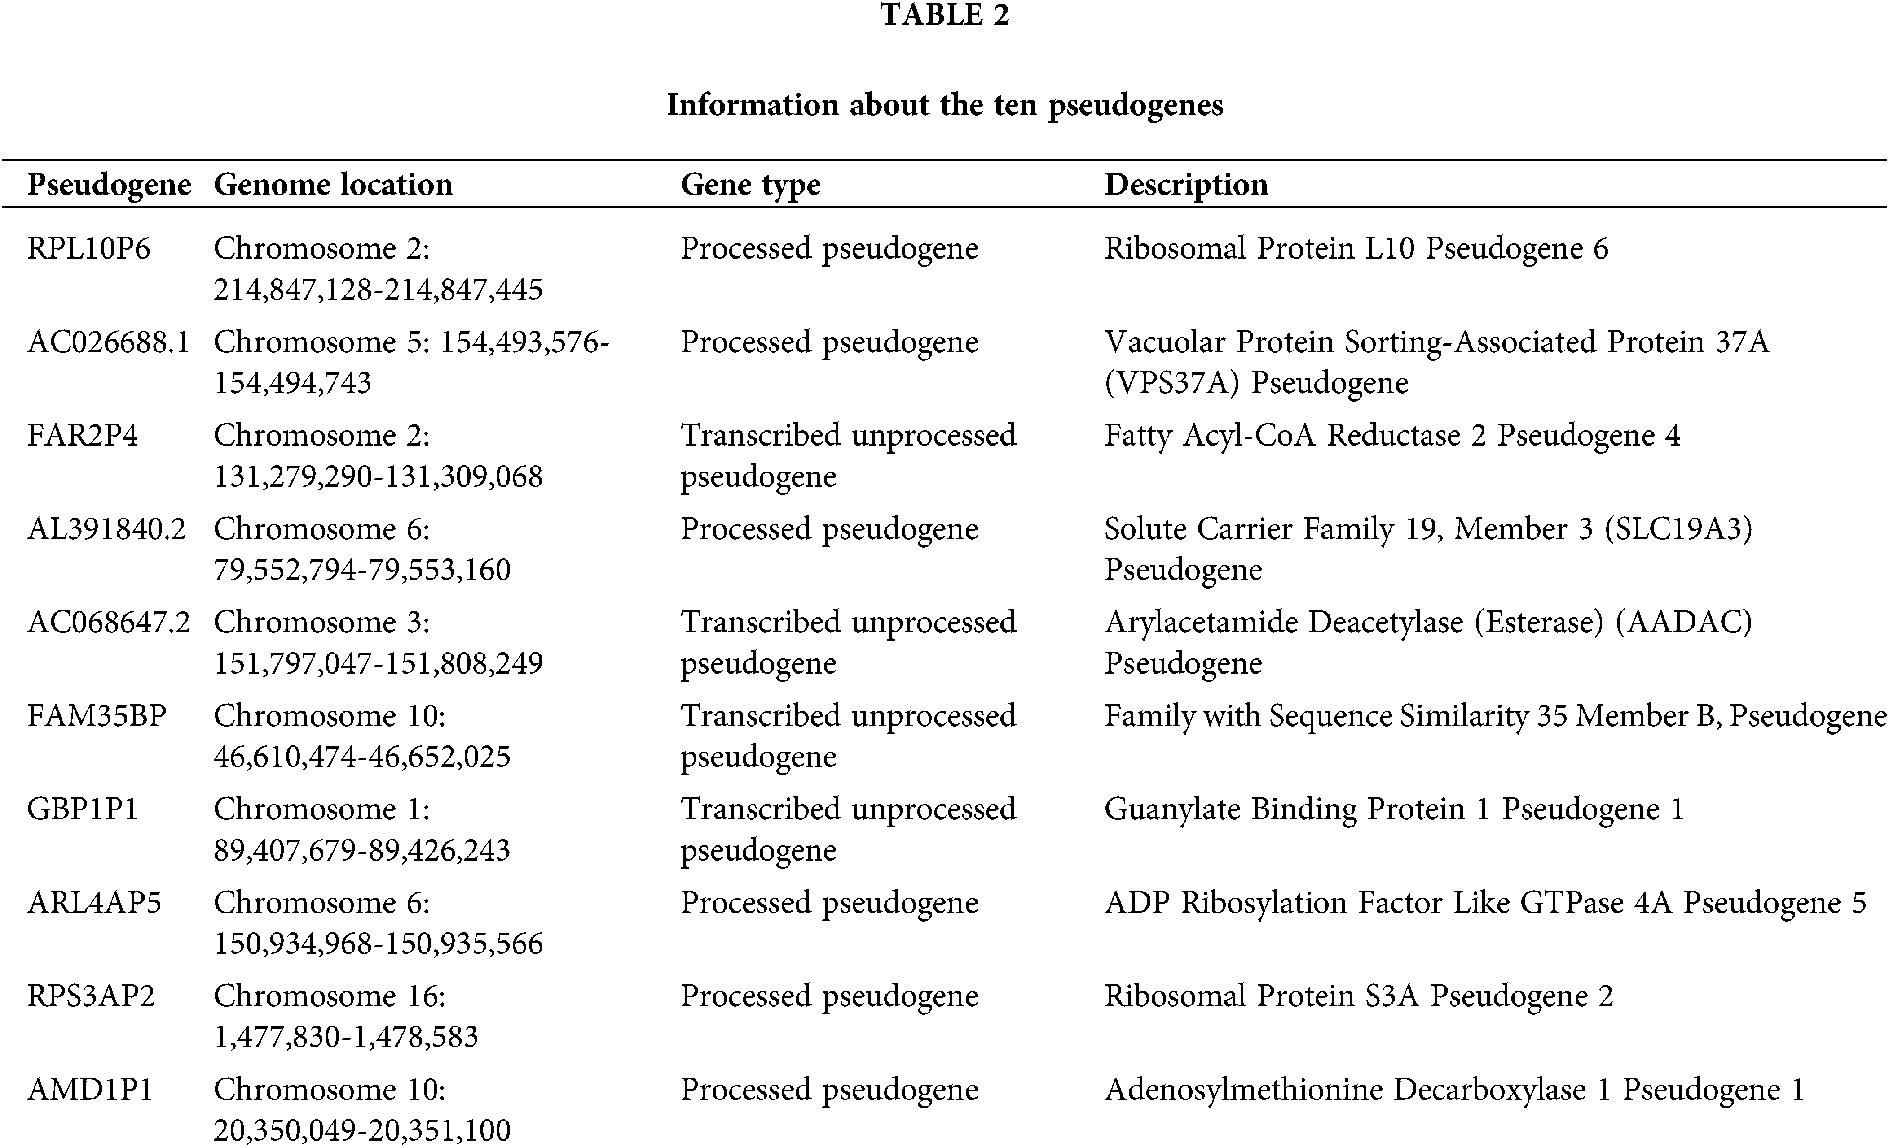
A total of 6113 pseudogenes were identified from the TCGA database with the criterion that pseudogenes with a missing rate ≥50% was excluded. 44 survival-associated pseudogenes with P-value <0.01 were found according to the univariate Cox regression analysis in the random cohort (Fig. 1A). To select appropriate parameters for constructing a predictive signature, LASSO regression with 10-fold cross validation was executed, and 22 pseudogenes were chosen (Figs. 1B and 1C). After filtration by stepwise Cox regression analysis 10 pseudogenes including RPL10P6, AC026688.1, FAR2P4, AL391840.2, AC068647.2, FAM35BP, GBP1P1, ARL4AP5, RPS3AP2 and AMD1P1 were finally determined in the signature. Information about the 10 pseudogenes was obtained through the GENCODE database (https://www.gencodegenes.org/) and is presented in Table 2. Among these survival relevant pseudogenes, as shown in Fig. 1D, RPL10P6, AC026688.1, FAR2P4, FAM35BP, ARL4AP5 and AMD1P1 acted as risk factors for ovarian cancer prognosis (HR > 1), and AL391840.2, AC068647.2, GBP1P1 and RPS3AP2 were served as protective factors with HR < 1.
Pseudogenes-based risk score model construction and assessment
A prognostic risk score formula for ovarian cancer was established based on Cox stepwise regression model. Risk score = (RPL10P6 × 0.138) + (AC026688.1 × 0.380) + (FAR2P4 × 0.113) + (AL391840.2 × −0.267) + (AC068647.2 × −0.162) + (FAM35BP × 0.272) + (GBP1P1 × −0.186) + (ARL4AP5 × 0.219) + (RPS3AP2 × −0.292) + (AMD1P1 × 0.264). The risk score for each patient was then calculated according to the formula. Univariate and multivariate Cox regression analyses were performed to evaluate the prognostic value of the risk score, and the results presented in Fig. 2A proved that the risk score served as an independent prognostic indicator for ovarian cancer (HR = 2.779, 95% confidence interval [CI] = 2.263–3.413, P < 0.001; HR = 2.512, 95% CI = 2.03–3.11, P < 0.001; respectively). The patients were separated into a high-risk group and a low-risk group based on the median risk scores. The Kaplan–Meier (KM) curve suggested that the patients with high-risk scores exhibited worse overall survival (OS) than those in the low-risk group (median survival time [MST]: 31.6 months vs. 67.6 months, P < 0.001; Fig. 2B). The ROC curve was used to evaluate the prediction efficacy of the risk score in ovarian cancer survival. We found that the AUCs (area under the ROC curve) of the risk signature for the survival probability at 1-year, 3-year, 5-year, and 10-year OS were 0.854, 0.824, 0.855 and 0.805 (Fig. 2C), respectively. As presented in Fig. 2D, with the increase of risk scores, the number of patient deaths ascended; the expression level of AC026688.1, FAR2P4, FAM35BP, AMD1P1, RPL10P6, and ARL4AP5 were upregulated, whereas the expressions of AL391840.2, AC068647.2, GBP1P1 and RPS3AP2 decreased. In addition, the 10-pseudogenes-based prognostic signature were further to validate its prediction performance in the total cohort. Similarly, as shown in Fig. 3, the gene signature remained to be a valuable prognostic factor for patients with ovarian cancer after adjusting for other clinical characteristics (HR = 1.71, 95% CI = 1.472–1.988, P < 0.001). The patients with high-risk score have a shorter MST than those with low-risk score in the validation set (36.1 vs. 60.0 months, P < 0.001). The AUC value of survival at 1-year, 3-year, 5-year, and 10-year was found to be 0.679, 0.697, 0.739 and 0.790, respectively. Additionally, in agreement with the results in the random cohort, the expression level of AL391840.2, AC068647.2, GBP1P1 and RPS3AP2 were downregulated, and other genes were upregulated with an increase in risk scores. Correspondingly, the number of patient deaths increased. These findings suggested that the risk signature based on 10-pseudogenes had outstanding ability to predict the prognosis of ovarian cancer.
Construction of the nomogram and its effectiveness evaluation
To visualize the survival prediction application, a nomogram integrating the risk score and clinical characteristics including age, grade and stage was constructed for forecasting 1-, 3- , 5- and 10-year OS rates. As assumed in Fig. 4A, the points of the factors indicate their corresponding contribution to the survival probability, and the total score could be calculated according to the nomogram to estimate 1-year, 3-year, 5-year, and 10-year OS for ovarian cancer patients. Compared to the clinical properties, the risk signature exhibited superior predictive performance in the nomogram. The primary and internally validated C-indices for the nomogram were 0.759 and 0.680, respectively. The AUCs of the 1-year, 3-year, 5-year and 10-year OS of the nomogram in the random set were 0.857, 0.819, 0.849 and 0.781, and in the internal validation cohort were 0.731, 0.710, 0.719 and 0.741, respectively (Fig. 4B). The calibration curve was applied to evaluate the predictive power of the nomogram for cancer outcomes, and it showed good agreements at 3-year and 5-year between the predicted OS and actual OS of patients with ovarian cancer in the random cohort, and in the total cohort (Fig. 4C). Finally, DCA was applied to render the clinical validity to the nomograms. As shown in Figs. 4C–4E, the 10-pseudogenes signature-based nomogram dramatically outperformed the default strategies of treat-all-patients scheme or the treat- none scheme with the threshold probabilities ranging from 12 to 84% at 3-year OS, 17 to 100% at 5-year OS in the random cohort (Fig. 4D), and 20 to 90% at 3-year OS, 48 to 88% at 5-year OS in the total cohort (Fig. 4E).
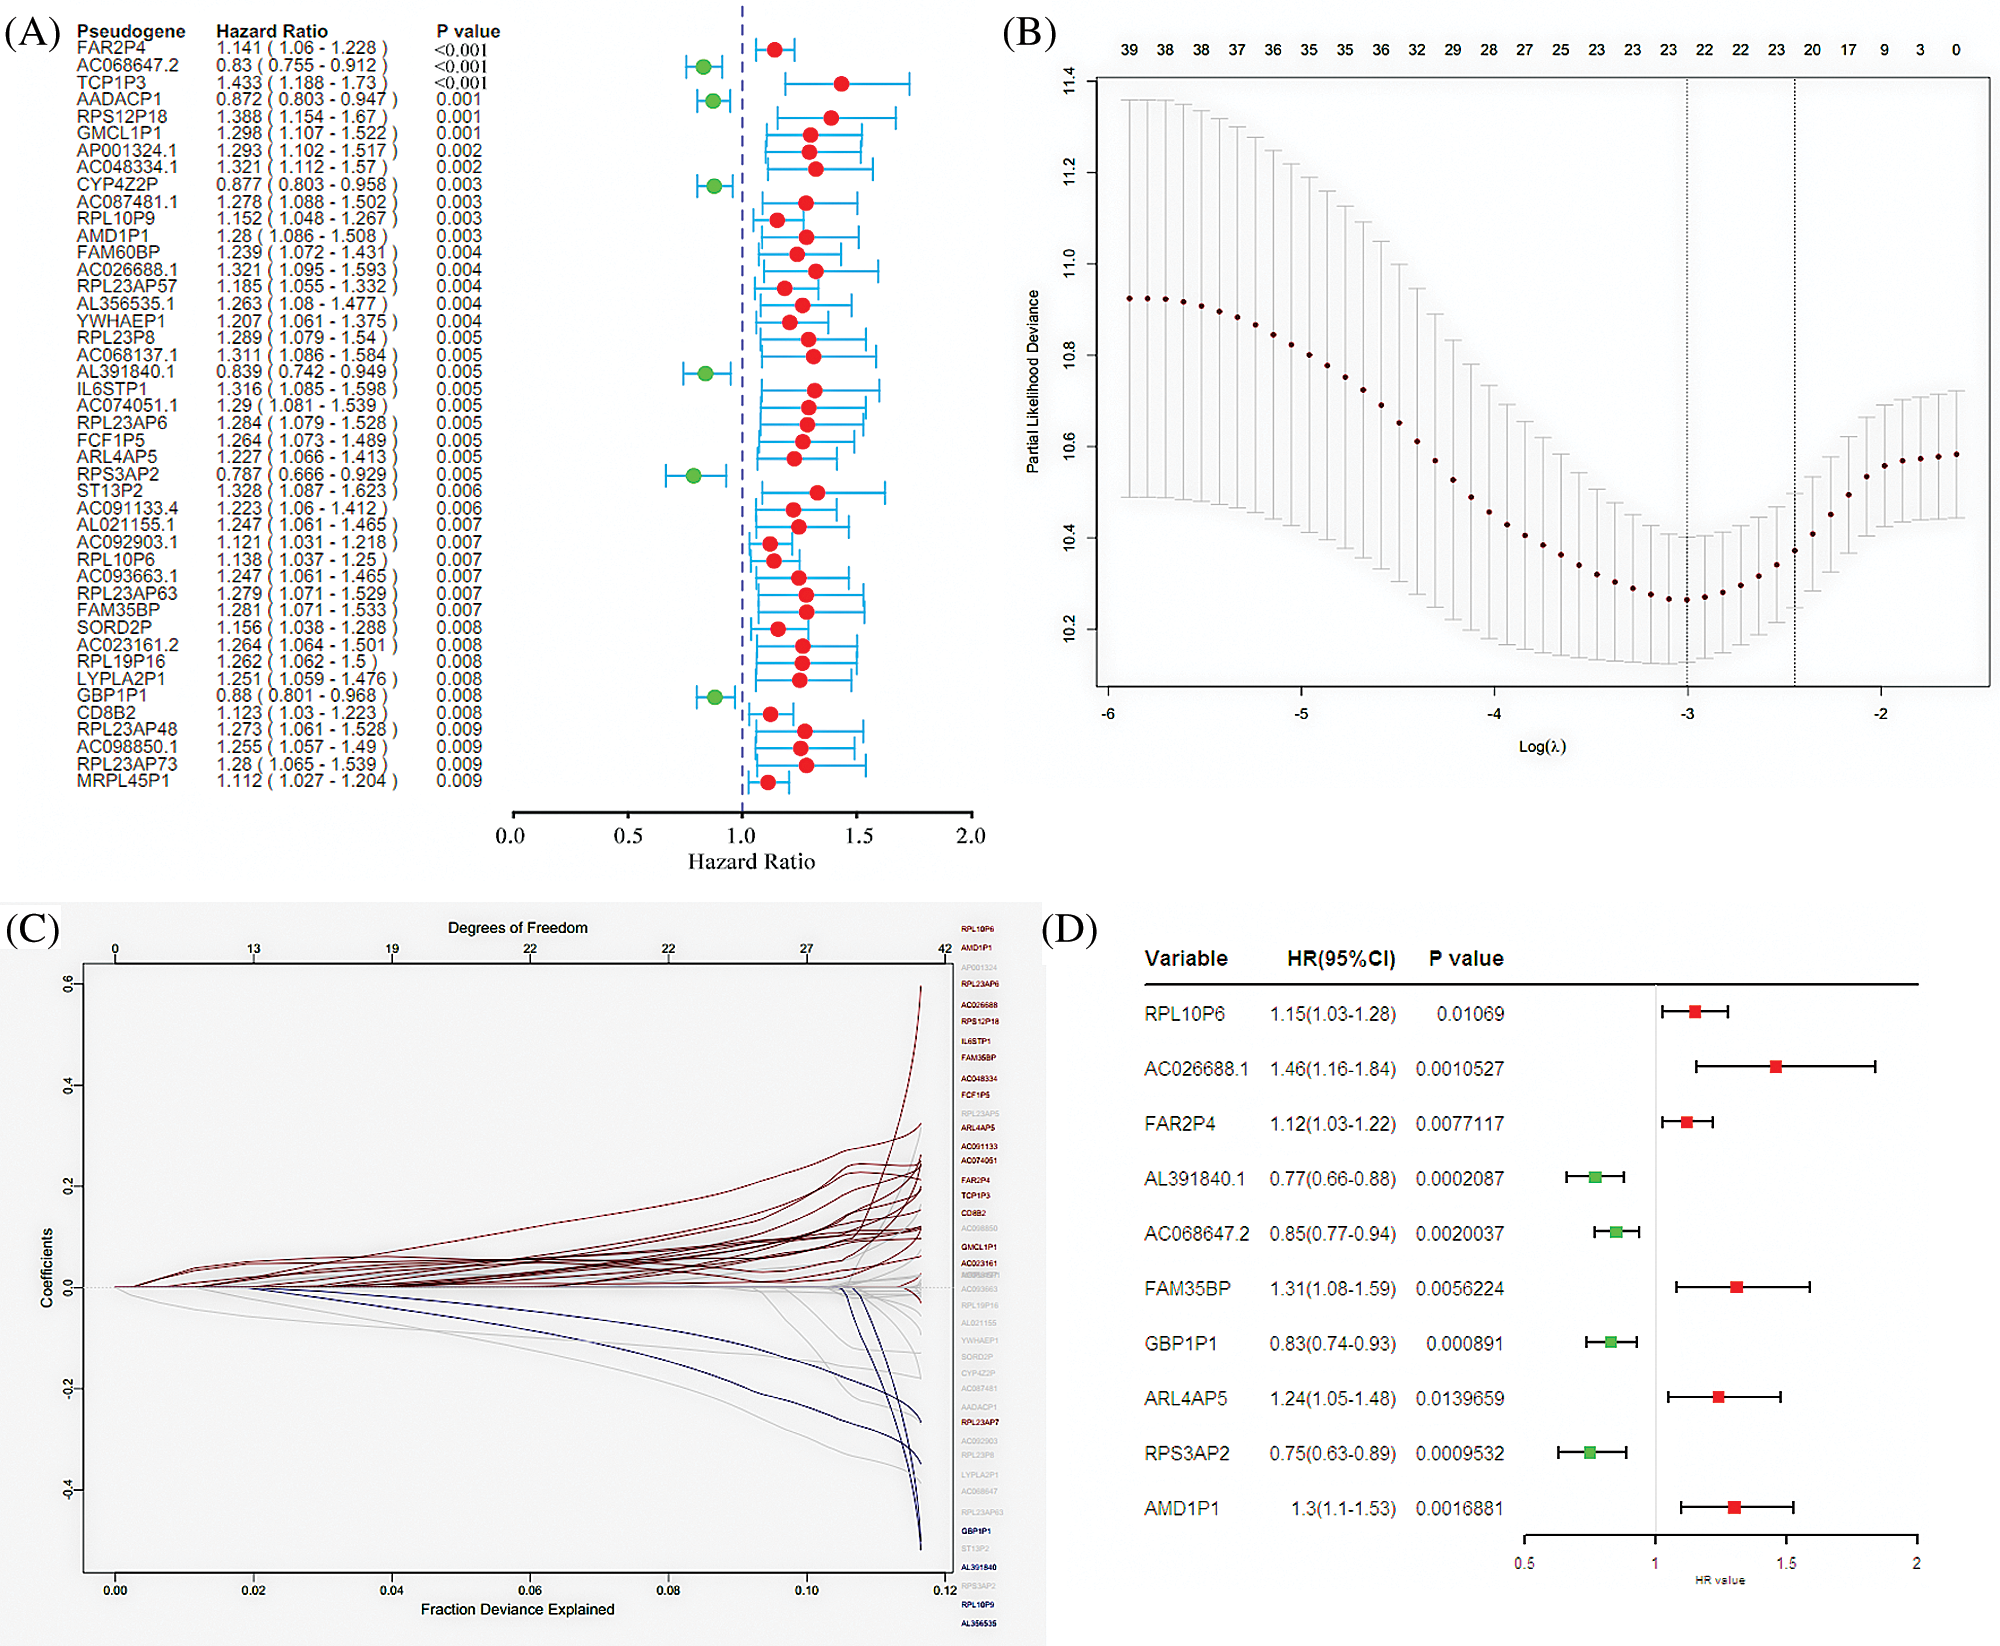
Figure 1: Screening pseudogenes used for constructing the risk signature for ovarian cancer. (A) Univariate Cox regression analysis in the random cohort, in which the pseudogenes were significantly associated with ovarian cancer prognosis (P < 0.05). The red circle indicates an unfavorable role (HR > 1) of pseudogenes on ovarian cancer prognosis, and green circle represents a beneficial role (HR < 1) of pseudogenes on cancer prognosis. (B) The most appropriate log (Lambda) value in the LASSO model. (C) The selected 22 pseudogenes in LASSO model. (D) Multivariate Cox regression analysis was performed and 10 pseudogenes (RPL10P6, AC026688.1, FAR2P4, AL391840.2, AC068647.2, FAM35BP, GBP1P1, ARL4AP5, RPS3AP2 and AMD1P1) were selected to construct the risk signature.
GO and KEGG pathway enrichment analysis of pseudogenes-based risk signature
Considering that pseudogenes might plays biological actions via regulating coding genes in the cancer progression, we used the Pearson correlation analyses to establish the pseudogene-mRNA regulatory networks under the criteria that |r| ≥ 0.5 means effective associations among them. Specifically, the networks between 5 pseudogenes and 533 mRNAs were ultimately constructed by using cancer samples (Fig. 5). To investigate the biological function of pseudogenes, GO and KEGG pathway enrichment analyses of the targeted mRNAs were performed using the R clusterProfiler package. Through GO analysis displayed in Figs. 6A–6C, it was found that pseudogene-related protein-coding genes were highly enriched in T cell activation, response to interferon-gamma, regulation of lymphocyte activation, MHC protein complex, immune receptor activity, cytokine receptor activity and other immune-related functions. Also, as shown in Fig. 6D, KEGG pathway enrichment analysis revealed that downstream genes of these enrolled pseudogenes were significantly enriched in multiple pathways, including antigen processing and presentation, allograft rejection, cell adhesion molecules, graft-versus-host disease, type I diabetes mellitus, autoimmune thyroid disease, virus infection and so on. These results suggested that the selected pseudogenes may be involved in cellular immune function.
The risk score was associated with immune cell infiltration
The immune destruction has been recognized as an emerging hallmark of cancer and is closely related with the cancer prognosis. Evidence indicates that there were abundant inflammatory cells infiltrated in ovarian cancer, not only around the tumor but also in the tumor matrix, and the extraordinary tumor-immune microenvironment might affect the efficiency of treatment with chemotherapy (Jimenez-Sanchez et al., 2020). To further explored the associations of the pseudogenes-based risk signature with cellular immune function, ssGSEA algorithm and ESTIMATE method were employed to assess the relative immune cell infiltration of each cancer sample. As it can be seen from Fig. 7A, there was a distinct difference in the infiltration of immune cells between the high-risk group and the low-risk group.
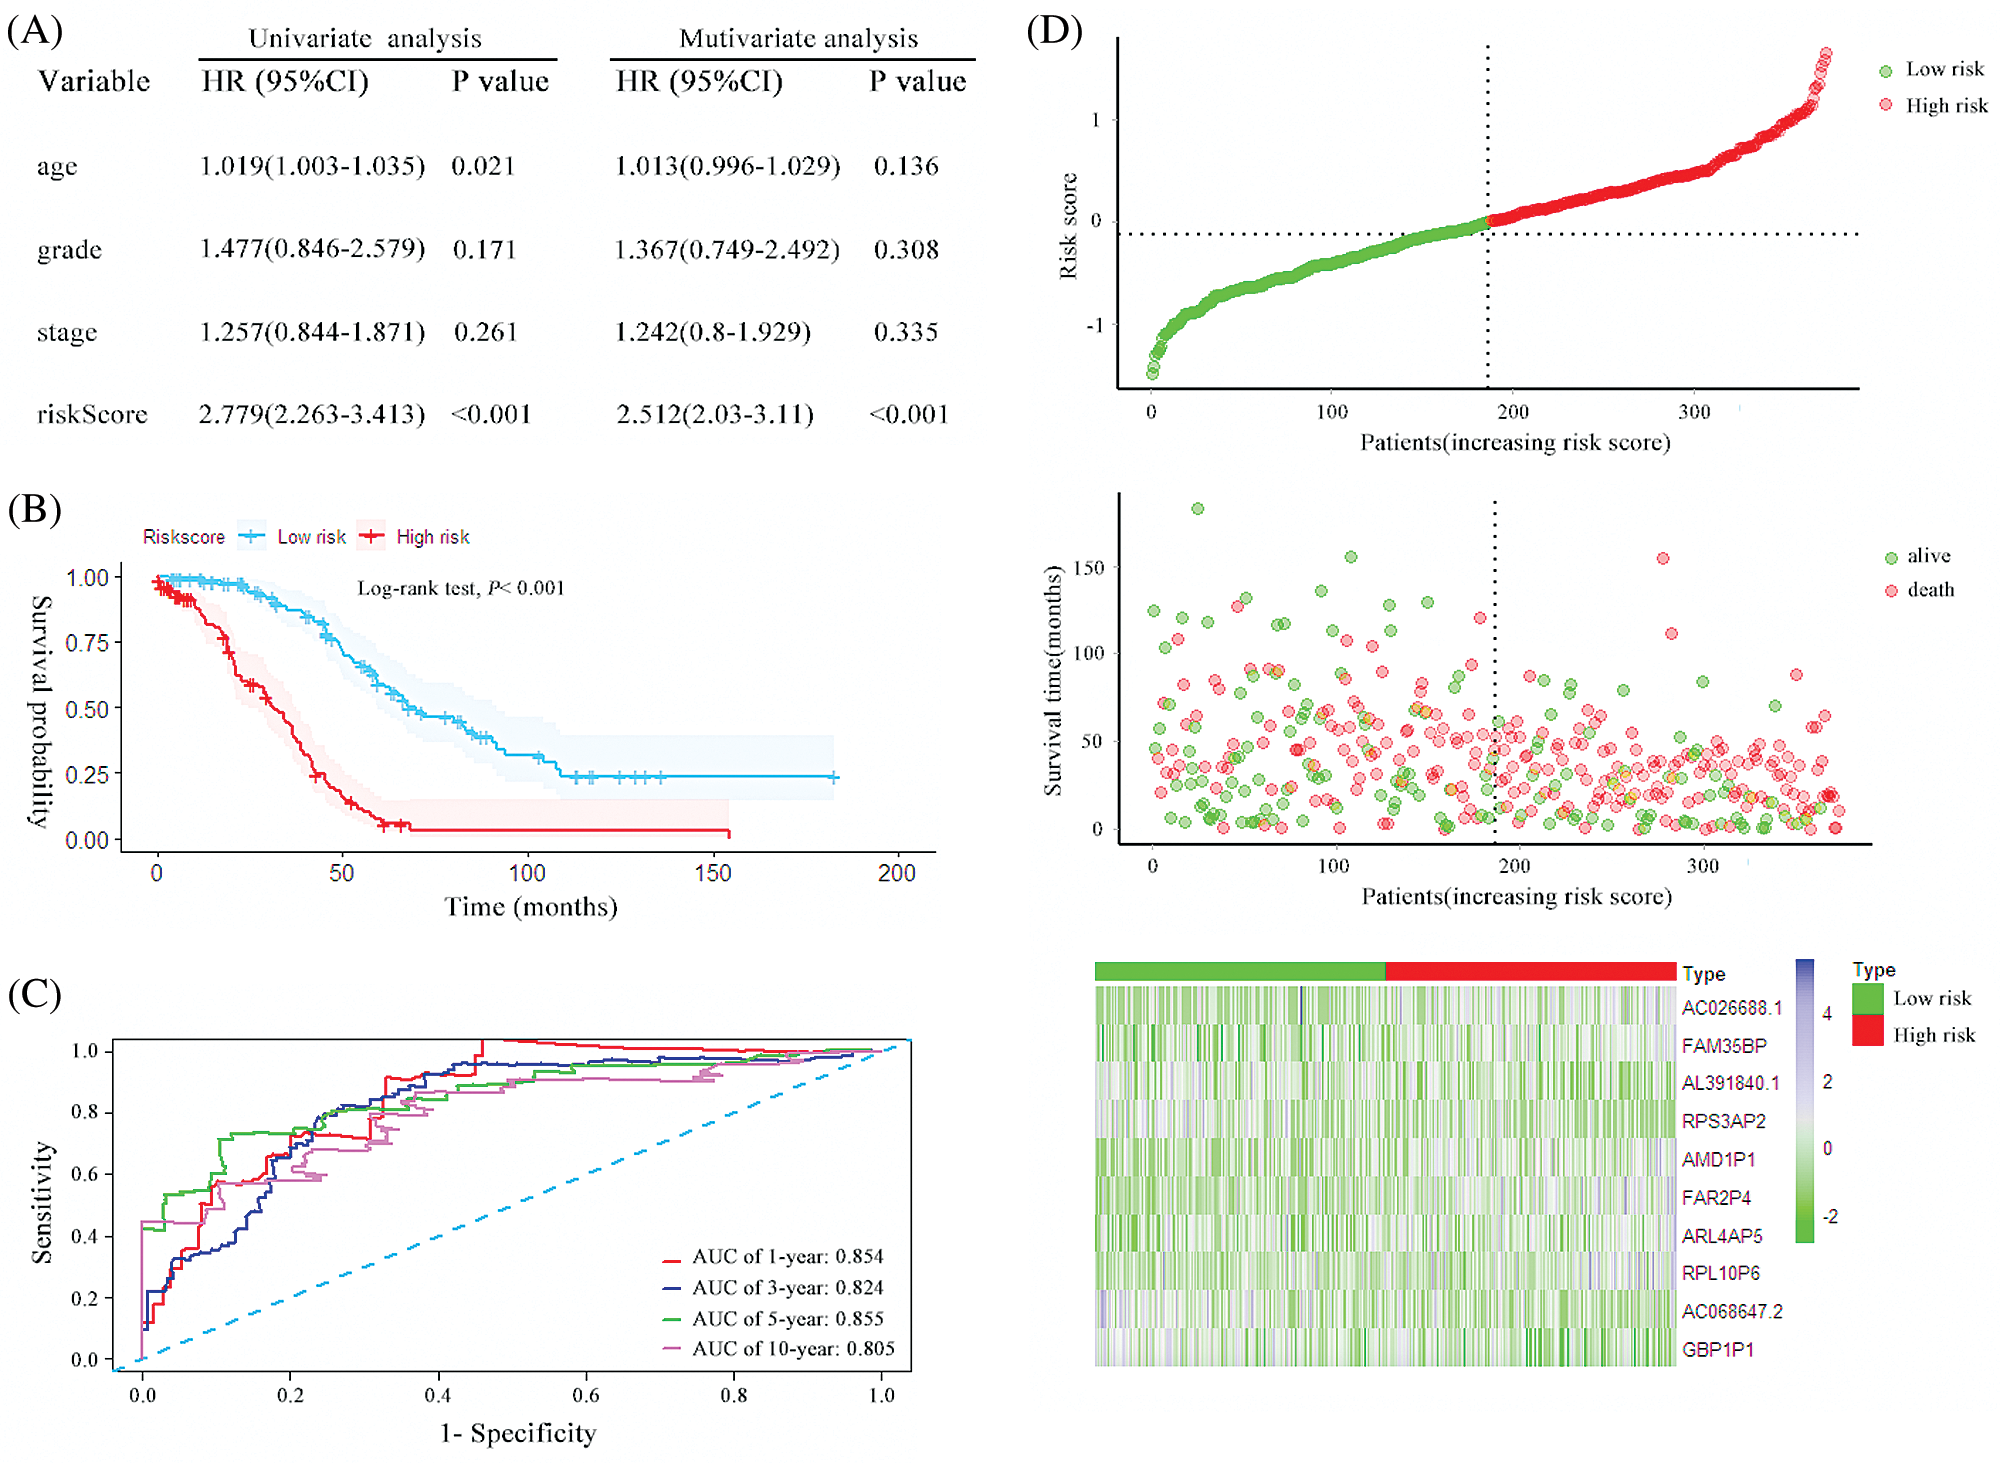
Figure 2: The characteristics of the 10 pseudogenes-based signature and assessment in the random cohort. (A) Univariate and multivariate analysis of the risk signature and clinical factors in the random cohort. (B) Survival curves for high-risk and low-risk groups classified by the risk signature in the random cohort. (C) ROC curves for the 1-, 3-, 5- and 10-year survival according to the 10-pseudogene risk signature in the random cohort. (D) The risk score distributions, patient survival and expression profiles of the 10 pseudogenes in the random cohort.
Correlation analysis between 28 immune cells assessed by the ssGSEA approach and risk scores prompted that 22 types of immune cells were significantly negatively correlated with risk score (Fig. 7B). Additionally, after ESTIMATE algorithm was processed, the risk score was found to be negatively correlated with immune score and ESTIMATE score, and it was positively correlated with tumor purity (Fig. 7C). Compared with the low-risk group, the high-risk group had lower tumor purity but higher ESTIMATE scores and stromal scores (Fig. 7D). As the evidence above indicates, the risk signature was observably related to the immune status of ovarian cancer, and high-risk scores were associated with decreased tumor purity and enhancive stromal composition in ovarian cancer cell.
Ovarian cancer is a fatal gynecological malignancy with a high mortality rate (Siegel et al., 2020). In recent years, with the evidence accumulating, pseudogenes have been proved to exert critical roles in diverse physiological and pathological processes, which reflected that the pseudogenes may serve as a promising biomarker to illuminate the underlying mechanisms of oncogenesis and disease development (Lu et al., 2015). In the present study, we found that a risk signature including 10 pseudogenes (RPL10P6, AC026688.1, FAR2P4, AL391840.2, AC068647.2, FAM35BP, GBP1P1, ARL4AP5, RPS3AP2, and AMD1P1) was significantly associated with the prognosis of ovarian cancer patients. Among the survival-related pseudogenes, RPL10P6, AC026688.1, FAR2P4, FAM35BP, ARL4AP5 and AMD1P1 had detrimental effects on ovarian cancer prognosis. Conversely, AL391840.2, AC068647.2, GBP1P1 and RPS3AP2 played profitable roles on cancer survival. When integrated with clinical characteristics such as age, grade and stage, the composite clinical and pseudogenes-based signature showed improved prognostic accuracy in all data sets. Bioinformatic analysis indicated that the pseudogenes-based risk score was associated with the infiltration of immune cell subtypes and might influences the progression and prognosis of ovarian cancer though participating in immune-related signaling pathways.
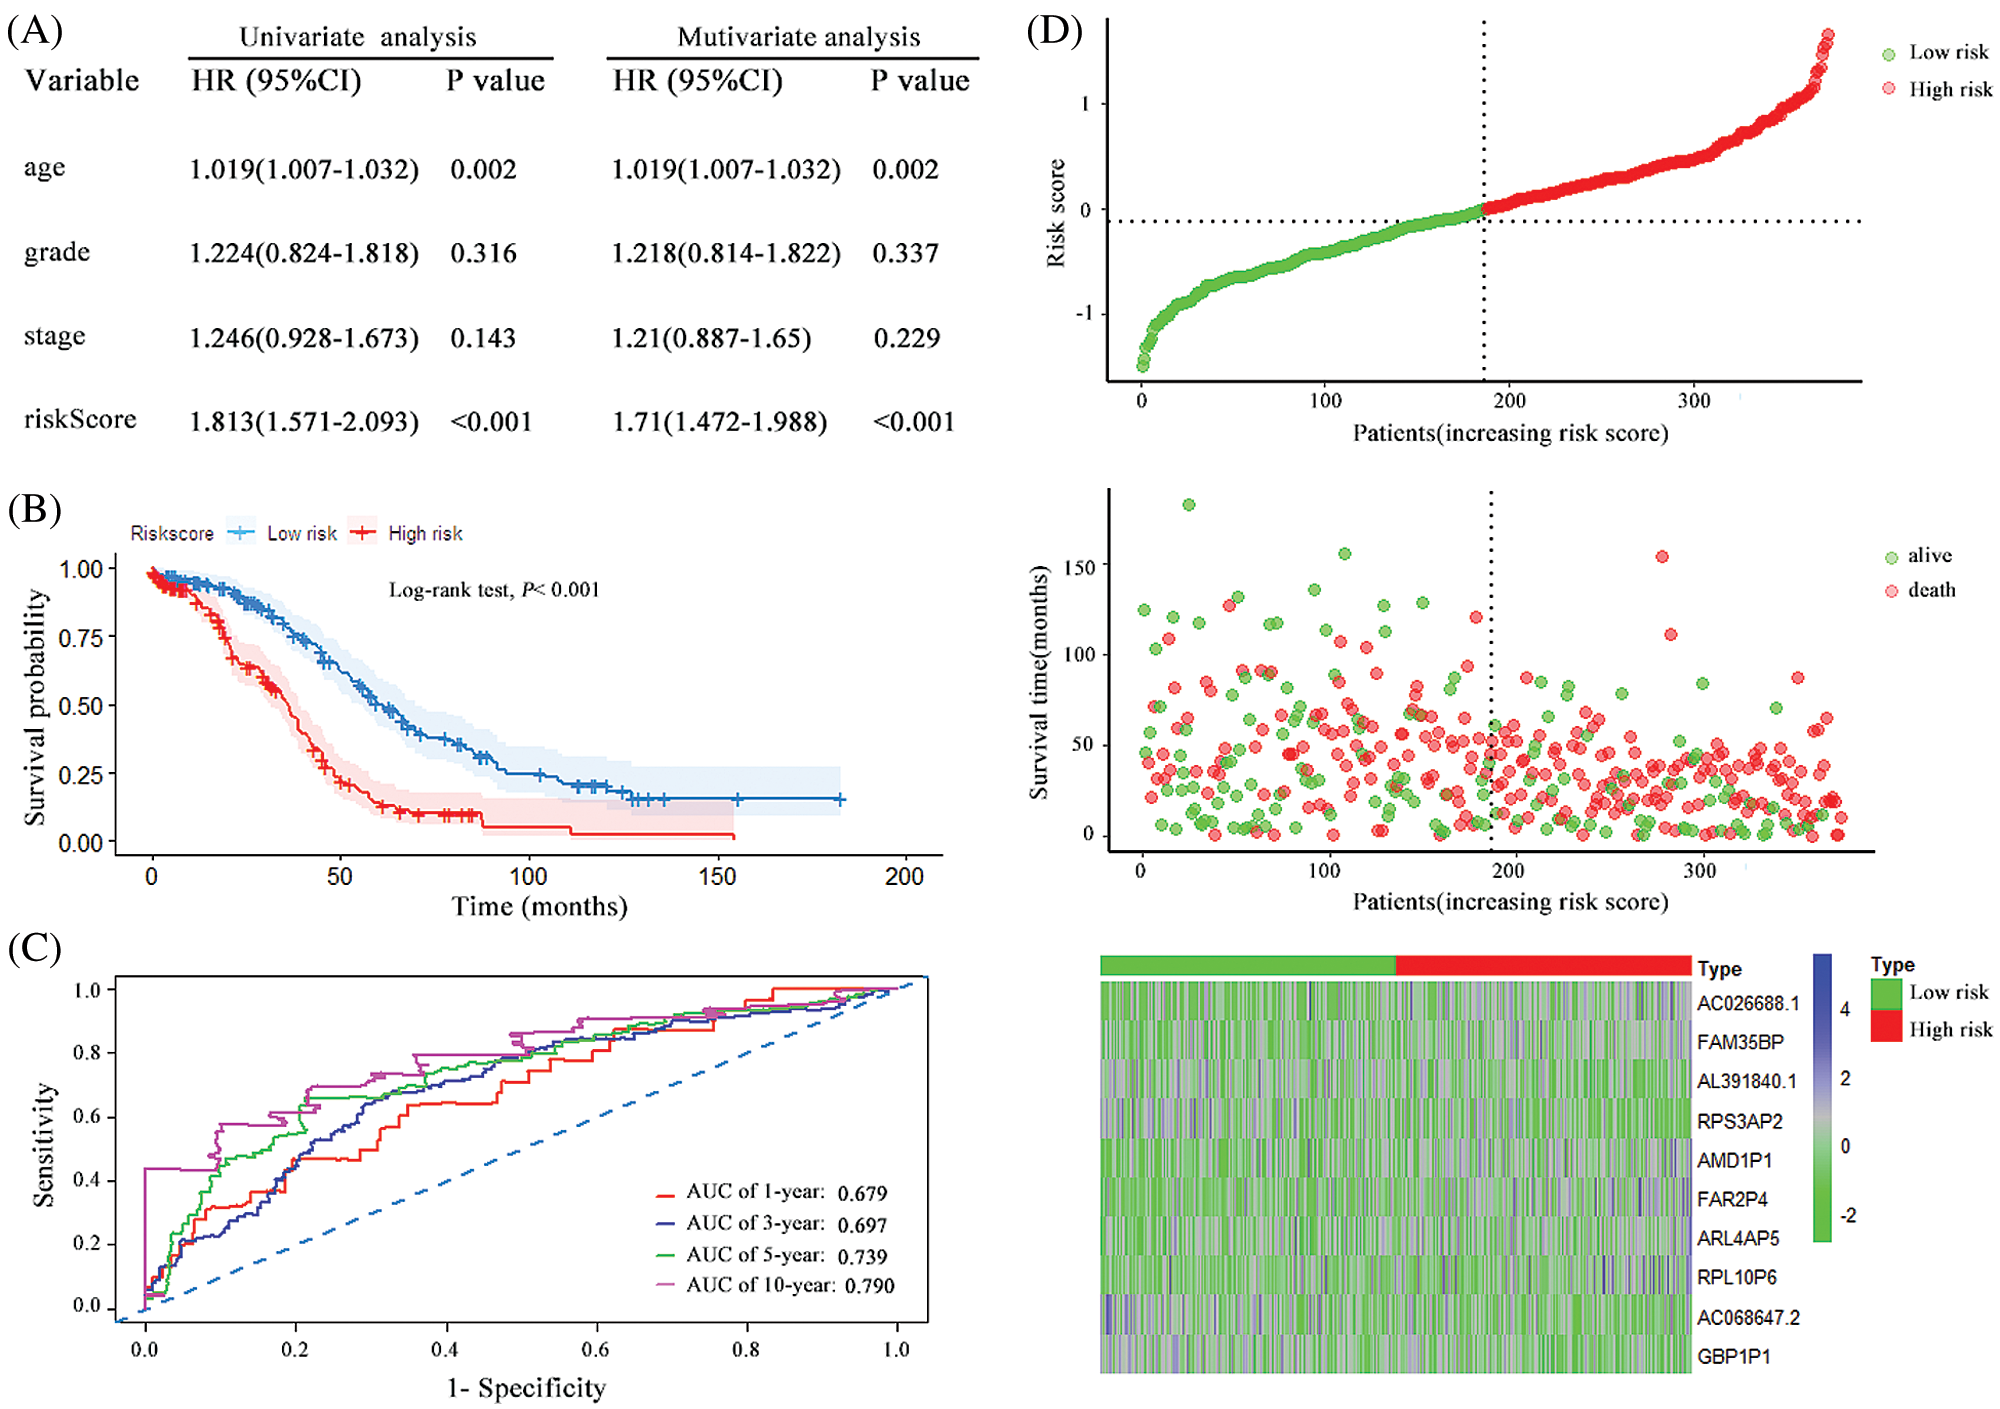
Figure 3: The characteristics of the 10 pseudogenes-based signature and assessment in the total cohort. (A) Univariate and multivariate analysis of the risk signature and clinical factors in the total cohort. (B) Survival curves for high-risk and low-risk groups classified by the risk signature in the total cohort. (C) ROC curves for the 1-, 3-, 5- and 10-year survival according to the 10-pseudogene risk signature in the total cohort. (D) The risk score distributions, patient survival and expression profiles of the 10 pseudogenes in the total cohort.
With the widespread application of high-throughput technologies in cancer research, unprecedented large-scale tumor data have generated and accumulated in the international public database such as TCGA, Gene Expression Omnibus and Oncomine databases. Using the multi-group sequencing data, researchers have built gene expression profile-based signatures for prognostic prediction in patients with ovarian cancer (An et al., 2018; Zheng et al., 2020). Nevertheless, previous studies aiming to construct a prognostic model have focused on mRNAs and ncRNAs, neglecting pseudogenes as potential biomarkers in ovarian cancer. Increasing evidence has demonstrated that pseudogenes are key members of the noncoding transcripts from the genome, and alteration of their expressions provides clues for remarkable biomarkers in pathogenesis and progression of multiple diseases, including malignancy (Poliseno et al., 2015). For instance, pseudogene PTTG3P promote breast cancer progression through modulation of cell cycle-associated processes and induce a poor prognosis (Lou et al., 2019a). The low expression of pseudogene SLC6A10P was found to prolong the recurrence time of ovarian cancer by qPCR validation (Ganapathi et al., 2016). Six pseudogenes and eight lncRNAs were identified to potentially inhibit hsa-miR-363-3p-SPOCK2 axis in ovarian cancer, thereby promoting the occurrence of ovarian cancer (Lou et al., 2019b). Pseudogenes may provide new directions for prospective cancer diagnostics and treatment. In this study, we established a novel 10-pseudogene signature that could successfully classify patients with ovarian cancer into two groups with different OS. The Kaplan–Meier curves were applied to prove the prognostic role of the 10-pseudogenes risk signature in ovarian cancer, and the results declared that the patients with high-risk scores had a worse survival rate than patients in the low-risk group. Multivariate analyses demonstrated that the risk score may be a clinically independent prognostic predictor for ovarian cancer.
Furthermore, the prognostic model integrating with risk scores, age, grade, and stage presented excellent predictive performance indicated by the AUC values and calibration curve. These findings confirmed that the novel model could offer an accurate survival prediction for patients with ovarian cancer.
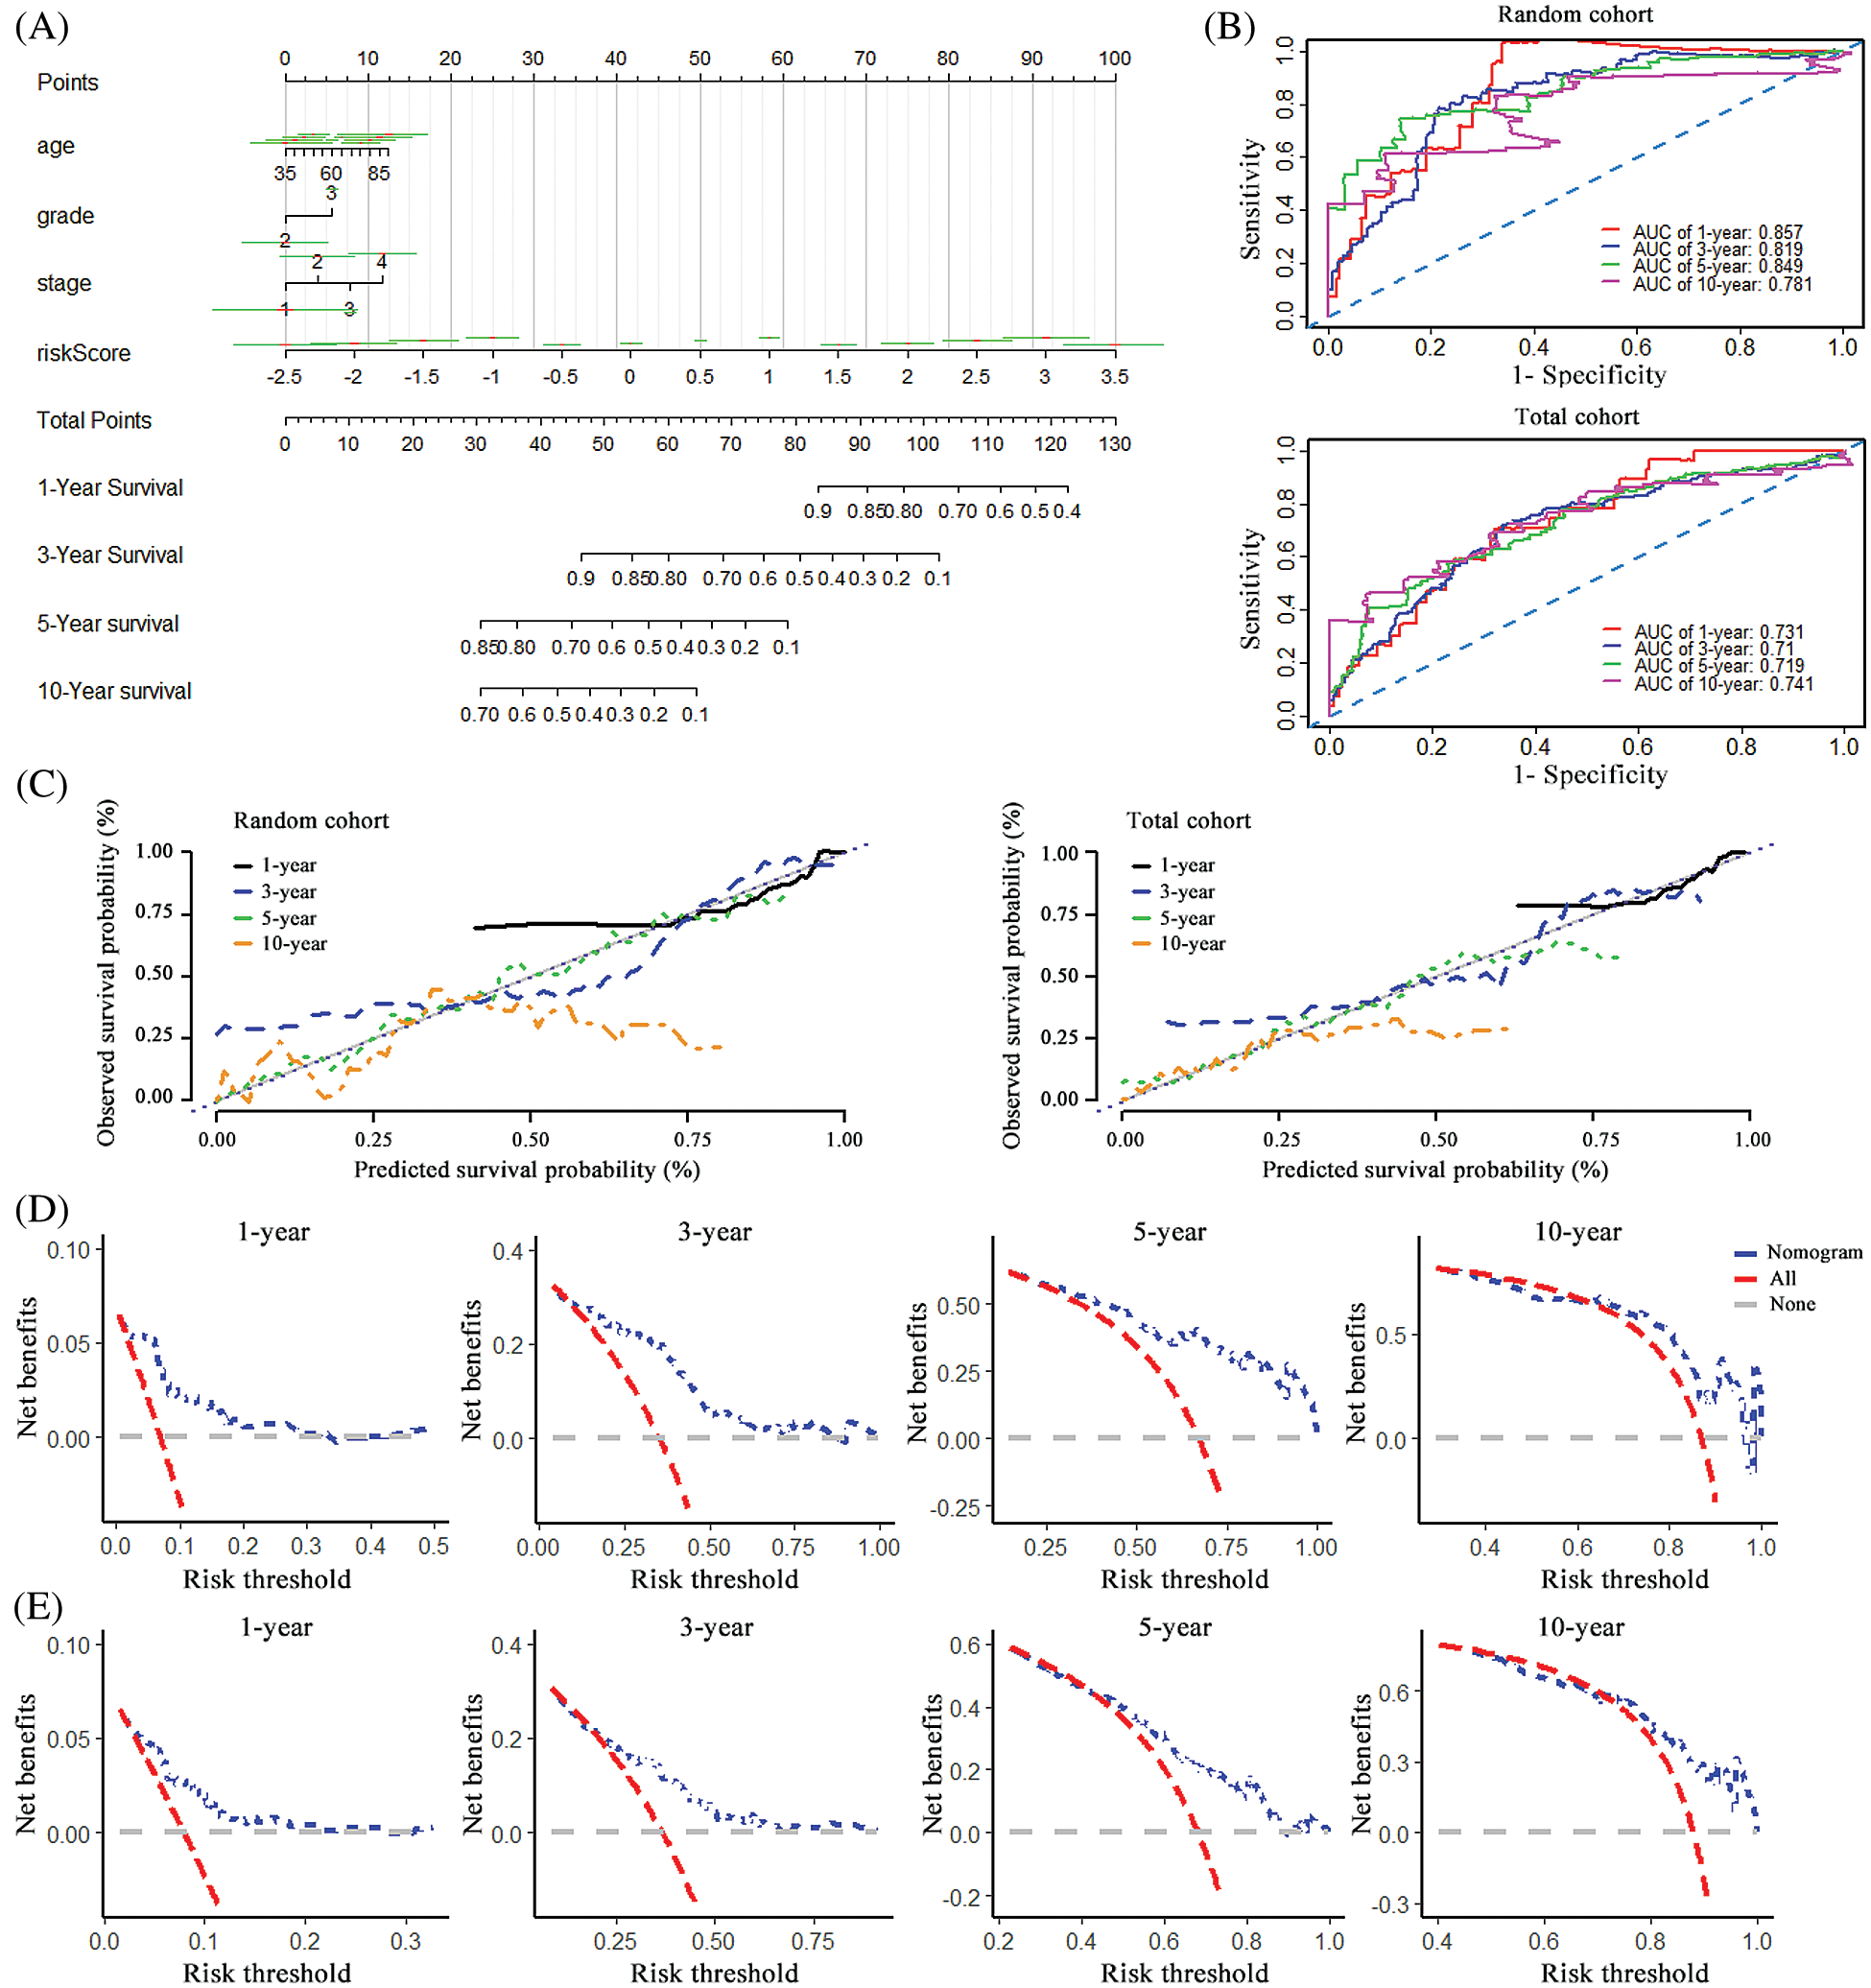
Figure 4: Construction of the nomogram and its effectiveness evaluation. (A) A nomogram was established based on the risk signature, age, grade, and stage for predicting survival of patient with ovarian cancer. (B) ROC curves for evaluating the efficiency of the nomogram in the random cohort and total cohort. (C) Calibration analysis of the 10 pseudogenes-based signature containing nomogram for 1-, 3-, 5- and 10-year overall survival in the random cohort and total cohort, respectively. (D) Decision curve analysis of the nomogram for the 1-, 3-, 5- and 10-year survival in the random cohort. (E) Decision curve analysis of the nomogram for the 1-, 3-, 5- and 10-year survival in the total cohort.
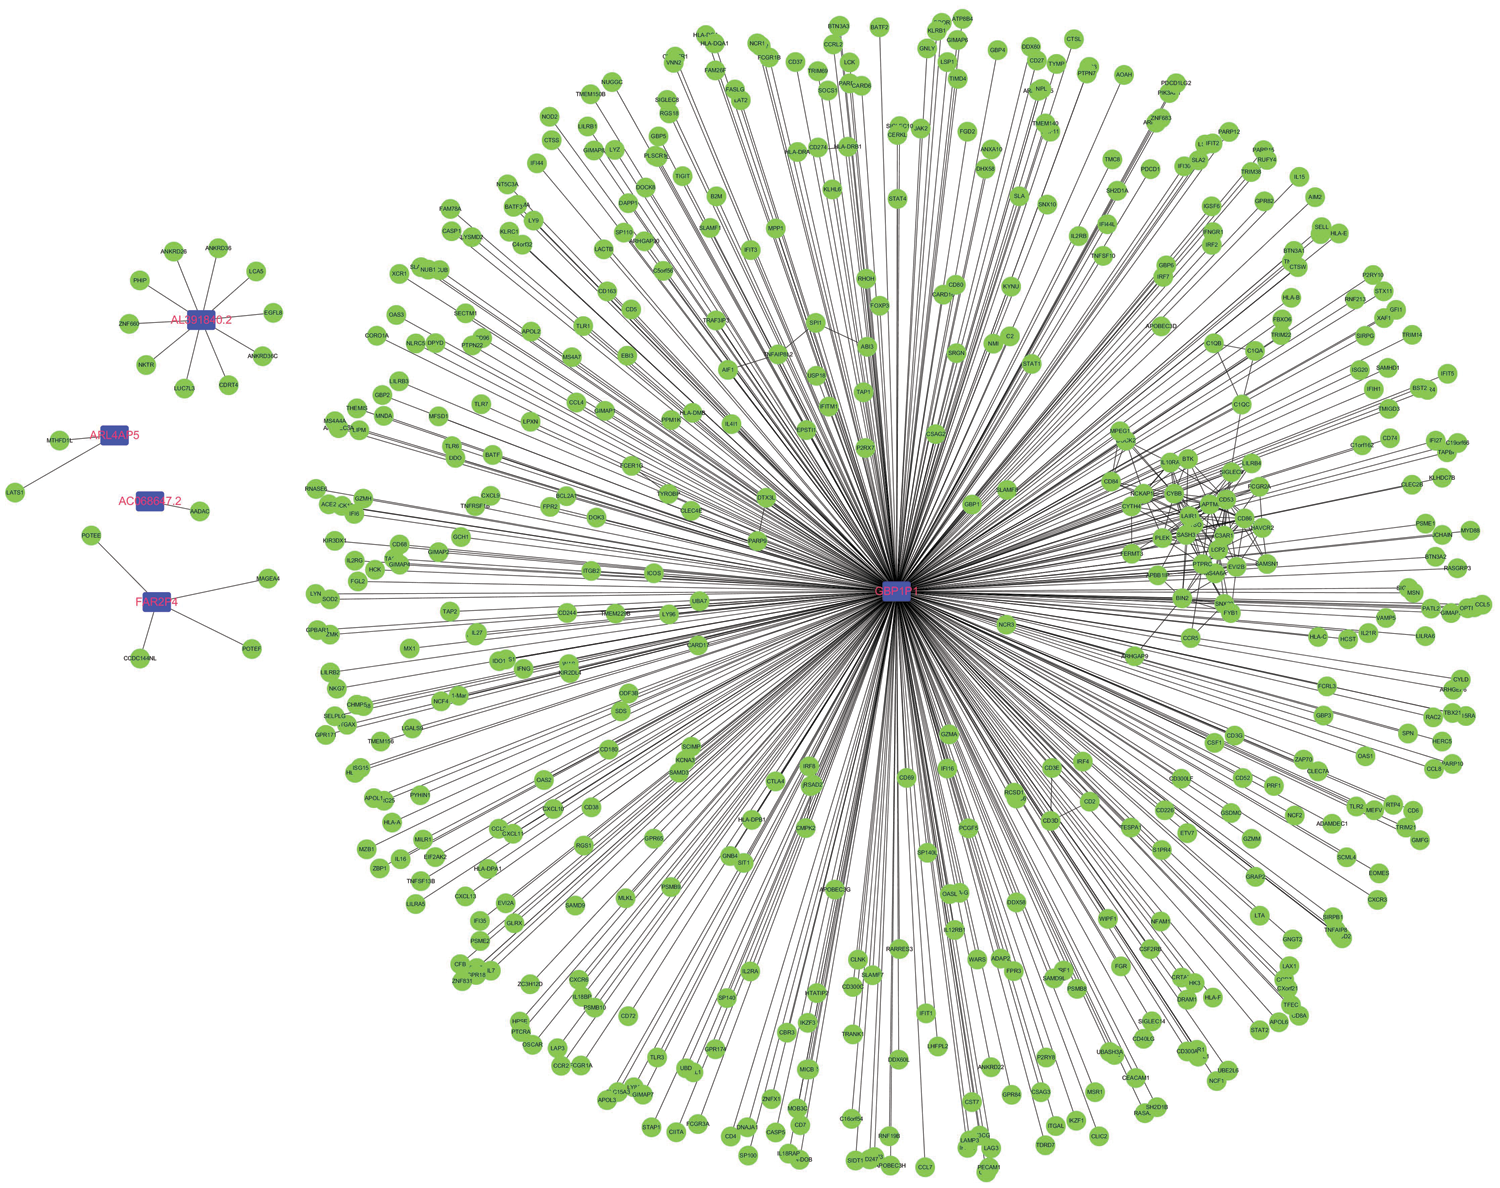
Figure 5: Construction of pseudogene-mRNA regulatory networks. The coding-genes related to the five pseudogenes with |r| ≥0.5 were used to construct the pseudogene-mRNA regulatory networks. Blue squares represented pseudogenes, which are located at the cores of the networks.
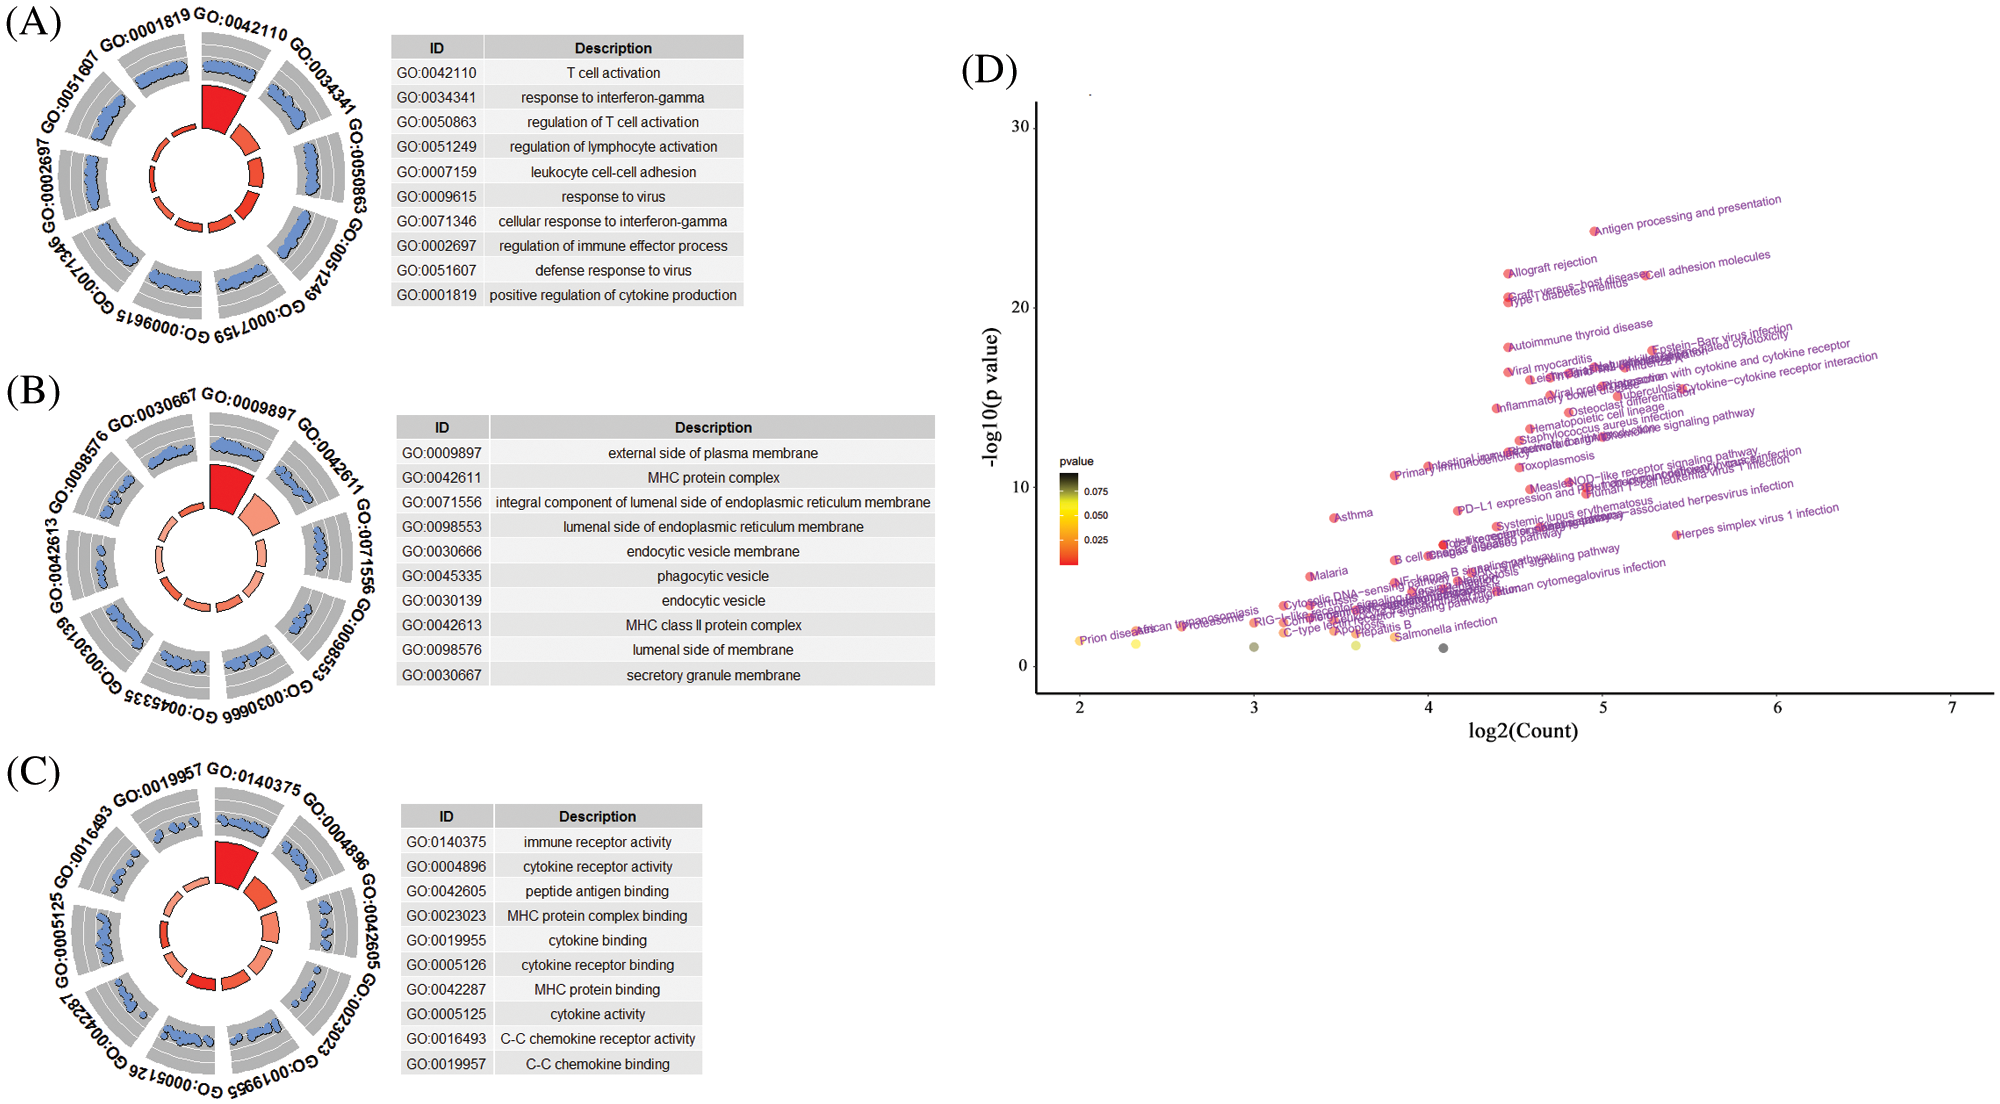
Figure 6: The functional roles of the 10-pseudogene risk signature. (A) Top 10 gene oncology terms in biological process. (B) Top 10 gene oncology terms in cellular component. (C) Top 10 gene oncology terms in molecular function. (D) The volcano plot of KEGG pathway analysis.
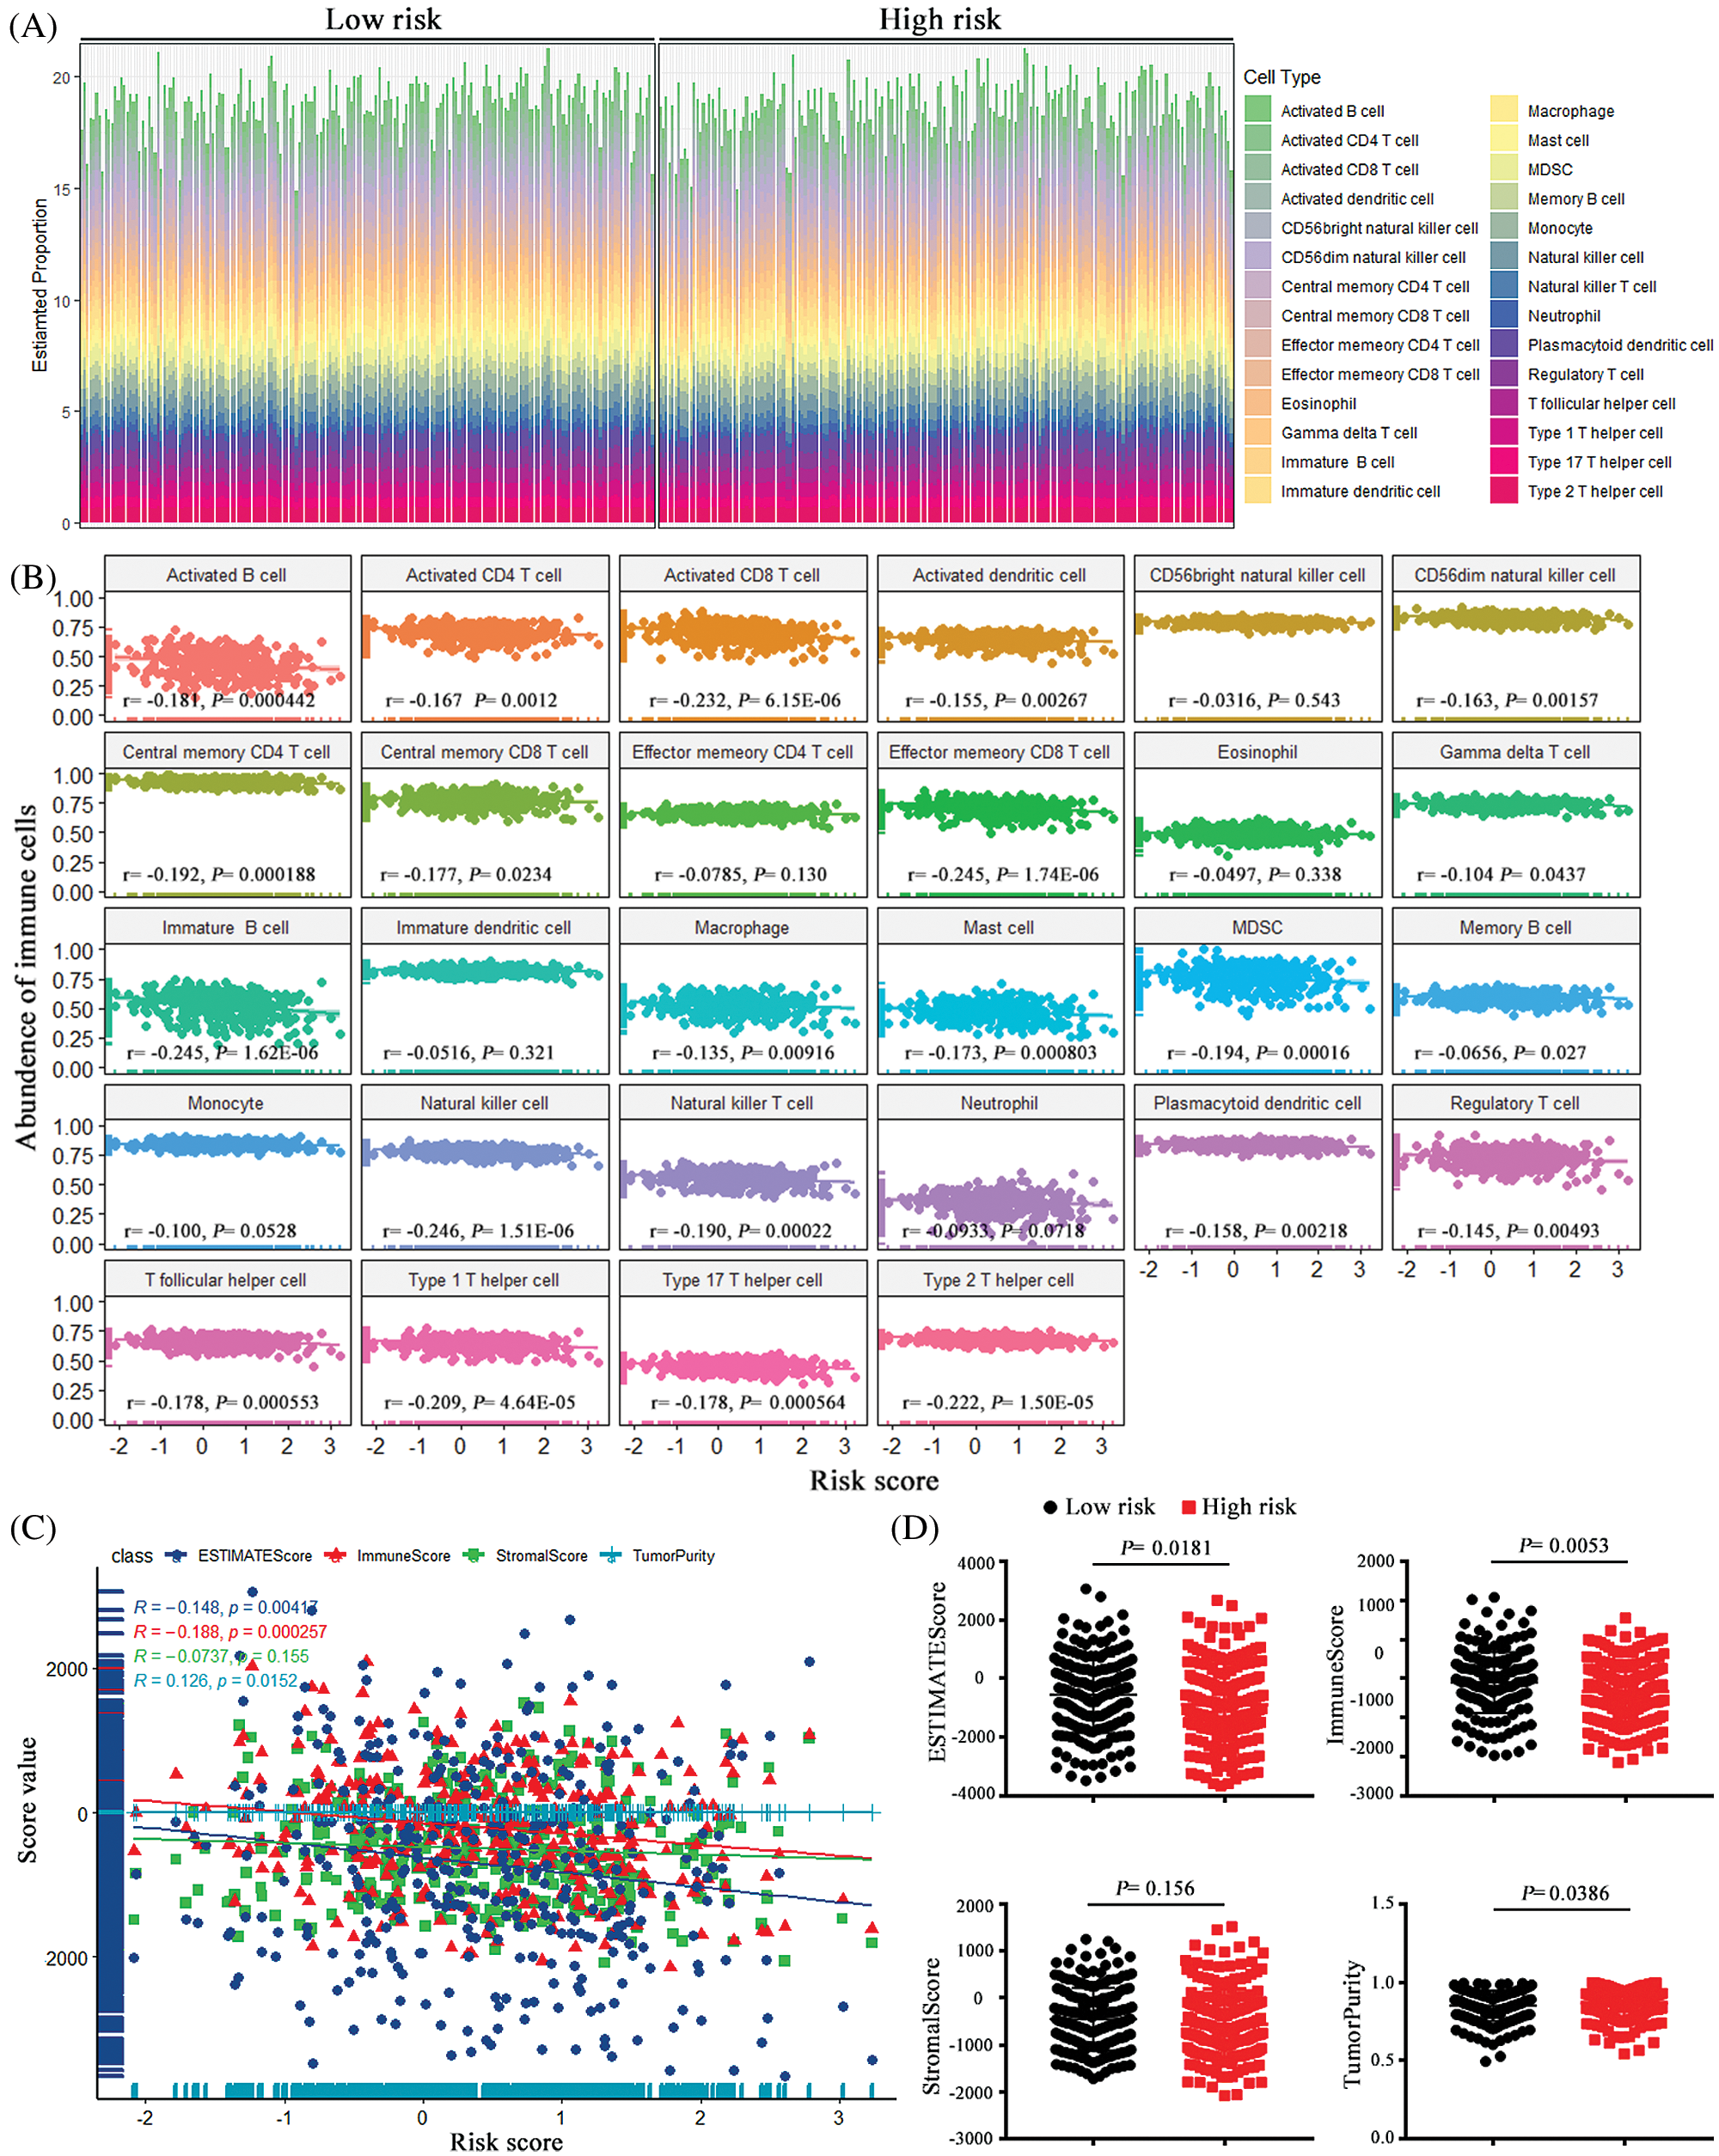
Figure 7: The associations between the risk score and tumor immune cell infiltration. (A) the proportion difference of each immune cell between the low-risk group and the high-risk group using the CIBERSORT method. (B) The correlations between the risk score and immune cell infiltration. (C) Using ESTIMATE’s algorithm, the ESTIMATE Score, the Immune Score, Stromal Score and Tumor Purity of each sample gene were quantified, and their associations with the risk signature. (D) The comparisons of the Immune Score, Stromal Score and Tumor Purity among risk groups.
Recent progresses have confirmed that pseudogenes have broad and multifaceted spectrum of activities in human cancers (Cheetham et al., 2020). Among the 10 prognostic related pseudogenes, GBP1P1 was reported to be overexpressed in endometriosis and cervical cancer (Roychowdhury et al., 2020; Wang et al., 2015). Another evidence shown that GBP1P1 was found to be down-expressed, and reduced GBP1P1 was significantly correlated with poor overall survival of hepatocellular carcinoma (Sui et al., 2018). In addition, GBP1P1 as an immune marker was upregulated in the latent tuberculosis infection-progression group (Perumal et al., 2020). However, for other nine pseudogenes, their underlying functional role in cancers remains unclear. Therefore, we tried to figure out the mechanisms of the enrolled pseudogenes in the tumorigenesis and progression of ovarian cancer via bioinformatics analysis. A pseudogene-mRNA regulatory network was structured via correlation analysis. With a high correlation threshold value, the networks comprising only five pseudogenes and hundreds their interactional mRNAs were ultimately constructed. Especially deserves to be mentioned, correlation analysis implied that GBP1P1 was strongly associated with multiple immune-related and cancer-related genes (TAP1, GBP1, CXCL10, CXCL11, GBP4). GBP1P1 is the pseudogene for Guanylate-binding protein 1 (GBP1), which is a guanosine-5’-triphosphate (GTP)-binding protein. A strong relationship between GBP1 and immunity has been reported in previous study (Fisch et al., 2019). High expression of GBP1 was associated with a better overall survival rate and it may have an anti-tumor effect in epithelial ovarian cancer (Carbotti et al., 2020). Moreover, studies have found that GBP1 and GBP4 are associated with CD8+ T cell infiltration and have conducive roles in cancers prognosis (Wang et al., 2018; Xu et al., 2020). Interestingly, it has been demonstrated that GBP1 can enhance the migration and invasion ability of tumor cells and promote the proliferation (Ji et al., 2019). In addition, TAP1 was a subunit of the transporter associated with antigen processing (TAP), which was critical for antigen presentation and related to CD8 + T cells infiltration in tumor microenvironment (Cresswell et al., 1999; Maimela et al., 2019; Zeng et al., 2019). Chemokines CXCL10 and CXCL11 could shape the ability of the immune response by driving the polarization and biological function of different T cell subsets, including effector CD4+ T cells, CD8+ effector T cells and regulatory T cells, and also make a critical impact on the development and progression of cancer (Karin and Razon, 2018; Tokunaga et al., 2018). Based on the above evidence, we could speculate that GBP1P1 might affect the occurrence and development of ovarian cancer through immune regulation, especially the regulation of cytotoxic T lymphocytes (CTL). Previous study has suggested that high GBP1 expression improves the prognosis of ovarian cancer (Carbotti et al., 2020). Meanwhile, our study revealed that GBP1P1 showed significant positive correlation with GBP1. We could deduce that GBP1P1 might be a protective factor for ovarian cancer, which was consistent with the results of our survival analysis. We had no reason to doubt that GBP1P1 could be a prognostic biomarker for ovarian cancer. Subsequently, functional enrichment analysis also revealed that pseudogene-related genes are involved in multiple immune functions and pathways, especially enrichment in T cell activation, virus, and cytokine. These findings further suggested that these pseudogenes may regulate CTL during the immune process (Boon et al., 2002), thus affecting the occurrence, development, and prognosis of ovarian cancer.
The tumor microenvironment has been reported to play a vital role in the ovarian tumorigenesis, cancer progression and metastasis (Jiang et al., 2020; Jochems and Schlom, 2011). So, we conducted immune infiltration analysis to further explore the characteristics of tumor-infiltrating immune cells in ovarian cancer and their relationship with pseudogenes-base risk signature. We found that risk scores were negatively correlated with immune scores, and patients with high-risk scores had a low level of tumor immune infiltration, which meant the risk signature we constructed altered the level of immune infiltration and thus reflected the cancer prognosis. Based on the results of this study, a high-risk score was associated with a poor prognosis for ovarian cancer. In particular, CTL immune cells such as CD8+ T cells were negatively correlated with risk score, suggesting that these immune cells contribute to an advantageous prognosis of ovarian cancer. This was identical with the previous research results (Sato et al., 2015; Zhang et al., 2003a). However, how pseudogenes regulate immune cells remains to be solved in the subsequent studies.
There may be some possible limitations in this study. First, the number of patient samples that can be obtained from the TCGA database was limited, and the most patients were White or Asian. Extending our findings to other ethnic patients should be with great caution. Furthermore, among the 10 selected pseudogenes, only GBP1P1 could be found to be related to cancer, and the remaining pseudogenes have not been clearly studied at present. Eventually, the results indicated that pseudogenes were likely to influence the occurrence and development of ovarian cancer through immunomodulatory mechanism, which was of great significance for revealing the function of pseudogenes in cancer. Due to all mechanical analysis in our study was descriptive, further functional experiments are needed to decipher the underlying mechanisms of the 10 pseudogenes. In future studies, it is hoped that more ovarian cancer samples and detailed clinical information could be obtained to validate the roles of the 10-pseudogene signature in cancer prognosis.
In conclusion, we constructed a 10 pseudogenes risk signature to predict ovarian cancer survival. Patients with high-risk scores showed significantly poorer prognosis. Importantly, it was suggested that pseudogenes might play pivotal roles in the immune regulation process, and thus affecting the ovarian cancer progression and prognosis. These findings provide a new understanding of pseudogenes. The risk signature constituted by 10 pseudogenes has the potential to be employed as a novel prognostic biomarker of ovarian cancer.
Availability of Data and Materials: The datasets generated and analyzed during the current study are available in the TCGA repository (https://portal.gdc.cancer.gov/).
Author Contribution: The authors confirm contribution to the paper as follows: study conception and design: Fuman Qiu; data collection: Yonghui Yu; analysis and interpretation of results: Yonghui Yu, Songhui Xu, Eryong Zhao, Yongshun Dong, Jinbin Chen, Boqi Rao and Jie Zeng; draft manuscript preparation, review and editing: Yonghui Yu, Lei Yang, Jiachun Lu and Fuman Qiu. All authors reviewed the results and approved the final version of the manuscript.
Funding Statement: This study was supported by the National Natural Science Foundation of China Grants 81872127, 81602289 (FQ); 81872694, 81673267, 81473040 (JL); 81402753, 81672303, 81871876 (LY); Guangzhou Science Research Program General Project Grant 201707010123 (FQ); Guangzhou Municipal Scientific Research Project Grant 1201630073 (FQ); Guangdong High School Young Innovative Talents Project Grant 2015KQNCX136 (FQ).
Conflicts of Interest: The authors declare that they have no conflicts of interest to report regarding the present study.
An Y, Bi F, You Y, Liu X, Yang Q (2018). Development of a novel autophagy-related prognostic signature for serous ovarian cancer. Journal of Cancer 9: 4058–4071. [Google Scholar]
An Y, Furber KL, Ji S (2017). Pseudogenes regulate parental gene expression via ceRNA network. Journal of Cellular and Molecular Medicine 21: 185–192. [Google Scholar]
Boon AC, de Mutsert G, Graus YM, Fouchier RA, Sintnicolaas K et al. (2002). The magnitude and specificity of influenza A virus- specific cytotoxic T-lymphocyte responses in humans is related to HLA-A and -B phenotype. Journal of Virology 76: 582–590. [Google Scholar]
Carbotti G, Petretto A, Naschberger E, Sturzl M, Martini S et al. (2020). Cytokine-induced guanylate binding protein 1 (GBP1) release from human ovarian cancer cells. Cancers 12: 488. [Google Scholar]
Cheetham SW, Faulkner GJ, Dinger ME (2020). Overcoming challenges and dogmas to understand the functions of pseudogenes. Nature Reviews Genetics 21: 191–201. [Google Scholar]
Chen R, Zhang M, Liu W, Chen H, Cai T et al. (2018). Estrogen affects the negative feedback loop of PTENP1-miR200c to inhibit PTEN expression in the development of endometrioid endometrial carcinoma. Cell Death & Disease 10: 4. [Google Scholar]
Cresswell PBN, Dick T, Diedrich G (1999). The nature of the MHC class I peptide loading complex. Immunological Reviews 172: 21–28. [Google Scholar]
Fisch D, Bando H, Clough B, Hornung V, Yamamoto M et al. (2019). Human GBP1 is a microbe-specific gatekeeper of macrophage apoptosis and pyroptosis. EMBO Journal 38: e100926. [Google Scholar]
Ganapathi MK, Jones WD, Sehouli J, Michener CM, Braicu IE et al. (2016). Expression profile of COL2A1 and the pseudogene SLC6A10P predicts tumor recurrence in high-grade serous ovarian cancer. International Journal of Cancer 138: 679–688. [Google Scholar]
Gao X, Qin T, Mao J, Zhang J, Fan S et al. (2019). PTENP1/miR-20a/PTEN axis contributes to breast cancer progression by regulating PTEN via PI3K/AKT pathway. Journal of Experimental & Clinical Cancer Research 38: 256. [Google Scholar]
Groen JN, Capraro D, Morris KV (2014). The emerging role of pseudogene expressed non-coding RNAs in cellular functions. International Journal of Biochemistry & Cell Biology 54: 350–355. [Google Scholar]
Hudson LG, Zeineldin R, Stack MS (2008). Phenotypic plasticity of neoplastic ovarian epithelium: unique cadherin profiles in tumor progression. Clinical and Experimental Metastasis 25: 643–655. [Google Scholar]
Jayson GC, Kohn EC, Kitchener HC, Ledermann JA (2014). Ovarian cancer. Lancet 384: 1376–1388. [Google Scholar]
Ji X, Zhu H, Dai X, Xi Y, Sheng Y et al. (2019). Overexpression of GBP1 predicts poor prognosis and promotes tumor growth in human glioblastoma multiforme. Cancer Biomarkers 25: 275–290. [Google Scholar]
Jiang Y, Wang C, Zhou S (2020). Targeting tumor microenvironment in ovarian cancer: Premise and promise. Biochimica et Biophysica Acta (BBA)–Reviews on Cancer 1873: 188361. [Google Scholar]
Jimenez-Sanchez A, Cybulska P, Mager KL, Koplev S, Cast O et al. (2020). Unraveling tumor-immune heterogeneity in advanced ovarian cancer uncovers immunogenic effect of chemotherapy. Nature Genetics 52: 582–593. [Google Scholar]
Jochems C, Schlom J (2011). Tumor-infiltrating immune cells and prognosis: The potential link between conventional cancer therapy and immunity. Experimental Biology and Medicine 236: 567–579. [Google Scholar]
Karin N, Razon H (2018). Chemokines beyond chemo-attraction: CXCL10 and its significant role in cancer and autoimmunity. Cytokine 109: 24–28. [Google Scholar]
Kovalenko TF, Morozova KV, Pavlyukov MS, Anufrieva KS, Bobrov MY et al. (2021). Methylation of the PTENP1 pseudogene as potential epigenetic marker of age-related changes in human endometrium. PLoS One 16: e0243093. [Google Scholar]
Lengyel E (2010). Ovarian cancer development and metastasis. American Journal of Pathology 177: 1053–1064. [Google Scholar]
Li SS, Ma J, Wong AST (2018). Chemoresistance in ovarian cancer: Exploiting cancer stem cell metabolism. Journal of Gynecologic Oncology 29: e32. [Google Scholar]
Lin S, Meng Y, Cao C, Wu P, Gao P et al. (2020). Comprehensive analysis of LDHAP5 pseudogene expression and potential pathogenesis in ovarian serous cystadenocarcinoma. Cancer Cell International 20: 229. [Google Scholar]
Lou W, Ding B, Fan W (2019a). High expression of pseudogene PTTG3P indicates a poor prognosis in human breast cancer. Molecular Therapy-Oncolytics 14: 15–26. [Google Scholar]
Lou W, Ding B, Zhong G, Du C, Fan W, Fu P (2019b). Dysregulation of pseudogene/lncRNA-hsa-miR- 363-3p-SPOCK2 pathway fuels stage progression of ovarian cancer. Sedentary Life and Nutrition 11: 11416–11439. [Google Scholar]
Lu X, Gao A, Ji L, Xu J (2015). Pseudogene in cancer: Real functions and promising signature. Journal of Medical Genetics 52: 17–24. [Google Scholar]
Maimela NR, Liu S, Zhang Y (2019). Fates of CD8+ T cells in tumor microenvironment. Computational and Structural Biotechnology Journal 17: 1–13. [Google Scholar]
Mukaka MM (2012). Statistics corner: A guide to appropriate use of correlation coefficient in medical research. Malawi Medical Journal 24: 69–71. [Google Scholar]
Perumal P, Abdullatif MB, Garlant HN, Honeyborne I, Lipman M et al. (2020). Validation of differentially expressed immune biomarkers in latent and active tuberculosis by real-time PCR. Frontiers in Immunology 11: 612564. [Google Scholar]
Poliseno L, Haimovic A, Christos PJ, YSdMEC Vega, Shapiro R et al. (2011). Deletion of PTENP1 pseudogene in human melanoma. Journal of Investigative Dermatology 131: 2497–2500. [Google Scholar]
Poliseno L, Marranci A, Pandolfi PP (2015). Pseudogenes in human cancer. Frontiers in Medicine 2: 68. [Google Scholar]
Proudfoot N (1980). Pseudogenes. Nature 286: 840–841. [Google Scholar]
Qazi S, Raza K (2021). Phytochemicals from Ayurvedic plants as potential medicaments for ovarian cancer: An in silico analysis. Journal of Molecular Modeling 27: 114. [Google Scholar]
Qazi S, Sharma A, Raza K (2021). The role of epigenetic changes in ovarian cancer: A review. Indian Journal of Gynecologic Oncology 19: 27. [Google Scholar]
Rattanapan Y, Korkiatsakul V, Kongruang A, Chareonsirisuthigul T, Rerkamnuaychoke B et al. (2018). EGFL7 and RASSF1 promoter hypermethylation in epithelial ovarian cancer. Cancer Genetics 224-225: 37–40. [Google Scholar]
Roychowdhury A, Samadder S, Das P, Mazumder DI, Chatterjee A et al. (2020). Deregulation of H19 is associated with cervical carcinoma. Genomics 112: 961–970. [Google Scholar]
Sato EOS, Ahn J, Bundy B, Nishikawa H, Qian F et al. (2015). Intraepithelial CD8+ tumor-infiltrating lymphocytes and a high CD8+/regulatory T cell ratio are associated with favorable prognosis in ovarian cancer. Proceedings of the National Academy of Sciences of the United States of America 102: 18538–18543. [Google Scholar]
Siegel RL, Miller KD, Jemal A (2020). Cancer statistics, 2020. CA: A Cancer Journal for Clinicians 70: 7–30. [Google Scholar]
Singh A, Gupta S, Sachan M (2019). Epigenetic biomarkers in the management of ovarian cancer: Current prospectives. Frontiers in Cell and Development Biology 7: 182. [Google Scholar]
Song L, Langfelder P, Horvath S (2012). Comparison of co- expression measures: mutual information, correlation, and model based indices. BMC Bioinformatics 13: 328. [Google Scholar]
Stensmyr MC (2016). Evolutionary genetics: Smells like a pseudo-pseudogene. Current Biology 26: R1294–R1296. [Google Scholar]
Stewart C, Ralyea C, Lockwood S (2019). Ovarian cancer: An integrated review. Seminars in Oncology Nursing 35: 151–156. [Google Scholar]
Sui J, Miao Y, Han J, Nan H, Shen B et al. (2018). Systematic analyses of a novel lncRNA- associated signature as the prognostic biomarker for Hepatocellular Carcinoma. Cancer Medicine 7: 3240–3256. [Google Scholar]
Tian X, Song J, Zhang X, Yan M, Wang S et al. (2020). MYC- regulated pseudogene HMGA1P6 promotes ovarian cancer malignancy via augmenting the oncogenic HMGA1/2. Cell Death & Disease 11: 167. [Google Scholar]
Tokunaga R, Zhang W, Naseem M, Puccini A, Berger MD et al. (2018). CXCL9, CXCL10, CXCL11/CXCR3 axis for immune activation-A target for novel cancer therapy. Cancer Treatment Reviews 63: 40–47. [Google Scholar]
Vargas AN (2014). Natural history of ovarian cancer. Ecancermedicalscience 8: 465. [Google Scholar]
Wang Q, Wang X, Liang Q, Wang S, Xiwen L et al. (2018). Distinct prognostic value of mRNA expression of guanylate-binding protein genes in skin cutaneous melanoma. Oncology Letters 15: 7914–7922. [Google Scholar]
Wang Y, Li Y, Yang Z, Liu K, Wang D (2015). Genome-wide microarray analysis of long non-coding RNAs in eutopic secretory endometrium with endometriosis. Cellular Physiology and Biochemistry 37: 2231–2245. [Google Scholar]
Wen YZ, Zheng LL, Liao JY, Wang MH, Wei Y et al. (2011). Pseudogene-derived small interference RNAs regulate gene expression in African Trypanosoma brucei. Proceedings of the National Academy of Sciences of the United States of America 108: 8345–8350. [Google Scholar]
Xu L, Pelosof L, Wang R, McFarland HI, Wu WW et al. (2020). NGS evaluation of colorectal cancer reveals interferon gamma dependent expression of immune checkpoint genes and identification of novel IFNγ induced genes. Frontiers in Immunology 11: 224. [Google Scholar]
Yoshihara K, Shahmoradgoli M, Martinez E, Vegesna R, Kim H et al. (2013). Inferring tumour purity and stromal and immune cell admixture from expression data. Nature Communications 4: 2612. [Google Scholar]
Yu GC, Wang LG, Han YY, He QY (2012). clusterProfiler: An R package for comparing biological themes among gene clusters. OMICS: A Journal of Integrative Biology 16: 284–287. [Google Scholar]
Yue C, Ren Y, Ge H, Yan L, Xu Y et al. (2019). Pseudogene DUXAP10 can be used as a diagnostic and prognostic biomarker in human cancers. Journal of Cellular Physiology 234: 23685–23694. [Google Scholar]
Zeng H, Zhang W, Gong Y, Xie C (2019). Radiotherapy activates autophagy to increase CD8+ T cell infiltration by modulating major histocompatibility complex class-I expression in non-small cell lung cancer. Journal of International Medical Research 47: 3818–3830. [Google Scholar]
Zhang L, Conejo-Garcia JR, Katsaros D, Gimotty PA, Massobrio M, Regnani G et al. (2003a). Intratumoral T cells, recurrence, and survival in epithelial ovarian cancer. New England Journal of Medicine 348: 203–213. [Google Scholar]
Zhang Y, Qazi S, Raza K (2021). Differential expression analysis in ovarian cancer: A functional genomics and systems biology approach. Saudi Journal of Biological Sciences 28: 4069–4081. [Google Scholar]
Zhang Z, Harrison PM, Liu Y, Gerstein M (2003b). Millions of years of evolution preserved: A comprehensive catalog of the processed pseudogenes in the human genome. Genome Research 13: 2541–2558. [Google Scholar]
Zheng M, Hu Y, Gou R, Nie X, Li X, Liu J, Lin B (2020). Identification three LncRNA prognostic signature of ovarian cancer based on genome-wide copy number variation. Biomedicine & Pharmacotherapy 124: 109810. [Google Scholar]
 | This work is licensed under a Creative Commons Attribution 4.0 International License, which permits unrestricted use, distribution, and reproduction in any medium, provided the original work is properly cited. |