DOI:10.32604/biocell.2022.017505
| BIOCELL DOI:10.32604/biocell.2022.017505 | |
| Article |
Modified enzymatic collagen digestion-mediated isolation of osteocytes
1Institute of Life and Science Research, Chongqing Medical University, Chongqing, 400016, China
2Department of Bioengineering, University of Washington, Seattle, 98195, USA
*Address correspondence to: Xiaolin Tu, xiaolintu0102@163.com
Received: 17 May 2021; Accepted: 19 July 2021
Abstract: This study established a method for isolating large numbers of high-purity osteocytes from high-density bone. Bone fragments derived from mice tibia and femurs were alternately digested with type I collagenase and EDTA nine times, and the digested cells and bone chips (BC) were cultured, digested, and passaged when cells were fully grown. The types of cells obtained were identified by morphology, viable cell counts, alkaline phosphatase staining, and biochemical activity analyses, and specific osteocyte and osteoblast markers were evaluated by quantitative real-time polymerase chain reaction. Our results showed that among the cells obtained from the third digestion (fractions 7–9) of wild mice tibias and femurs and the remaining BCs, 85%–90% of the cells were osteocytes. Moreover, their morphology was approximately one-tenth to one-fifth the size of osteoblasts, star-shaped or polygonal, with a dendritic structure, negative for alkaline phosphatase staining, and showed a high expression of dmp1 and sclerostin. Ninety percent of the cells in fractions 1–3 were osteoblasts, and were fusiform or polygonal shape. The activity of osteoblast-specific alkaline phosphatase and mRNA expression were high in this fraction, while the expression of osteocyte-specific dmp1 and sclerostin was not detected. In the second portion (fractions 4–6), a large number were osteoblasts, mixed with a small number of osteocytes, and had high alkaline phosphatase activity and osteocyte mRNA levels, a specific level of the osteocyte marker dmp1, and no sclerostin was detected. Osteocytes in daβcatot mice were also successfully isolated by this method, and we found that Wnt signaling increased the proliferation of these osteocytes. The proposed method can be used to culture osteocytes and osteoblasts of high purity and can be used for isolation and culture of these two kinds of cells from high-density bone, which provides an avenue for the study of osteocyte function in vitro.
Keywords: Osteocytes; Cell culture; Collagen protease; Sclerostin; Alkaline phosphatase
Osteocytes are the most abundant cells in bones, accounting for more than 95% of all bone cells. Osteocytes have previously been considered to be static and non-functional cells because they are embedded in the bone matrix (Schaffler et al., 2014). Recent studies have found that osteocytes have the function of regulating bone metabolism, and do not only regulate bone formation, but also regulate bone resorption (Schaffler et al., 2014), which is of great significance for the maintenance of bone homeostasis and our understanding of the osteocytes function. However, the osteocytes embedded in the matrix connect themselves with abundant synaptic structures to form a special crisscross network structure (Bonewald, 2011), which makes them sensitive to local and systemic signal stimuli, signal processing, and other adaptive responses. Moreover, osteocytes have an endocrine function and secrete some chemical molecules and cytokines (Caballero-Alias et al., 2005; Heino et al., 2002; Sheng et al., 2014). They also connect with mesenchymal stem cells, osteoblasts, chondrocytes, and vascular endothelial cells via a network of structures to regulate cartilage, osteogenesis, and angiogenesis (Bonewald, 2011). Hence, research on their cellular and molecular mechanisms has developed rapidly over the past few years (Bellido, 2014; Bonewald, 2011; Caballero-Alias et al., 2005; Heino et al., 2002; Sheng et al., 2014).
Despite the large number of osteocytes, they are still poorly understood, one of the reasons being that they are difficult to extract and culture in vitro. The isolation and culture of osteocytes originated from the work of Bonewald and co-researchers. They were the first to obtain an immortalized MLO-Y4 osteocyte-like cell line (Bonewald, 2011; Kato et al., 1997) for studying the communication between osteocytes and between osteocytes and bone surface cells. However, because this cell line did not express sclerostin (Yang et al., 2009), Bonewald’s team prepared another osteocyte cell line, MLO-A5 (Barragan-Adjemian et al., 2006; Kato et al., 2001). This cell line expressed the early osteocyte protein E11 and the late marker protein sclerostin as well as osteoblast marker proteins such as alkaline phosphatase (ALP), bone salivary protein (BSP), and osteocalcin. The enzyme-digested cell lines Bonewald’s team used were not identical to primary osteocytes in vivo and could express osteoblastic marker genes without specificity. In order to better determine the function of osteocytes in vitro, Bonewald’s team isolated primary osteocytes successfully in 2012 (Stern et al., 2012). However, their method of extracting primary bone cells requires a high concentration of enzymes, takes a long time, and does not yield high purity cell lines.
Most early methods of extracting osteocytes include continuous digestion of neonatal rat skulls (Mikuni-Takagaki et al., 1995) or growth of osteocytes from digested bone tissue (Kawata and Mikuni-Takagaki, 1998). Although the detection of the mRNA level of osteocyte-specific markers confirmed the existence of osteocytes, the interference of related preparations may lead to inappropriate conclusions about the gene expression and function of osteocytes. However, new techniques for isolating and culturing osteocytes are emerging. In order to obtain more purified osteocytes, a transgenic mouse line expressing GFP directed to osteocytes was generated by using the DMP1 promoter region of 8 kb. (Halleux et al., 2012; Kalajzic et al., 2004; Paic et al., 2009). However, even though GFP was isolated and purified by flow cytometry, the prepared cells still contained approximately 5% hematopoietic cells, including osteoclasts (Chia et al., 2015). Unfortunately, due to material limitations, the aforementioned method is not suitable for large-scale analysis and routine experimental operations. To better simulate and study the function of primary osteocytes in vitro, it is thus necessary to establish or improve the extraction methods for primary osteocytes.
Our group previously found that activating the Wnt/β-catenin pathway in mouse osteocytes can produce a large amount of bone, and we found that this can significantly increase osteoblast and osteoclast number in mice. In addition, we found that sclerostin was also highly expressed in this case (Tu et al., 2015). This indicated that, different from the previously described osteogenic mechanisms of decreasing sclerostin (Balemans et al., 2002; Brunkow et al., 2001; Heino et al., 2002; Loots et al., 2005), osteocytes, as the terminal cells of bone development, can regulate bone metabolism, regulate the differentiation of pre-developmental osteoblasts, and increase the speed of bone formation through their own Wnt signaling pathway. Hence, it is essential to understand osteocytes to explore the cellular and molecular mechanism of osteocyte Wnt signaling to increase bone formation. Thus, the extraction of primary osteocytes is the basis for the study of the powerful functions of osteocytes. Establishing an effective method for extracting primary osteocytes is necessary to provide a reference for the study of the function of osteocytes in vitro.
Based on the previous innovative findings and to further explore the cellular and molecular mechanisms of osteocytic Wnt signaling, our team successfully isolated and cultured primary osteocytes from wild-type mice and obtained a large number of high-purity osteocytes using an improved enzymatic method that included enzymatic digestion of bone collagen and decalcification steps. Our results showed that, among the cells obtained from the third digestion (fractions 7–9) of wild mice tibias and femurs and the remaining BCs, 85%–90% of the cells were osteocytes. At the same time, osteoblasts were effectively isolated. In addition, we also successfully isolated and cultured osteocytes from mice activated by Wnt signaling, and initially found that Wnt signaling itself could improve the proliferation of osteocytes.
Eight-month-old osteocytic activated β-catenin C57/BL6 mice (hereinafter referred to as daβcatot), litter control mice, and 4-month-old wild type mice were used here. Every group used two mice, and the total number of mice was six. Daβcatot mice were prepared by conditional gene knockout using the Cre/loxP method. That is, transgenic mice specifically expressed Cre in osteocytes (a generous gift from Professor Teresita Bellido of Indiana University School of Medicine, Indianapolis, IN, USA) and the mice in which the third exon of β-catenin were modified by the loxP sequence (a generous gift from Professor Makoto M. Taketo of Kyoto University, Kyoto, Japan) were mated to produce mice that knocked out the inhibitory 3rd exon and activate the Wnt/β-catenin signal pathway. The control mice were mice born in the same litter with only the loxP sequence. During these experiments, the feeding and operation of mice met the ethical standards of the Animal Experimental Center of Chongqing Medical University, China.
Fetal bovine serum (FBS)(0130HYT) was purchased from Tianjin Haoyang Biological Company (Tianjin, China); α MEM culture medium (C12571500BT) was purchased from Gibco; trypsin (SH3004) and Penicillin-Streptomycin (PS) (SV30010) were purchased from HyClone; Type I collagenase (SCR103) and β-mercaptoethanol (β-ME)(M6250) were purchased from Sigma; and BCIP/NBT alkaline phosphatase chromogenic kit (C3206) and alkaline phosphatase quantitative detection kit (P0321) were purchased from Shanghai Beyotime Biotechnology. TRIzol reagent (15596026) was purchased from the Invitrogen (USA); reverse transcription kit (RR047A) and SYBR Green Super mix (RR820A) were purchased from Dalian BaoBio Company (Dalian, China); and Realtime PCR primers were synthesized by Genscript.
Bone digestion and cell separation
Mice were anesthetized with ether inhalation and sacrificed prior to cell isolation. Under aseptic conditions, bilateral femurs, tibia, and humerus were dissected and placed in α-MEM medium containing 1% PS and 1% FBS after soft tissues were removed. The bone marrow cavity was rinsed by phosphate buffer (PBS, pH 7.4) repeatedly with a syringe until the bone turned white after the epiphyseal ends of both bones were removed. The remaining bone was chopped (about 1 mm × 1 mm × 1 mm), transferred to 6-well plates, digested with 1.5 mL of 100 U/mL of collagenase type I dissolved in α-MEM with 1% bovine serum albumin three times (37°C, incubation with shaking at 200 rpm, 25 min each pass), and the supernatant was collected. Next, we alternately used 5 mM EDTA containing 1% bovine serum albumin (BSA) (37°C, shaken incubation, 10 min) and 0.1% type I collagenase solution (37°C, 200-rpm shaken incubation, 25 min) repeatedly digested 3 times (a total of 9 times). After each treatment, the supernatant was collected and neutralized with the same volume of α-MEM complete medium (including 10% FBS), mixed and stored on ice. The bone slices were washed with PBS twice after each digestion. The cells obtained from the first three digestion periods were merged, hereinafter collectively referred to as F1–3. The cells obtained from the middle three digestion periods were merged, hereinafter collectively referred to as F4–6. The cells obtained from the last three digestion periods were merged, and hereinafter collectively referred to as F7–9. The cells isolated from the first three parts and the digested bone chips (BC) were cultured, respectively.
The culture of isolated cells and digested bone chips
The above three cell populations (F1–3, F4–6, and F7–9) were filtered on a 200-mesh filter, centrifuged at a speed of 200 × g for 5 min and then the supernatant was discarded, and complete medium was added (α-MEM medium, containing 10% FBS, 1% PS, and 40 μM β-mercaptoethanol (β-ME)), and the cells were then gently mixed. After counting the cells, the cells were introduced into a 6-well plate at 2 × 10⁵ cells per well, and the digested bone chips were also transferred to a 6-well plate. Then, 3 mL of complete culture medium was added, and the bone chips were evenly distributed by shaking the culture plate lightly. The 6-well plates were placed in a 37°C incubator with 5% CO2. Half of the medium was changed every three days. After the cells were 80% confluent, they were digested with trypsin, and then inoculated in a 24-well plate (2 × 10⁵/well). Cells were then grown from bone chips, and hereinafter referred to as BC cells.
ALP staining and activity assay
When the cell density reached 80%, the medium was discarded, and the cells were rinsed twice with PBS buffer. For ALP staining, the cells were firstly fixed with formalin solution at room temperature for 5–10 min. Then, the cells were rinsed with PBS buffer twice after the formalin solution was discarded. According to the protocol from the kit, chromogenic mixture (250 μL/well) was added. The color was developed for 20–30 min in the dark, and the coloring was observed under the microscope at intervals of 5 min, and finally, the chromogenic solution was washed away with distilled water and pictures were taken. To determine the enzyme activity, 50 mM pH 7.4 Tris (300 μL/well) was added to the plate and the cells were scraped off. Then, the cells were transferred to a 1.5-mL tube and placed on ice. The cell suspensions were treated with an ultrasonic crusher for 90 s (1 min interval every 30 s), and then centrifuged at 4°C at 12,000 rpm for 3 min, and the supernatant was collected. A total of 50 μL of each sample, 50 μL of buffer, and 50 μL of chromogenic substrate were added to each tube according to the kit instructions and mixed well. The reaction tubes were quickly transferred to a 37°C water bath to start the enzymatic reaction. When the liquid turned to yellow and gradually deepened to the expected level (usually 5–10 min), Terminator was added to terminate the reaction. The absorbance of 200 μL/hole was determined at 405 nm, and the enzyme activity was calculated according to a standard substrate concentration curve.
Total cellular RNA extraction and reverse transcription quantitative PCR
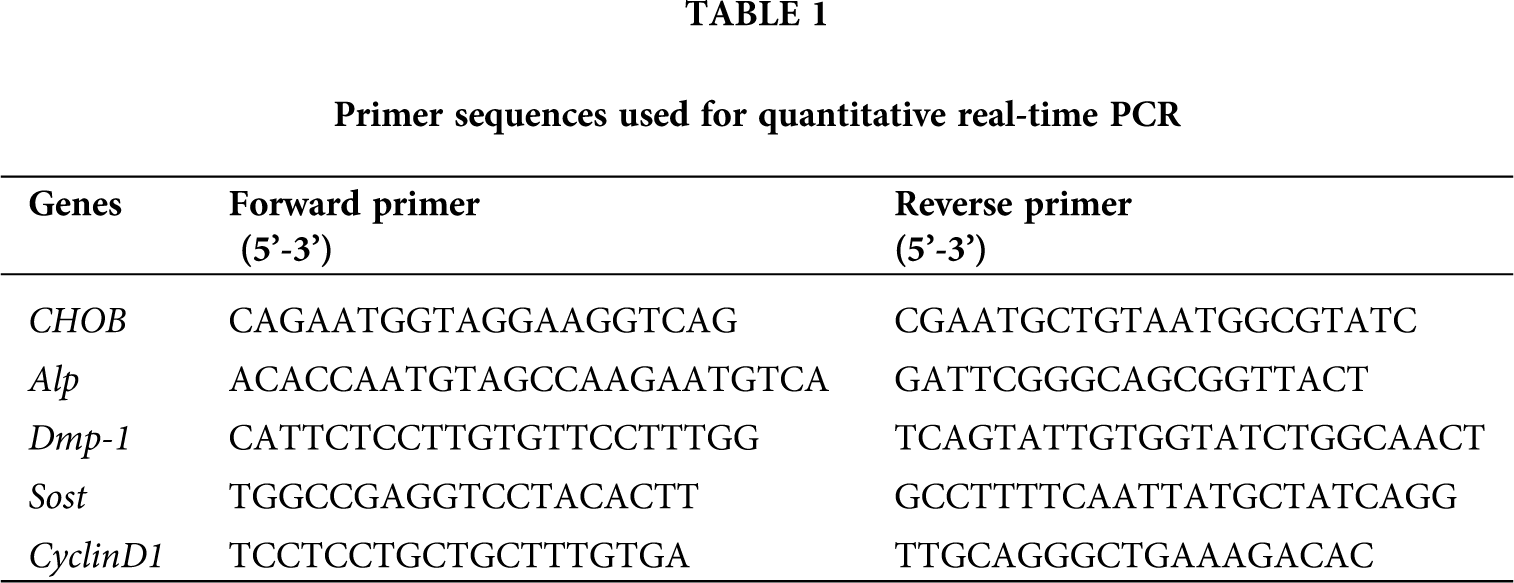
Total RNA from cells was isolated by removing the treatment medium, washing the cells with PBS, and adding 200 μL of TRIzol reagent per well according to the manufacturer’s instructions when the cells were 80%–90% confluent. Briefly, cells were scraped off the plates, resuspended by pipetting, and transferred to a 1.5 mL tube. After incubation for 5 min at room temperature, 0.2 volumes of chloroform were added. The mixture was mixed for 15 s and left at room temperature for 2 min. The mixtures were centrifuged at 12,000 × g at 4°C for 10 min. Following centrifugation, the aqueous phase was recovered, an equal volume of isopropanol was added, and the solution was placed at −20°C for 3 h to precipitate DNA. Then, the samples were centrifuged for 15 min (15000 × g at 4°C), and the supernatant was discarded. A total of 300 μL of 75% cold ethanol was then added and was centrifuged at 4°C at 7500 × g for 5 min and the supernatant was discarded. Finally, the RNA was dissolved in 20 μL DEPC water after the RNA pellet was air dried, and the concentration was measured by Nanodrop. 2.0 μL of 5 × gDNA Eraser Buffer, 1.0 μL of gDNA Eraser, and 1 μg of RNA were added to each reaction according to the operation instructions of the reverse transcription kit. RNase Free dH2O was added to bring the volume to 10 μL. Afterward, the tubes were incubated in a water bath at 42°C for 2 min and placed on ice immediately. Then 10 μL of reverse transcription reagents, including 1.0 μL Prime Script RT Enzyme Mix I, 1.0 μL RT Primer Mix, 4.0 μL of 5 × Prime Script Buffer 2, and 4.0 μL of RNase Free dH2O, were added to each reaction solution and mixed well. The reverse transcription reaction program was: 37°C for 15 min, 85°C for 5 min, and incubation at 4°C. Each cDNA was analyzed using quantitative PCR according to the SYBR Green Supermax kit instructions, where 12.5 μL of SYBR Premix Ex Taq II (2×), 1 μL of (10 μM) both positive and negative primers, and 30 ng of cDNA were added, and the mixture was supplemented with milli-Q water to 25 μL. The reaction procedure was 95°C for 30 s, 95°C for 5 s, and 60°C for 30 s for 40 cycles, and melt curves were drawn by increasing the temperature by 0.5°C each second from 65°C to 95°C. The CHOB gene was used as an internal reference for 3 samples in each group. Realtime PCR primers were all synthesized by Kingsley Company, and the primer sequences are shown in Table 1. Alp was a marker for osteoblasts and the Dentin Matrix Acidic Phosphoprotein 1 (dmp-1), Sclerostin (sost) and cyclind1 genes are markers of osteocytes.
Cell proliferation was assessed by living cell counting. The same number of cells (2 × 10⁵/well, 3 wells for each group) were inoculated in a 24-well plate in a 37°C incubator with 5% carbon dioxide. After 3 days, the cells were digested with trypsin and the number of cells was counted using live cell counting techniques. The cell proliferation rate was then determined for each condition.
SPSS 17.0 statistical software was used for data processing and data were expressed as the mean ± standard deviation (SD). A t-test was used to compare the differences between two groups and one-way analysis of variance (ANOVA) was used for comparisons between the four groups.
Establishment of isolation and culture methods for osteocytes
By changing the concentration, digestion time, and application sequence of digestive enzymes, osteoblasts, and osteocytes of high purity were extracted from dense bone tissue. Alkaline phosphatase staining was performed on the four populations of cells obtained by enzymatic hydrolysis. The results showed that the cells in these four populations all showed different degrees of staining (Fig. 1A). In F1–3, cells showed strong alkaline phosphatase staining or more than 90%, indicating that most of the cells were osteoblasts. The alkaline phosphatase positive cells in F4–6 had about 40% ALP staining. The alkaline phosphatase positive cells in F7–9 accounted for about 15% of the total population. BC cells showed the weakest alkaline phosphatase staining, accounting for about 5%–10% of this population.
Under an optical microscope, most of the cells in F1–3 were osteoblasts, were polygonal or spindle shaped, and alkaline phosphatase staining positive (Fig. 1B1, red arrow). Most of BC were osteocytes, accounting for more than 95%. The cells were smaller in size, about 1/10–1/5 of the size of osteoblasts, with multiple synaptic structures extending in all directions, which were dendritic or stellate and alkaline phosphatase staining was negative (Fig. 1B4, black arrow). In F4–6 and F7–9, the proportion of larger osteoblasts and alkaline phosphatase positive cells decreased gradually, among which F7–9 contained more osteocytes than other populations (Fig. 1B).
The alkaline phosphatase activity was determined by quantitative methods. Our results showed that the enzyme activity of F1–3 cells was the highest, which was 0.145 ± 0.008 nmol/μg/min. F4–6 was the second highest at 0.07 ± 0.003 nmol/μg/min. The enzyme activity of F7–9 and BC cells was the lowest, at 0.032 ± 0.004 nmol/μg/min and 0.022 ± 0.001 nmol/μg/min, respectively, which was about 5.7 and 8 times lower than that of F1–3, respectively (Fig. 1C).
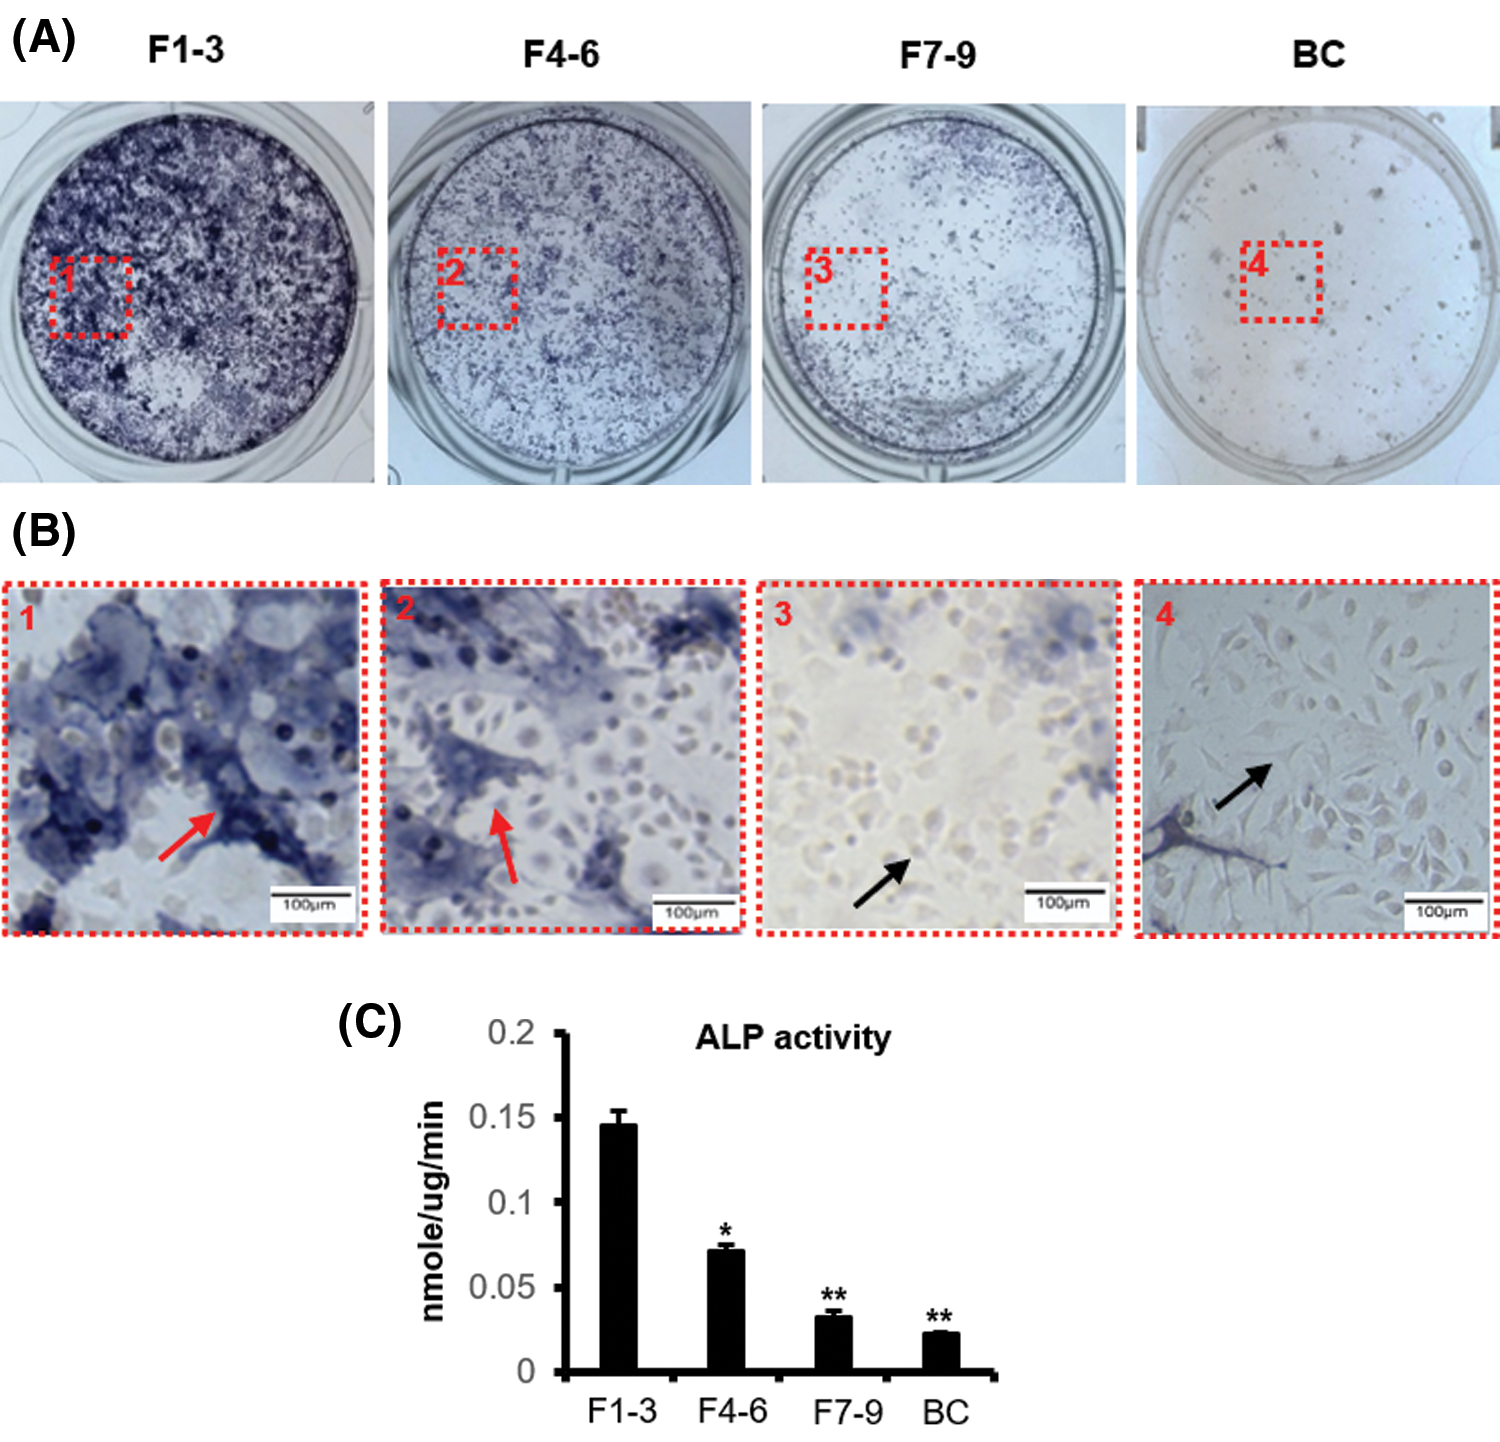
Figure 1: Establishment of isolation and culture method for osteocytes. (A) Cell alkaline phosphatase staining. (B) Morphology of osteoblasts and osteocytes (×100). Scale bar: 100 μm. Red arrow: osteoblasts. Black arrow: osteocytes. (C) Quantitative activity of alkaline phosphatase in cells. *compared with the F1−3 group, P < 0.05. **compared with the F1−3 group, P < 0.001. N = 3.
Determination of specific markers for osteocytes and osteoblasts
In order to further verify the cells obtained by the above enzyme digestion methods, we examined markers for osteoblasts and osteocytes in these four cell populations (F1–3, F4–6, F7–9, and BC). Based on alkaline phosphatase staining results, we found that the alp mRNA expression level of F1–3 cells was the highest, followed by F4–6 cells, and F7–9 and BC cells, which were the lowest (Fig. 2A). Markers for osteocytes showed that the BC group had the highest level of dmp1 mRNA, followed by F7–9 and F4–6, with the lowest expression in F1–3 (Fig. 2B). In addition, the mRNA expression of sost, which is the special maker of osteocytes, was the highest in the BC group, followed by the F7–9 group, while it was not detected in the F1–3 and F4–6 groups (Fig. 2C).
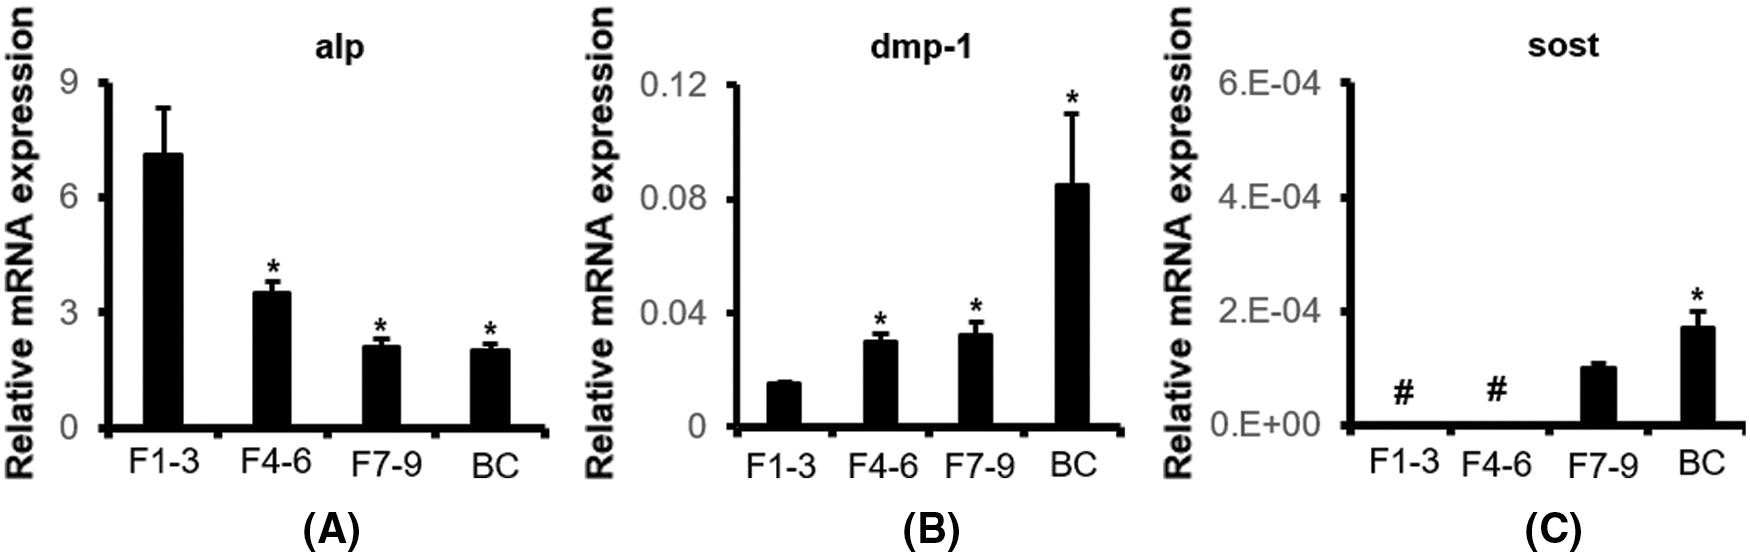
Figure 2: Expression of specific marker genes in osteocytes and osteoblasts. (A) Relative mRNA expression of the osteoblast marker gene alp. (B–C) Relative mRNA expression of the osteocyte marker genes dmp1 and sost. *compared with F1–3, P < 0.05. #non-detected. N = 3.
Isolation and identification of osteocytes from daβcatot mice
In order to investigate the cytological mechanism of Wnt signal transduction in osteocytes, it was particularly important to isolate osteocytes from mice with osteocytic activation of β-catenin in vitro. Osteocytes from 8-month-old daβcatot mice were isolated in vitro. As we have found in the past, daβcatot mice showed increased bone mass from the second to the sixth month after birth, while 8-month-old mice still showed increased bone mineral density. X-rays showed that the bones had increased bone mineral density (Fig. 3A), and the left and right femoral shaft increased by approximately 1.5 times, while the lumbar vertebrae increased by approximately two times (Fig. 3B).
Using our enzyme digestion method, we extracted osteocytes from daβcatot mice and control mice. The results showed that the morphological characteristics of osteocytes in the control group and daβcatot mice were still smaller than that of osteoblasts, about 5 times smaller than osteoblasts, and the morphology was still negative for alkaline phosphatase staining outside the cell body with multiple synapses (Fig. 3C).
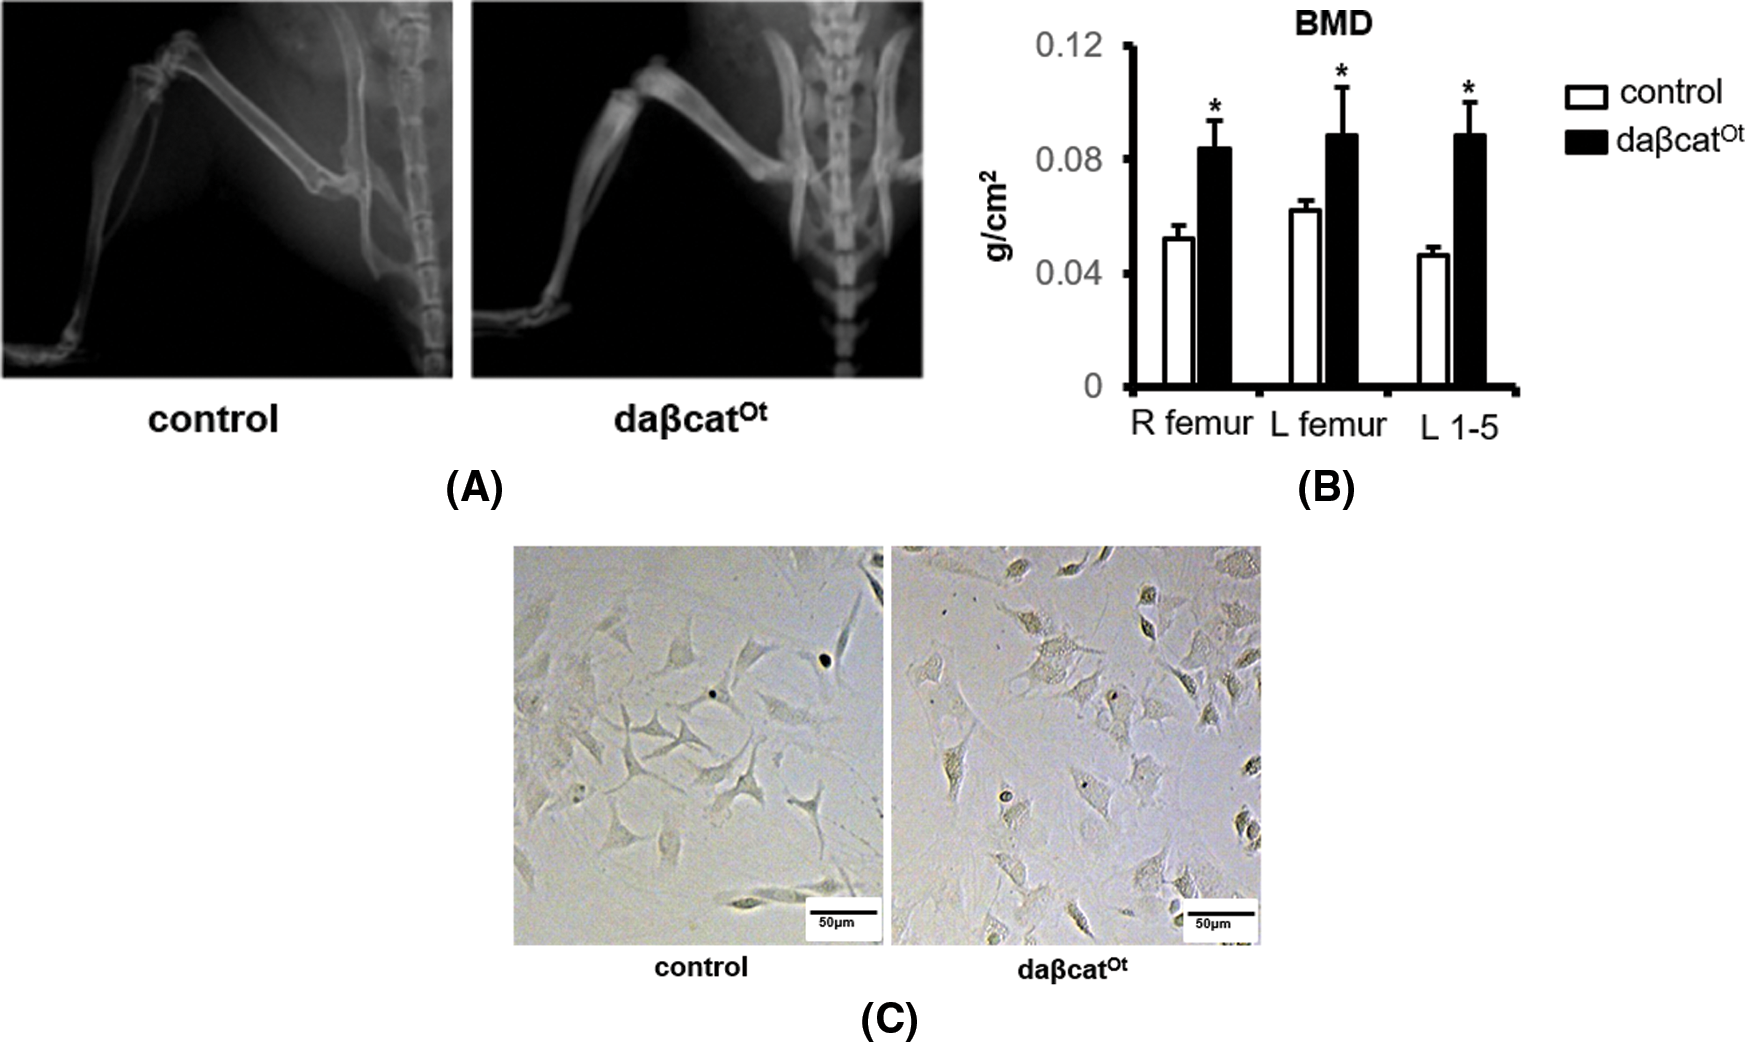
Figure 3: Osteocytes from 8-month-old mice were extracted by our optimized method for primary osteocyte extraction. (A) X-ray images of lower limbs from 8-month-old mice. (B) Bone mineral density (BMD) of the right femur, left femur, and lumbar vertebrae in 1–5 in 8-month-old mice. *compared with the control group, P < 0.05. N = 5. (C) Morphology of osteocytes (Scale bar: 50 μm).
Osteocytic phenotypes in 8–month-old daβcatot mice
In the detection of osteogenic differentiation and osteocyte specific marker genes in 8-month-old mice, the mRNA levels in daβcatot mice were higher than those in the control mice. The alp mRNA expression increased by 5.7 times (Fig. 4A) (1.18 ± 0.10 vs. 0.21 ± 0.01), sost mRNA increased by 6.7 times (Fig. 4B) (0.00101 ± 0.00029 vs. 0.00015 ± 0.00004), and the dmp-1 mRNA level increased by 1.6 times (Fig. 4C) (0.102 ± 0.018 vs. 0.063 ± 0.002). The level of cyclind1 mRNA increased 1.7 times (Fig. 4D) (6.59 ± 0.85 vs. 3.88 ± 0.15). The sost mRNA of the daβcatot group was higher than that of the control group, which was consistent with the increased sost expression of activated Wnt signal in osteocytes in vivo.
Enhancement of osteocyte proliferation in 4-month-old mice
In addition, we used this modified method to extract primary osteocytes to investigate the proliferation ability of osteocytes in activated osteocytic β-catenin mice in vitro. Four-month-old wild-type osteocytes and daβcatot osteocytes were inoculated into 24-well plates at a concentration of 20 × 104/well. After 3 days, the cells were digested and counted. The results showed that the proliferation rates of osteocytes in the daβcatot group were 1.59 times higher than those in the control group (Fig. 4E).
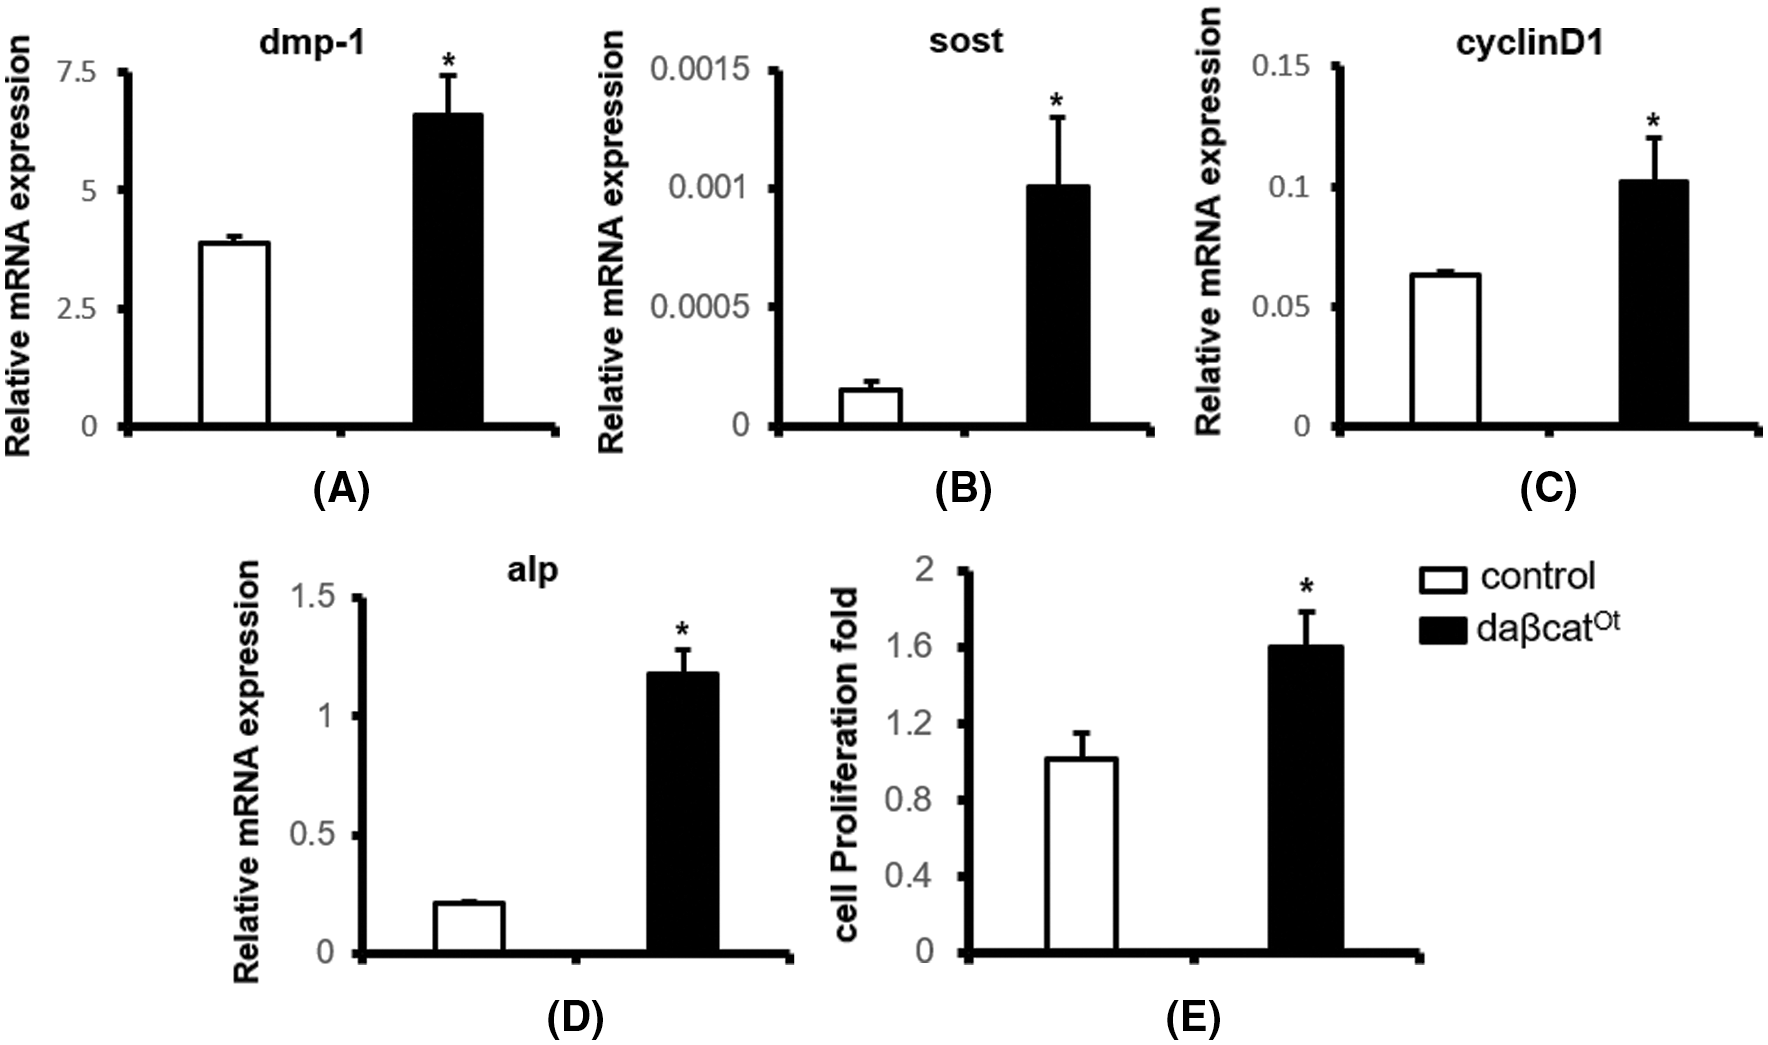
Figure 4: Gene expression of specific markers in osteoblasts and osteocytes. (A–C) Gene expression of specific markers in osteocytes. (D) Gene expression of specific markers in osteoblasts. (E) cell proliferation multiple. *compared with the control group, P < 0.05. N = 3.
In this study, through continuous collagenase digestion and alternating treatment with EDTA decalcification and collagenase digestion, a large number of high purity primary osteocytes were obtained from cell steps 7–9 (F7–9) and the remaining bone chips were digested by cell culture. At the same time, high purity osteoblasts were obtained after continuous digestion of collagenase in the first three steps. These two types of cells had different phenotypes where osteocytes proliferated slowly, while on the contrary, osteoblasts proliferated rapidly, and they maintained their own growth characteristics such as those in vivo. Secondly, their shapes and sizes were different, the shape of osteocytes was regular and polygonal, the cell body protruded dendritic process (cell process), while the shape of osteoblasts was different, which were fusiform and polygonal, but there were no cell processes. Osteocytes were relatively small, with a diameter of 15 μm and an area of about 10–20% of osteoblasts. The osteocytes and osteoblasts cultured by this method not only reflect their respective morphology and size in vivo, but also express the specific marker proteins of osteocytes and osteoblasts, respectively.
Osteoblasts were isolated and cultured successfully by the method described here. Ninety percent of the cells in the first part (F1–3) were osteoblasts, and the percentage of osteoblasts in the second and the third part (F4–6 and F7–9) decrease sequentially, which was slightly different from the results of the Bonewald research group. They obtained a higher percentage of osteoblasts in the third step of collagenase hydrolysis, the fourth step of EDTA treatment and the fifth step of collagenase hydrolysis, which was relative to our second part (F4–6). Since osteoblasts are distributed on the surface of bones, they should be hydrolyzed by collagenase first. Moreover, we used Sigma’s type I collagenase, and the concentration was 100 U/mL, which was 1/3 of their concentration. This step should be no different, although 1% bovine serum albumin was added to our enzyme solution, which protected from the degradation by bone protease. In addition, our processing time with 5 mM EDTA was 10 min, which was 15 min less than theirs. The key difference was that they used the Col1 promoter sequence of 3.6 kb to express Dred as a marker to distinguish osteoblasts from osteoclasts. Although this method is simple and convenient, 3.6 kb-Col1 is considered to mark pre-osteoblasts or osteoblasts at an earlier developmental stage (Genetos et al., 2007; You et al., 2008; Zhang et al., 2006), thus resulting in a missing number of osteoblasts. However, we used the traditional classical method, that is, qualitative staining of proteolytic substrate reactions and quantitative determination of the biochemical activity of collagenase, a specific marker of osteoblasts, which can be used to identify osteoblasts more reliably. In addition, the double verification method to determine the expression of specific marker genes of osteoblasts and osteocytes makes our results accurate and reliable. Through many explorations, we steadily obtained high-purity osteocytes, that is, the cells cultured in the third part (F7–9) and bone chips, as well as the osteoblasts in the first part (F1–3). Therefore, this improved method of isolating and identifying osteocytes and osteoblasts was more classical and reliable.
Using this method, we also successfully isolated and cultured the osteocytes and osteoblasts from daβcatot mice. The mice grew to 8 months old which, were past their prime, and they continued to show increased bone mineral density (Figs. 3A and 3B), which was 38.2% higher than control mice in the same litter. The morphology of osteocytes from daβcatot mice remained unchanged, and still showed polygonal shape, with normal dendritic cells, but the cell areas appeared to be enlarged. In addition, their proliferation rate was accelerated, indicating that Wnt signal can improve the proliferation ability of osteocytes. Although we did not find the difference in the expression from PCNA in the tibia of the mutant mice when we measured the total protein extract of the tibia in vivo (Tu et al., 2015), the number of osteocytes activated by Wnt in vivo increased, and the number of osteocytes per unit area of both cancellous bone and compact bone increased significantly. Therefore, the culture results of osteocytes isolated by this method in mice activated by Wnt signal verified the essential reason for the increase of the osteocytes number in vivo, and clearly showed that the activation of Wnt signaling is one of the direct causes of osteocyte proliferation, which is of great significance for the study of aging. We are prepared conditionally expressed cre mice and will determine the regulation of osteocytic Wnt signaling on the number of osteocytes and bone homeostasis in aging mice.
For a long time, osteocytes have been considered to be the main mechanoreceptor cells in bone, which regulate bone formation by converting mechanical stimulation into biochemical signals (You et al., 2008). However, because osteocytes are embedded in the deep surface of bone, and are differentiated terminal cells, lack differentiation ability, and only have weak proliferation ability, it was very difficult to study the function and molecular mechanism of osteocytes in vitro. In the past, MLO-Y4 cell lines were prepared to study the relationships between osteocytes and to measure the response of osteocytes to fluid and mechanical stimuli (Cheng et al., 2001; Cherian et al., 2005; Gross et al., 2005; Ponik et al., 2007). Later, MLO-Y4 was found to be low or difficult to detect the expression of Sclerostin, so MLO-A5 was prepared. However, although this cell line expressed sclerostin, it also expressed osteoblastic markers, and the cells were too large, up to 100 μm. Therefore, an IDG-SW3 cell line was prepared, which only expresses the markers of osteocytes and simulates the physiological function of osteocytes in vivo. Because of its expression of parathyroid hormone (PTH) receptor, it downregulates the expression of Sclerostin after being stimulated by PTH. Perhaps because of this reason, few researchers have studied the function of the osteocytes in vivo.
In fact, in order to explore the function of osteocytes, primary osteocyte cultures were conducted. Osteocytes were isolated from the parietal bone of mice from a few days old to 3–4 months old, and these cells were used to study the development of osteocytes. The isolation of osteocytes from the long bone of adult mice was reported for the first time by the Bonewald team, but the function of the osteocytes obtained has not been reported yet.
There are three kinds of cells in bone, namely, osteoblasts, osteoclasts, and osteocytes. It has long been believed that osteoblasts and osteoclasts directly control bone formation, bone remodeling, and maintain bone homeostasis. However, in recent years, through the study of genetics, genomics, and molecular informatics, it has been found that osteocytes have the function of regulating these two types of cells and are responsible for the physiological functions of postnatal bone remodeling and bone homeostasis maintenance. Now, there is a rise to study its molecular mechanism. Primary osteocytes can best simulate the biological function of osteocytes in vitro and better explore the function of osteocytes in vivo (Stern et al., 2012).
In conclusion, we have established a method for culturing and identifying osteocytes using continuous collagenase and EDTA digestion and obtained a large number of primary osteocytes. The reliability of this method was demonstrated by cell morphology, osteoblast-specific alkaline phosphatase staining, and osteocyte-specific marker gene detection. The establishment of this method provides sufficient resources for detecting the biological characteristics of Wnt signaling of osteocytes in vitro.
Availability of Data and Materials: All data generated or analyzed during this study are included in this published article.
Author Contributions: The research was designed and conducted by the WX and GD. YZ helped to sacrifice mice and collect bone cells. YZ and YL assisted in statistics. Mice were fed by WX, GD, and YZ. XT revised the English language.
Ethics Approval: Our study was conducted ethically in accordance with the World Medical Association Declaration of Helsinki and was approved by the Ethics Committee on Animal Research of the Chongqing Medical University.
Funding Statement: This research was supported by the National Natural Science Foundation of China (No. 8167090813).
Conflicts of Interest: The authors have no conflicts of interest to declare.
Balemans W, Patel N, Ebeling M, van Hul E, Wuyts W et al. (2002). Identification of a 52 kb deletion downstream of the SOST gene in patients with van Buchem disease. Journal of Medical Genetics 39: 91–97. [Google Scholar]
Barragan-Adjemian C, Nicolella D, Dusevich V, Dallas M, Eick J et al. (2006). Mechanism by which MLO-A5 late osteoblasts/early osteocytes mineralize in culture: Similarities with mineralization of lamellar bone. Calcified Tissue International 79: 340–353. [Google Scholar]
Bellido T (2014). Osteocyte-driven bone remodeling. Calcified Tissue International 94: 25–34. [Google Scholar]
Bonewald LF (2011). The amazing osteocyte. Journal of Bone and Mineral Research 26: 229–238. [Google Scholar]
Brunkow ME, Gardner JC, van Ness J, Paeper BW, Kovacevich BR et al. (2001). Bone dysplasia sclerosteosis results from loss of the SOST gene product, a novel cystine knot-containing protein. American Journal of Human Genetics 68: 577–589. [Google Scholar]
Caballero-Alias AM, Loveridge N, Pitsillides A, Parker M, Kaptoge S et al. (2005). Osteocytic expression of constitutive NO synthase isoforms in the femoral neck cortex: A case-control study of intracapsular hip fracture. Journal of Bone and Mineral Research 20: 268–273. [Google Scholar]
Cheng B, Zhao S, Luo J, Sprague E, Bonewald LF, Jiang JX (2001). Expression of functional gap junctions and regulation by fluid flow in osteocyte-like MLO-Y4 cells. Journal of Bone and Mineral Research 16: 249–259. [Google Scholar]
Cherian PP, Siller-Jackson AJ, Gu S, Wang X, Bonewald LF et al. (2005). Mechanical strain opens connexin 43 hemichannels in osteocytes: A novel mechanism for the release of prostaglandin. Molecular Biology of the Cell 16: 3100–3106. [Google Scholar]
Chia LY, Walsh NC, Martin TJ, Sims NA (2015). Isolation and gene expression of haematopoietic-cell-free preparations of highly purified murine osteocytes. Bone 72: 34–42. [Google Scholar]
Genetos DC, Kephart CJ, Zhang Y, Yellowley CE, Donahue HJ (2007). Oscillating fluid flow activation of gap junction hemichannels induces ATP release from MLO-Y4 osteocytes. Journal of Cellular Physiology 212: 207–214. [Google Scholar]
Gross TS, King KA, Rabaia NA, Pathare P, Srinivasan S (2005). Upregulation of osteopontin by osteocytes deprived of mechanical loading or oxygen. Journal of Bone and Mineral Research 20: 250–256. [Google Scholar]
Halleux C, Kramer I, Allard C, Kneissel M (2012). Isolation of mouse osteocytes using cell fractionation for gene expression analysis. In: Helfrich M, Ralston S (eds.Bone Research Protocols. Methods in Molecular Biology (Methods and Protocols). Totowa, NJ: Humana Press. [Google Scholar]
Heino TJ, Hentunen TA, Vaananen HK (2002). Osteocytes inhibit osteoclastic bone resorption through transforming growth factor-β: Enhancement by estrogen. Journal of Cellular Biochemistry 85: 185–197. [Google Scholar]
Kalajzic I, Braut A, Guo D, Jiang X, Kronenberg MS et al. (2004). Dentin matrix protein 1 expression during osteoblastic differentiation, generation of an osteocyte GFP-transgene. Bone 35: 74–82. [Google Scholar]
Kato Y, Boskey A, Spevak L, Dallas M, Hori M, Bonewald L (2001). Establishment of an osteoid preosteocyte-like cell MLO-A5 that spontaneously mineralizes in culture. Journal of Bone and Mineral Research 16: 1622–1633. [Google Scholar]
Kato Y, Windle JJ, Koop BA, Mundy GR, Bonewald LF (1997). Establishment of an osteocyte-like cell line, MLO-Y4. Journal of Bone and Mineral Research 12: 2014–2023. [Google Scholar]
Kawata A, Mikuni-Takagaki Y (1998). Mechanotransduction in stretched osteocytes—temporal expression of immediate early and other genes. Biochemical and Biophysical Research Communications 246: 404–408. [Google Scholar]
Loots GG, Kneissel M, Keller H, Baptist M, Chang J et al. (2005). Genomic deletion of a long-range bone enhancer misregulates sclerostin in Van Buchem disease. Genome Research 15: 928–935. [Google Scholar]
Mikuni-Takagaki Y, Kakai Y, Satoyoshi M, Kawano E, Suzuki Y et al. (1995). Matrix mineralization and the differentiation of osteocyte-like cells in culture. Journal of Bone and Mineral Research 10: 231–242. [Google Scholar]
Paic F, Igwe JC, Nori R, Kronenberg MS, Franceschetti T et al. (2009). Identification of differentially expressed genes between osteoblasts and osteocytes. Bone 45: 682–692. [Google Scholar]
Ponik SM, Triplett JW, Pavalko FM (2007). Osteoblasts and osteocytes respond differently to oscillatory and unidirectional fluid flow profiles. Journal of Cellular Biochemistry 100: 794–807. [Google Scholar]
Schaffler MB, Cheung WY, Majeska R, Kennedy O (2014). Osteocytes: Master orchestrators of bone. Calcified Tissue International 94: 5–24. [Google Scholar]
Stern AR, Stern MM, van Dyke ME, Jahn K, Prideaux M et al. (2012). Isolation and culture of primary osteocytes from the long bones of skeletally mature and aged mice. Biotechniques 52: 361–373. [Google Scholar]
Sheng MH, Lau KH, Baylink DJ (2014). Role of osteocyte-derived insulin-like growth factor I in developmental growth, modeling, remodeling, and regeneration of the bone. Journal of Bone Metabolism 21: 41–54. [Google Scholar]
Yang WC, Harris MA, Heinrich JG, Guo DY, Bonewald LF et al. (2009). Gene expression signatures of a fibroblastoid preosteoblast and cuboidal osteoblast cell model compared to the MLO-Y4 osteocyte cell model. Bone 44: 32–45. [Google Scholar]
Tu X, Delgado-Calle J, Condon KW, Maycas M, Zhang H et al. (2015). Osteocytes mediate the anabolic actions of canonical Wnt/beta-catenin signaling in bone. Proceedings of the National Academy of Sciences of the United States of America 112: E478–E486. [Google Scholar]
You L, Temiyasathit S, Lee P, Kim CH, Tummala P et al. (2008). Osteocytes as mechanosensors in the inhibition of bone resorption due to mechanical loading. Bone 42: 172–179. [Google Scholar]
Zhang K, Barragan-Adjemian C, Ye L, Kotha S, Dallas M et al. (2006). E11/gp38 selective expression in osteocytes: Regulation by mechanical strain and role in dendrite elongation. Molecular and Cellular Biology 26: 4539–4552. [Google Scholar]
 | This work is licensed under a Creative Commons Attribution 4.0 International License, which permits unrestricted use, distribution, and reproduction in any medium, provided the original work is properly cited. |