DOI:10.32604/biocell.2022.017765
| BIOCELL DOI:10.32604/biocell.2022.017765 | |
| Article |
Effect of RBM10 on regulating the proliferation and metastasis activity of human hepatocellular carcinoma cells by affecting the stability of miR-21
1Department of General Surgery, Beijing Ditan Hospital, Capital Medical University, Beijing, 100015, China
2Key Laboratory of Zoological Systematics and Evolution, Institute of Zoology, Chinese Academy of Sciences, Beijing, 100101, China
*Address correspondence to: Li Jiang, jiangli1903@163.com
Received: 04 June 2021; Accepted: 08 July 2021
Abstract: In recent decades, RNA binding motif (RBM) proteins have been widespread concerned by researchers. Among them, RBM5 is considered as a potential tumor suppressor gene in HCC. RBM10, also belonging to the RBM family, have similar structure and high homology with RBM5, indicating its potential as potential tumor suppressor genes. However, the role of RBM10 in tumors is controversial. The purpose of this study was to analyze the expression correlation and functional relationship of miR-21 and RBM10 in human hepatocellular carcinoma (HCC) tissues and corresponding tumor cells. Bioinformatics analysis showed that miR-21 and RBM10 were both highly expressed in HCC; similarly, the expression levels of miR-21 and RBM10 in HCC cells were significantly higher than those in normal hepatocytes. There was a positive correlation between miR-21 and RBM10. Furthermore, knockdown of RBM10 inhibited the proliferation, migration and invasion of SNU-398 cells, and simultaneous overexpression of miR-21 attenuated this inhibitory effect. Meanwhile, overexpressing RBM10 could promote the proliferation, migration and invasion of Hep G2 cells; while the stability of miR-21 could be reduced by knocking down RBM10. On the whole, the findings of this study indicate that RBM10 is involved in regulating the function and activity of human HCC cells by affecting the stability of miR-21. RBM10 cannot be simply summarized as a tumor suppressor or oncogene. Further studies are needed to clarify the role of RBM10 in tumors.
Keywords: Hepatocellular carcinoma; RBM10; miR-21; Stability
| Abbreviations | |
| RBM: | RNA binding motif |
| RBM10: | RNA Binding Motif Protein 10 |
| HCC: | human hepatocellular carcinoma |
| CCK-8: | Cell Counting Kit-8 |
| RIP: | RNA-binding protein immunoprecipitation |
| PCR: | polymerase chain reaction |
| qRT-PCR: | quantitative reverse transcription-PCR |
| SDS–PAGE: | SDS–polyacrylamide gel electrophoresis |
| DAPI: | 4’,6-diamidino-2-phenylindole |
MicroRNA (miRNA) is a class of non-coding small RNA comprising of about 18–22 nucleotides, which can degrade or inhibit the translation of target mRNA by completely or incompletely complementing with mRNA, thus involving extensively in many physiological and pathological processes in vivo (Bushati and Cohen, 2007; Krol et al., 2010). Among the numerous miRNAs discovered, miR-21 has been concerned greatly by the medical community due to its abnormal expression in many diseases. MiR-21 is up-regulated in various malignant tumors, and participates in the occurrence and development of tumors through complex regulation, suggesting that research of miR-21 will be of great significance in the diagnosis and treatment of tumors (Arghiani and Matin, 2021; Bica-Pop et al., 2018; Medina et al., 2010; Panagal et al., 2018). MiR-21 is encoded by a single gene at fragile site FRA17B of 17q23.2, which contains 22 nucleotides and is isolated from a pre-transcriptional ontology of about 3,400 nucleotides (Fujita et al., 2008; Krichevsky and Gabriely, 2009; Lagos-Quintana et al., 2001). Similar to most miRNAs, miR-21 is processed from primary miRNA (pri-miRNA) to precursor miRNA (pre-miRNA), and finally cleaved to form mature miRNA. The amplification of 17q chromosome region where miR-21 gene is located is related to many tumors including hepatocellular carcinoma (HCC). However, in many tumor tissues with elevated miR-21, there was no amplification of gene encoding miR-21. Accordingly, high expression of miR-21 in tumor tissues may not be associated with the amplification of genes, suggesting that miR-21 expression disorder may be explained by transcriptional or post-transcriptional regulation (Bertoli et al., 2015; Kumarswamy et al., 2011). In other words, it is still unclear with respect to the mechanism of the high abundance of miR-21 in tumor tissues so far.
In recent decades, RNA binding motif (RBM) proteins have been widespread concerned by researchers (Sutherland et al., 2005). Among them, RBM5 is considered as a potential tumor suppressor gene in HCC, providing novel insight for early diagnosis, targeted therapy and chemotherapy resistance of HCC (Sutherland et al., 2010). On the basis of the role of RBM5, more researchers began to explore the relationship between other members of RBM family and tumors. RBM10, also belonging to the RBM family, have similar structure and high homology with RBM5 (Inoue, 2021), indicating its potential as potential tumor suppressor genes. In reality, there is a great controversy about whether RBM10 can inhibit or promote cancer (Bechara et al., 2013; Cao et al., 2021; Hernández et al., 2016; Loiselle et al., 2017; Wang et al., 2012). With respect to the above, based on a cell model of HCC, the present study was carried out to reveal the abnormal expression of RBM10 and its relationship with miR-21, so as to demonstrate the biological function of RBM10 in HCC cells innovatively.
Publicly available Level3 Illumina RNASeqv2 and miRNASeq data for Non-small cell lung cancer (LUAD and LUSC) patients from TCGA was downloaded (https://portal.gdc.cancer.gov/). The RNA-seq expression values were transformed in log2 format to normalize the data. Statistical analysis was performed in R (version 4.0.5) (http:///www.r-project.org/) and statistical significance was defined as as *P < 0.05, **P < 0.01, ***P < 0.001.
Human hepatocellular carcinoma cell lines (HepG2, SNU-398, Hep3B) were provided by the Cell Resource Center, Peking Union Medical College. Human liver immortal cell line THLE-2 was purchased from Ybscience (Shanghai, China). All cell lines were cultured in monolayer at 37°C in RPMI-1640 medium containing 10% fetal bovine serum (Sigma-Aldrich, St Louis, MO, USA). Cell transfection was carried out with Lipofectamine 3000 reagent (Thermo Fisher Scientific, Inc., MA, USA). Transfections were performed in 24-well or 96-well pre-treated culture plates with siRNAs (10 nM), miRNA mimics (20 nM) or plasmids (10 ng/μL) according to the manufacturer’s suggestion. The plasmid pCMV-RBM10 (NM_005676, NP_005667.2, RG200150) was purchased from OriGene (OriGene Technologies, USA). The plasmid pCMV-RBM10 MUT, with amino acid deletion mutations at 80–89 and 633–646, was designed and synthesized by Hitrobio (Hitrobio.tech, Beijing, China). RBM10 si#1: 5’-GCAAGAUCGUGGACCAUGUGA-3’; RBM10 si#2: 5’-GCCCUUCAAAGUCAUCUGUAU-3’; miR-21-5p: 5’-GAGCUGAUGAAGUAAAGAGUA-3’. All the siRNAs and miRNA mimics were synthesized by GenePharma (GenePharma Co., Ltd., Shanghai, China).
ProteoJET™ Mammalian Cell Lysis Reagent (Thermo Fisher Scientific) containing protease inhibitor cocktail was used to prepare cell lysates. The protein concentration was measured by the BCA protein analysis kit (Thermo Fisher Scientific). The samples containing 50 μg protein were separated on 10% SDS–polyacrylamide gel electrophoresis (SDS–PAGE) and then transferred to PVDF membranes (Bio-Rad, Hercules, CA, USA). After blocking with 5% skim milk, the membranes were incubated overnight with diluted primary antibodies at 4°C. Primary antibodies for RBM10 (ab72423, 1:1000), Lamin A (ab26300, 1:1000), and GAPDH (ab181602, 1:1000) were purchased from Abcam (Cambridge, UK). Bound antibodies were detected with HRP-labeled secondary antibody (Goat Anti-Rabbit, ab6721, Abcam, 1:5000) using the enhanced chemiluminescent substrate (Thermo Scientific). Positive signals from the target proteins were visualized using Tanon 2500 image analyzer (Shanghai, China).
Quantitative real-time polymerase chain reaction (qRT-PCR)
Total RNA was extracted with TRIzol reagent (Thermo Fisher Scientific). The concentration of RNA sample was determined by spectrophotometry (GeneQuant, GE Healthcare, Piscataway, USA) at 260 nm. According to the manufacturer’s instructions, PrimeScript™ RT Master Mix (Takara, Japan) was used for reverse transcription. Use TB Green™ Premix Ex Taq™ (Takara, Japan) to perform qRT-PCR on ABI PRISM 7500 real-time PCR system (Applied Biosystems, USA). Gene expression was detected in three repeats, and the data were processed with 2−ΔΔCT method. GAPDH was used as an endogenous control. MiRNAs were quantified using All-in-One™ miRNA qRT-PCR detection kit (Genecopeia, MD, USA). RNU6B is used for internal control. The qRT-PCR primer sequences used are as follows:
RBM10 forward, 5’-ATTTTGCGCAACCTGAACCC-3’; RBM10 reverse, 5’-GGTGGAGAGCTGGATGAAGG-3’; pri-miR-21 forward, 5’-ATGGGCTGTCTGACATTTTGGTA-3’; pri-miR-21 reverse, 5’-CATTGGATATGGATGGTCAGATGA-3’; pre-miR-21 forward, 5’-CTTATCAGACTGATGTTGACTGTTGAATCTCATGGCAACACCAG-3’; miR-21-5p forward, 5’-GCAGTAGCTTATCAGACTGATG-3’; unique oligo(dT) adaptor primer: 5’-GCGAGCACAGAATTAATACGACTCACTATAGGTTTTTTTTTTTTTTTTTTVN-3’; Universal Adaptor primer: 5’-GCGAGCACAGAATTAATACGAC-3’.
CCK-8 (Dojindo, Japan) was used to detect the cell proliferation rate. In short, 4 × 10³ transfected cells/well were re-seeded into 96-well plates and incubated for 1, 2, 3, and 4 days, respectively. 10 μL of CCK-8 reagent were added to each well and incubated for 2 h. Then, a Multimode Reader (PerkinElmer, USA) was used to verify the OD450 nm value of each well.
The ability of cell migration and invasion was detected by Transwell assay. 24 h after transfection, the cells in each group were digested with 0.25% trypsin. After PBS washing, the cells were re-suspended in serum-free medium to make single-cell suspension, which was adjusted to 2 × 10⁵ cells. Matrigel (BD Biosciences) was diluted with serum-free medium, added to the upper chamber of Transwell, and placed in 37°C incubator for 1 h to prepare Matrigel matrix coating. The prepared single-cell suspension was spread in the upper chamber of Transwell, with 5 × 10³ cells per well, and the culture medium containing 20% FBS was added in the lower chamber and incubated at 37°C for 24 h. The Transwell chamber was removed, and the cells and debris in the upper chamber are wiped clean with cotton swabs. The cells adhered under the cross-pore compartment filtration membrane were stained with 4’,6-diamidino-2-phenylindole (DAPI, Invitrogen) and washed with PBS. The adherent cells were observed under an inverted microscope (Olympus IX71), and the number of transmembrane cells was counted. The relative invasive ability of the cells was counted. When testing the cell migration ability of each group, Matrigel matrix gel was not applied on the upper chamber filter membrane of Transwell, and the other steps were the same as the Transwell invasion test.
The stability of miRNA was detected by actinomycin D (ActD) blockade test. Cells were seeded in 6-well plates at 4 × 10⁵ cells/well and cultured at 37°C with 5% CO2 for 24 h. Next, the cells were treated with actinomycin D (10 mg/L) for 0, 4, 8, 12, 24 h. Total RNA was extracted by TRIzol at the indicated time points, and the relative abundance of miRNAs was detected by RT-qPCR.
RNA-binding protein immunoprecipitation (RIP)
RNA-binding protein immunoprecipitation (RIP) was performed using the Magna RIP RNA-binding protein immunoprecipitation kit (Millipore). In brief, SNU-398 cell lysates were immunoprecipitated with RBM10 antibody (AB72423, ABCAM) or immunoglobulin G (IgG) with magnetic beads of protein G. After washing, RBM10-bound RNA was eluted and quantified. The relative abundance of RNA was detected by qRT-PCR.
The immunohistochemical staining of RBM10 (ab72423; abcam; 1:200) was performed with VECTASTAIN@ ABC kit (Vector Laboratories, Burlingame, CA, USA). The paraffin-embedded tissue sections were dewaxed, and the antigen was repaired by heating 10 min in 10 mM sodium citrate buffer (pH6.0) at 120°C. The sections were pre-sealed with normal horse serum in the kit and incubated with primary antibody at 4°C overnight. According to the manufacturer’s operating procedures, the positive signal was developed with 3,3’-diaminobenzidine-tetrahydrochloride. The nucleus was reversely stained with hematoxylin. The samples incubated with rabbit IgG were used as the negative control. This study was approved by the Ethics Committee of Beijing Ditan Hospital, Capital Medical University (#2017-050-01) and obtained the written informed consent of each participant involved.
HepG2 cells labeled with luciferase (VIEWSOLID BIOTECH, Beijing, China) were transfected with RBM10 wild type, RBM10 mutant or control plasmid, respectively. The hepatoma cells in logarithmic growth phase were digested with trypsin, and the single-cell suspension was prepared. The cells were washed with 1 × PBS three times, counted and resuscitated with PBS, and the cell density was adjusted to 4 × 10⁷ cells/mL. The tumor cell suspension was extracted with a 1-mL syringe and inoculated subcutaneously on one side of the back of NOD-SCID mice. Each inoculation site was 0.1 mL, containing 4 × 10⁶ living cells. After four weeks, tumor growth status was examined by the In-Vivo Imaging System (IVIS Spectrum CT, PerkinElmer). After bioluminescence imaging, animals were sacrificed, and the tumor masses were weighted. All animal experiments were approved by the Committee on Use and Care of Animals of Beijing Ditan Hospital, Capital Medical University (No. 20200048).
Statistical analyses were performed using GraphPad Prism (GraphPad Software). Data are presented as mean ± standard deviation (SD). Sets containing two groups of data are analyzed using double-tailed Student’s t-test or Mann–Whitney U-test. The sets with more than two groups of data were analyzed by two-way ANOVA, with Tukey post-hoc analysis. If P-value < 0.05, the difference is considered to be statistically significant.
The expression levels of RBM10 and miR-21 in HCC tissues
Online GEPIA (http://gepia.cancer-pku.cn/) was used to search for data related to HCC for analyzing RBM10 mRNA and miR-21 expressions. Corresponding results showed that the relative expression levels of RBM10 mRNA and miR-21 in HCC tissues were significantly higher than those in adjacent tissues or normal control tissues (Figs. 1A and 1B). Similarly, in the 10 pairs of HCC and adjacent tissues collected in our experiment, the results of quantitative PCR analysis were consistent with the results of data from database, which showed that RBM10 and miR-21 were abnormally high expressed in HCC tissues (Figs. 1C and 1D). Meanwhile, a high protein expression of RBM10 was also confirmed according to the results of immunohistochemistry (Fig. 1E). Subsequently, online analysis based on starBase database (http://starbase.sysu.edu.cn) revealed that RBM10 and miR-21 showed a positive co-expression trend (Fig. 1F).
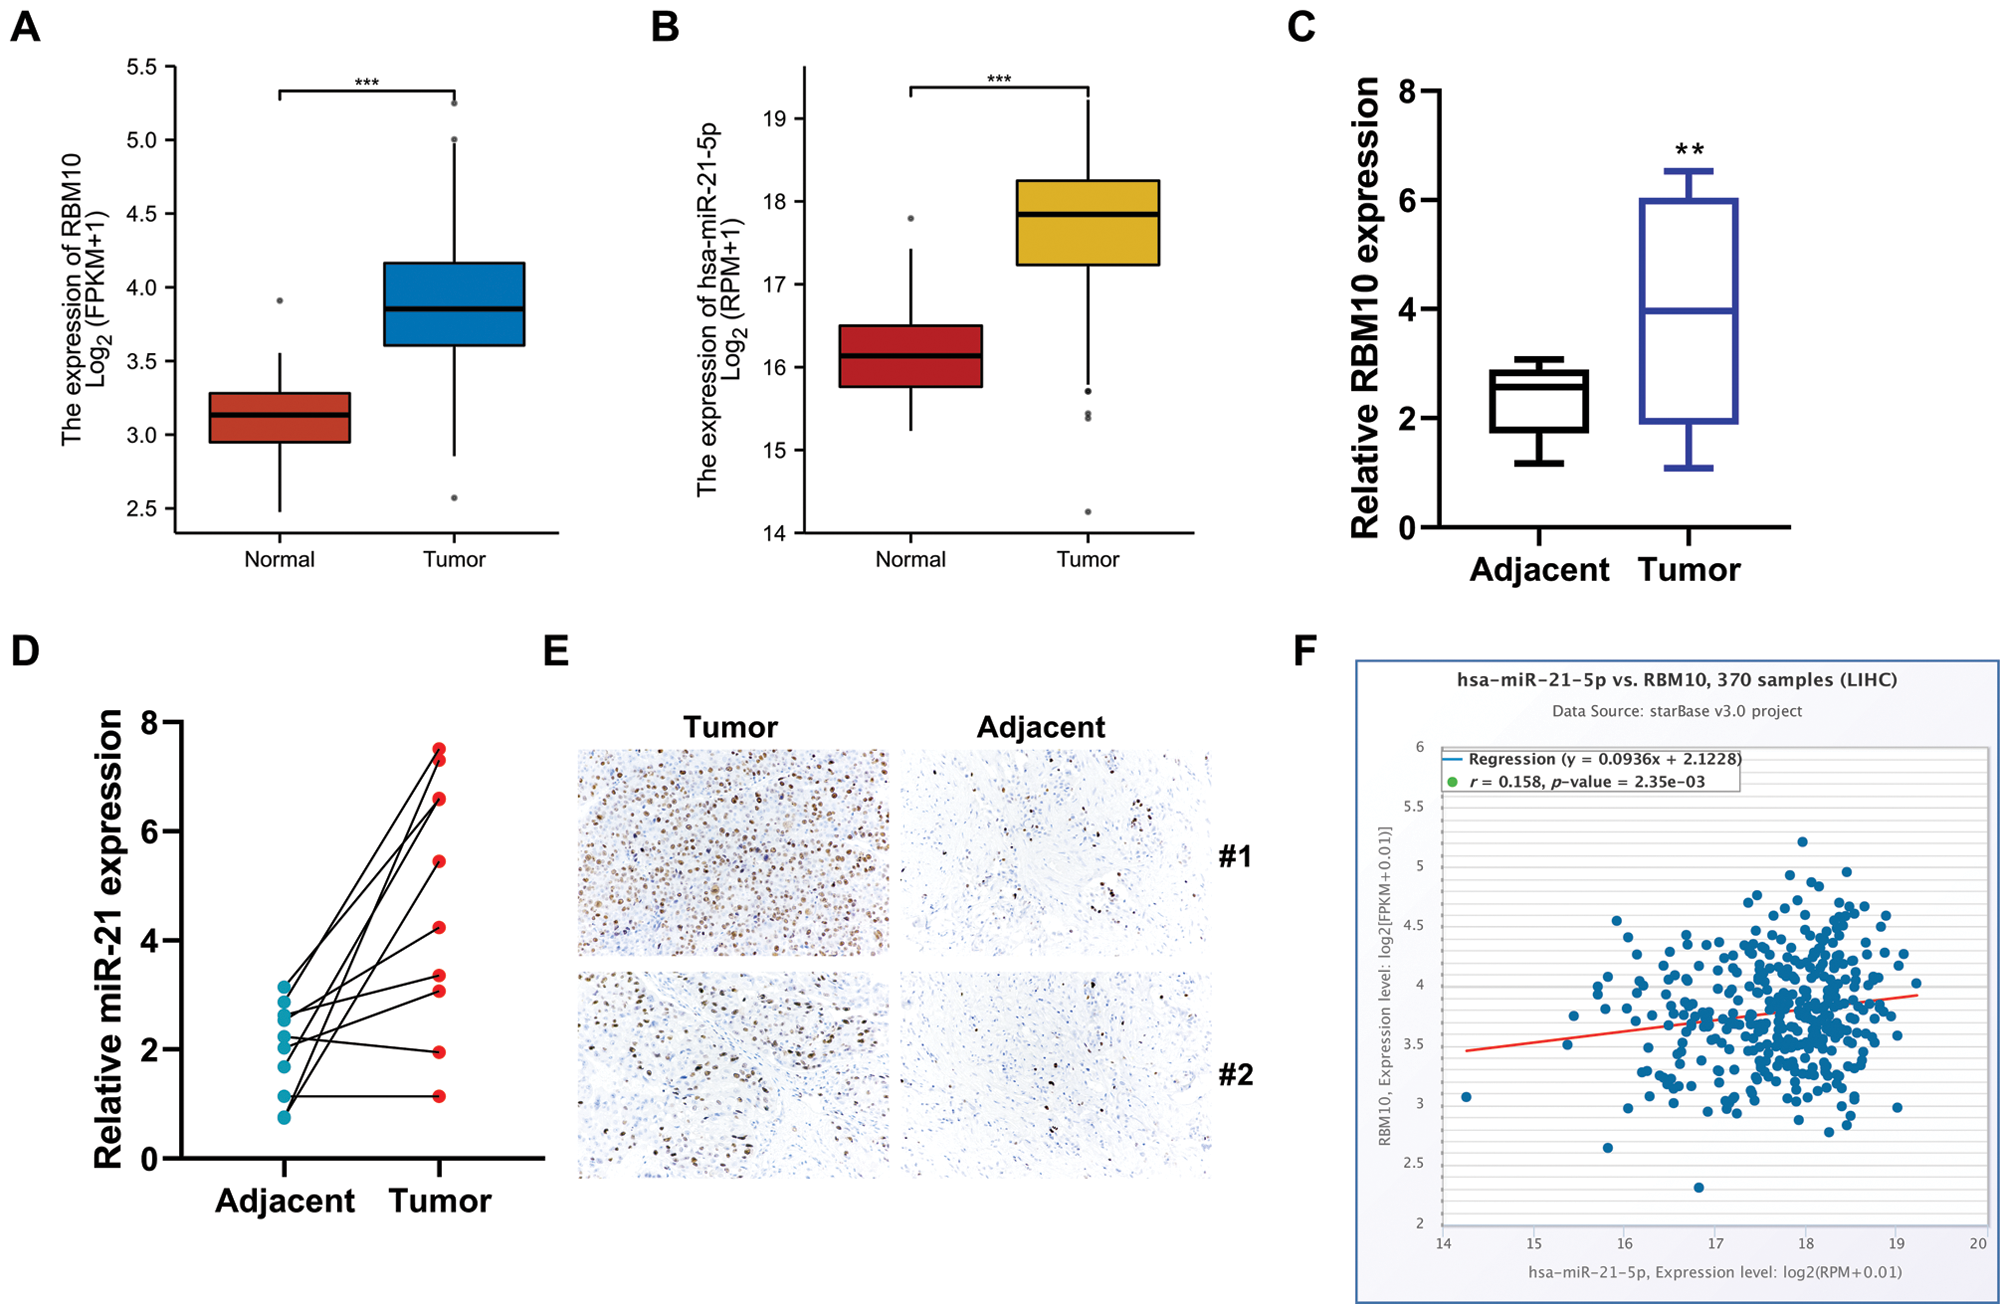
Figure 1: The expression levels of RBM10 and miR-21 in HCC tissues. (A–B) Analysis of RBM10 and miR-21 gene expression in different NSCLC samples using TCGA data. (C–D) Expression differences of RBM10 mRNA and miR-21 between HCC tissues and normal control tissues measured by quantitative PCR. (E) Protein expression differences of RBM10 and miR-21 between HCC tissues and normal control tissues detected by immunohistochemistry. (F) Co-expression analysis of miR-21 and RBM10 in HCC by using Starbase database. Paired t-test. *P < 0.05, **P < 0.01 and ***P < 0.001 compared with adjacent tissues group.
Expression correlation of miR-21 and RBM10 in HCC cells
Our subsequent analysis focused on the relative expression of RBM10 in human HCC cells (HepG2, SNU-398 and Hep 3B) and immortalized normal human hepatocytes (THLE-2). It was found that both the mRNA and protein expressions of RBM10 were significantly higher in HCC cells than those in normal hepatocytes (Figs. 2A and 2B). Similarly, the relative expression level of miR-21 in HCC cells was also much higher than that in THLE-2 cells (Fig. 2C). Furthermore, following the knockdown of RBM10 expression using siRNA in Hep 3B and SNU-398cells (Figs. 2D and 2E), there was also a decreased relative content of miR-21 (Figs. 2F and 2G). However, when using miR-21 inhibitor or siRNA targeting miR-21 primary transcript (pri-miR-21) to reduce the relative content of miR-21 (Fig. 2H), it produced no significant effect on the relative mRNA or protein expressions of RBM10 (Fig. 2I). Collectively, these results support that RBM10 may play a leading role in regulating the expression of miR-21 considering the correlation between the expression of miR-21 and RBM10 in HCC cells.
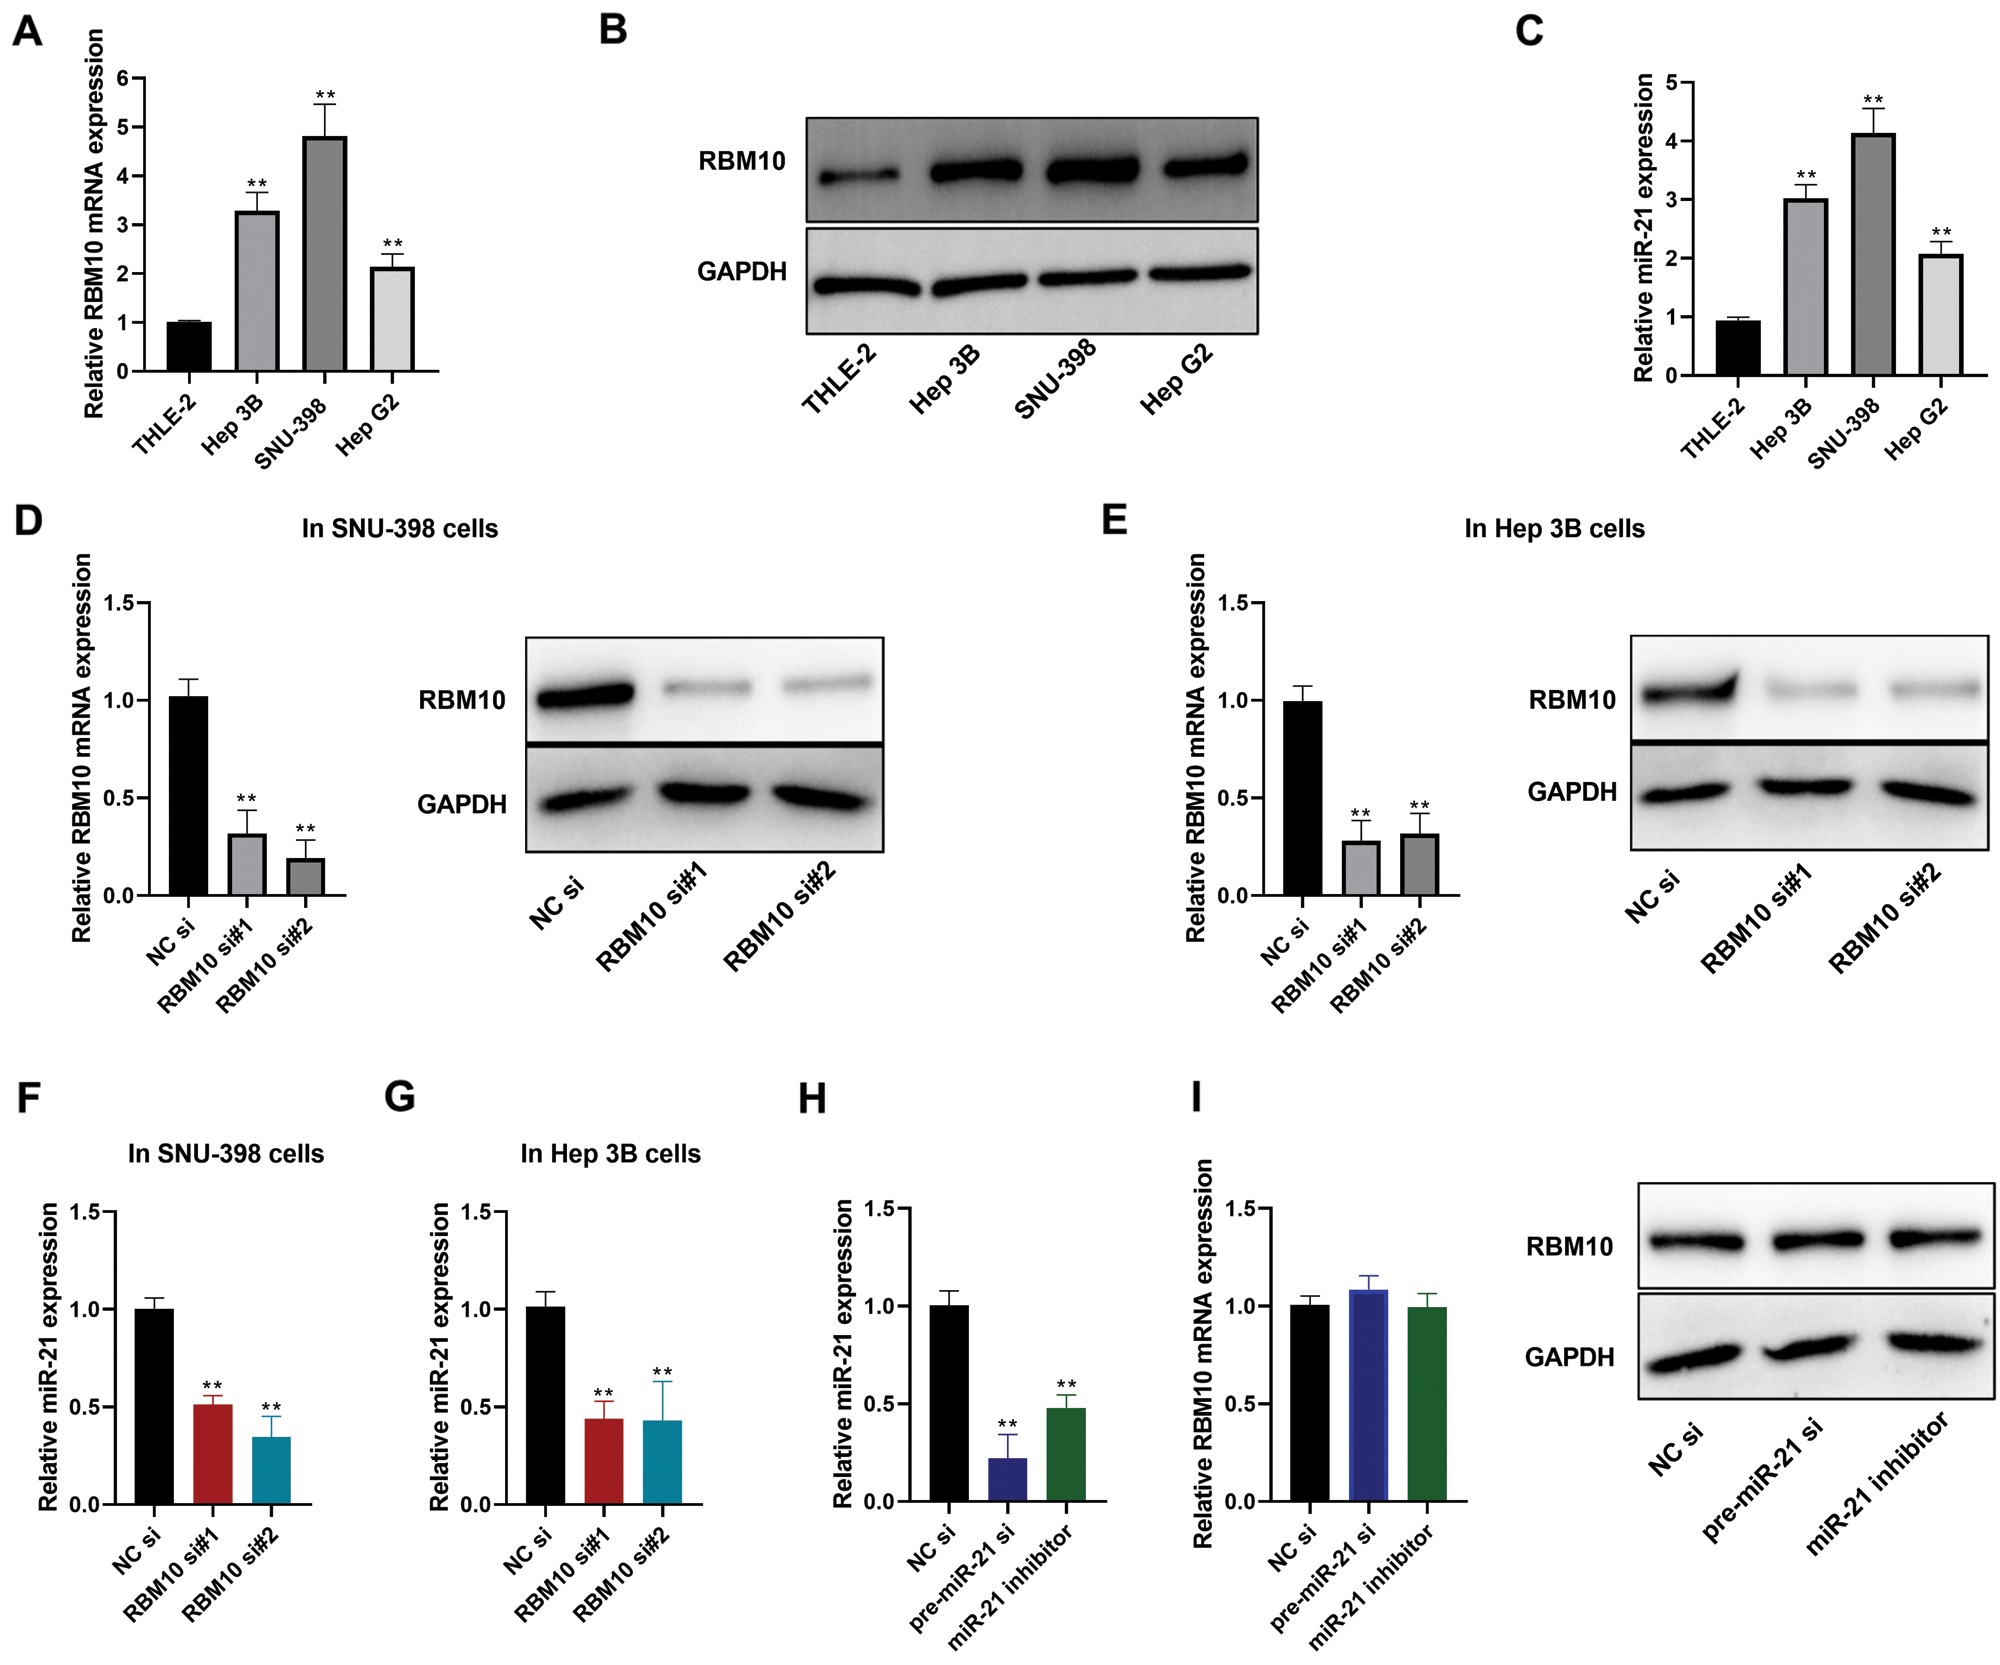
Figure 2: Expression of miR-21 and RBM10 in HCC cells. (A) Expression differences of RBM10 mRNA between HCC cells and normal hepatocytes measured by quantitative PCR. (B) Expression differences of RBM10 protein between HCC cells and normal hepatocytes measured by Western blot. (C) Expression differences of miR-21 between HCC cells and normal hepatocytes measured by quantitative PCR. (D–E) Expression of RBM10 mRNA (left) and protein (right) detected by quantitative PCR and Western blot after SNU-398 and Hep 3B cell transfection with siRNA (20 nM) for 48 h. (F–G) Expression of miR-21 detected by quantitative PCR after SNU-398 and Hep 3B cell transfection with siRNA (20 nM) for 48 h. (H) The relative abundance of mature miR-21 detected by quantitative PCR after SNU-398 cell transfection with NC siRNA (20 nM), pre-miR-21 siRNA (20 nM) or miR-21 inhibitor (60 nM) for 48 h. (I) Expression of RBM10 mRNA (left) and protein (right) detected by quantitative PCR and Western blot after SNU-398 cell transfection with NC siRNA (20 nM), pre-miR-21 siRNA (20 nM) or miR-21 inhibitor (60 nM) for 48 h. si, siRNA; si#1 and si#2, two different siRNA duplexes against RBM10. One-way ANOVA with Tukey post hoc analysis. *P < 0.05 and **P < 0.01.
Involvement of RBM10 in the regulation of proliferation, invasion and migration of HCC cells, and its association with miR-21
In SNU-398 cells, after transfection with RBM10 siRNA, there were slowed proliferation (Fig. 3A), as well as inhibited migration and invasion with the down-regulation of RBM10 expression (Figs. 3B and 3C). Nevertheless, the above inhibitory effect on SNU-398 cells was partially weakened after simultaneous transfection of miR-21 while using siRNA to downregulate RBM10 (Figs. 3A and 3C). In addition, overexpression of RBM10 in Hep G2 cells (Fig. 3D) resulted in significant enhancement of cell proliferation, migration and invasion (Figs. 3E and 3F). While the promoting effect of RBM10 on cell malignant characterization would be inhibited if cells were treated by miR-21 inhibitor at the same time. Subsequently, we found that with the down-regulation of RBM10 in SNU-398 cells, the relative expression levels of SPRY1 and PTEN (Ma et al., 2011; Tomimaru et al., 2010), the classic targets of miR-21 in tumors, would be up-regulated accordingly (Fig. 3G). Correspondingly, overexpression of RBM10 in Hep G2 cells led to further down-regulation of SPRY1 and PTEN (Fig. 3H). These results indicate that RBM10 may be involved in the regulation of proliferation, invasion and migration of HCC cells, and the regulatory pathway has an intimate association with miR-21.
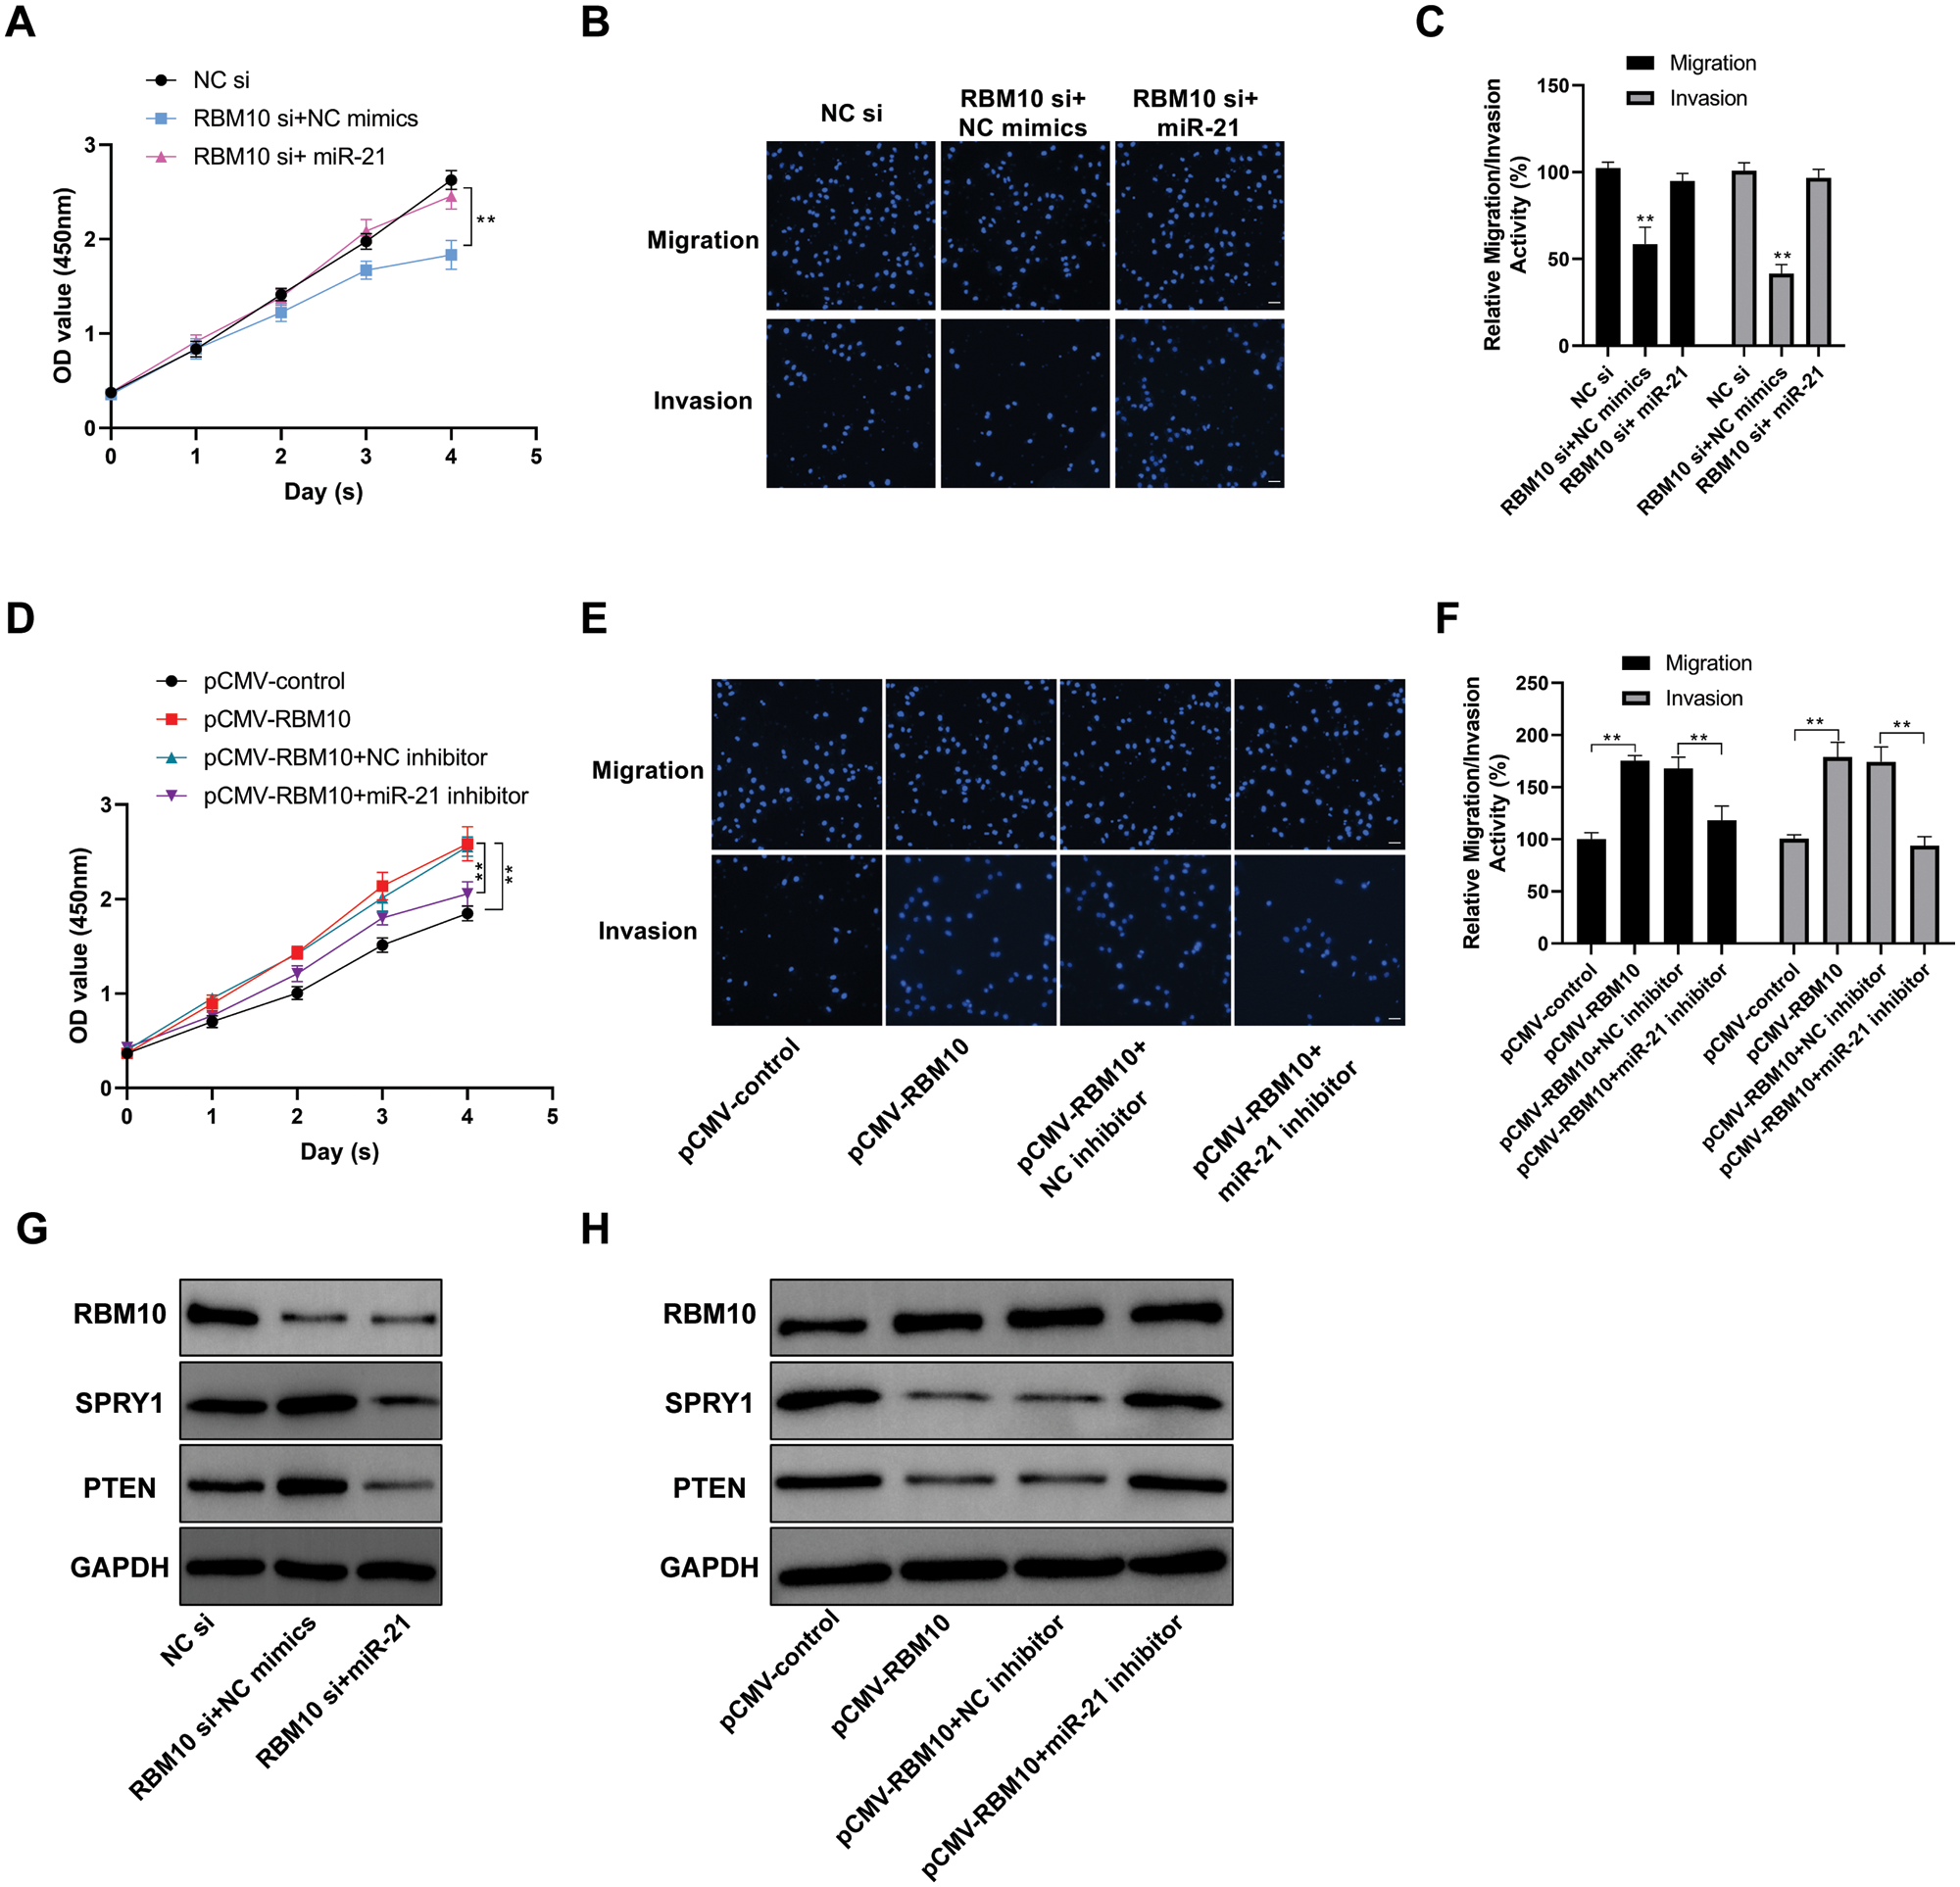
Figure 3: Involvement of RBM10 in the regulation of proliferation, invasion and migration of HCC cells. (A) Cell activity detected by CCK-8 at different time points after SNU-398 cell transfection with siRNA (20 nM) or miRNA mimics (20 nM) in each group. (B) Cell migration and invasion ability detected by Transwell assay after SNU-398 cell transfection with siRNA or miRNA mimics in each group. (C) The relative migration and invasion ability of cells in each group quantified by histogram. (D) Cell activity detected by CCK-8 at different time points after Hep G2 cell transfection with different expression plasmids (1 μg/well in a 24-well plate) or miRNA inhibitor (60 nM) in each group. (E–F) Cell migration ability detected by Transwell assay after Hep G2 cell transfection with different expression plasmids or miRNA inhibitor in each group for 24 h. (G) Expression of related protein detected by Western blot after SNU-398 cell transfection with siRNA or miRNA mimics in each group. (H) Expression of related protein detected by Western blot after Hep G2 cell transfection with different expression plasmids or miRNA inhibitor in each group. Comparisons among groups were determined by one-way ANOVA with Tukey post-hoc analysis. *P < 0.05 and **P < 0.01.
Regulatory effect of RBM10 on the stability of miR-21 in HCC cells
After treatment of SNU-398 cells with RBM10 siRNA, the relative content of miR-21 was down-regulated accordingly (Fig. 2F). Further detection revealed that the change of RBM10 content produced no significant effect on the primary transcript (pri-miR-21) and precursor (pre-miR-21) of miR-21 (Figs. 4A and 4B). These results suggest that RBM10 may regulate the expression of miR-21 at the post-transcriptional level. In our next exploration, RNA stability test was carried out by using Actinomycin D to treat cells. It was found that the stability of mature miR-21 decreased significantly after the downregulation of RBM10 by siRNA (Fig. 4C). In SNU-398 cells, mature miR-21 could also be immunoprecipitated by using RBM10 antibody, rather than pri-miR-21 or pre-miR-21 (Fig. 4D). The aforementioned experimental results may support that RBM10 affects the relative content of miR-21 by regulating the stability of mature miR-21.
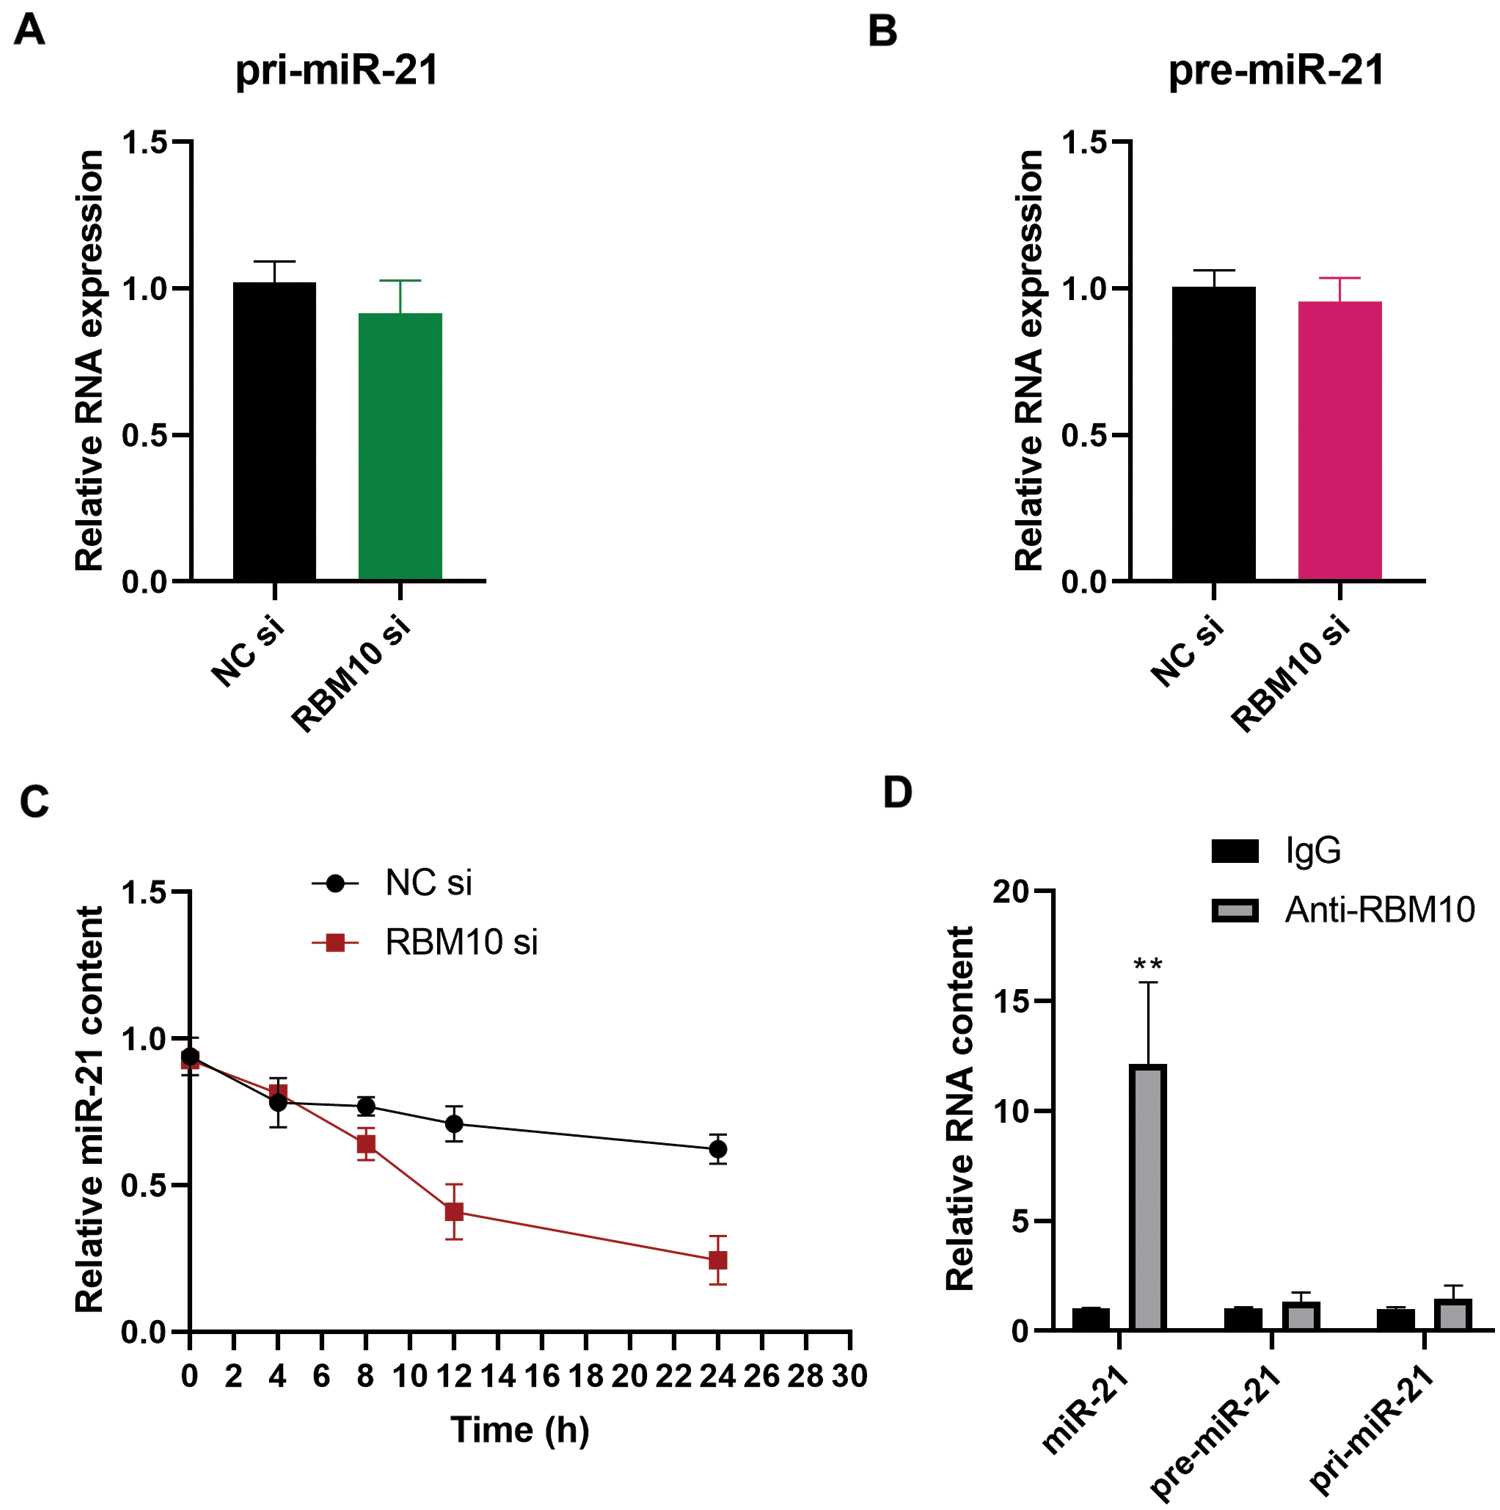
Figure 4: Regulatory effect of RBM10 on the stability of miR-21 in HCC cells. (A–B) The relative contents of pri-miR-21 and pre-miR-21 detected by quantitative PCR after SNU-398 cell transfection with RBM10 siRNA for 48 h. (C) The relative contents of miR-21 at different time points (0, 4, 8, 12, and 24 h) detected by quantitative PCR following cell treatment with Actinomycin D (10 mg/L) after SNU-398 cell transfection with NC siRNA or RBM10 siRNA for 24 h. (D) The relative abundance of miR-21, pre-miR-21 and pri-miR-21 detected by quantitative PCR after immunoprecipitation using RBM10 antibody in SNU-398 cells with IgG as the control antibody. One-way ANOVA with Tukey post hoc analysis. *P < 0.05 and **P < 0.01.
However, RBM10 was mainly located in the nucleus (Fig. 5A), while miR-21 was theoretically located in the cytoplasm (Hug et al., 2015). In this regard, there might be a relatively low chance and effect of RBM10 binding miR-21 and regulating its stability. At this stage, a speculation was proposed that whether its regulatory effect on miR-21 be enhanced if the cellular localization of RBM10 was artificially changed? The fusion expression vectors of wild-type and mutant-type RBM10 with GFP was obtained firstly, in which the mutant-type RBM10 had an absence of the nuclear localization signal (NLS) (Fig. 5B). In HepG2 cells, with the overexpression of RBM10, wild-type RBM10 was mainly located in the nucleus, while the mutant-type RBM10 was more evenly distributed in the whole cell (Figs. 5C and 5D). Interestingly, the proliferation and migration ability of cells overexpressing mutant-type RBM10 was significantly stronger than that of the wild-type (Figs. 5E–5G). Simultaneously, the relative content of mature miR-21 was significantly higher in cells with overexpression of mutant-type RBM10 than that in the wild-type group and the control group (Fig. 5H). However, there was no significant difference in the relative content of pre-miR-21 and pri-miR-21 among groups (Fig. 5I).
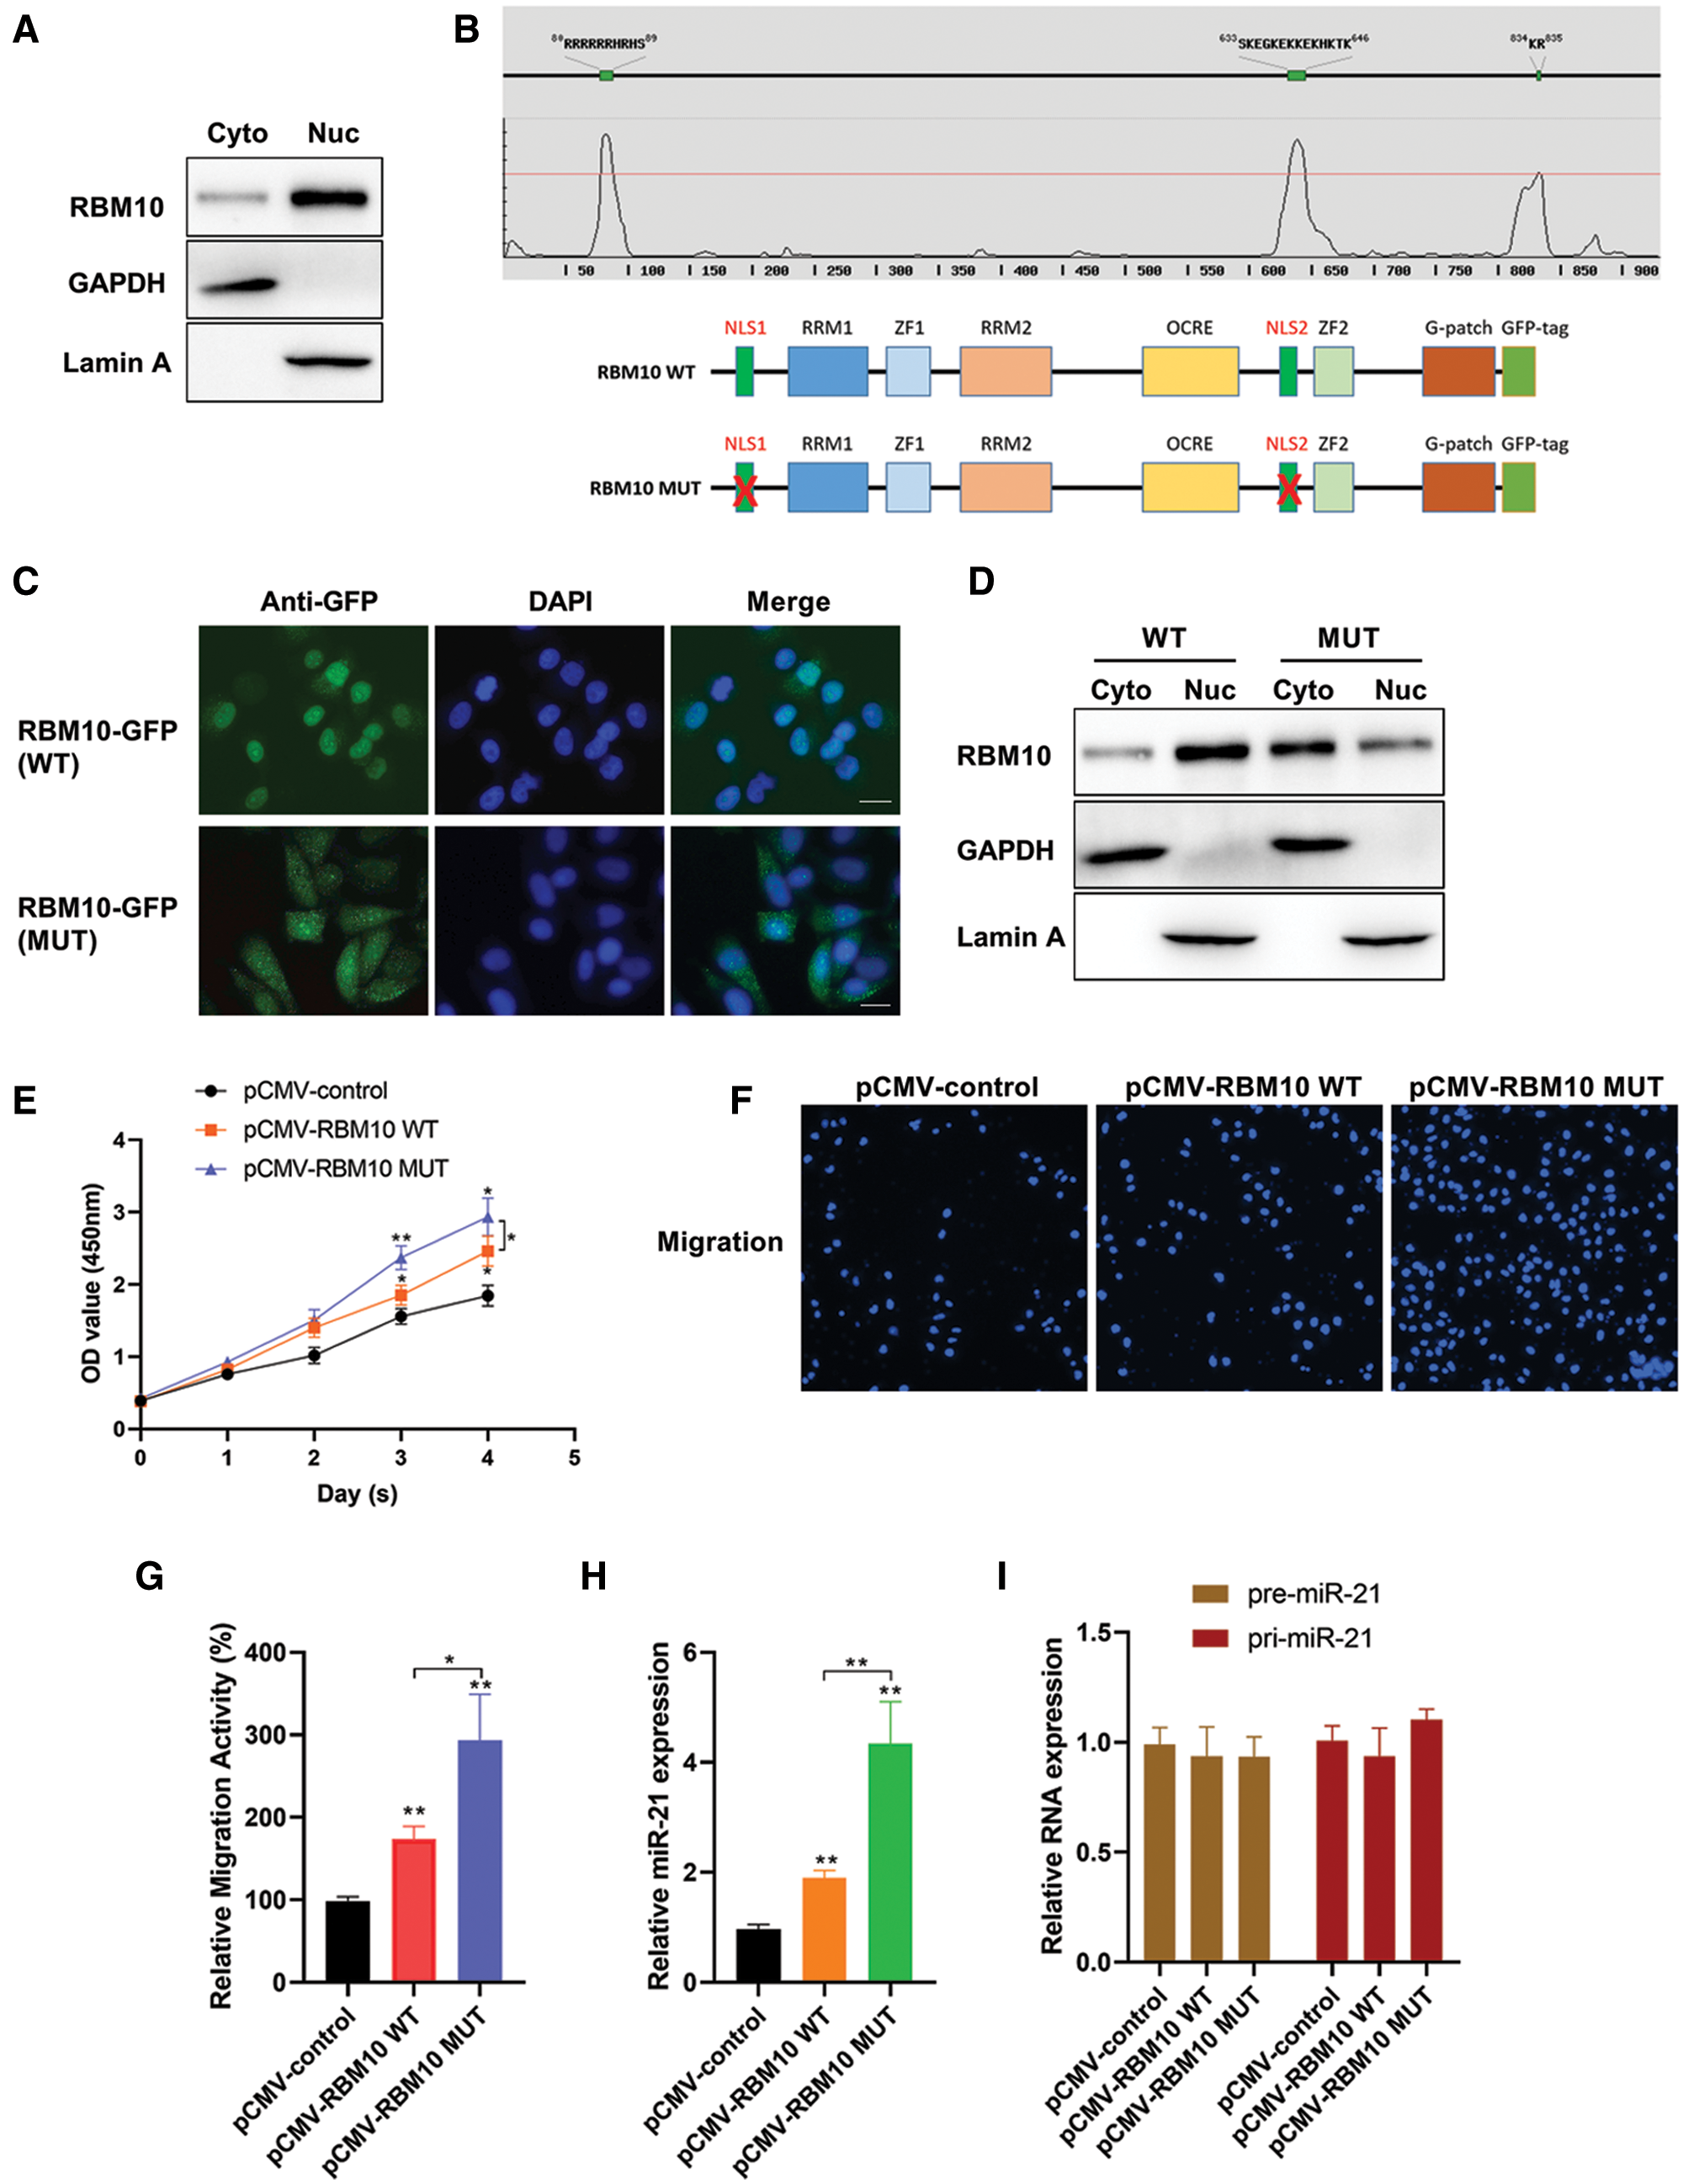
Figure 5: Analysis of biological function of RBM10 with deletion of nuclear localization signal. (A) The relative content of RBM10 in the cytoplasm and nucleus of SNU-398 cells, with GAPDH and Lamin A as the reference proteins in cytoplasm and nucleus, respectively. (B) The nuclear location signal region of RBM10 predicted by online NLStradamus (http://www.moseslab.csb.utoronto.ca/NLStradamus/) (top); Construction of RBM10 expression vector with nuclear localization signal deletion mutation (bottom). (C) The subcellular localization of wild-type and mutant-type RBM10-GFP fusion protein analyzed under fluorescence microscopy after Hep G2 cell transfection with RBM10 overexpression plasmids. (D) Distribution difference of wild-type and mutant-type RBM10 in the cytoplasm and nucleus analyzed by Western blot following the extraction of cytoplasmic and nuclear proteins after 48 h of HepG2 cell transfection with RBM10 overexpression plasmids. GAPDH and Lamin served as a loading control for cytoplasmic and nuclear fractions respectively. (E) Cell activity detected by CCK-8 at different time points after Hep G2 cell transfection with RBM10 expression plasmids. (F–G) Cell migration ability detected by Transwell assay after Hep G2 cell transfection with different expression plasmids in each group for 24 h. (H–I) The relative content of miR-21, pre-miR-21 and pri-miR-21 detected by quantitative PCR after Hep G2 cell transfection with different expression plasmids in each group for 24 h. One-way ANOVA with Tukey post hoc analysis. *P < 0.05 and **P < 0.01.
Promoting effect of RBM10 on tumor growth in vivo
In order to identify the effect of RBM10 on tumor occurrence and development in vivo, luciferase-labeled HepG2 HCC cells were transfected with wild-type or mutant-type RBM10 plasmids and injected subcutaneously into NOD-SCID mice to construct xenograft tumor model. According to the results of in vivo imaging 4 weeks later, the bioluminescence intensity of the two groups with RBM10 overexpression was significantly higher than that of the control group; besides, the bioluminescence intensity of mutant-type RBM10 group lacking NLS was higher than that of wild-type RBM10 group (Figs. 6A and 6B). Afterwards, the subcutaneous tumor was dissected and weighed, and the results of measurement showed that the subcutaneous tumor weight of mutant-type RBM10 group was significantly higher than that of the other two groups (Fig. 6C), which were consistent with the difference of bioluminescence intensity. The above results suggest that the abnormal high expression of RBM10 in HCC cells can really promote tumor growth, and RBM10 with the absence of nuclear localization control may result in a higher growth rate of tumor.
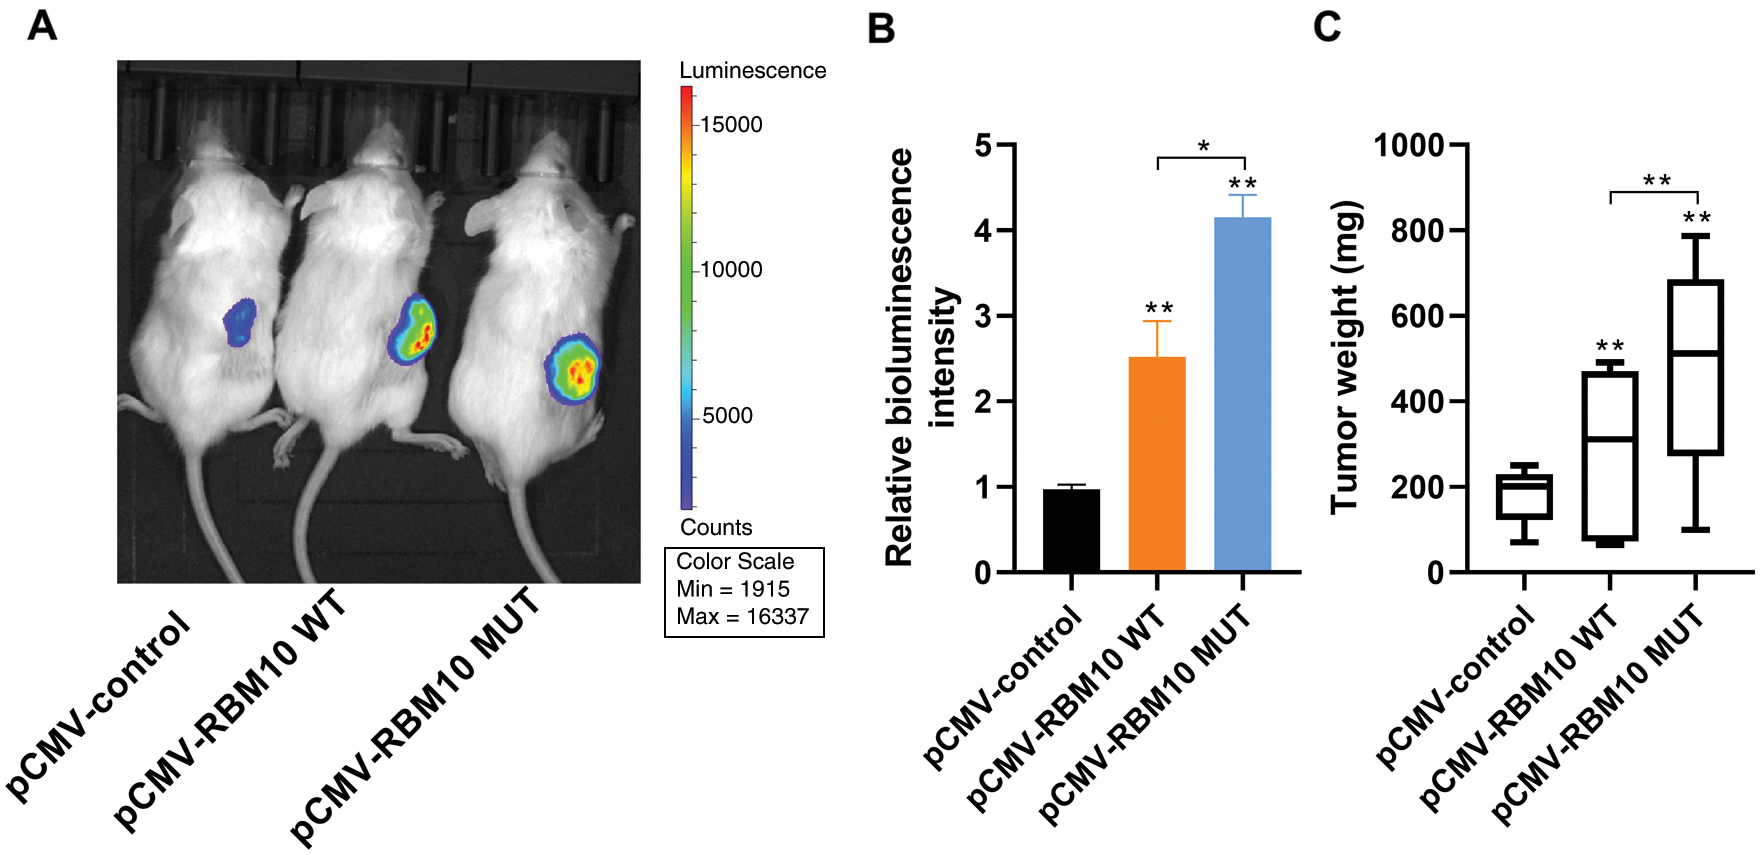
Figure 6: Promoting effect of RBM10 on tumor growth in vivo. (A–B) Xenotransplantation of luciferase-labeled Hep G2 HCC cells into NOD-SCID mice subcutaneously after transfection of different plasmids in each group. Detection of the bioluminescence intensity of subcutaneous tumor by in vivo imaging at the 4th week; (C) Comparison of tumor weight of mice in each group. One-way ANOVA with Tukey post hoc analysis. *P < 0.05 and **P < 0.01.
RBM is a newly discovered RNA binding protein motif family which share similar structure and function (Wang et al., 2018). It is a subgroup of RRB/RBM/RNP proteins officially named by the HUGO Gene Nomenclature Committee. It has been revealed that RBM can bind to RNA, which exhibits an association with the splicing, translation and stability of mRNA (Dreyfuss et al., 2002). In particular, it plays an important role in the regulation of apoptotic cells, which has attracted considerable attentions. In generally, RBM consists of RNA recognition motif (RRM), a common sequence RNA binding domain (CS-RBD), a ribonucleo-protein (RNP) and an RNP common sequence (RNP-CS) (Sutherland et al., 2005). These structures may contribute to the involvement of RBM protein in pre-mRNA processing, mRNA splicing, mRNA stability and translation.
With the advancement of research, there are increasingly more members reported in the RBM family, mainly including RBMY, RBM3, RBM5, RBM6, RBM10, RBM12 and RBM15. Among them, both RBM10 and RBM5 have D111/G-patch and a zinc finger structure, indicating a high overlap between the two proteins (Sutherland et al., 2005). According to the present studies, RBM5 is involved in various cellular biological functions and associated strongly the growth and development of tumors, which is considered to be a potential tumor suppressor gene. Besides, it is a type of protein distributed in the nucleus and has the function of recognizing and binding mRNA. RBM5 can participate in mRNA translation, gene expression regulation, as well as cell proliferation and cell cycle regulation, Meanwhile, it is currently recognized that its most important feature is to inhibit the growth of tumor cells by regulating apoptosis (Bonnal et al., 2008; Fushimi et al., 2008; Oh et al., 2006). So far, there is relatively rare research on RBM10. Initial research reported that RBM10 had mutation in some tumors (Bailey et al., 2016; Giannakis et al., 2016; Nordentoft et al., 2014), and a speculated association was established with tumors, revealing the role of RBM10 as a tumor suppressor (Bechara et al., 2013; Hernández et al., 2016; Wang et al., 2012). However, accumulated evidence recently supports that RBM10 has a tumor promoting effect (Loiselle et al., 2017; Rodor et al., 2017). These opposite results suggest the need to not only understand the downstream outcomes of RBM10 expression, but also determine the mechanism responsible for regulating RBM10 itself. Moreover, function research of RBM10 shall depend on the specific environment.
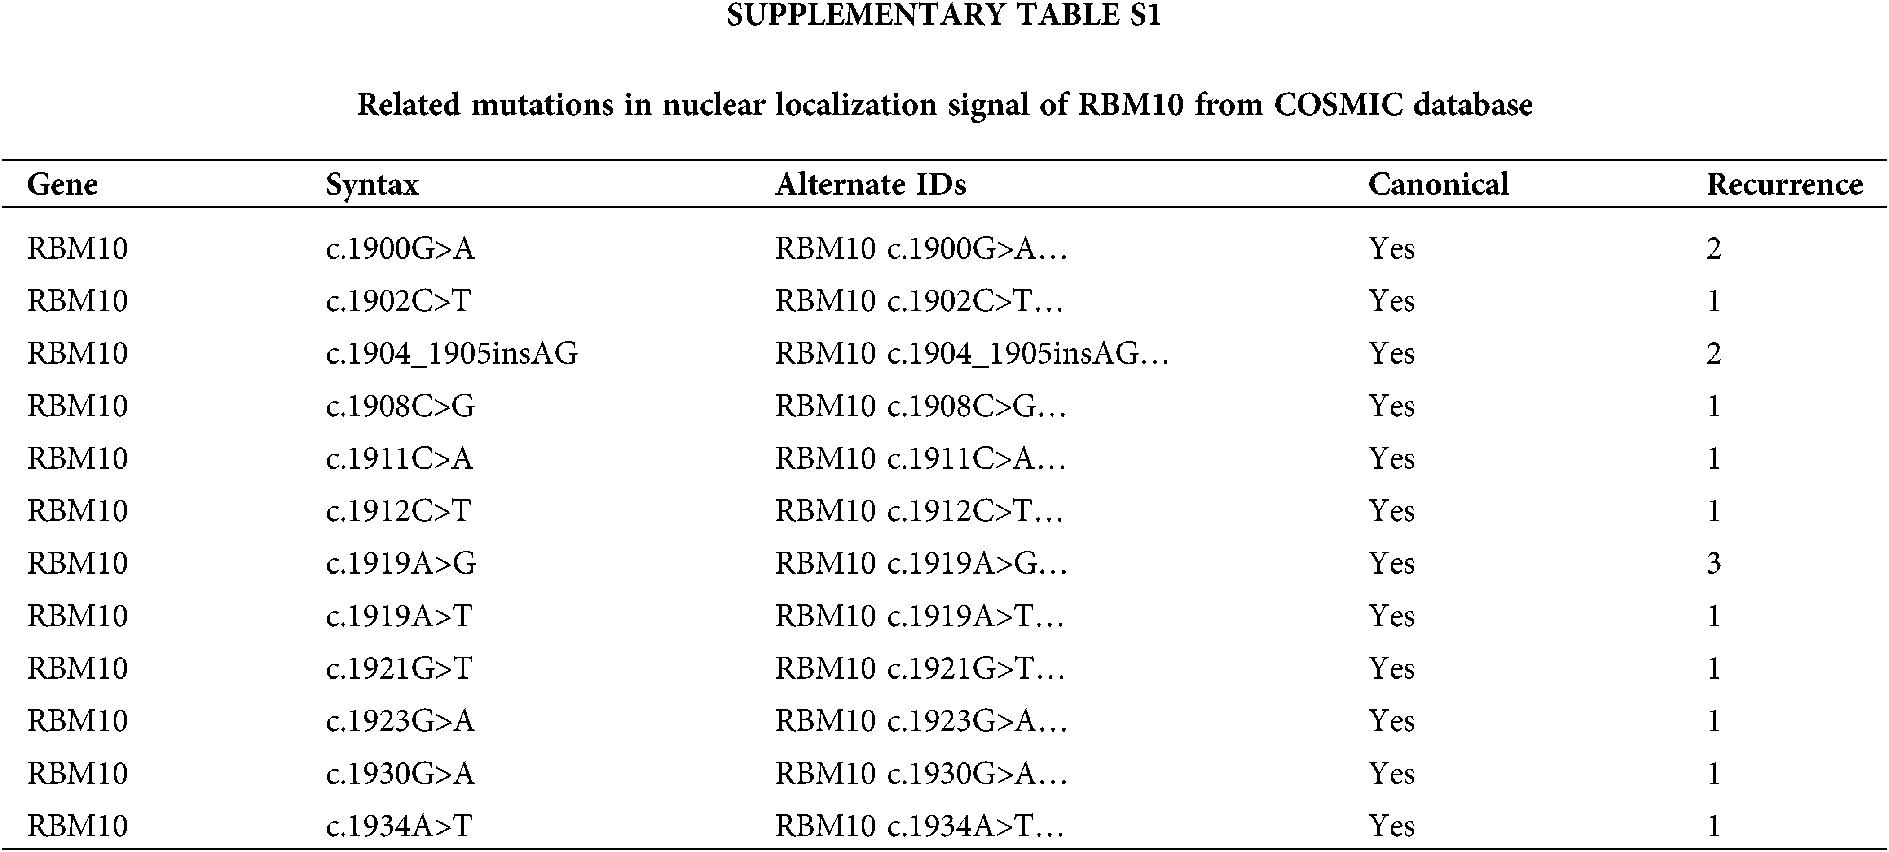
In our study, in the HCC model, there were high expressions of RBM10 and miR-21 in HCC based on online TCGA data, with further confirmation of their co-expression correlation in HCC cells, and subsequent clarification of the effect of RBM10 on HCC cell proliferation, migration and invasion by regulating the stability of miR-21. The concern is that, with the removal of the NLS of RBM10 artificially, it shall theoretically give more opportunities for interaction between RBM10 and miR-21. As a matter of factor, RBM10 with the absence of nuclear localization restriction exhibited stronger tumor promoting effect both in vivo and in vitro. Furthermore, COSMIC database (https://cancer.sanger.ac.uk/cosmic) was searched with the discovery of multiple RBM10 mutations at NLS in cancer patients (Suppl Table S1). Whether these mutations can really affect the nuclear localization and distribution of RBM10, and enhance the function of miR-21? These are the research directions we are concerned greatly. Meanwhile, as an RNA binding protein, does RBM10 directly interact with miR-21? Does the regulatory pattern of RBM10 and miR-21 exist in other tumors? Do other members of RBM10 family also possess the ability to regulate miRNA? These problems need to be studied in the future, so as to reveal the complexity of miRNA regulatory network and the functional diversity of the RBM family.
Authors’ Contribution: LJ, KZ and WZ conceived and designed the project; HZ and DW devoted to the collection of clinical samples; LJ, KZ and CH performed experiments and analyzed data; LJ and KZ interpreted the results and wrote the paper. All authors read and approved the fnal manuscript.
Availability of Data and Material: The data used to support the findings of this study are included within the article. The data and materials in the current study are available from the corresponding author on reasonable request.
Ethics Approval: This study was approved by the Ethics Committee of Beijing Ditan Hospital, Capital Medical University (#2017-050-01).
Funding Statement: This research was supported by National Natural Science Foundation of China, No. 31970566.
Conflicts of Interest: The authors declare that they have no conflicts of interest to report regarding the present study.
Arghiani N, Matin MM (2021). miR-21: A key small molecule with great effects in combination cancer therapy. Nucleic Acid Therapeutics (Ahead of print). DOI 10.1089/nat.2020.0914. [Google Scholar] [CrossRef]
Bailey P, Chang DK, Nones K, Johns AL, Patch AM et al. (2016). Genomic analyses identify molecular subtypes of pancreatic cancer. Nature 531: 47–52. [Google Scholar]
Bechara EG, Sebestyén E, Bernardis I, Eyras E, Valcárcel J (2013). RBM5, 6, and 10 differentially regulate NUMB alternative splicing to control cancer cell proliferation. Molecular Cell 52: 720–733. [Google Scholar]
Bertoli G, Cava C, Castiglioni I (2015). MicroRNAs: New biomarkers for diagnosis, prognosis, therapy prediction and therapeutic tools for breast cancer. Theranostics 5: 1122. [Google Scholar]
Bica-Pop C, Cojocneanu-Petric R, Magdo L, Raduly L, Gulei D et al. (2018). Overview upon miR-21 in lung cancer: Focus on NSCLC. Cellular and Molecular Life Sciences 75: 3539–3551. [Google Scholar]
Bonnal S, Martínez C, Förch P, Bachi A, Wilm M, Valcárcel J (2008). RBM5/Luca-15/H37 regulates Fas alternative splice site pairing after exon definition. Molecular Cell 32: 81–95. [Google Scholar]
Bushati N, Cohen SM (2007). microRNA functions. Annual Review of Cell and Developmental Biology 23: 175–205. [Google Scholar]
Cao Y, Di X, Zhang Q, Li R, Wang K (2021). RBM10 regulates tumor apoptosis, proliferation, and metastasis. Frontiers in Oncology 11: 158. [Google Scholar]
Dreyfuss G, Kim VN, Kataoka N (2002). Messenger-RNA-binding proteins and the messages they carry. Nature Reviews Molecular Cell Biology 3: 195–205. [Google Scholar]
Fujita S, Ito T, Mizutani T, Minoguchi S, Yamamichi N et al. (2008). miR-21 gene expression triggered by AP-1 is sustained through a double-negative feedback mechanism. Journal of Molecular Biology 378: 492–504. [Google Scholar]
Fushimi K, Ray P, Kar A, Wang L, Sutherland LC et al. (2008). Up-regulation of the proapoptotic caspase 2 splicing isoform by a candidate tumor suppressor, RBM5. Proceedings of the National Academy of Sciences of the United States of America 105: 15708–15713. [Google Scholar]
Giannakis M, Mu XJ, Shukla SA, Qian ZR, Cohen O et al. (2016). Genomic correlates of immune-cell infiltrates in colorectal carcinoma. Cell Reports 15: 857–865. [Google Scholar]
Hernández J, Bechara E, Schlesinger D, Delgado J, Serrano L et al. (2016). Tumor suppressor properties of the splicing regulatory factor RBM10. RNA Biology 13: 466–472. [Google Scholar]
Hug KA, Anthony L, Eldeiry D, Benson J, Wheeler E et al. (2015). Expression and tissue distribution of MicroRNA-21 in malignant and benign breast tissues. Anticancer Research 35: 3175–3183. [Google Scholar]
Inoue A (2021). RBM10: Structure, functions, and associated diseases. Gene 783: 145463. [Google Scholar]
Krichevsky AM, Gabriely G (2009). miR-21: A small multi-faceted RNA. Journal of Cellular and Molecular Medicine 13: 39–53. [Google Scholar]
Krol J, Loedige I, Filipowicz W (2010). The widespread regulation of microRNA biogenesis, function and decay. Nature Reviews Genetics 11: 597–610. [Google Scholar]
Kumarswamy R, Volkmann I, Thum T (2011). Regulation and function of miRNA-21 in health and disease. RNA Biology 8: 706–713. [Google Scholar]
Lagos-Quintana M, Rauhut R, Lendeckel W, Tuschl T (2001). Identification of novel genes coding for small expressed RNAs. Science 294: 853–858. [Google Scholar]
Loiselle JJ, Roy JG, Sutherland LC (2017). RBM10 promotes transformation-associated processes in small cell lung cancer and is directly regulated by RBM5. PLoS One 12: e0180258. [Google Scholar]
Ma X, Kumar M, Choudhury SN, Buscaglia LEB, Barker JR et al. (2011). Loss of the miR-21 allele elevates the expression of its target genes and reduces tumorigenesis. Proceedings of the National Academy of Sciences of the United States of America 108: 10144–10149. [Google Scholar]
Medina PP, Nolde M, Slack FJ (2010). OncomiR addiction in an in vivo model of microRNA-21-induced pre-B-cell lymphoma. Nature 467: 86–90. [Google Scholar]
Nordentoft I, Lamy P, Birkenkamp-Demtröder K, Shumansky K, Vang S et al. (2014). Mutational context and diverse clonal development in early and late bladder cancer. Cell Reports 7: 1649–1663. [Google Scholar]
Oh JJ, Razfar A, Delgado I, Reed RA, Malkina A et al. (2006). 3p21. 3 tumor suppressor gene H37/Luca15/RBM5 inhibits growth of human lung cancer cells through cell cycle arrest and apoptosis. Cancer Research 66: 3419–3427. [Google Scholar]
Panagal M, Senthil Kumar SR, Sivakurunathan P, Biruntha M, Karthigeyan M et al. (2018). MicroRNA21 and the various types of myeloid leukemia. Cancer Gene Therapy 25: 161–166. [Google Scholar]
Rodor J, Fitzpatrick DR, Eyras E, Cáceres JF (2017). The RNA-binding landscape of RBM10 and its role in alternative splicing regulation in models of mouse early development. RNA Biology 14: 45–57. [Google Scholar]
Sutherland LC, Rintala-Maki ND, White RD, Morin CD (2005). RNA binding motif (RBM) proteins: A novel family of apoptosis modulators? Journal of Cellular Biochemistry 94: 5–24. [Google Scholar]
Sutherland LC, Wang K, Robinson AG (2010). RBM5 as a putative tumor suppressor gene for lung cancer. Journal of Thoracic Oncology 5: 294–298. [Google Scholar]
Tomimaru Y, Eguchi H, Nagano H, Wada H, Tomokuni A et al. (2010). MicroRNA-21 induces resistance to the anti-tumour effect of interferon-α/5-fluorouracil in hepatocellular carcinoma cells. British Journal of Cancer 103: 1617–1626. [Google Scholar]
Wang K, Bacon ML, Tessier JJ, Rintala-Maki ND, Tang V et al. (2012). RBM10 modulates apoptosis and influences TNF-α gene expression. Journal of Cell Death 5: 1–19. [Google Scholar]
Wang ZL, Li B, Luo YX, Lin Q, Liu SR et al. (2018). Comprehensive genomic characterization of RNA-binding proteins across human cancers. Cell Reports 22: 286–298. [Google Scholar]
 | This work is licensed under a Creative Commons Attribution 4.0 International License, which permits unrestricted use, distribution, and reproduction in any medium, provided the original work is properly cited. |