DOI:10.32604/biocell.2022.018347
| BIOCELL DOI:10.32604/biocell.2022.018347 | |
| Article |
Analysis of specific lipid metabolites in cord blood of patients with gestational diabetes mellitus
Obstetrics Department, Maternal and Child Health Hospital of PanYu District, Guangzhou, 511483, China
*Address correspondence to: Yanqiu Li, liyanqiu1977@163.com
#Authors contributed equally
Received: 18 July 2021; Accepted: 16 September 2021
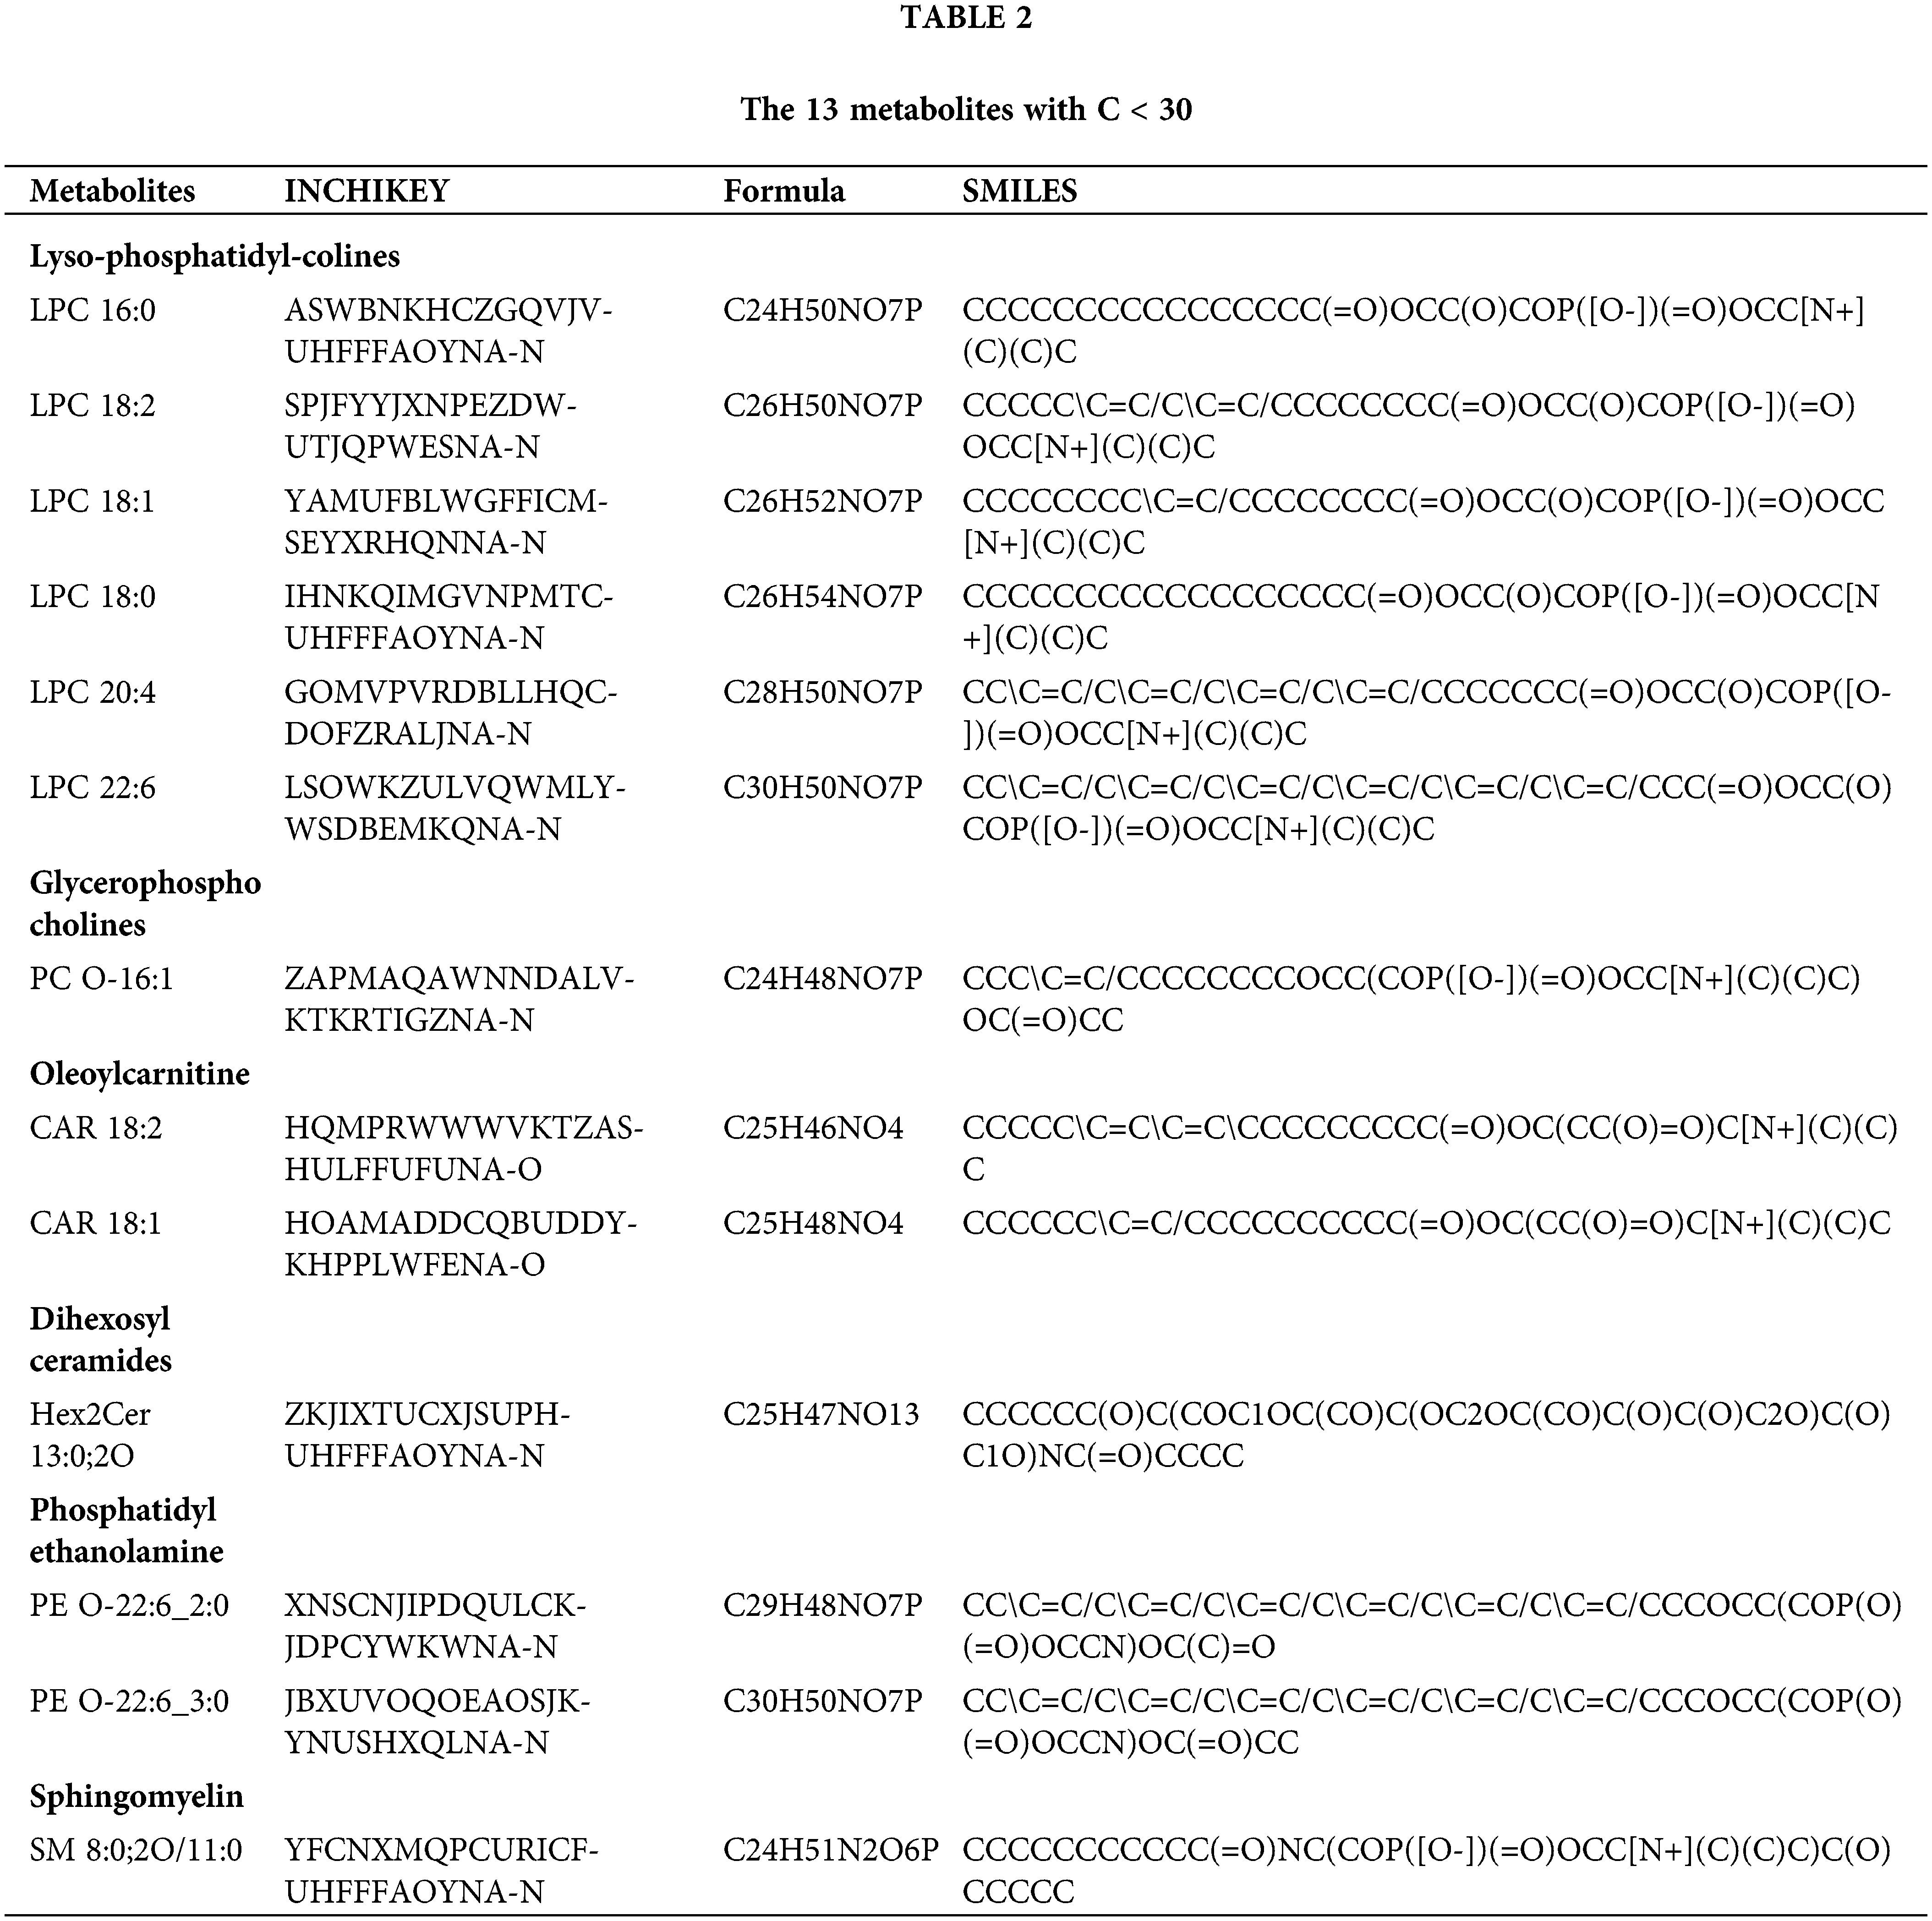
Abstract: This work aimed to clarify the interaction between the fetus and pregnant patients with gestational diabetes mellitus (GDM), the lipid metabolomics analysis of the fetal umbilical cord blood of GDM patients and normal pregnant women were performed to screen out the specific lipid metabolites for pathogenesis of GDM. From 2019–2020, 21 patients with GDM and 22 normal pregnant women were enrolled in Hexian Memorial Hospital, Panyu District, Guangzhou. The general information such as weight, height, age, body mass index (BMI) before pregnancy were analyzed. Non-targeted metabonomic detection and analysis were performed in umbilical cord plasma using LC-MS method. The age, BMI, delivery methods, and infant weight were different between GDM and control. There were 167 lipid metabolites in umbilical cord blood associated with GDM. Among them, 158 upregulated and 9 downregulated in GDM. There were 13 dysregulated metabolites with C < 30, including Lyso-phosphatidyl-colines LPC 16:0, 18:2, 18:1, 18:0, 20:4 and 22:6, glycerophosphocholines PC O-16:1, oleoylcarnitine CAR 18:2 and 18:1, dihexosylceramides Hex2Cer 13:0;2O, phosphatidylethanolamine PE O-22:6_2:0 and PE O-22:6_3:0 and sphingomyelin SM 8:0; 2O/11:0. Those metabolites were associated with glycerophospholipid metabolism and sphingolipid metabolism. Therefore, Lyso-phosphatidyl-colines, glycerophosphocholines, oleoylcarnitine, dihexosylceramides, phosphatidylethanolamine, and sphingomyelin were main lipid metabolites of GDM, which might be used for diagnosis and treatment of GDM.
Keywords: Lipid; Metabolite; Gestational diabetes mellitus; Pregnancy; Infant
Gestational diabetes mellitus (GDM) is a type of diabetes that occurs or is discovered during pregnancy in women without a history of diabetes. It is a special type of diabetes mellitus (American Diabetes Association, 2019). GDM has a high incidence rate of 17.8% in pregnant women (Sacks et al., 2012), which may increase the risk of type 2 diabetes (Song et al., 2018). 90% of pregnant women with diabetes have GDM. GDM has a serious adverse effect on the health of offspring through genetic and environmental mechanisms that are not yet fully understood (Johns et al., 2018). GDM has been found to be associated with the incidence of diabetes in children and youth. In the offspring of GDM mothers, the incidence rate of diabetes increased significantly from childhood to adolescence compared with offspring of healthy mothers (Blotsky et al., 2019). Studies have shown that fetal gender (Jaskolka et al., 2015) and fetal gene (Petry et al., 2011) are associated with glucose concentration during pregnancy, which may regulate the risk of GDM in pregnant women.
There is increasing evidence that the fetus is not only passively affected by pregnancy diseases but may also play an active role. It has been found that phosphatidylcholinyl C32:1 and proline metabolites in umbilical cord blood of infants have potential effects on maternal hypertension in pregnancy (Lu et al., 2018). The results from the PREOBE cohort study showed that BMI index and GDM changed the metabolic spectrum of umbilical cord blood (Shokry et al., 2019). The total HETE concentration in the placenta of pregnant women with insulin-dependent diabetes mellitus increased significantly (Kuhn et al., 1990). GDM is also associated with placental hypersecretion of proinflammatory cytokines (Kikut et al., 2020; Szczuko et al., 2020). Increased levels of cord serum insulin were found in complicated pregnancies as well as in patients with previous pregnancy losses, preterm deliveries or stillbirths (Kunkel et al., 1999). However, there are some opposite results. The plasma FFA levels in umbilical cord blood did not differ between the study groups (Bomba-Opon et al., 2006). The change in metabolites in umbilical cord blood of infants remains to be clarify.
Metabonomic is a powerful tool for elucidating the mechanism of metabolic abnormalities in susceptible individuals by systematically studying low molecular weight compounds in biological tissues and body fluids (Ceja-Gálvez et al., 2020; Perng et al., 2017). Metabonomic has been used to find biomarkers to predict, diagnose and monitor a variety of metabolic diseases, such as GDM (Diboun et al., 2020; Fanos et al., 2013).
Metabonomic markers have been used to help predict the risk of postpartum diabetes in women with GDM, and diabetes related lipid metabolism disorders have also been widely concerned as a major health burden worldwide (Athyros et al., 2018). At present, there is no study on fetal metabonomic for GDM. Metabonomic in maternal blood and fetal cord blood may help to better distinguish the interaction between fetal and maternal diseases.
In this study, by comparing the lipid metabolomics analysis of the umbilical cord blood of the fetus delivered by GDM patients and normal pregnancy women with delivery fetus using the high-throughput metabonomic method, the effect of GDM on lipid metabolism were evaluated, and the specific lipid metabolites that can characterize GDM were screened out.
Research participants and sample collection
Umbilical cord blood samples were collected from Hexian Memorial Hospital, Panyu District, Guangzhou. Pregnant women were recruited in Guangzhou from 2019 to 2020. All the subjects signed the written consent, and this study was approved by the ethics committee of Hexian Memorial Hospital.
All pregnant women included in the study were given a card at the Perinatal Medicine Clinic of Hexian Memorial Hospital from 2019 to 2020 and followed up regularly to collect basic patient information, such as height, weight, age, pre-pregnancy body mass index (BMI). According to the results of oral glucose tolerance test (OGTT) and delivery conditions of 75 g at 24–28 weeks of gestation, we selected those who gave birth at full term. The 75G OGCT test was performed according to the standards of the American Diabetes Association. Before the test, the patient was fasted for eight hours, and taken 75 g of glucose within 5 min, and then test the blood glucose at 1 h and 2 h, respectively. Any patient with blood glucose level that meets or exceeds the following criteria was diagnosed as GDM: Fasting: 5.1 mmol/L; 1 h after meal: 10.0 mmol/L; 2 h after meal: 8.5 mmol/L (Tsakiridis et al., 2021).
The inclusion criteria of the study subjects are: (1) Establishing a maternity check-up health card before the 13th week of pregnancy; (2) 18–40 years old. Exclusion criteria: (1) multiple pregnancy; (2) smoking or drinking; (3) history of hypertension and family history of diabetes; (4) abnormal blood glucose in the first trimester; (5) delivery within 37 weeks of pregnancy; (6) received clinical treatment of GDM. Finally, 21 GDM patients were selected, and 22 healthy pregnant women matched with age of GDM patients were selected as control group for further study. Umbilical cord blood was collected and serum were used for metabonomic analysis within one minute.
Test methods for lipid metabolism detection
The collected umbilical cord blood samples were centrifuged at 3000 rpm at 4°C for 10 min on the same day. All umbilical cord blood was centrifuged to obtain serum, which was immediately transferred to a centrifuge tube and stored at −80°C for testing. The ultra-high-pressure liquid-phase high-resolution mass spectrometer Agilent 6545A QTOF mass spectrometer (Agilent Technologies, Santa Clara, USA) was used for the test. The samples were centrifuged by methanol and MTBE vortex, and then ultrasonic processing. The organic phase and water phase were centrifuged, and then the organic phase and quality control (QC) sample were prepared. The mobile phase column temperature was controlled at 35°C, and the sample volume was 5 μL. Water: acetonitrile: formic acid (4:6), and acetonitrile: isopropanol (1:9) were used for positive and negative ions.
Agilent 6545a QTOF mass spectrometer is controlled by the control software (LC/MS data acquisition, version b.08.00) with auto MS/MS mode. The primary and secondary mass spectrometry data were collected, and the quality scanning range is m/Z (50–1100): (1) Chromatographic optimization for more hydrophilic compounds, using ultrapure water (A) containing 0.05% perfluorinated formic acid, 0.1% formic acid and methanol solution (B) on a C18 column for elution. (2) Chromatographic optimization for more hydrophobic compounds. This method uses ultrapure water (A) containing 0.05% perfluorinated formic acid, 0.01% formic acid and methanol/acetonitrile (B) on a C18 column. Remove, and operate under the condition of higher total organic content. (3) Use water (A) containing 6.5 mmol/L ammonium bicarbonate and 95% methanol (B) to elute on a C18 column. (4) Component 4 uses a mobile phase consisting of 10 mmol/L ammonium formate in water and acetonitrile to perform gradient elution on a hydrophilic interaction HILIC column. The positive and negative ion modes were used to collect respectively. The parameters of ESI ion source are set as follows: Ion source dry gas temperature (Gas Temp): 320°C, nitrogen flow (Gas Flow): 8 L/min, sheath gas flow rate (SheathGasFlow): 12 L/min, Sheath gas temperature (SheathGasTemp): 350°C; capillary voltage (VCap): 3500 V (negative ion mode), and 4000 V (positive ion mode).
The offline data is first converted to .abf format using Analysis Base File Converter, and then MSDIAL software (version 4.24) is used to perform data processing such as peak search and peak alignment on the converted abf file, and the identification results were obtained by searching the lipid blast database based on the primary and secondary maps. For the data identified by MSDIAL alignment, QC samples are used to control the quality of the test. The metabolites with more than 50% missing values in the original data were eliminated, and the sample index CV < 30% was controlled by QC samples, and the auto scaling method was used for normalization.
The univariate statistical analysis of metabolites was performed by Fold change analysis and T-test. The differential metabolite was screened by criteria: P-value < 0.05, fold change greater than 2 times, and PLS-DA VIP value > 1.
Multivariate statistical analysis was performed. In this experiment, the PCA with unsupervised statistical model was used to analyze of GDM and normal samples.
PLS-DA models of GDM and normal groups were established, and the evaluation parameters of the model were obtained through interactive verification. The R2 and Q2 > 0.5 indicate a good prediction effect. The hierarchical clustering of samples in each group was carried out with the expression of qualitative and significant differential metabolites. Enrichment analysis of KEGG pathway was also performed. The analysis was performed by using Metabo analyst 4.0 software.
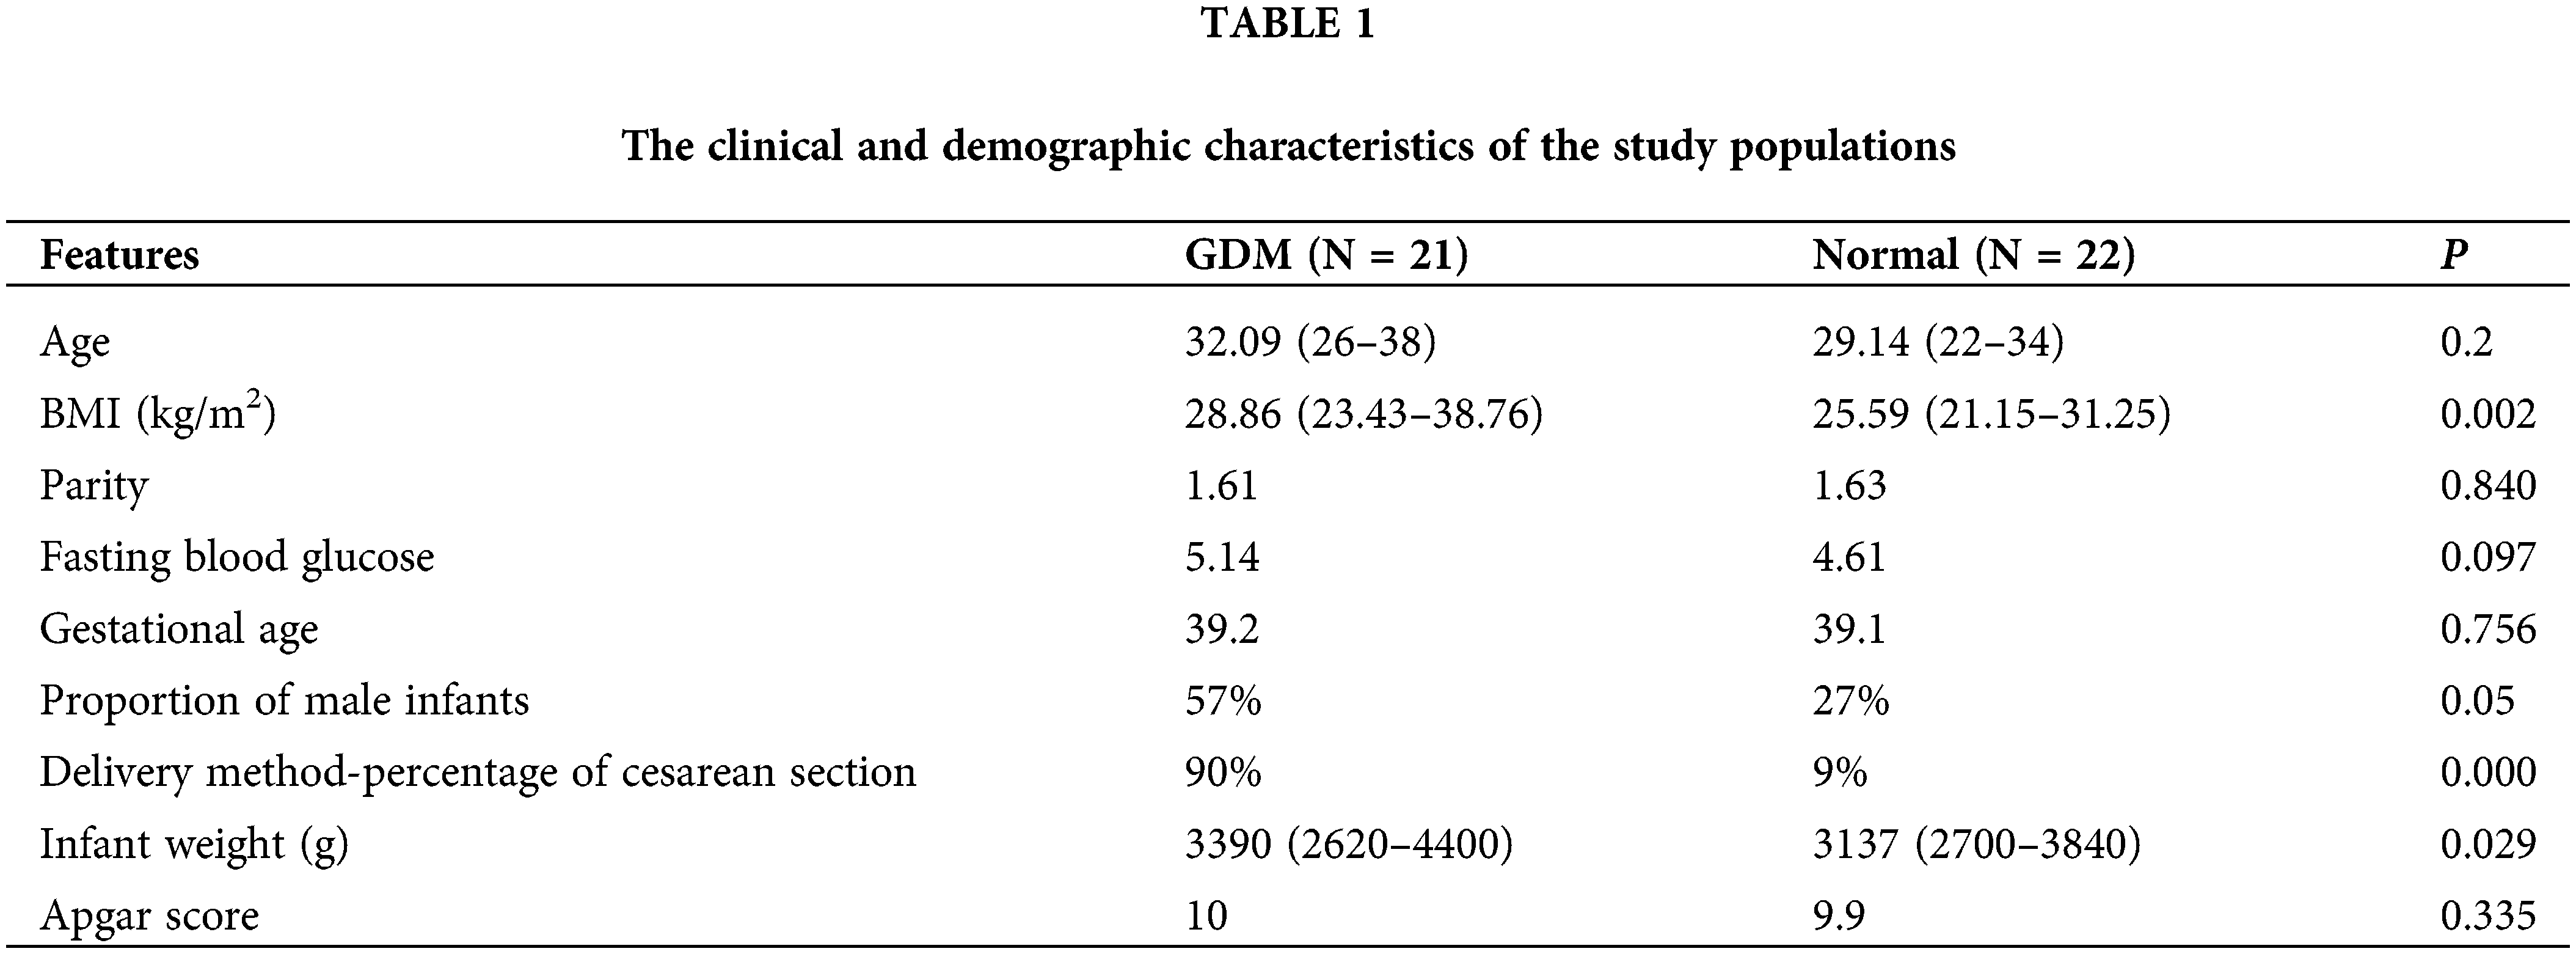
Pregnancy outcomes and demographic characteristics
The parameters recorded between the GDM and normal delivery women are shown in Table 1. Compared with the non-GDM mothers in the control group, the age of mothers with GDM was significantly higher (larger than 30 years old, P < 0.05), and the BMI of GDM was significantly higher (P < 0.01). There were not significant differences in parity, fasting blood glucose and gestational age between GDM and normal delivery women. Interestingly, according to early studies, mothers with GDM have a significantly higher risk of preterm birth than mothers without GDM (Hedderson et al., 2003; Xiong et al., 2001), which is consistent with our results that 90% GDM with cesarean section and only 9% normal delivery women with cesarean section (P < 0.001). The infant weight in GDM was higher than that in normal, which is consistent with maternal BMI before pregnancy. There are no significant differences in neonatal gender and Apgar score.
Principal component analysis (PCA) showed that QC samples were closely clustered, indicating a good repeatability of the experiments, with stable and reliable instrument analysis system (Fig. 1A). After normalization, the distribution of positive and negative ion mode data of GDM and control groups are basically normal distribution (Fig. 1B). Univariate statistical analysis of metabolites was conducted by using fold change analysis and t-test. As shown in Fig. 1C, there were 167 significant changed lipid metabolites in umbilical cord blood in GDM compared with normal, including 158 upregulated and 9 downregulated lipid metabolites. PCA analysis showed that the cumulative contribution rate of the five principal components was 61.7%, indicating the lipid metabolites could well-separated the GDM and normal groups (Figs. 2A and 2B). All the R2 and Q2 of the five principal components in PLS-DA models of GDM and normal groups were >0.5, indicating a good prediction effect of those principal components (Fig. 2C).
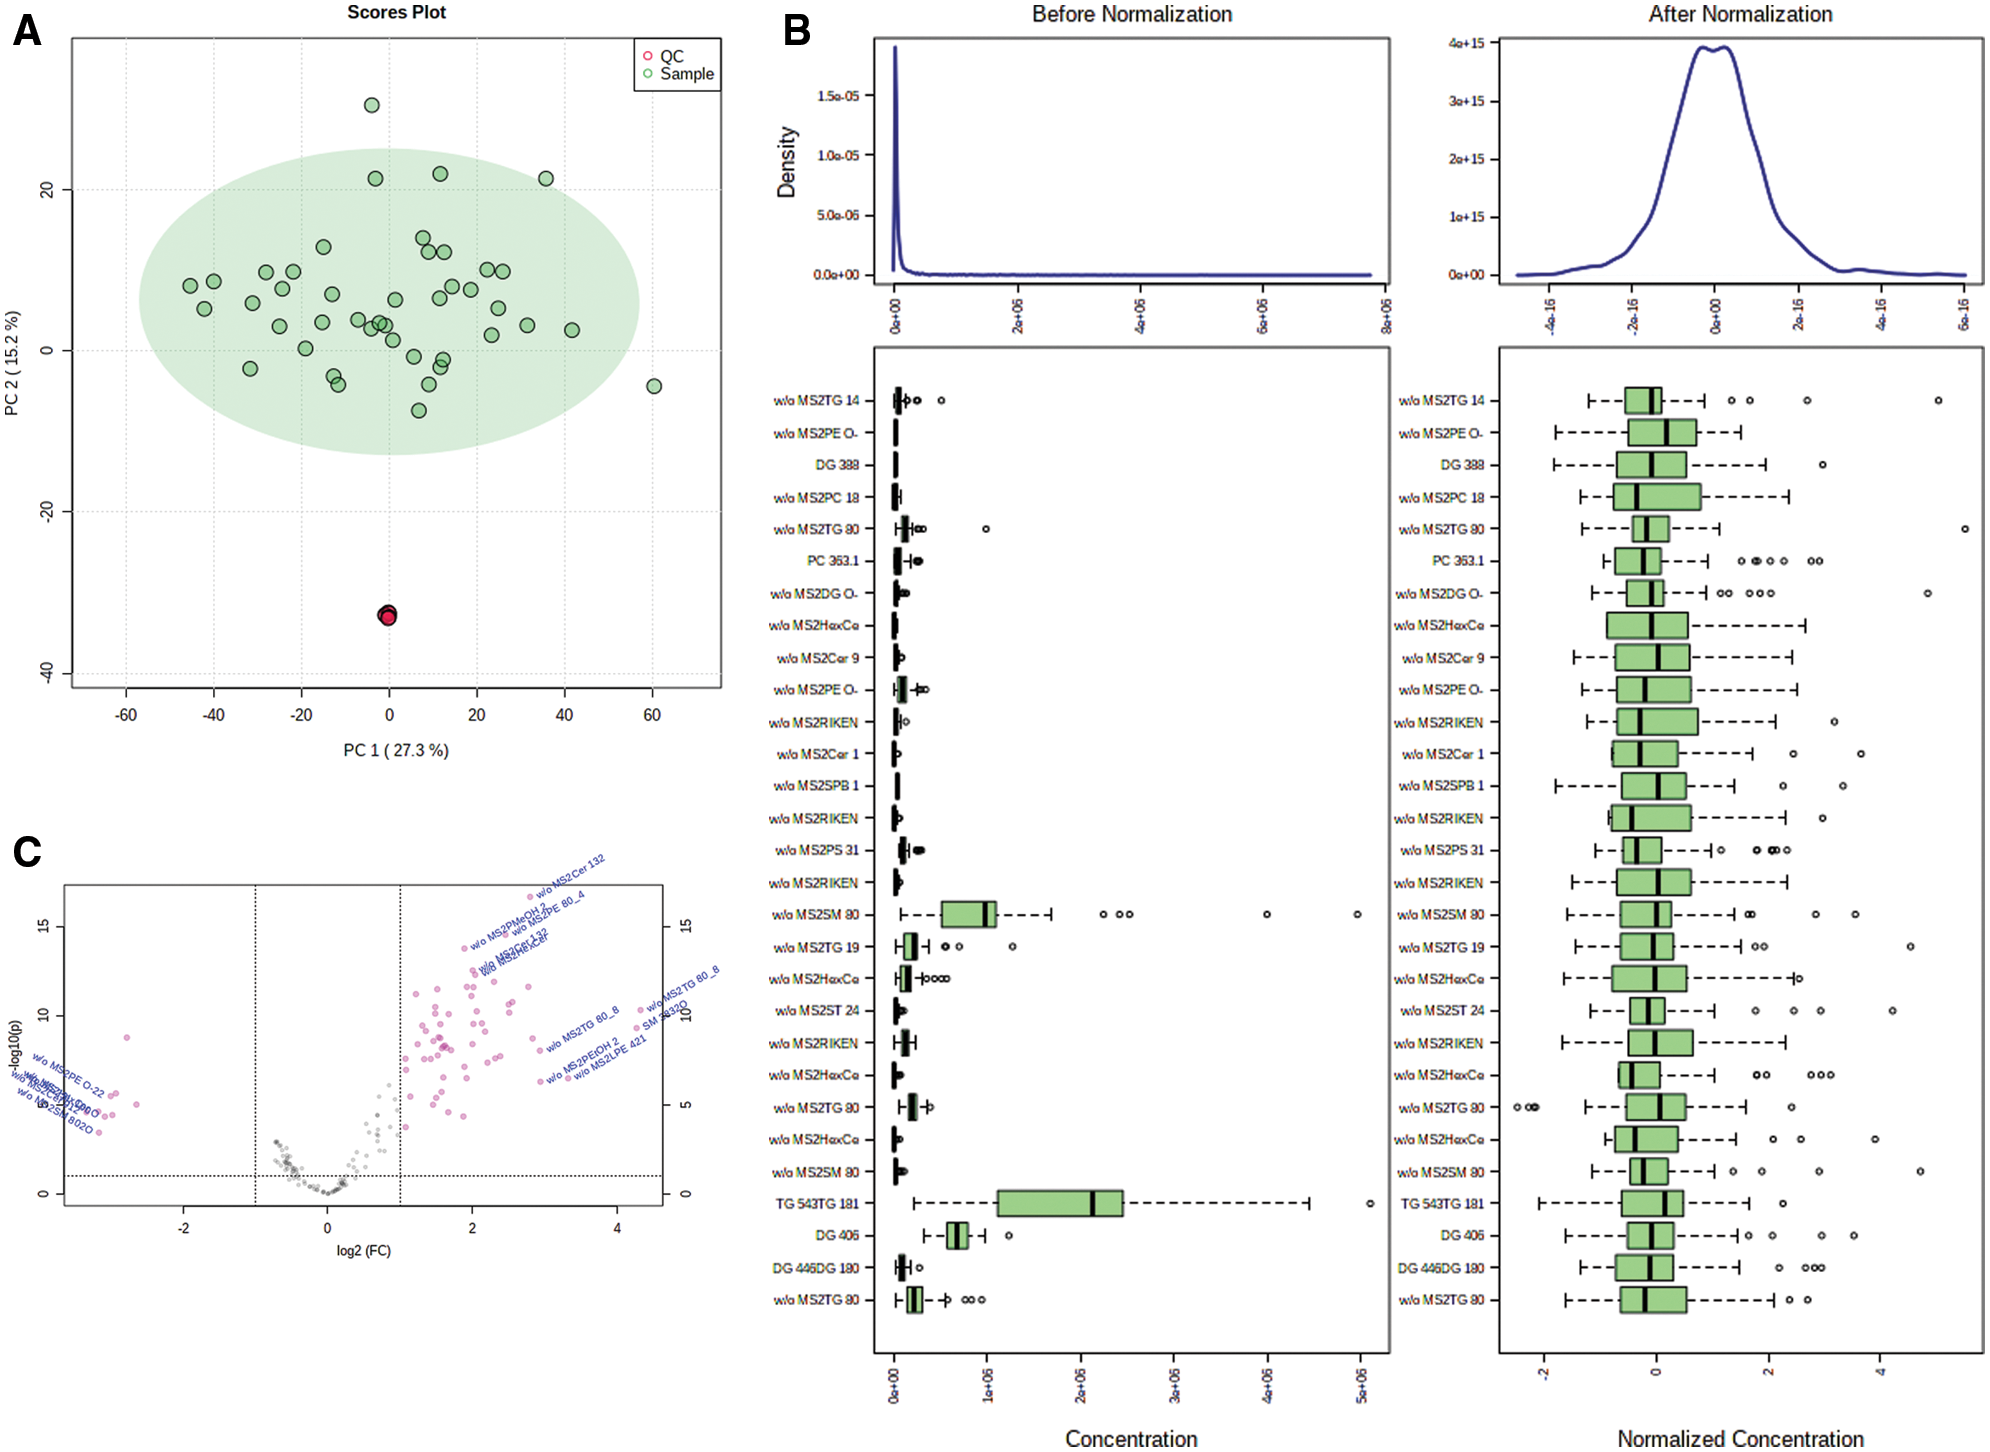
Figure 1: Identification of differential lipid metabolites. (A) PCA 2D score chart of quality control (QC) and samples. (B) The distribution of positive and negative ion mode data of GDM and control groups before and after normalization. (C) Volcano map of lipid metabolites.
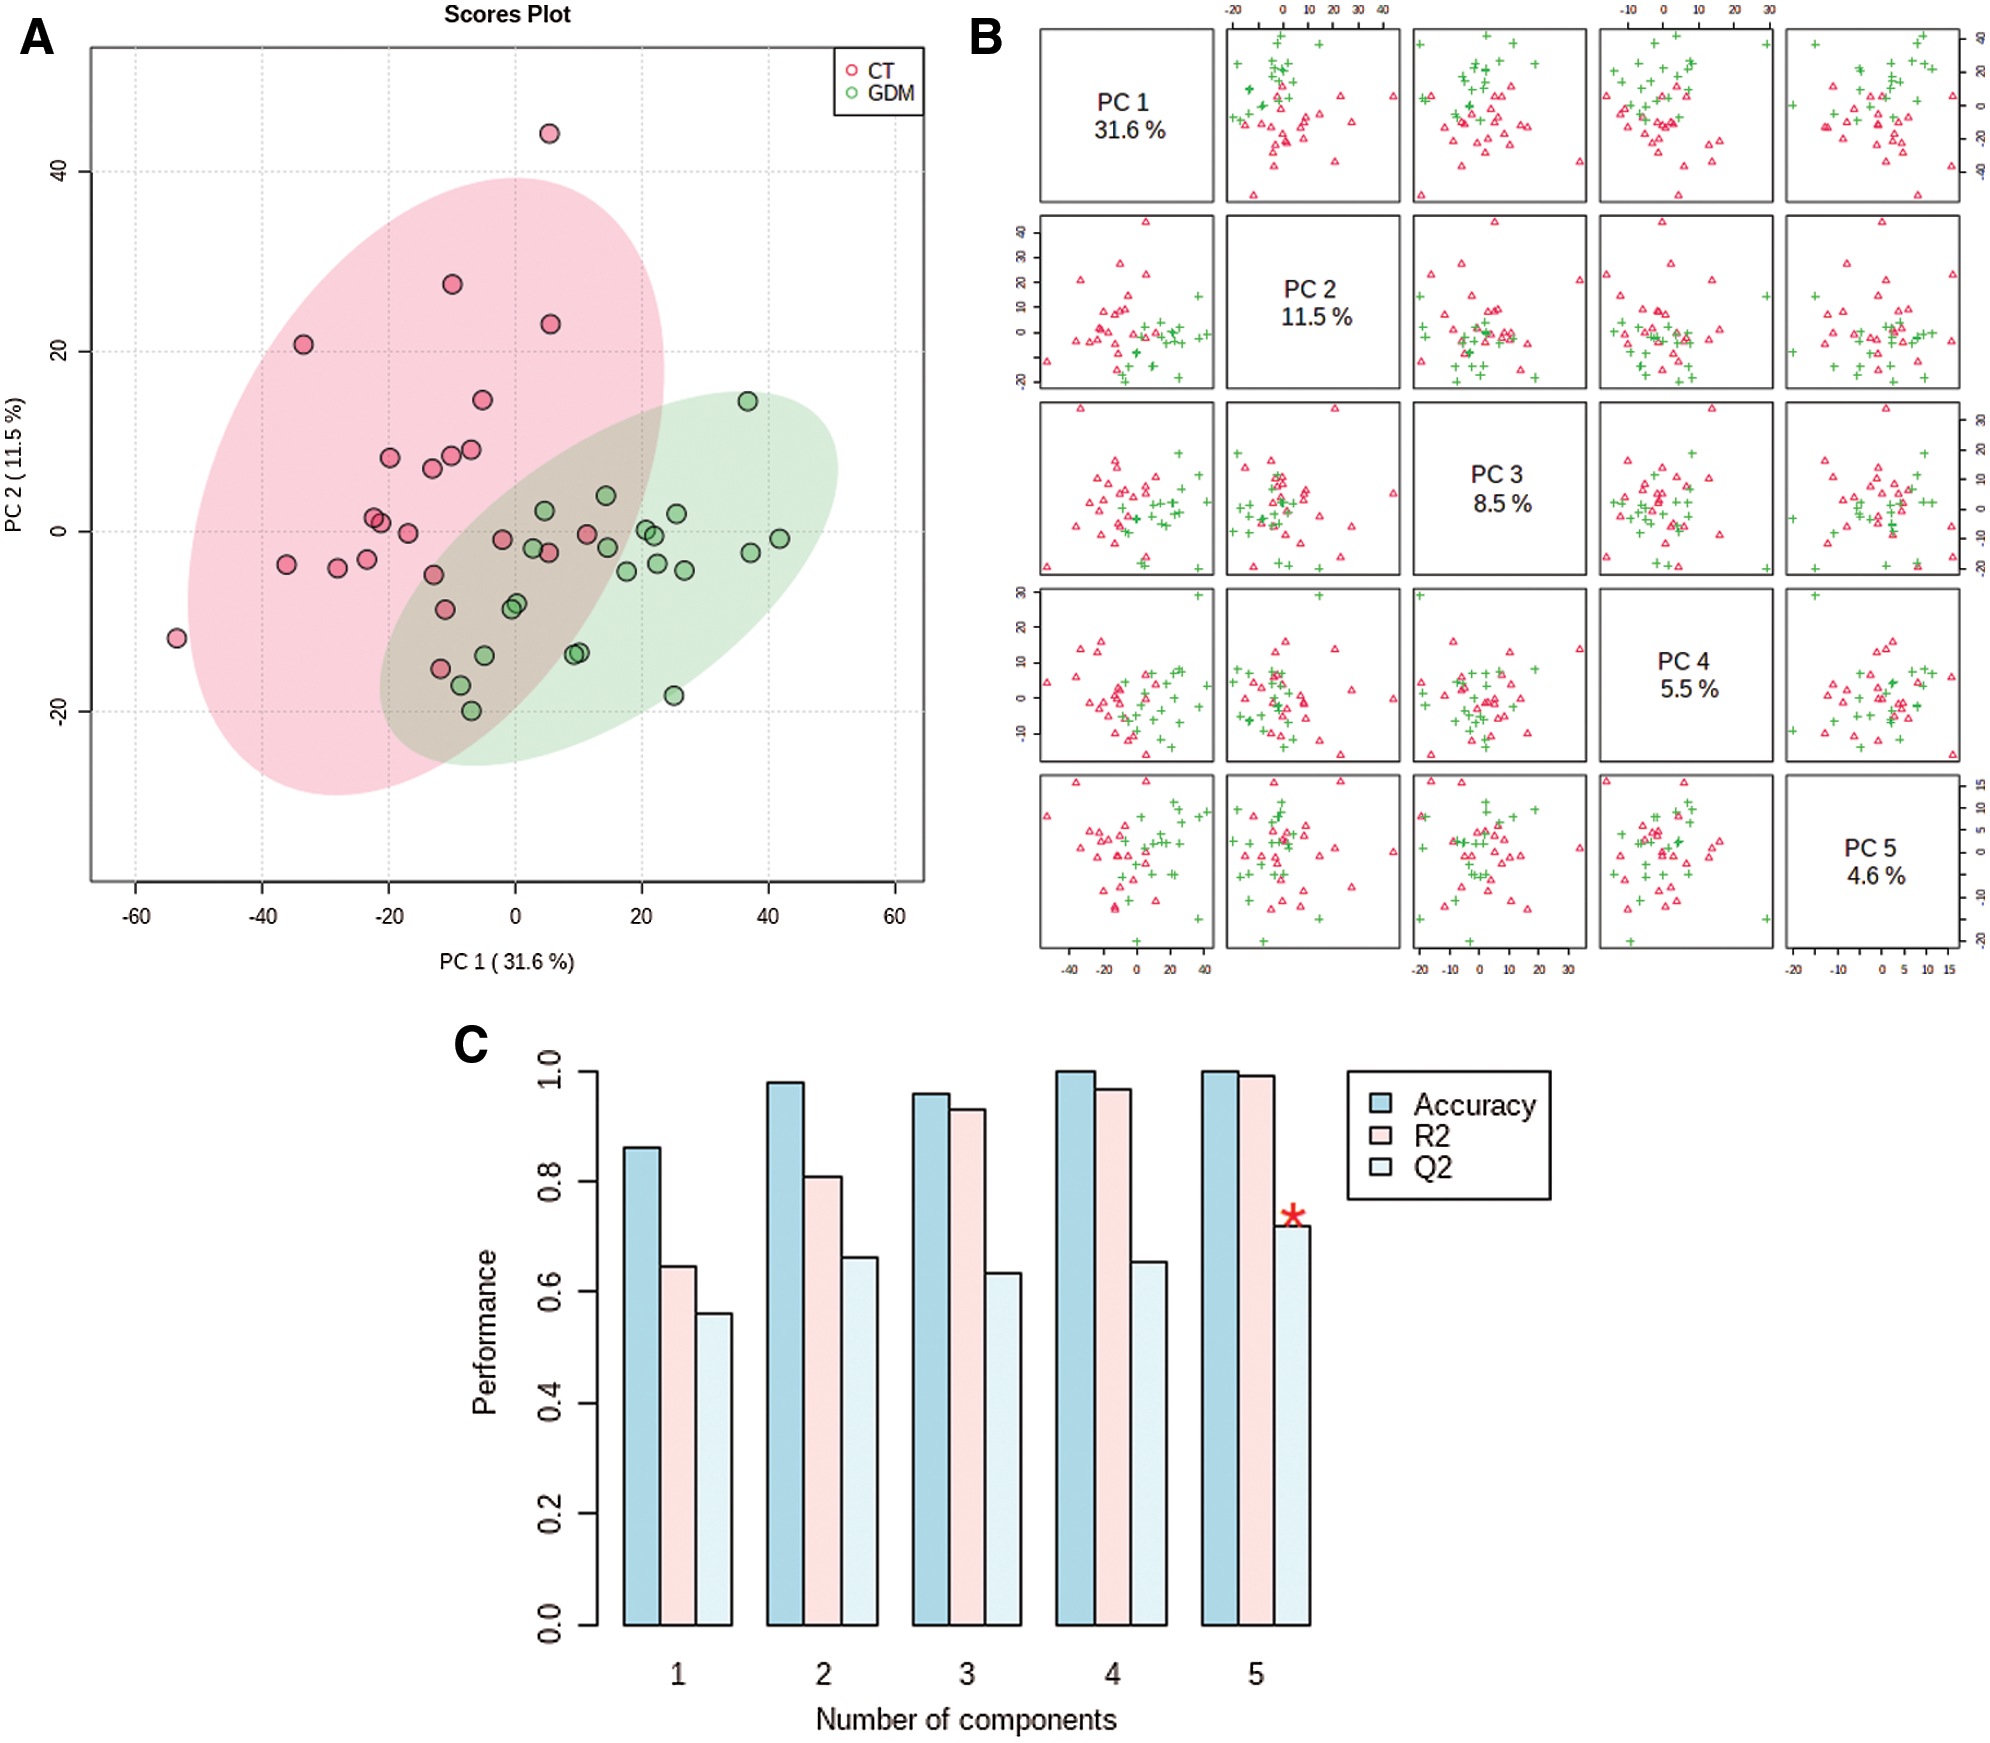
Figure 2: Multivariate statistical analysis of lipid metabolites. (A) PCA analysis of the significant changed lipid metabolites. (B) PCA 2D score chart of GDM and normal (control, CT) samples. (C) R2 and Q2 of the five principal components.
The distribution of samples in principal components PC1 and PC2 shows that the samples of GDM and normal groups are separated (Fig. 3A). Also, the hierarchical clustering shown the significant differential metabolites could sperate the GDM and normal samples into two different clusters (Fig. 3B). Thus, there is a significant difference in metabolites between the two groups. All the differential metabolites are provided in Suppl. Table S1.
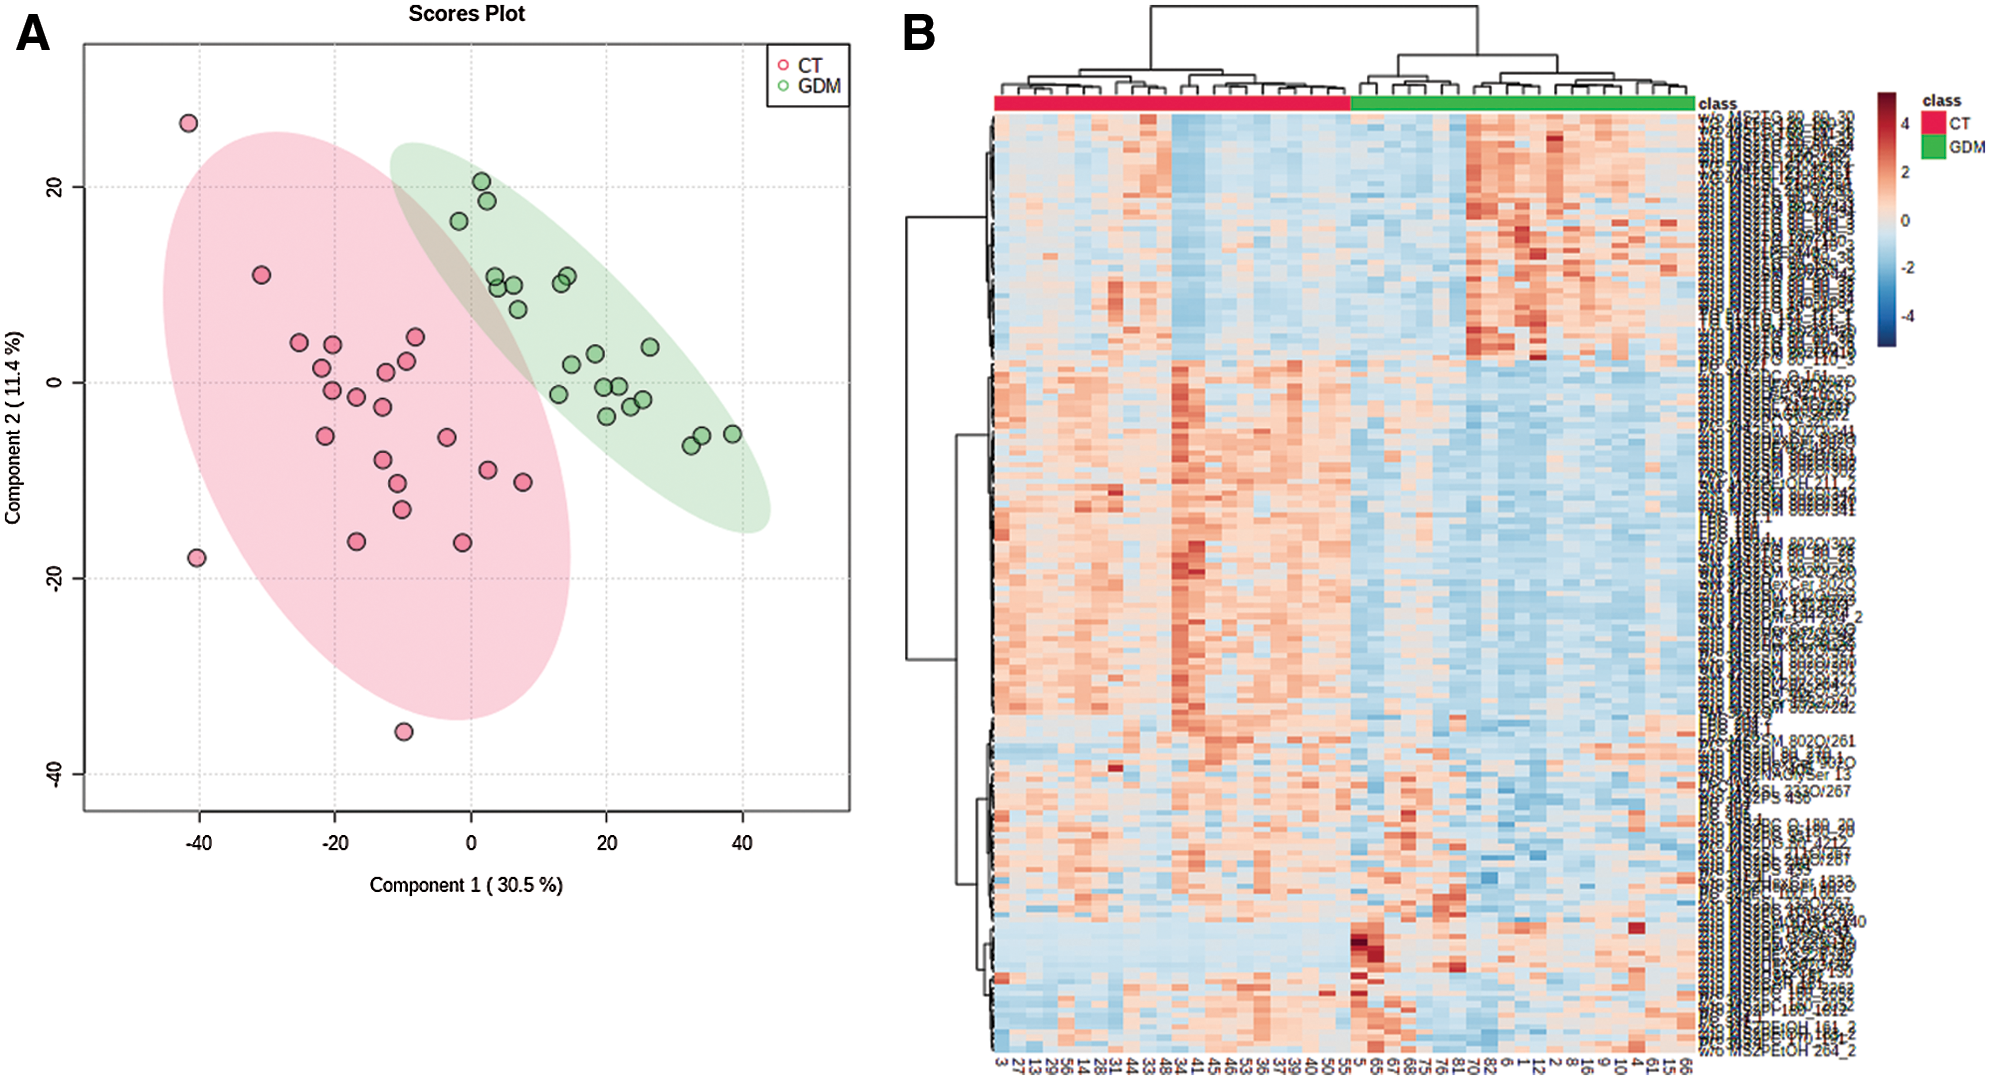
Figure 3: The clustering of samples and differential metabolites. (A) The distribution of samples in principal components PC1 and PC2. (B) Hierarchical cluster diagram of differential metabolites.
The 13 metabolites with carbon chain length (C) <30, are shown in Table 2. Lyso-phosphatidyl-colines LPC 16:0, 18:2, 18:1, 18:0, 20:4 and 22:6, glycerophosphocholines PC O-16:1, oleoylcarnitine CAR 18:2 and 18:1, dihexosylceramides Hex2Cer 13:0;2O, phosphatidylethanolamine PE O-22:6_2:0 and PE O-22:6_3:0 and sphingomyelin SM 8:0; 2O/11:0 were dysregulated in GDM. Compared with normal, lyso-phosphatidyl-colines, glycerophosphocholines and oleoylcarnitine were significantly upregulated in GDM, and dihexosylceramides, phosphatidylethanolamine and sphingomyelin were signficanlty downregulated in GDM.
The results of enrichment analysis of KEGG pathway of all the 167 significant changed lipid metabolites showed those differential metabolites were involved in sphingolipid metabolism, and glycophoripid metabolism (Fig. 4).
The KEGG pathway analysis of the 13 metabolites with C < 30 showed that LPC participated in the glycerophosphate metabolic pathway (map00564). PC participated in the glycerophosphate metabolic pathway (map00564) and the ether lipid metabolic pathway (map00565). Hex2cer participated in the glycerophosphate metabolic pathway (map00564) and the glycerolipid metabolism pathway (map00561). SM is involved in the glycerophosphate metabolic pathway (map00564), the ether lipid metabolism pathway (map00565), the glycerin metabolic pathway (map00561), the linoleic acid metabolism pathway (map00591), the sphingolipid metabolism pathway (map00600), the arachidonic acid metabolic pathway (map00590) and the α-linolenic acid metabolic pathway (map00592). These metabolites may be potential biomarkers for the identification of GDM, and the metabolites are closely associated with the pathway of glycerophosphate metabolism.
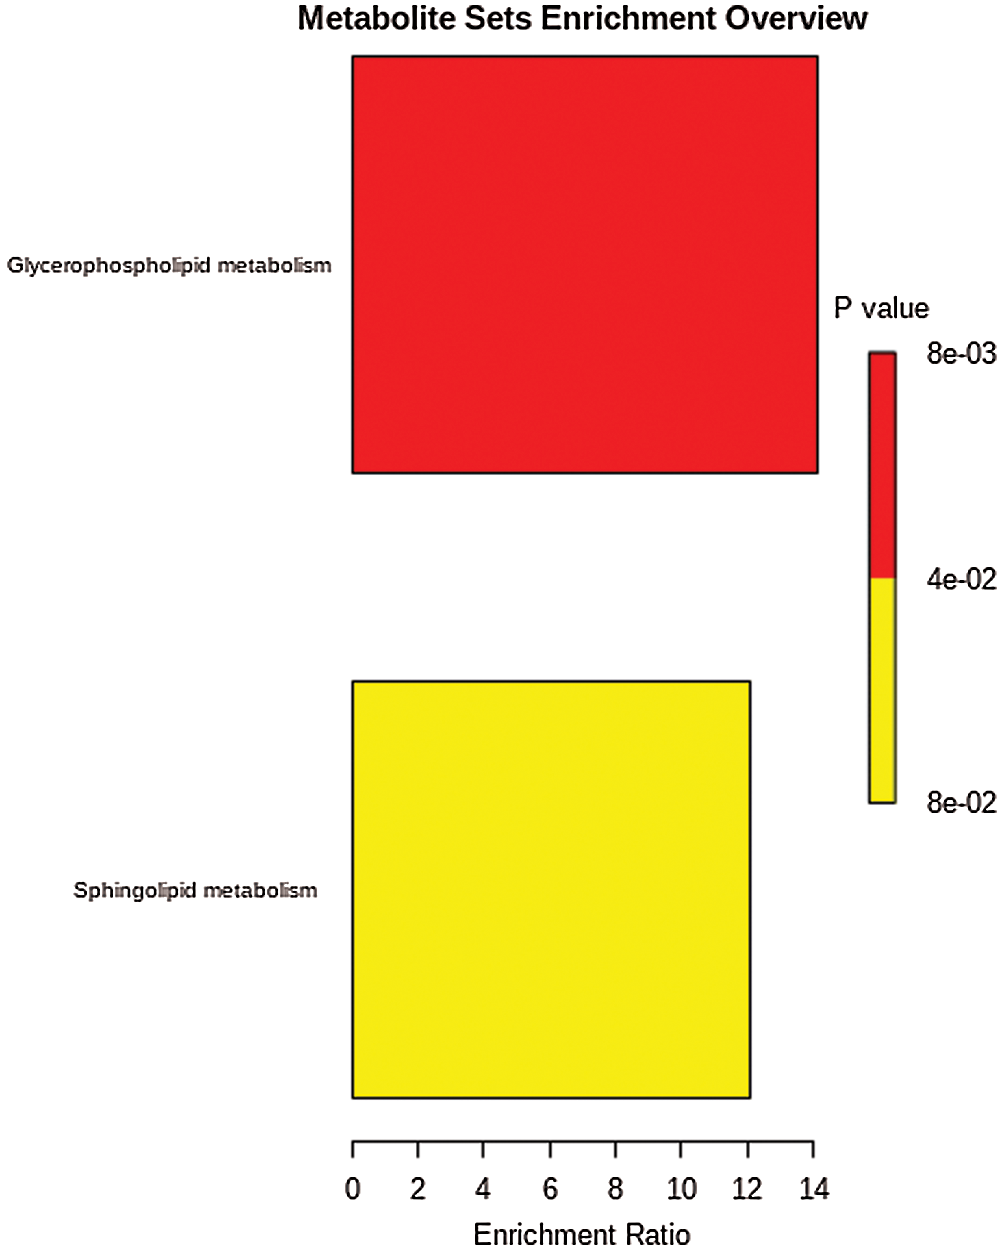
Figure 4: KEGG pathway of different metabolites.
Our study identified 13 lipid metabolites (C < 30) associated with GDM in umbilical cord blood, which can be divided into six categories including lysophosphatidylcolines, glycerophosphocholine, oleoyl carnitine, dihexylceramides, phosphatidylethanolamine, and sphingomyelin. Consistent to our results, it was reported that the metabolic spectrum of lysophosphatidylcholine, sphingomyelin and other lipids in GDM patients have changed (Furse et al., 2019).
Based on LC-MS tandem analysis, lysophosphatidylcolines was evaluated as a potential biomarker of cancer (Zhang et al., 2019). Lysophosphatidylcolines derived from adipocytes activate Nod-like receptor protein 3 (NLPR3) inflammasomes in adipocytes and macrophages in adipose tissue that mediate homocysteine-induced insulin resistance, resulting a decrease in the efficiency of insulin in promoting glucose uptake and utilization (Liu et al., 2020; Wan et al., 2019). The insulin resistance is often accompanied by hyperinsulinemia, which can easily lead to metabolic syndrome and type 2 diabetes mellitus (Ahmed et al., 2020b; Giraud-Billoud et al., 2018). Lysophosphatidylcholine (lyso PC) mediates the activation of NLRP3 inflammatory body induced by homocysteine (Zhang et al., 2018). Multivariate analysis showed that lysophospholipids (lyso PLs) was proposed as a biomarker for different diseases using non-targeted metabonomic. The comprehensive assessment of serum lyso PLs can be used as an excellent indicator of nutritional phenotype and increased risk of dyslipidemia (Suárez-García et al., 2017). Lysophosphatidylcholine might be used as a biomarker of GDM.
Glycophorophosphocholine is an ether lipid with a 1-o-alk-1’-alkenyl ether bond at the sn-1 position of the main chain of glycerol. Abnormal levels of ether glycerophosphatidylcholine (ether PCs) have been associated with cell dysfunction and various human diseases (Liu et al., 2020). Glycerophosphocholine (GPC) metabolites can promote atherosclerosis and increase cardiovascular disease risk (Tuboly et al., 2019). We found that Glycerophosphocholines (PC O-16:1) are involved in the ether metabolism by KEGG pathway analysis. Whether glycophorophosphocholine is associated with insulin resistance in GDM remained to be studied.
Acylcarnitine is a kind of metabolites formed by the combination of carnitine and fatty acids, which are similar in structure to each other. They are widely present in various tissues and body fluids. Its biological functions mainly include: (1) transferring long-chain fatty acids from cytoplasm to mitochondrial matrix for β oxidation, (2) promoting the production of peroxidase β oxidation, acetyl-CoA to enter mitochondria for oxidation, (3) assisting the transportation of short-chain and medium-chain fatty acids in mitochondria, (4) being an integral part of lipid metabolism and membrane integrity (Gil de la Fuente et al., 2018). Abnormal level of acylcarnitine have been shown in some other diseases, such as cancer (Morita et al., 2012; Peluso et al., 2000). GDM may also product and excrete abnormal level of acylcarnitine, providing a support for occurrence of GDM.
Dihexosylceramides is one of the ceramides. Using non-targeted lipomics based on LC-MS, studied have showed that the characteristics of lipid metabolism disorder in the heart of mice are related to the accumulation of glycerin, phospholipid and ceramide (Ahmed et al., 2020a; Bhat et al., 2019; Jing et al., 2019). The changes of lipid were related to cardiac dysfunction, lipid toxicity, inflammation and insulin resistance (Ahmed et al., 2020a; Ahmed et al., 2020b; Jing et al., 2019; Xu et al., 1999). Glycerin, phospholipid and ceramide might be used as a diagnostic maker of GDM.
Phosphatidylethanolamine is one of the most abundant phospholipids in mammalian plasma membrane, which is second only to lecithin. Study has confirmed that phosphatidylethanolamine decreases in the offspring of GDM progenies (Pereira et al., 2015), which is consistent with our results. GDM exposure may regulate gene expression and liver metabolism, and drive the development of liver steatosis and insulin resistance in the offspring. A lipomics study on diabetes mellitus in women with GDM also indicated that phosphatidylethanolamine is an important risk factor for type 2 diabetes in women with a history of GDM (Lappas et al., 2015). It suggests that phosphatidylethanolamine can be used as a potential biomarker for predicting GDM.
Sphingomyelin (SM) biosynthesis may affect various important cellular processes, such as cell proliferation, cell survival and migration, even the normal physiology of organisms. The reduction of sphingomyelin and hexosylceramide is related to impaired sphingolipid metabolism, suggesting that endogenous adipogenesis may be the driving factor for the onset of diabetes (Lai et al., 2020). Sphingomyelin generally does not change significantly during pregnancy, and the ratio of sphingomyelin to lecithin is generally used as an important indicator for evaluating fetal lung maturity during pregnancy. Our results suggested sphingomyelin is downregulated in the metabolic profile of the GDM, and sphingomyelin metabolites involve with lipid metabolism pathways. The regulatory mechanism of sphingomyelin on lipid metabolism disorders should be further explored.
Neonatal umbilical cord blood is directly affected by maternal metabolism, which has a strong correlation with maternal metabolic components. Compared with other biological samples, umbilical cord blood could reflect the fetal metabolism in a more direct and comprehensive manner. In this study, high-throughput, high-sensitivity and high-resolution ultra-performance liquid chromatography combined with mass spectrometry technology was used (Amberg et al., 2017), which provide reliable experimental evidence on the effect of GDM on the metabolism of offspring. However, this study did not monitor the blood glucose control level of pregnant women with GDM in the third trimester, so it is impossible to analyze the influence of the mother’s blood glucose control level on the metabolism of the newborn.
In conclusion, these screened lipid metabolites can be used as potential biomarkers associated with insulin resistance and GDM. There are changes of lipid metabolites in umbilical cord blood during the development of inflammation and insulin resistance. Further research should be done to explore the correlation between lipid metabolism disorders and the progress of GDM.
Availability of Data and Materials: The datasets generated during and/or analysed during the current study are available from the corresponding author on reasonable request.
Author Contribution: The authors confirm contribution to the paper as follows: study conception and design: Y. Li; data collection: Y. Li, C. Hao; analysis and interpretation of results: Y. Li, C. Hao, W. Chen, Q. Meng; draft manuscript preparation: Y. Li, C. Hao. All authors reviewed the results and approved the final version of the manuscript.
Ethics Approval: All the subjects signed the written consent, and this study was approved by the ethics committee of Hexian Memorial Hospital (20190102, March 23th, 2019).
Funding Statement: This work was supported by Basic and Applied Basic Research Projects of Guangzhou Basic Research Program (Grant No. 202102080582).
Conflicts of Interest: The authors declare that they have no conflicts of interest to report regarding the present study.
Ahmed OM, Galaly SR, Raslan M, Mostafa MAMA (2020a). Thyme oil and thymol abrogate doxorubicin-induced nephrotoxicity and cardiotoxicity in Wistar rats via repression of oxidative stress and enhancement of antioxidant defense mechanisms. BIOCELL 44: 41–53. DOI 10.32604/biocell.2020.08157. [Google Scholar] [CrossRef]
Ahmed OM, Hassan MA, Saleh AS (2020b). Combinatory effect of hesperetin and mesenchymal stem cells on the deteriorated lipid profile, heart and kidney functions and antioxidant activity in STZ-induced diabetic rats. BIOCELL 44: 27–39. DOI 10.32604/biocell.2020.08040. [Google Scholar] [CrossRef]
Amberg A, Riefke B, Schlotterbeck G, Ross A, Senn H et al. (2017). NMR and MS methods for metabolomics. In: JC Gautier, ed., Drug Safety Evaluation. Methods in Molecular Biology. New York, NY: Humana Press. [Google Scholar]
American Diabetes Association (2019). 2. Classification and diagnosis of diabetes: Standards of medical care in diabetes-2019. Diabetes Care 42: S13–S28. DOI 10.2337/dc19-S002. [Google Scholar] [CrossRef]
Athyros VG, Doumas M, Imprialos KP, Stavropoulos K, Georgianou E et al. (2018). Diabetes and lipid metabolism. Hormones 17: 61–67. [Google Scholar]
Bhat RS, El Gezeery A, Ben Bachan A, Alonazi MA, Alsuhaibani LS et al. (2019). Prenatal exposure to the fluoride containing psychiatric drug fluoxetine and anti-oxidative alterations in the neonatal rat brain. BIOCELL 43: 65–71. [Google Scholar]
Blotsky AL, Rahme E, Dahhou M, Nakhla M, Dasgupta K (2019). Gestational diabetes associated with incident diabetes in childhood and youth: A retrospective cohort study. Canadian Medical Association Journal 191: E410–E417. DOI 10.1503/cmaj.181001. [Google Scholar] [CrossRef]
Bomba-Opon D, Wielgos M, Szymanska M, Bablok L (2006). Effects of free fatty acids on the course of gestational diabetes mellitus. Neuro Endocrinology Letters 27: 277–280. [Google Scholar]
Ceja-Gálvez HR, Torres-Sánchez ED, Torres-Jasso JH, Ornelas AV, Salazar-Flores J (2020). Effect of structure and function of paraoxonase-1 (PON-1) on organophosphate pesticides metabolism. BIOCELL 44: 363–370. DOI 10.32604/biocell.2020.09147. [Google Scholar] [CrossRef]
Diboun I, Ramanjaneya M, Majeed Y, Ahmed L, Bashir M et al. (2020). Metabolic profiling of pre-gestational and gestational diabetes mellitus identifies novel predictors of pre-term delivery. Journal of Translational Medicine 18: S103. DOI 10.1186/s12967-020-02531-5. [Google Scholar] [CrossRef]
Fanos V, Atzori L, Makarenko K, Melis GB, Ferrazzi E (2013). Metabolomics application in maternal-fetal medicine. BioMed Research International 2013: 1–9. DOI 10.1155/2013/720514. [Google Scholar] [CrossRef]
Furse S, White SL, Meek CL, Jenkins B, Petry CJ et al. (2019). Altered triglyceride and phospholipid metabolism predates the diagnosis of gestational diabetes in obese pregnancy. Molecular Omics 15: 420–430. DOI 10.1039/C9MO00117D. [Google Scholar] [CrossRef]
Gil de la Fuente A, Traldi F, Siroka J, Kretowski A, Ciborowski M et al. (2018). Characterization and annotation of oxidized glycerophosphocholines for non-targeted metabolomics with LC-QTOF-MS data. Analytica Chimica Acta 1037: 358–368. DOI 10.1016/j.aca.2018.08.005. [Google Scholar] [CrossRef]
Giraud-Billoud M, Fader CM, Aguero R, Ezquer F, Ezquer M (2018). Diabetic nephropathy, autophagy and proximal tubule protein endocytic transport: A potentially harmful relationship. BIOCELL 42: 35–40. DOI 10.32604/biocell.2018.07010. [Google Scholar] [CrossRef]
Hedderson MM, Ferrara A, Sacks DA (2003). Gestational diabetes mellitus and lesser degrees of pregnancy hyperglycemia: Association with increased risk of spontaneous preterm birth. Obstetrics & Gynecology 102: 850–856. DOI 10.1097/00006250-200310000-00030. [Google Scholar] [CrossRef]
Jaskolka D, Retnakaran R, Zinman B, Kramer CK (2015). Sex of the baby and risk of gestational diabetes mellitus in the mother: A systematic review and meta-analysis. Diabetologia 58: 2469–2475. DOI 10.1007/s00125-015-3726-1. [Google Scholar] [CrossRef]
Jing W, Li CF, Lu YL, Feng LS (2019). MicroRNA expression profile and lipid metabolism characteristics in liver of rat undergoing high-fat diet. BIOCELL 43: 129–137. DOI 10.32604/biocell.2019.06087. [Google Scholar] [CrossRef]
Johns EC, Denison FC, Norman JE, Reynolds RM (2018). Gestational diabetes mellitus: Mechanisms, treatment, and complications. Trends in Endocrinology & Metabolism 29: 743–754. DOI 10.1016/j.tem.2018.09.004. [Google Scholar] [CrossRef]
Kikut J, Komorniak N, Ziętek M, Palma J, Szczuko M (2020). Inflammation with the participation of arachidonic (AA) and linoleic acid (LA) derivatives (HETEs and HODEs) is necessary in the course of a normal reproductive cycle and pregnancy. Journal of Reproductive Immunology 141: 103177. DOI 10.1016/j.jri.2020.103177. [Google Scholar] [CrossRef]
Kuhn DC, Botti JJ, Cherouny PH, Demers LM (1990). Eicosanoid production and transfer in the placenta of the diabetic pregnancy. Prostaglandins 40: 205–215. DOI 10.1016/0090-6980(90)90084-9. [Google Scholar] [CrossRef]
Kunkel S, Briese V, Kluge K, Friese K, Koepcke E (1999). Determination of reference ranges and effect of maternal and fetal factors on insulin and C-peptide level in umbilical cord blood. Zentralblatt fur Gynakologie 121: 488–494. [Google Scholar]
Lai M, Al Rijjal D, Rost HL, Dai FF, Gunderson EP et al. (2020). Underlying dyslipidemia postpartum in women with a recent GDM pregnancy who develop type 2 diabetes. eLife 9: 2529. DOI 10.7554/eLife.59153. [Google Scholar] [CrossRef]
Lappas M, Mundra PA, Wong G, Huynh K, Jinks D et al. (2015). The prediction of type 2 diabetes in women with previous gestational diabetes mellitus using lipidomics. Diabetologia 58: 1436–1442. DOI 10.1007/s00125-015-3587-7. [Google Scholar] [CrossRef]
Liu L, Chen M, Lin K, Xiang X, Zheng Y, Zhu S (2020). Inhibiting caspase-12 mediated inflammasome activation protects against oxygen-glucose deprivation injury in primary astrocytes. International Journal of Medical Sciences 17: 1936–1945. DOI 10.7150/ijms.44330. [Google Scholar] [CrossRef]
Lu YP, Reichetzeder C, Prehn C, von Websky K, Slowinski T et al. (2018). Fetal serum metabolites are independently associated with gestational diabetes mellitus. Cellular Physiology and Biochemistry 45: 625–638. DOI 10.1159/000487119. [Google Scholar] [CrossRef]
Morita M, Shinbo S, Asahi A, Imanaka T (2012). Very long chain fatty acid β-oxidation in astrocytes: Contribution of the ABCD1-dependent and -independent pathways. Biological and Pharmaceutical Bulletin 35: 1972–1979. DOI 10.1248/bpb.b12-00411. [Google Scholar] [CrossRef]
Peluso G, Nicolai R, Reda E, Benatti P, Barbarisi A, Calvani M (2000). Cancer and anticancer therapy-induced modifications on metabolism mediated by carnitine system. Journal of Cellular Physiology 182: 339–350. DOI 10.1002/(ISSN)1097–4652. [Google Scholar] [CrossRef]
Pereira TJ, Fonseca MA, Campbell KE, Moyce BL, Cole LK et al. (2015). Maternal obesity characterized by gestational diabetes increases the susceptibility of rat offspring to hepatic steatosis via a disrupted liver metabolome. Journal of Physiology 593: 3181–3197. DOI 10.1113/JP270429. [Google Scholar] [CrossRef]
Perng W, Rifas-Shiman SL, Mcculloch S, Chatzi L, Mantzoros C et al. (2017). Associations of cord blood metabolites with perinatal characteristics, newborn anthropometry, and cord blood hormones in project viva. Metabolism-clinical and Experimental 76: 11–22. DOI 10.1016/j.metabol.2017.07.001. [Google Scholar] [CrossRef]
Petry CJ, Seear RV, Wingate DL, Manico L, Acerini CL et al. (2011). Associations between paternally transmitted fetal IGF2 variants and maternal circulating glucose concentrations in pregnancy. Diabetes 60: 3090–3096. DOI 10.2337/db11-0689. [Google Scholar] [CrossRef]
Sacks DA, Hadden DR, Maresh M, Deerochanawong C, Dyer AR et al. (2012). Frequency of gestational diabetes mellitus at collaborating centers based on IADPSG consensus panel-recommended criteria: The Hyperglycemia and Adverse Pregnancy Outcome (HAPO) Study. Diabetes Care 35: 526–528. DOI 10.2337/dc11-1641. [Google Scholar] [CrossRef]
Shokry E, Marchioro L, Uhl O, Bermudez MG, Garcia-Santos JA et al. (2019). Impact of maternal BMI and gestational diabetes mellitus on maternal and cord blood metabolome: Results from the PREOBE cohort study. Acta Diabetologica 56: 421–430. DOI 10.1007/s00592-019-01291-z. [Google Scholar] [CrossRef]
Song C, Lyu Y, Li C, Liu P, Li J et al. (2018). Long-term risk of diabetes in women at varying durations after gestational diabetes: A systematic review and meta-analysis with more than 2 million women. Obesity Reviews 19: 421–429. DOI 10.1111/obr.12645. [Google Scholar] [CrossRef]
Suárez-García S, Arola L, Pascual-Serrano A, Arola-Arnal A, Aragonès G et al. (2017). Development and validation of a UHPLC-ESI-MS/MS method for the simultaneous quantification of mammal lysophosphatidylcholines and lysophosphatidylethanolamines in serum. Journal of Chromatography B 1055: 86–97. [Google Scholar]
Szczuko M, Kikut J, Komorniak N, Bilicki J, Celewicz Z, Ziętek M (2020). The role of arachidonic and linoleic acid derivatives in pathological pregnancies and the human reproduction process. International Journal of Molecular Sciences 21: 9628. DOI 10.3390/ijms21249628. [Google Scholar] [CrossRef]
Tsakiridis I, Giouleka S, Mamopoulos A, Kourtis A, Athanasiadis A et al. (2021). Diagnosis and management of gestational diabetes mellitus: An overview of national and international guidelines. Obstetrical & Gynecological Survey 76: 367–381. DOI 10.1097/OGX.0000000000000899. [Google Scholar] [CrossRef]
Tuboly E, Gáspár R, Ibor MO, Gömöri K, Kiss B et al. (2019). L-Alpha-glycerylphosphorylcholine can be cytoprotective or cytotoxic in neonatal rat cardiac myocytes: A double-edged sword phenomenon. Molecular and Cellular Biochemistry 460: 195–203. DOI 10.1007/s11010-019-03580-1. [Google Scholar] [CrossRef]
Wan Z, Fan Y, Liu X, Xue J, Han Z et al. (2019). NLRP3 inflammasome promotes diabetes-induced endothelial inflammation and atherosclerosis. Diabetes, Metabolic Syndrome and Obesity: Targets and Therapy 12: 1931–1942. DOI 10.2147/DMSO. [Google Scholar] [CrossRef]
Xiong X, Saunders LD, Wang FL, Demianczuk NN (2001). Gestational diabetes mellitus: Prevalence, risk factors, maternal and infant outcomes. International Journal of Gynecology & Obstetrics 75: 221–228. DOI 10.1016/S0020-7292(01)00496-9. [Google Scholar] [CrossRef]
Xu FY, Kelly SL, Hatch GM (1999). N-Acetylsphingosine stimulates phosphatidylglycerolphosphate synthase activity in H9c2 cardiac cells. Biochemical Journal 337: 483–490. DOI 10.1042/bj3370483. [Google Scholar] [CrossRef]
Zhang Q, Xu H, Liu R, Gao P, Yang X et al. (2019). A novel strategy for targeted lipidomics based on LC-Tandem-MS parameters prediction, quantification, and multiple statistical data mining: Evaluation of lysophosphatidylcholines as potential cancer biomarkers. Analytical Chemistry 91: 3389–3396. DOI 10.1021/acs.analchem.8b04715. [Google Scholar] [CrossRef]
Zhang SY, Dong YQ, Wang P, Zhang X, Yan Y et al. (2018). Adipocyte-derived lysophosphatidylcholine activates adipocyte and adipose tissue macrophage Nod-like receptor protein 3 inflammasomes mediating homocysteine-induced insulin resistance. EBioMedicine 31: 202–216. DOI 10.1016/j.ebiom.2018.04.022. [Google Scholar] [CrossRef]
Supplementary Materials
Supplementary Table 1 All the differential metabolites.
 | This work is licensed under a Creative Commons Attribution 4.0 International License, which permits unrestricted use, distribution, and reproduction in any medium, provided the original work is properly cited. |