DOI:10.32604/biocell.2022.015784
| BIOCELL DOI:10.32604/biocell.2022.015784 | |
| Article |
Insight into the characteristics of an important evolutionary model bird (Geospiza magnirostris) mitochondrial genome through comparison
1Key Laboratory of National Forestry and Grassland Administration on Management of Western Forest Bio-Disaster, College of Forestry, Northwest A&F University, Yangling, 712100, China
2Engineering Research Center for Internet of Animals, Changsha, 410000, China
3Key Laboratory of Forestry Remote Sensing Based Big Data & Ecological Security for Hunan Province, Central South University of Forestry and Technology, Changsha, 410004, China
*Address correspondence to: Guiyan Yang, yangguiyan@nwsuaf.edu.cn
Received: 13 January 2021; Accepted: 04 November 2021
Abstract: Darwin’s finches are the most classic case of evolution. Early studies on the evolution of this species were mainly based on morphology. Until now, the mitochondrial genome of Geospiza magnirostris has been sequenced and the study explored the characteristics of the complete genome of G. magnirostris and verified the evolutionary position of it. The 13 PCGs initiated by ATN codons. The stop codons of three PCGs (ND2, COX3 and ND4) were incomplete, with only T- or TA- replacing complete form TAA or TAG. All the tRNA genes expressed a typical cloverleaf secondary structure, except for tRNASer1(AGY), whose dihydrouridine (DHU) arm was lack and instead with a simple loop. In the sequence of the control region of G. magnirostris, we found six simple repeat tandem sequences with a total length of 42 bp. Two characteristic conserved overlapping junction (ATGCTAA) and (CAAGAAAG) were observed as reported for eight selected Passeriformes birds. A special conserved overlapping junction (ATCTTACC) involved in mitochondrial transcription termination was found between tRNATyr and COX1 in G. magnirostris’s control region. Four most frequently used amino acids in G. magnirostris’s PCGs were Leu1 (CUN), Ile, Thr, Ala. The codon usage of G. magnirostris was relatively average, and there was no particular bias. The ratio Ka/Ks results showed that G. magnirostris receives less natural selection pressure. The phylogenetic relationships and cluster analysis of relative codon usage showed that G. magnirostris and Thraupis episcopus clustered in one branch. The phylogenetic position of G. magnirostris was consistent with the traditional taxonomic of Thraupis. The results supported the conclusion that G. magnirostris belongs to the morphological classification of the family Thraupidae.
Keywords: Geospiza magnirostris; Mitochondrial genome; Comparative analysis; Evolution analysis; Phylogenetic relationships
The mitochondrial genome (mtDNA) of metazoans is usually a circular double-strand molecule, approximately ranged in size from 14 to 20 kilobases (kb) (Boore, 1999). Most mitochondrial genomes encode 37 genes, including 13 protein-coding genes (PCGs), 2 ribosomal RNA genes (rRNAs), 22 transfer RNA genes (tRNAs), and a non-coding control region (CR or D-loop) (Simon et al., 1994). The mitochondrial genome has attracted lots of attention from researchers because of mtDNA’s simple structure, low variation, maternal inheritance, fast evolutionary rate and small genome (Catanese et al., 2008), which contains important information about synteny and can be used for phylogenetic analysis (Ruan et al., 2017). Mitochondrial DNA as a genetic marker is widely used in the study of molecular phylogeny and evolution of birds (Lijtmaer et al., 2004).
Passeriformes is the largest group of birds in ornithology, which has extensive adaptive radiation in nature, leading to the classification of some passerine birds is very complicated and controversial (Ericson and Johansson, 2003). The origin of this group and the evolutionary relationship of various families have always been one of the main issues debated in ornithology research. The large ground finch (Geospiza magnirostris), which belongs to the family Thraupidae, order Passeriformes, is an endemic to the Galapagos islands (Rands et al., 2013). In addition to the above points, variations in taxonomy and types of homologous species make controversy over the origin of G. magnirostris. Some taxonomists classify G. magnirostris into subfamilies Emberizinae based on traditional classification with other New World finches (Sato et al., 1999). G. magnirostris is also a typical species of Darwin’s finch, which is characterized by the length of the beak (Grant, 1981). Determining the taxonomic status and evolutionary characteristics of the G. magnirostris is critical to solving the evolutionary theory of Darwin’s finches. In addition to morphological characteristics, molecular biotechnology has also been widely used in the evolutionary analysis of Passeriformes and Darwin’s finches (Lamichhaney et al., 2015; Remsen et al., 2016). Based on microsatellite DNA data of G. magnirostris, it provides evidence of drift and selection causing morphological and genetic divergence in the establishment of a new population and in the first few generations. Recent studies has shown that the complete mitochondrial genome may be an effective tool to solve the controversial relationships among Passeriformes birds and elucidate population genetic structure based on comparative genome (Lamichhaney et al., 2015). The mitochondrial genome is a highly efficient molecular marker that is of great significance for the phylogeny of different closely related species. Limited by sampling, the study of mitochondrial genes of the G. magnirostris is often limited to partial genes. Based on control region (CR) of mitochondrial genomes from almost 300 representatives of Passeriformes, the analyses resolved phylogenetic relationships within Passeriformes (Mackiewicz et al., 2019). At the same time, analyses of mitogenomes showed four types of rearrangements including a duplicated control region (CR) with adjacent genes and Passerines with two CRs showed a higher metabolic rate in relation to their body mass.
Our research team first sequenced the mitochondrial genome of G. magnirostris and reported it (Wu et al., 2018). In order to reveal the mitochondrial genome characteristic of G. magnirostris and provide reference for its classification status, the comparative analysis between G. magnirostris and related species has been produced basing on mitochondrial genome. This study will contribute to further phylogenetic studies of Passeriformes birds and further conservation strategies for G. magnirostris.
The complete annotated mitogenome of G. magnirostrwas is available in GenBank under accession number MG682351. The specific sampling and extraction methods could been gotten from previously announcement (Wu et al., 2018). The program MITOS web-server was used for functional annotation and gene prediction of whole mitochondrial genome, such as the location and length of PCGs, tRNAs, rRNAs, control region.
In order to compare and confirm its structural characteristics, we uploaded it to the National Centre for Biotechnology Information (NCBI) for comparison, and found that there were five homologous or closely related families. Therefore, we combined the traditional morphological classification to select a total of eight species from five families for comparison. They were three Thraupidae birds (Sporophila maximiliani, Thraupis episcopus, Chlorophanes spiza) and each a kind of families Icteridae (Molothrus aeneus), Emberizidae (Emberiza fucata), Fringillidae (Psittirostra psittacea) and Passeridae (Montifringilla adamsi). Then the length, gene number, G+C content, and base composition skewness of above mitochondrial genomes were compared. MEGA7.0 software was used to calculate the base composition of each mitochondrial genome (Kumar et al., 2016). Specific formulas were used to calculate the of the mitochondrial genome (Jühling et al., 2012).
At the same time, the secondary structure and anti-codons of all tRNAs were determined by tRNAscan-SE and RNA fold webserver (Lowe and Chan, 2016) with default parameters. The mismatched base pairing in each stem of tRNAs were examined manually, including the type of mismatch and the total number of mismatches.
Mitochondrial genome structure comparison
The tandem repeat sequence in the control region was predicted by SSR Hunter (Qiang and Wan, 2005). The control region sequence was extracted in BioEdit software (Hall, 1999), and saved into fasta format file and imported into SSR Hunter. Three consecutive repeats were defined as simple tandem repeat sequences, and repeat elements, repeat times and starting positions were recorded. Using IBS online drawing software to make the distribution map of tandem repeat sequence (Liu et al., 2015). Some intergenic spacers (IGS) and overlapping sequences (OS) were generally distributed between different genes. Finding their location information was practical significance for locating a gene. Overlapping sequences and intergenic spacers were compared in the bioedit software after the individual genes were identified (Singh et al., 2017). We manually counted and calculated the length, distribution, and feature sequences of IGS and OS sequences, then recorded them in Excel.
Relative synonymous codon usage analysis
Codons are the basic principle of correspondence between nucleic acid-carrying information and protein-carrying information. In the genetic code of organisms, amino acids have more than one degenerate codon, except for tryptophan and methionine. For the same species, different protein-coding codons appear in genes with different frequencies, which had a certain relative synonymous codon usage (RSCU). The relative synonymous codon usage of G. magnirostris was calculated using DAMBE (Xia, 2017) based on the sequence of PCGs. Each annotated protein-coding gene was extracted after removing the start and stop codons in bioedit software, and all the protein-coding genes were spliced together into DAMBE software to calculate codon usage bias. We calculated each codon number of encoded amino acids, and the RSCU.
In order to count and calculate RSCU among different species, we counted the number of each codon in the 13 protein-coding genes of eight species after homogenized. We plotted the relative synonymous codon usage heatmap of the eight species through the online software of ClusterVis (Tauno and Jaak, 2015).
The protein-coding gene sequence was aligned in the Mega 7.0 software and converted into protein sequence. The gaps and stop codons were deleted from the protein coding gene sequence and saved in a meg format file. The PCGs evolutionary rates of G. magnirostris were calculated using DnaSP 6 (Rozas et al., 2017), including the rates of synonymous substitutions (Ks) and non-synonymous substitutions (Ka) of all the13 PCGs and Ka/Ks ratios. The saved meg format file was opened in DnaSP 6 software. After setting the mitochondrial genome codon table and protein-coding region, then calculated the Ks, Ka, and Ka/Ks ratios.
In order to clarify the taxonomic status of G. magnirostris, phylogenetic tree was constructed by 13 PCG sequences. Eighteen published complete Passeriformes mitochondrial (representing five families) genomes were downloaded from the National Centre for Biotechnology Information (NCBI) database due to high sequence affinity. Besides seven bird species used for comparative analysis, eleven bird species from five families were used for evolutionary analysis. They are three Icteridae birds (Nesopsar nigerrimus Accession No. JX516054.1; Dives dives Accession No. JX516061.1; Euphagus cyanocephalus Accession No. JX516072.1), three Emberizidae birds (Emberiza rutila Accession No. KC952874.1; Emberiza cioides Accession No. KF322027.1; Emberiza aureola Accession No. KF111713.1), three Fringillidae birds (Fringilla teydea Accession No. KU705755.1; Carduelis spinus Accession No. HQ915866.1; Acanthis flammea Accession No. KR422696.1), two Passeridae birds (Passer ammodendri Accession No. KT895996.1; Pyrgilauda davidiana Accession No. KJ148632.1). At the same time, Coracopsis vasa and Nestor notabilis were chose as outgroup species (Mackiewicz et al., 2019). Each annotated of 13 PCGs was compared with published PCGs’ sequences of other selected vertebrate species in NCBI using DOGMA software and translated into amino acid alignment using MEGA 7.0 (Kumar et al., 2016). The shared DNA sequences of above 21 species were aligned using MAFFT v7.380 under the FFT-NS-2 default setting (Katoh and Standley, 2013; Li et al., 2020). Then the Gblock (http://molevol.cmima.csic.es/castresana/Gblocks_server.html) was employed to further explore conserved mtDNA protein-coding sequences and 11278 bp base sequences were reserved. In order to test of substitution saturation, the observed Iss and Iss.c. were determined by DAMBE (Xia and Xie, 2001). Under the premise of satisfying the modeling conditions, IQ-tree: model finder software was employed to find the best model (Nguyen et al., 2014). Based on the AIC criterion, the GTR+F+I+G4 model was adopted, and the model parameters were determined. Then Bayesian Inference (BI) was employed during the analysis process by MrBayes 3.2 (Ronquist et al., 2012). The average standard deviation of split frequencies was 0.000719 and the evolutionary tree passed the model diagnosis.
Characteristic of mitochondrial genome
The mitochondrial genome length of G. magnirostris is 16,798 bp, and its gene size was similar to that most published Passeriformes: 13 PCGs (ATP6, ATP8, ND1-6, ND4L, COI-II, Cytb), 2 rRNAs (rrnS and rrnL), 22 tRNA genes and a control region (Krzeminska et al., 2016). A total of 28 genes, including 12 PCGs, 2 rRNAs, and 14 tRNAs, were encoded on the Heavy strand. The remaining 9 genes were transcribed on the Light strand, including ND6 and 8 tRNA genes (Table 1). The percentage of GC content was 47.3%, which exhibited a positive AT skew (0.135) and a negative GC skew (−0.405). The AT skew of others Passeriformes mitogenomes ranged from 0.119 (S. maximiliani) to 0.149 (E. fucata), while the GC skew ranged from −0.362 (M. adamsi) to −0.405 (G. magnirostris) (Table 2). The whole mitochondrial genome sequence of G. magnirostris was similar to other birds and lie within the typical size range of the bird (size from 14 kb to 20 kb).
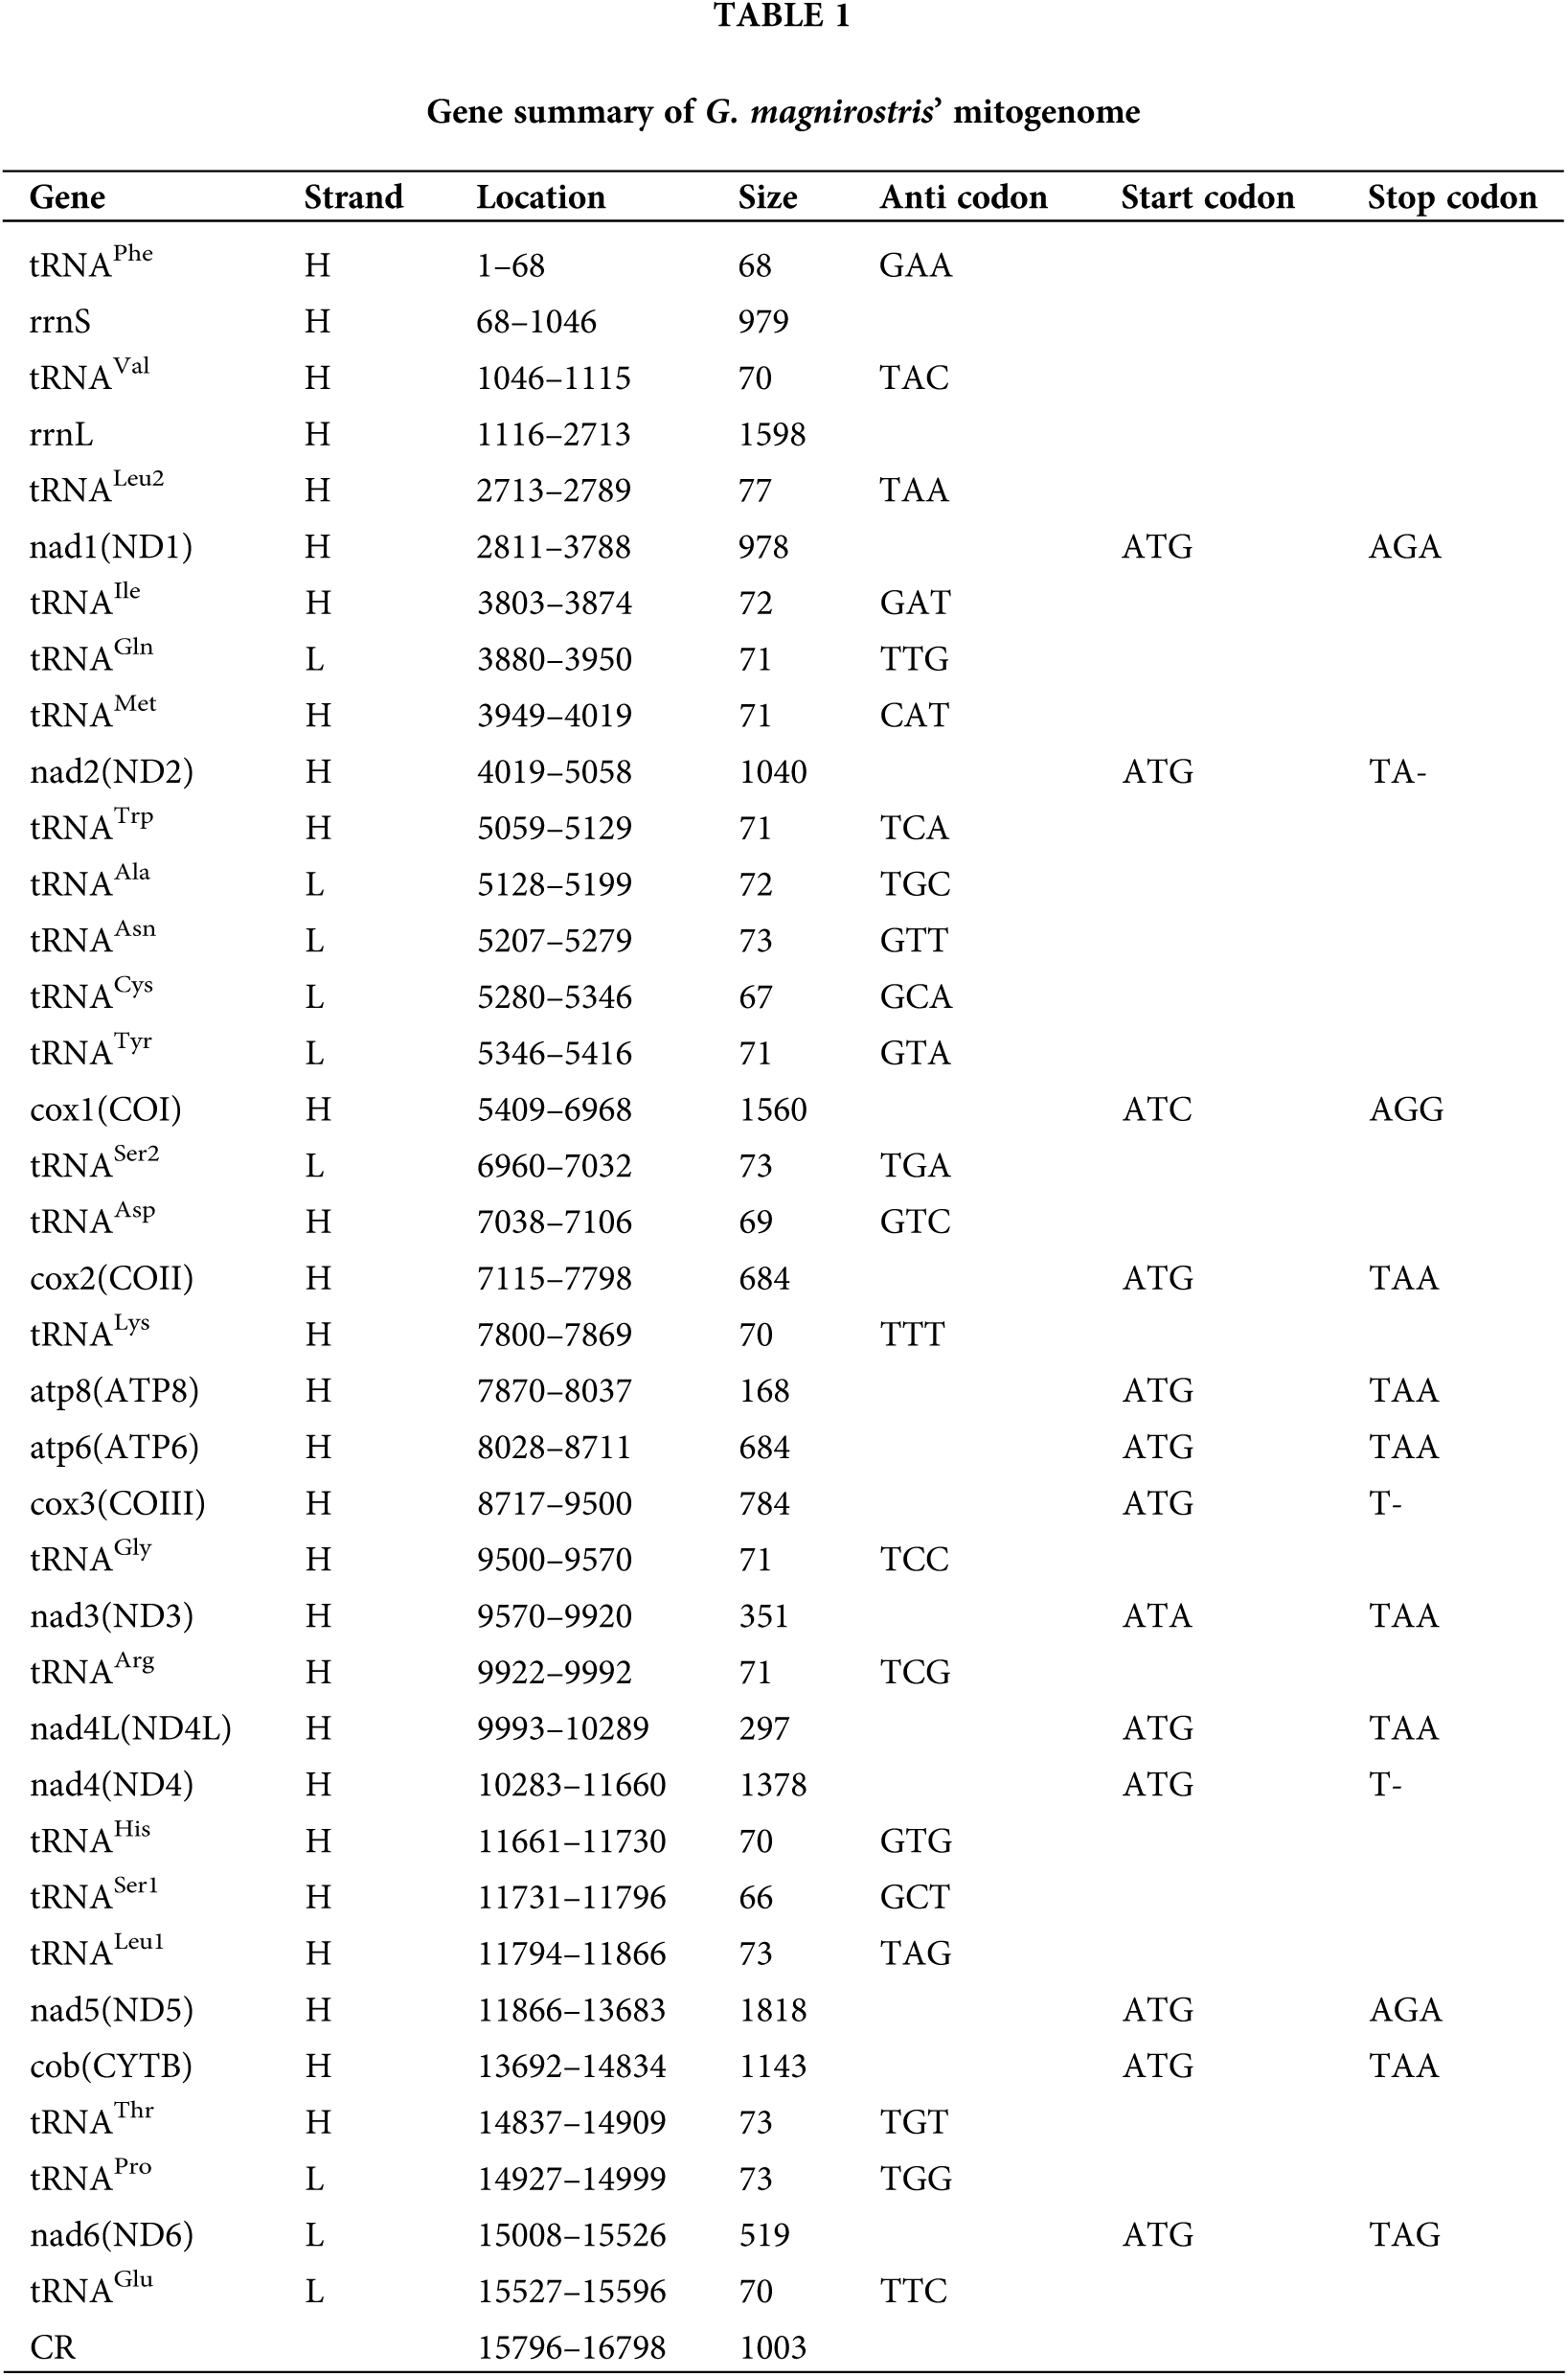

Like vast majority passerine birds, 22 tRNAs were found to exist and annotated in the mitogenome of G. magnirostris with a total length of 1,562 bp. Distribution of tRNAs on both Heavy and Light strands, 14 tRNAs were encoded by the Heavy strand while other 8 tRNAs were located on the Light strand. The longest tRNA was tRNALeu2 (UUR) (77 bp), and the shortest was tRNASer1 (AGY) (66 bp) (Table 1). All the tRNA genes expressed a typical cloverleaf secondary structure, except for tRNASer1 (AGY), whose dihydrouridine (DHU) arm was lack and insteaded with a simple loop (Fig. 1). We calculated the mismatches base pairs between various parts of tRNA over the four stems (AA, AC, TψC and DHU stem), and there were 35 mismatches in a total of 18 tRNAs. U–G mismatches occurred most frequently, with a total of 27 out of 18 tRNAs, while 3, 2, 2, 2 mismatches were found in A–C, C–C, U–U and A–A combinations, respectively (Table S1). Base mismatches may cause transform in the structure of tRNAs.


Figure 1: Secondary structure of the 22 translate RNA genes of G. magnirostris.
The total sequence length of two rRNA genes was 2,577 bp. The rrnS, located between tRNAPhe and tRNAVal and nucleotide positions from 68 to 1,046, had a length of 979 bp. The rrnL was located between tRNAVal and tRNALeu2 (UUR) and nucleotide positions from 1,116 to 2,713, was 1,598 bp (Table 1).
Control region, overlapping sequence and intergenic spacer regions
The non-coding regions mainly composed of control region, a few overlapping sequences (OS) and intergenic spacers (IGS), which had a small proportion in the mitochondria, but played an important role in transcription and translation. The control region was the longest non-coding region of G. magnirostris, located between tRNAGlu and tRNAPhe, with a length of 1,033 bp. 15 simple repetitive tandem sequences were found in the control region of eight species, among which 6 total 42 bp were found in G. magnirostris, ranking first with P. psittacea (Fig. 2). Repeated tandem sequence was the main reason for the difference of control region length.

Figure 2: Repeated tandem sequences distribution in control region of selected Passeriformes.
The IGS and OS were commonly found in the mtDNA of Passeriformes birds. The length of IGS ranges from 1 to 199 bp, with a total length of 300 bp over 14 regions. The spacer between tRNAGlu and CR (tRNAGlu–CR spacer) was confirmed as the longest (199 bp) in G. magnirostris (Table 3). The overlapping sequence length was 40 bp in total and spread over 15 regions, with the longest overlapping sequence was a 9-bp long sequence lied in COX1 and tRNASer2(UCN). Two characteristic conserved overlapping junction (ATGCTAA) and (CAAGAAAG) were observed as reported for most of the Passeriformes birds, overlapping junction (ATGCTAA) was found in between nad4L and nad4, while (CAAGAAAG) was found in between COX1 and tRNASer2(UCN). A special conserved overlapping junction (ATCTTACC) was found between tRNATyr and COX1.

Relative synonymous codon usage characteristic
According to the codon usage and RSCU results, the four most frequently used amino acids were Leu1 (CUN), Ile, Thr, Ala and their numbers were 616, 410, 328, and 301, respectively. The corresponding codons for these most used amino acids were CUA, AUC, ACC and GCC. Trp was found to be the least used amino acid in G. magnirostris in a quantity of only eight (Fig. 3). The codon analysis played a great role in studying gene expression, mutation, and evolutionary studies in G. magnirostris.

Figure 3: Codon usage and relative synonymous codon usage in G. magnirostris mitogenome.
Further analysis of the relative codon usage of eight species showed that the relative codon usage of G. magnirostris was lower than that of the other homologous species (Fig. 4). The codon usage of G. magnirostris was relatively average, and there was no particular bias. The codon CCC encoding proline was most preferred in G. magnirostris, while the codon CCA encoding proline was most preferred in M. adamsi. The codon ACG encoding threonine and the codon AAA encoding lysine were also highly expressed in M. adamsi. At the same time, the codon AAC encoding asparagine, the codon AUU encoding isoleucine, the codons CUC for leucine, CGA for arginine and GUU for valine showed low codon usage, showing significant codon usage bias.

Figure 4: Heatmap of relative synonymous codon usage for eight species.
G. magnirostris and T. episcopus were directly clustered in one branch by cluster analysis of relative codon usage. Similarly, S. maximiliani, and C. spiza were divided into the same group. The cluster analysis of relative codon usage showed that G. magnirostris was distantly related to family Fringillidae (P. psittacea) and Passeridae (M. adamsi).
Evolutionary rates characteristic
The total length of the 13 PCGs was 11,404 bp, which constituted around 67.89% of the total mitochondrial genome. The 13 PCGs distributed on the double-stranded mitochondrial genome. Among 13 PCGs, 12(ND1-5, COX1-3, ATP8, ATP6, ND4L, Cytb) were coded on the Heavy strand, The ND6 was the only PCGs located on the Light strand. The 13 PCGs ranged in size from 168 (ATP8) to 1,818 (ND5) bp. The start codon of all PCGs in G. magnirostris was ATN sequence. These codons included ATG (ND1-2, COX2-3, ATP8, ATP6, ND4L, ND4-6 and Cytb), ATA (ND3) and ATC (COX1). The stop codons of the three PCGs (ND2, COX3 and ND4) were incomplete, with only T- or TA- replacing complete stop codon form TAA or TAG (Table 1).
The ratio Ka/Ks of all PCGs was less than 1, ND5 gene exhibited 0.87 ratio with reference to that of P. psittacea was the highest. The ATP8 gene had the second Ka/Ks rate 0.33 and the remaining 11 encoded protein genes had a Ka/Ks value of less than 0.3 (Fig. 5). The average value of the ka/ks rate of the ND5 gene was 0.212 times the highest among all components, followed by the ATP8 gene, and the average value of ka/ks rate was 0.21. The average ka/ks rate of the COX1 gene is the lowest, only 0.028. The second was the COX3 gene, and the average ka/ks rate was 0.029. The results showed that G. magnirostris receives less natural selection pressure.

Figure 5: Evolutionary rates (Ka/Ks) of individual of G. magnirostris with selected species. Ka and Ks represent the rates of non-synonymous substitutions and synonymous substitutions, respectively.
Both mitochondrial and nuclear genes have been widely used in the identification and delineation of controversial species of passerines. The mitochondrial genome was used in a wide range of multi-groups due to its short sequence length, large variability, and low extraction difficulty. To elucidate the phylogenetic position of G. magnirostris, the phylogenetic tree was constructed with 18 published completed mitochondrial genomes of Passeriformes birds (representing five families) based on the 13 PCGs (Fig. 6). It is obvious that G. magnirostris and T. episcopus were directly clustered in one branch, the result supported the conclusion that G. magnirostris belonged to the morphological classification of the family Thraupidae. The selected passerine birds for phylogenetic analysis were clearly divided into five main branches. In the selected Passeriformes species, Icteridae and Emberizidae was closely related to Thraupidae. The data obtained in this study will be helpful to further study the evolutionary history of G. magnirostris and to provide valuable genomes resources for phylogenetic, taxonomic studies, and the exchange of information between nuclear genomes.

Figure 6: Inferred phylogenetic relationships among Passeriformes birds based on shared PCGs sequence.
Like other typical avian mitochondrial genomes, G. magnirostris mtDNA is closely aligned with no introns and few repeats (Xin et al., 2015). In avian, the difference in mitochondrial genome length is mainly caused by the change of the non-coding region sequence. It is widely believed that non-coding regions have higher percentage variability than PCGs and therefore have faster evolutionary rate. Differences in base composition can lead to structural asymmetry. In bird’s mitochondrial genomes, the GC-skew value is always negative, indicating that base cytosine usage is greater than guanine. Similarly, the use rate of base adenine is greater than base thymine. GC-skew (−0.405) and AT skew (0.135) values in G. magnirostris mtDNA are also in accord with this principle (Huang et al., 2018).
It is considered that tandem repeats of partial mitogenome result in tRNA rearrangement. The number of mismatches is the lowest than the selected Passeriformes birds. The mismatched base pairs in tRNAs lead to changes in tRNAs structure, which shows that the gene sequences of G. magnirostris are very conservative. The consistency of the base pairs of stems may be to avoid dysfunction of tRNAs and maintain the stability of the structure, which are actively involved in amino acid transport, protein synthesis and are important for survival in a flexible environment (Lawson and Petren, 2017).
The control region is the only major non-coding segment in mtDNA, with high variability, large differences between species, and evolution rates three to five times faster than PCGs. The control region has influences in the replication of mitogenome. G. magnirostris’s control region is the shortest among all selected species. A special conserved overlapping junction (ATCTTACC) is found between tRNATyr and COX1. This spacer is involved in mitochondrial transcription termination where the “ATCTTACC” motif can serve as a feature recognition site for COX1 and tRNATyr genes and is essential as a recognition site for mtTERM (Camasamudram et al., 2003).
From the evolution rate analysis of PCGs, functional constraints between selected species can be reflected by different evolutionary rates between genes. A ratio of synonymous replacement rates and non-synonymous replacement rates of less than 1 indicates that the gene is in a purification selection or under negative selection. The ratio Ka/Ks of all G. magnirostris’s PCGs are less than 1, which suggests variability is replaced by synonymous nucleotides. Ks represents the background base replacement rate of the evolution process, so Ks can be used to infer the time of the event, such as the time of the whole genome doubling, which has important applications in exploring the origin of species, and we will further strengthen our research in the future.
Based on the result of our phylogenetic analysis, it is obvious that G. magnirostris and T. episcopus clustered in one branch. Previous papers confirmed that there is a connection between G. magnirostris and members of Thraupidae (Grant et al., 2000). G. magnirostris, T. episcopus, S. maximiliani and C. spiza were identified as a monophyletic group, which they are also belong to genus Thraupis. The results support the conclusion that G. magnirostris belongs to the morphological classification of the family Thraupidae (Rands et al., 2013). Cluster analysis of relative codon usage also supports G. magnirostris and T. episcopus belonging to the same branch, having common ancestry. S. maximiliani are similar in shape to G. magnirostris and previously proposed as close taxa to G. magnirostris based on morphological, behavioral, and ecological data, but S. maximiliani are not their closest relatives (Burns et al., 2002). All of these branch nodes in phylogenetic tree have high numerical support, so generated phylogenetic tree results can be used for testing hypotheses about the origin and evolution within G. magnirostris. Molecular biology classification combined with traditional morphological classification can effectively resolve some species origin disputes.
Availability of Data and Materials: Mitochondrial genome sequence of all species used in the article can be obtained from NCBI (https://www.ncbi.nlm.nih.gov/nuccore/), including genetic annotation data. Sequences data and annotation data of Geospiza magnirostris were submitted to NCBI database with accession number MG682351. The other mitochondrial genomic data mentioned in articles also can be accessed from NCBI and the accession number is described in method section. No special codes are used in the research and the parameters of the related software are described in detail in the method section.
Authors’ Contribution: The authors confirm contribution to the paper as follows: study conception and design: Xu Zhenggang, Zhao Yunlin, Wu Liang; data collection: Wu Liang, Xu Zhenggang; analysis and interpretation of results: Wu Liang, Xu Zhenggang, Yang Guiyan, Han Chongxuan, Chen Jiahao, Huang Tian; draft manuscript preparation: Wu Liang, Xu Zhenggangy. All authors reviewed the results and approved the final version of the manuscript.
Ethics Approval: Not applicable.
Funding Statement: The study was supported by National Natural Science Foundation of China [Grant No. U20A20118], and College Students’ Innovative Entrepreneurial Training Plan Program of Shannxi Province [Grant No. S202010712295].
Conflicts of Interest: The authors declare that they have no conflicts of interest to report regarding the present study.
Boore JL (1999). Animal mitochondrial genomes. Nucleic Acids Research 27: 1767–1780. [Google Scholar]
Burns KJ, Hackett SJ, Klein NK (2002). Phylogenetic relationships and morphological diversity in Darwin’s finches and their relatives. Evolution 56: 1240. [Google Scholar]
Camasamudram V, Fang JK, Avadhani NG (2003). Transcription termination at the mouse mitochondrial H-strand promoter distal site requires an A/T rich sequence motif and sequence specific DNA binding proteins. FEBS Journal 270: 1128–1140. [Google Scholar]
Catanese G, Infante C, Manchado M (2008). Complete mitochondrial DNA sequences of the frigate tuna Auxis thazard and the bullet tuna Auxis rochei. Mitochondrial DNA 19: 159–166. [Google Scholar]
Ericson PG, Johansson US (2003). Phylogeny of Passerida (Aves: Passeriformes) based on nuclear and mitochondrial sequence data. Molecular Phylogenetics & Evolution 29: 126–138. [Google Scholar]
Grant PR (1981). The feeding of Darwin’s finches on Tribulus cistoides (L.) seeds. Animal Behaviour 29: 785–793. [Google Scholar]
Grant PR, Grant BR, Petren K (2000). The allopatric phase of speciation: The sharp-beaked ground finch (Geospiza difficilis) on the Galápagos islands. Biological Journal of the Linnean Society 69: 287–317. [Google Scholar]
Hall TA (1999). BioEdit: A user-friendly biological sequence alignment editor and analysis program for Windows 95/98/NT. Nucleic Acids Symposium Series 41: 95–98. [Google Scholar]
Huang T, Peng J, Zhao Y, Xu Z (2018). The complete mitochondrial genome of Pelecanus occidentalis (Pelecaniformes: Pelecanidae) and its phylogenetic analysis. Mitochondrial DNA Part B 3: 782–783. [Google Scholar]
Jühling F, Pütz J, Bernt M, Donath A, Middendorf M et al. (2012). Improved systematic tRNA gene annotation allows new insights into the evolution of mitochondrial tRNA structures and into the mechanisms of mitochondrial genome rearrangements. Nucleic Acids Research 40: 2833–2845. [Google Scholar]
Katoh K, Standley DM (2013). MAFFT multiple sequence alignment software version 7: Improvements in performance and usability. Molecular Biology and Evolution 30: 772–780. [Google Scholar]
Krzeminska U, Wilson R, Rahman S, Song BK, Gan HM et al. (2016). The complete mitochondrial genome of the invasive house crow Corvus splendens (Passeriformes: Corvidae). Mitochondrial DNA Part A 27: 974–975. [Google Scholar]
Kumar S, Stecher G, Tamura K (2016). MEGA7: Molecular evolutionary genetics analysis version 7.0 for bigger datasets. Molecular Biology & Evolution 33: 1870. [Google Scholar]
Lamichhaney S, Berglund J, Almén MS, Maqbool K, Grabherr M et al. (2015). Evolution of Darwin’s finches and their beaks revealed by genome sequencing. Nature 518: 371–375. [Google Scholar]
Lawson LP, Petren K (2017). The adaptive genomic landscape of beak morphology in Darwin’s finches. Molecular Ecology 26: 4978–4989. [Google Scholar]
Li C, Zhao Y, Xu Z, Yang G, Peng J, Peng X (2020). Initial characterization of the chloroplast genome of Vicia sepium, an important wild resource plant, and related inferences about its evolution. Frontiers in Genetics 11: 73. [Google Scholar]
Lijtmaer DA, Sharpe NM, Tubaro PL, Lougheed SC (2004). Molecular phylogenetics and diversification of the genus Sporophila (Aves: Passeriformes). Molecular Phylogenetics & Evolution 33: 562–579. [Google Scholar]
Liu W, Xie Y, Ma J, Luo X, Peng N et al. (2015). IBS: An illustrator for the presentation and visualization of biological sequences. Bioinformatics 31: 3359–3361. [Google Scholar]
Lowe TM, Chan PP (2016). tRNAscan-SE On-line: Integrating search and context for analysis of transfer RNA genes. Nucleic Acids Research 44: W54–W57. [Google Scholar]
Mackiewicz P, Urantówka AD, Kroczak A, Mackiewicz D (2019). Resolving phylogenetic relationships within Passeriformes based on mitochondrial genes and inferring the evolution of their mitogenomes in terms of duplications. Genome Biology and Evolution 11: 2824–2849. [Google Scholar]
Nguyen LT, Schmidt HA, Von Haeseler A, Minh BQ (2014). IQ-TREE: A fast and effective stochastic algorithm for estimating maximum-likelihood phylogenies. Molecular Biology and Evolution 32: 268–274. [Google Scholar]
Qiang L, Wan JM (2005). SSRHunter: Development of a local searching software for SSR sites. Yi Chuan = Hereditas 27: 808–810. [Google Scholar]
Rands CM, Darling A, Fujita M, Kong L, Webster MT et al. (2013). Insights into the evolution of Darwin’s finches from comparative analysis of the Geospiza magnirostris genome sequence. BMC Genomics 14: 95. [Google Scholar]
Remsen JV, Powell AF, Schodde R, Barker FK, Lanyon SM (2016). A revised classification of the Icteridae (Aves) based on DNA sequence data. Zootaxa 4093: 285–292. [Google Scholar]
Ronquist F, Teslenko M, van der Mark P, Ayres DL, Darling A et al. (2012). MrBayes 3.2: Efficient Bayesian phylogenetic inference and model choice across a large model space. Systematic Biology 61: 539–542. [Google Scholar]
Rozas J, Ferrermata A, Sánchezdelbarrio JC, Guiraorico S, Librado P et al. (2017). DnaSP 6: DNA sequence polymorphism analysis of large datasets. Molecular Biology & Evolution 34: 3299–3302. [Google Scholar]
Ruan J, Jian C, Zhang T, Jiang H (2017). Mitochondrial genome evolution in the Saccharomyces sensu stricto complex. PLoS One 12: e0183035. [Google Scholar]
Sato A, O’huigin C, Figueroa F, Grant PR, Grant BR et al. (1999). Phylogeny of Darwin’s finches as revealed by mtDNA sequences. Proceedings of the National Academy of Sciences of the United States of America 96: 5101–5106. [Google Scholar]
Simon C, Frati F, Beckenbach A, Crespi B, Liu H, Flook P (1994). Evolution, weighting, and phylogenetic utility of mitochondrial gene sequences and a compilation of conserved polymerase chain reaction primers. Annals of the Entomological Society of America 87: 651–701. [Google Scholar]
Singh D, Kabiraj D, Sharma P, Chetia H, Mosahari PV et al. (2017). The mitochondrial genome of Muga silkworm (Antheraea assamensis) and its comparative analysis with other lepidopteran insects. PLoS One 12: e0188077. [Google Scholar]
Tauno M, Jaak V (2015). ClustVis: A web tool for visualizing clustering of multivariate data using Principal Component Analysis and heatmap. Nucleic Acids Research 43: W566–W570. [Google Scholar]
Wu L, Zhao Y, Xu Z, Huang T, Zhou L, Liu S (2018). The complete mitochondrial genome and phylogeny of Geospiza magnirostris (Passeriformes: Thraupidae). Conservation Genetics Resources 11: 191–193. [Google Scholar]
Xia X (2017). DAMBE6: New tools for microbial genomics, phylogenetics, and molecular evolution. Journal of Heredity 108: 431–437. [Google Scholar]
Xia X, Xie Z (2001). DAMBE: Software package for data analysis in molecular biology and evolution. Journal of Heredity 92: 371–373. [Google Scholar]
Xin C, Li S, Zhang Z, Wang X, Huang Y (2015). The complete mitochondrial genome of Pseudopodoces humilis (Passeriformes, Paridae). DNA Sequence 27: 4017–4018. [Google Scholar]
Supplementary Materials

 | This work is licensed under a Creative Commons Attribution 4.0 International License, which permits unrestricted use, distribution, and reproduction in any medium, provided the original work is properly cited. |