DOI:10.32604/biocell.2022.019455
| BIOCELL DOI:10.32604/biocell.2022.019455 | |
| Article |
Genome-wide identification of U-box gene family and expression analysis under abiotic stresses in Salvia miltiorrhiza
1Zhejiang Province Key Laboratory of Plant Secondary Metabolism and Regulation, College of Life Sciences and Medicine, Zhejiang Sci-Tech University, Hangzhou, 310018, China
2UWA School of Agriculture and Environment and The UWA Institute of Agriculture, Faculty of Science, The University of Western Australia, Perth, 6009, Australia
*Address correspondence to: Ling Xu, lxu@zstu.edu.cn
Received: 25 September 2021; Accepted: 12 November 2021
Abstract: Plant U-box (PUB) E3 ubiquitin ligases play important roles in hormone signaling pathways and in response to different abiotic stresses, but little is known about U-box genes in Danshen (root of Salvia miltiorrhiza Bunge). Here, we identified and characterized 70 SmPUB genes based on its genome sequence. Phylogenetic analysis of U-box genes from S. miltiorrhiza and Arabidopsis suggested that they can be clustered into seven subgroups (I–VII). Typical U-box domains were found in all identified SmPUB genes through the analysis of conserved motifs. Moreover, qRT-PCR was applied to analyze the relative expression levels of U-box genes in S. miltiorrhiza roots and leaves under PEG-induced water deficit and salt stresses. Results revealed that the SmPUB genes exhibited stronger response to drought than to salt stress. To the best of our knowledge, this report is the first to perform genome-wide identification and analysis of the U-box gene family in S. miltiorrhiza, and the results provide valuable information for better understanding of the function of U-box in S. miltiorrhiza.
Keywords: Salvia miltiorrhiza; U-box E3 ubiquitin ligase; Gene-family; Abiotic stresses; Expression pattern
The rapid perception and response of plants to external environments play vital roles on plant tolerance. Ubiquitin/26S-proteasome system (UPS) is important to regulate the signal pathway in the post-translation stage of protein in response to environmental stresses (Sharma and Taganna, 2020). UPS pathway degrades ubiquitinated substrate proteins and is widely involved in a variety of cellular processes (Wang et al., 2017). E1 Ub-activating enzyme relies on ATP to activate ubiquitin, the activated ubiquitin is transferred to the E2 Ub-conjugating enzyme, and E3 Ub ligase transports ubiquitin to the substrate protein (Smalle and Vierstra, 2004).
The E3 ubiquitin ligases are classified into different families according to their structure, function, and substrate specificity (Kim et al., 2021). HECT (Homologous to E6-associated proteins C terminus), RING (Really Interesting New Gene) finger, and U-box domain proteins are three types of single-protein E3 ligases (Moon et al., 2004). The U-box E3 gene is a 75 amino acid domain that was first identified in yeast (Hatakeyama et al., 2001; Hänzelmann et al., 2010). The structure of U-box is similar to RING-finger domain, but lacks zinc-chelating residues, it utilizes the intramolecular interactions, especially hydrogen bonds to stabilize the U-box scaffold (Hatakeyama et al., 2001; 2003). Researchers identified U-box family members are 61 in Arabidopsis thaliana (Wiborg et al., 2008), 77 in Oryza sativa (Zeng et al., 2008), 91 in Musa acuminata (Hu et al., 2018), 125 in Glycine max (Wang et al., 2016) and 213 in Triticum aestivum L. (Yu et al., 2016). The large quantities of U-box genes identified in multiple species, and many studies have reported that U-box E3 genes respond to abiotic stress, such as light, drought, and salt in variety of plants (Adler et al., 2017; Bergler and Hoth, 2011; Woodson et al., 2015; Wang et al., 2020), indicating that the U-box family plays an important role in different stages of plant growth. Although previous studies have revealed that UPS participates in the response to various biotic/abiotic stresses and plant developmental pathways, the U-box genes in S. miltiorrhiza have not been reported yet.
Salvia miltiorrhiza is an important economical medicinal plant in the Salvia genus. It has been used as traditional Chinese medicine for thousands of years to treat coronary heart diseases, dysmenorrheal, amenorrhea, and inflammatory diseases (Cheng, 2006; Cheng, 2007). The main components of S. miltiorrhiza are tanshinone and hydrophilic phenolic acid. Tanshinone is mainly o-quinone type tanshinone diterpene. The phenolic acid mainly includes rosmarinic acid, salvianolic acid A, salvianolic acid B, and shikonic acid and other substances (Li and Lu, 2014; Yu et al., 2020).
In this study we identified and classified genes based on a hidden Markov model (HMM) search using the S. miltiorrhiza reference genome. A phylogenetic tree was constructed using the 70 genes encoding U-box proteins. Additionally, expression profiling of U-box genes was incorporated for S. miltiorrhiza under PEG-induced water deficit and salty stresses. The identification of the U-box gene family members in S. miltiorrhiza will help understand the fundamental aspects of the ubiquitin proteasomal degradation system regulated by PUB genes in plants. This study will provide new information on the classification and expression of U-box proteins, which may help further research on the ubiquitin proteasome of S. miltiorrhiza.
Identification and sequence analysis of U-box genes in Salvia miltiorrhiza
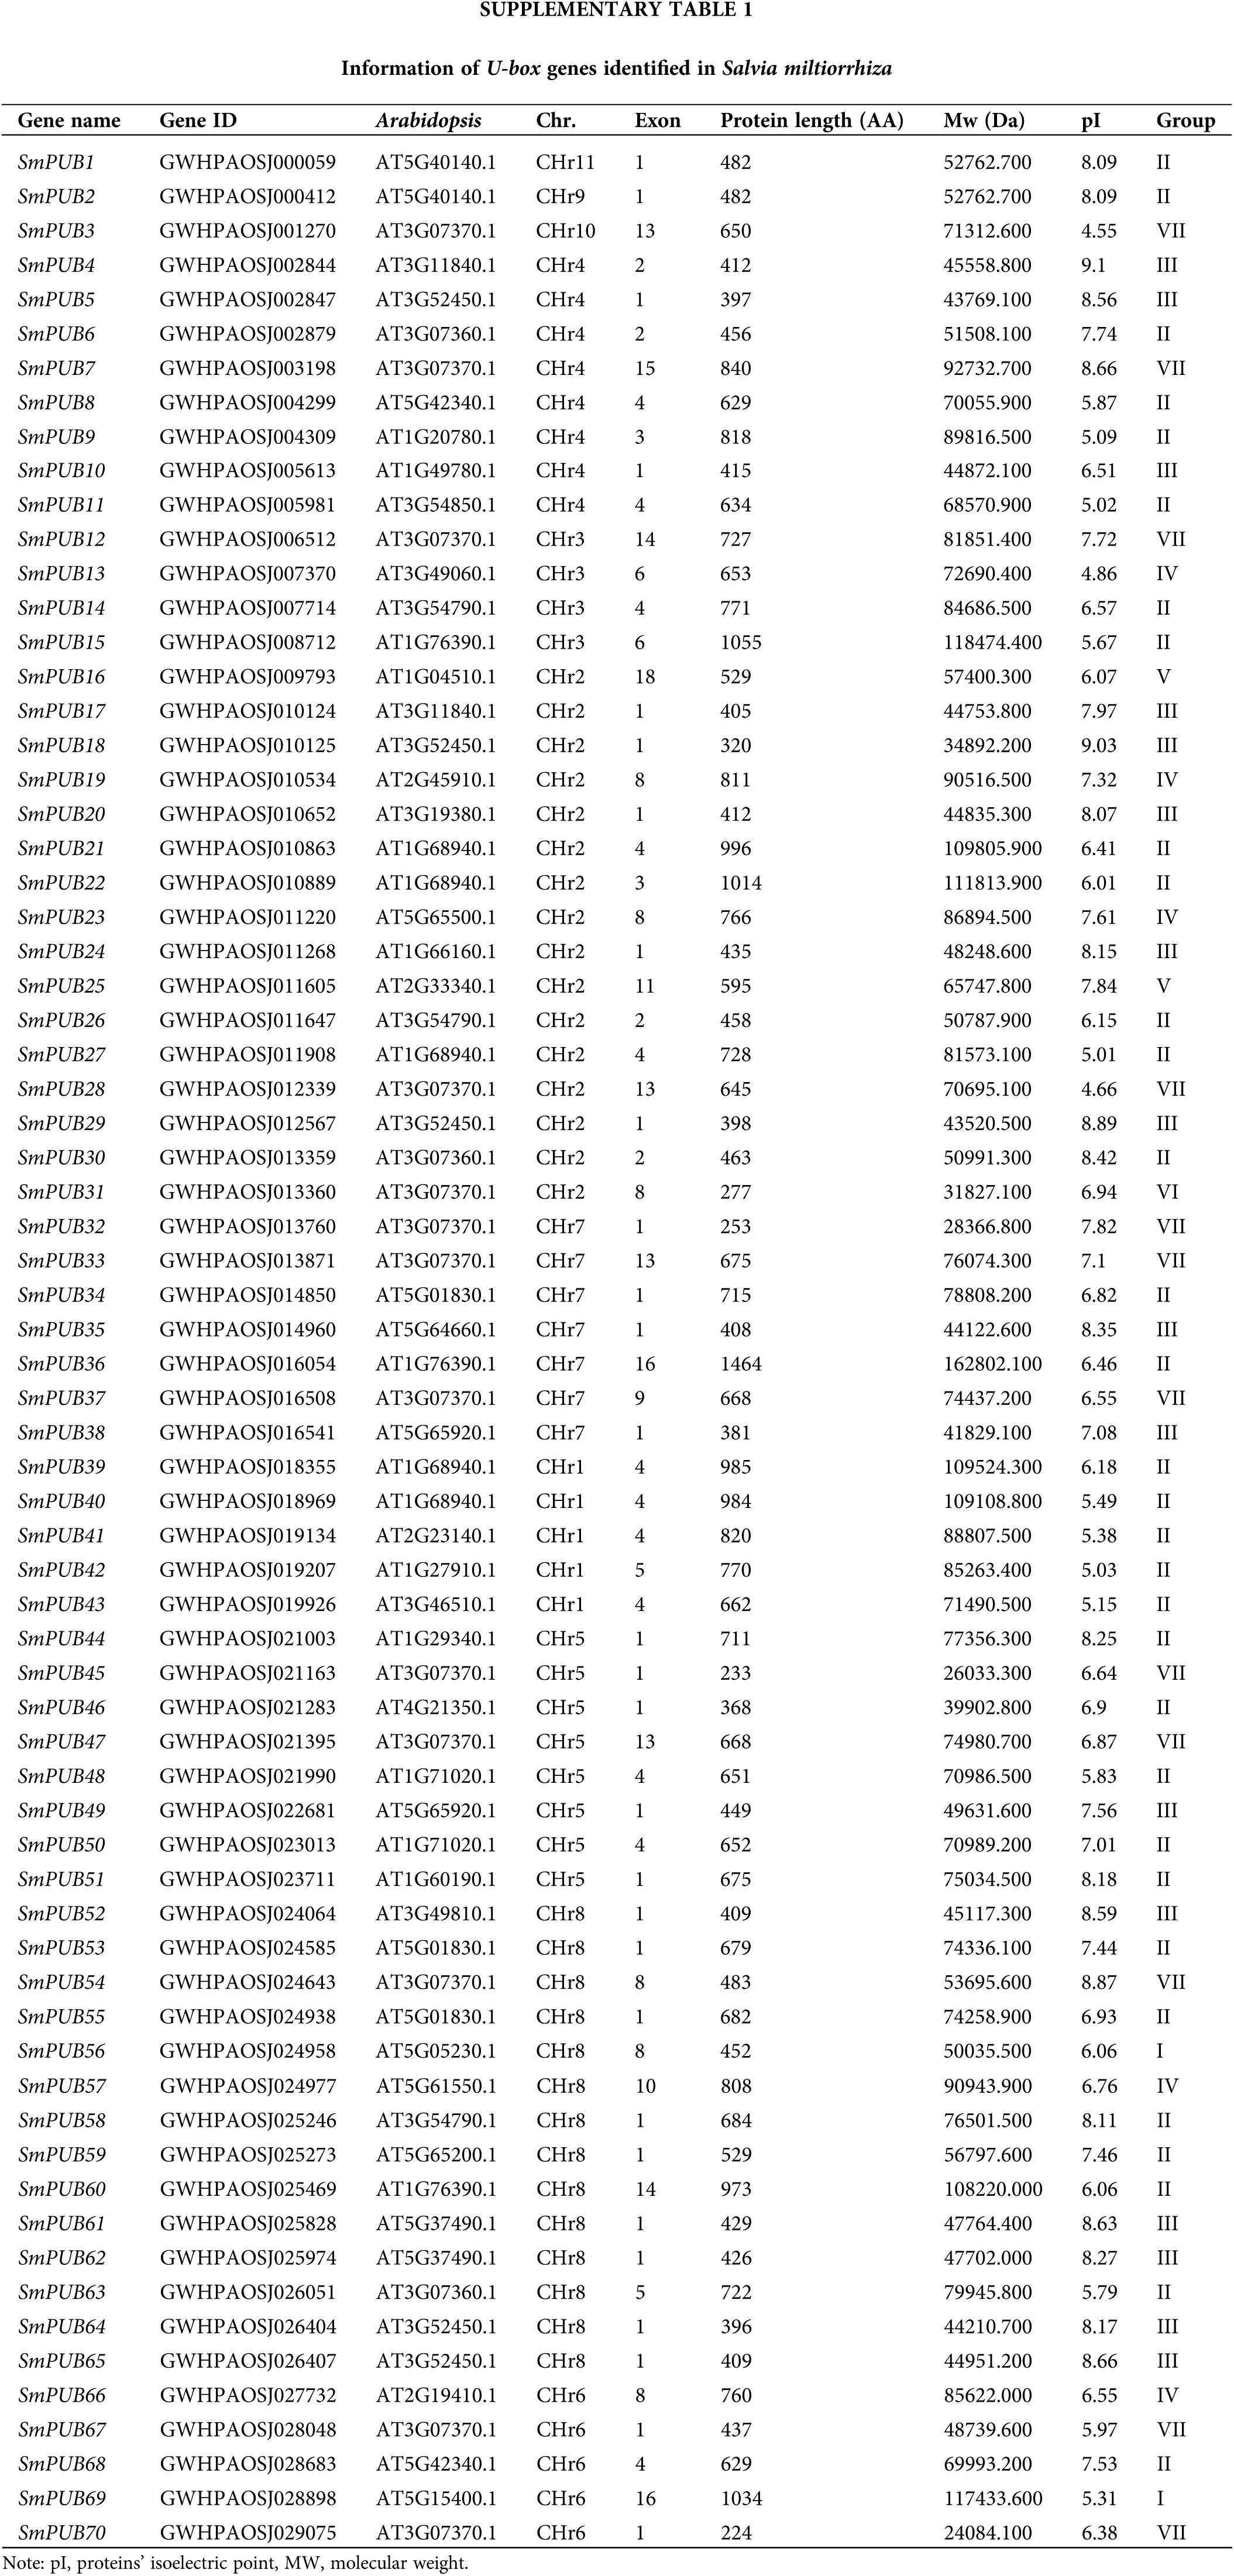
The S. miltiorrhiza sequences were downloaded from China National Center for Bioinformation (https://bigd.big.ac.cn/search/?dbId=gwh&q=+PRJCA003150). The U-box sequence data of Arabidopsis were obtained from TAIR (https://www.arabidopsis.org). A Hidden Markov Model (HMM) search was performed against the S. miltiorrhiza protein database using the U-box-domain (PF04564, http://pfam.xfam.org). An e-value ≤ 1.1e−10 was used as the standard. The primary candidate sequences were submitted in the Pfam database (http://pfam.xfam.org) and NCBI Conserved Domains Database (CDD, https://www.ncbi.nlm.nih.gov/cdd/) for verification. Finally, 70 U-box proteins were screened out in the S. miltiorrhiza genome. The isoelectric point and protein molecular weight of U-box proteins were predicted using the pI/Mw tool in ExPASy proteomics online sever (https://web.expasy.org/protparam/).
Multiple sequences alignment and phylogenetic analysis
A ClustalW analysis was used with the default option to implement the multiple sequence alignment on the U-box domain sequences of the U-box genes from two species, namely, S. miltiorrhiza and Arabidopsis. A Maximum Likelihood (ML) phylogenetic tree in MEGA7 with the following parameters: use all sites and bootstrap analysis with 1000 replicates for the reliability of interior branches (Kumar et al., 2016).
Protein properties and sequence analysis
70 SmPUBs were analyzed by MEME online software (https://meme-suite.org/meme/tools/meme) for conversed motif prediction with the following criteria: Select the site distribution: zoops, 10 motifs with an optimum motif width between 10 and 50 residues, and any number of repetitions. The location information of CDS and UTR in the mRNA of SmPUBs was screened from the GFF file of the whole genome of S. miltiorrhiza, and the gene structure was identified.
Plant materials and abiotic stress treatments
The seeds of S. miltiorrhiza used in this study were obtained from Shanxi Province, China. The seeds were sterilized using 70% ethanol followed by rinsing three times with distilled water, then moved to a seedling tray spread with gauze. Water was added to moisten the gauze, and germination was done under dark conditions at 25°C. Seven days later, after the seeds germinated, the seedlings were transplanted into a flowerpot (170 mm × 220 mm) with a matrix of peat soil, vermiculite, and perlite in a ratio of 3:2:1 (v:v). Plants were cultivated in a greenhouse. The ambient temperature was 20oC/16oC day and night, the photoperiod was 14h, and the relative humidity was maintained at about 60%.
For abiotic stress experiments, S. miltiorrhiza was planted for 4 months, and seedlings of the same size were selected. They were exposed to simulated drought stress treatment using PEG 6000 (0, 5, and 10%) and salt stress treatment using NaCl (0, 100, and 200 mM). The treatment concentrations were based on findings from pre-experimental studies, in which PEG effects were tested at 0, 5, 10, 15, and 20%. PEG at 5% showed a little damage to plant growth and 10% PEG imposed a significant damage to plant growth, whereas concentrations higher than 10% were too harmful for plant growth. The concentrations of NaCl were tested at 0, 100, 200, 300, and 500 mM. NaCl at 100 mM showed a little damage to plant growth and 200 mM NaCl imposed a significant damage to plant growth, whereas concentrations higher than 200 mM were too toxic for plant growth. After digging up the S. miltiorrhiza from the soil and washing it, the roots of the seedlings are soaked in a solution of the corresponding concentration for 48 h in hydroponic culture. Uniform plants were selected from each treatment, and the 4th to 8th leaves and fibrous roots on each plant were taken for experiment. These samples were snap-frozen in liquid nitrogen and stored at −80oC for further use.
Total RNA extraction and cDNA synthesis
RNA was extracted using the TIANGEN kit, for tissue-specific expression, RNA was extracted from different tissues, including the roots and leaves. RNA integrity was examined through agarose gel electrophoresis, and RNA purity was determined based on the OD260/OD280 and OD260/OD230 nm ratios. The RNA extracted was reversely transcribed into cDNA using the TaKaRa (Dalian, China) reverse transcription kit. The cDNA was then diluted 10-fold to be employed as a template for qRT-PCR analysis (Wang et al., 2021).
Transcriptional analysis by real-time quantitative PCR (RT-qPCR)
RT-qPCRs were performed using the ChamQ Universal SYBR qPCR Master Mix (Vazyme, China) and carried out in duplicate for each tissue sample. Gene-specific primers were designed using Real-time PCR (TaqMan) Primer and Probes Design Tool (https://www.genscript.com/tools/real-time-pcr-taqman-primer-design-tool). The length of amplicons was between 150 bp and 200 bp. SmActin was selected as a reference gene (Xing et al., 2018). A total of 70 genes were used on the RT-qPCR experiments. Two independent biological replicates were performed. The obtained cDNA was used as a template for the RT-qPCR analysis using the QuantStudio TM Flex6 System (ABI, Alexandria, America).
U-box proteins 3D structure analysis
Protein secondary structure was investigated by the GORIV secondary structure prediction method. Finally, the online prediction tool SWISS-MODEL (https://swissmodel.expasy.org/) was applied to predict the tertiary structures of SmPUB proteins.
Gene expression data were presented as mean values of four replicates with standard error. The 2−ΔΔCt method was calculated for relative quantification. Two-way analysis of variance (ANOVA) was performed, followed by the Fisher’s least significant difference (LSD) test for multiple comparisons to determine significant differences (P < 0.05) between individual treatments using SPSS (Version 20.0, IBM, USA).
Identification of U-box genes in the S. miltiorrhiza Genome
A total of 70 SmPUB genes were identified by HMM profiling against the local protein database of the CNCB (China National Center for Bioinformation). The 70 S. miltiorrhiza U-box proteins ranged from 224 (SmPUB70) to 1464 (SmPUB36) amino acid (aa) in length, with an average length of approximately 614.7 aa. The molecular weights (MWs) ranged from 24084.1 Da (SmPUB70) to 162802.1 Da (SmPUB36). The isoelectric points (pIs) of the U-box proteins ranged from 4.55 (SmPUB3) to 9.1 (SmPUB4), with 36 pIs < 7 and the remaining pIs > 7.
Phylogenetic analysis of the SmPUB genes
To further analyze the evolution of these SmPUBs, we constructed a phylogenetic tree based on a total of 131 PUBs (61 from A. thaliana and 70 from S. miltiorrhiza distributed in different groups). Combined with the classification of A. thaliana U-box transcription factors, the conserved domains of candidate SmPUB were identified and analyzed. The results showed that U-box family protein sequences of S. miltiorrhiza can be divided into seven sub-groups that contained U-box domain and other specific domains (Fig. 1).

Figure 1: Phylogenetic analysis of PUBs proteins from S. miotiorrhiza and A. thaliana. The tree was constructed from amino sequences using MEGA VII via the Maximum Likelihood (ML) method with 1000 bootstrap replicated. Bootstrap values higher than 50% are shown on the nodes. The blue circles, empty triangles represent PUBs from S. miotiorrhiza and A. thaliana, respectively. Clades with different colors represent diverse groups.
Motif composition and structure of S. miltiorrhiza U-box gene family
The structure diagram of SmPUB protein was constructed based on the results of MEME motif analysis, 10 conversed motifs were predicted to further reveal the diversification of SmPUB genes (Fig. 2). The results showed that motifs 1, 2, 3, and 4 were most widely distributed in 63, 55, 54, and 36 SmPUB proteins, respectively. Most of the SmPUBs in the same group had similar motif composition and same motifs were absent in all sequences. All of these motifs repeated only once, except for the four genes (SmPUB3, SmPUB16, SmPUB21 and SmPUB28) only with one motif, the others had 2 to 4 motifs.
The exons of all the identified SmPUB genes were tested to gain a deeper understanding of the evolution of the U-box family of S. miltiorrhiza. The analysis results showed that 29 mRNAs had only one CDS, and the CDS of the remaining 41 mRNAs ranged from 2 to 18.

Figure 2: Gene structures and MEME motifs of U-box family from S. miltiorrhiza. The phylogenetic tree was constructed based on the full-length sequences of S. miltiorrhiza U-box proteins using MEGA 7.0 software. Details of branch are shown in different colors. The motif composition of S. miltiorrhiza U-box proteins was predicted by MEME. The bit score indicates the information content for each position in the sequence drawn by the MEME program. The relative positions of each conserved motif within the U-box proteins are shown in colors. The black lines represent the non-conserved sequences. The scale bar represents 10 amino acids. The green and yellow square represents the untranslated region (UTR) and coding sequences (CDS). The black lines represent introns. The scale bar represents 10 amino acid residues for protein sequences and 1.0 kb for gene structure.
Overall expression profiles of SmPUB genes under abiotic stresses
Expression patterns of the SmPUB genes under abiotic stresses including salt stress and PEG-induced water deficit as simulated drought stress was investigated by quantitative real-time PCR (qRT-PCR) analysis for 55 SmPUBs in root and leaf tissues of Salvia miltiorrhiza. The data were presented with clusters using log2 fold-change values.
As shown in Fig. 3, 55 SmPUBs having expression profiles were roughly clustered into four groups based on their expression patterns. The genes of the Cluster I were significantly upregulated under salty or drought conditions. This feature was more obvious in roots, for example, SmPUB17, SmPUB28, SmPUB53 were markedly upregulated by salt and simulated drought stresses. In contrast, the expressions of U-box genes in leaves did not change significantly under salt stress. Particularly, the three genes SmPUB22, SmPUB32 and SmPUB59 were not upregulated but slightly downregulated under salt stress.
In Cluster II and Cluster IV, 28 SmPUB transcripts were probably insensitive to salt and drought stresses. Among them, the nine genes in Cluster II were slightly up-regulated, while 19 genes in Cluster IV were slightly down-regulated. In Cluster III, 16 SmPUB genes were mainly downregulated after stress treatment. Among them, the expression levels of five genes (SmPUB10, SmPUB13, SmPUB38, SmPUB49, SmPUB63) were down-regulated more significantly in leaves, six genes (SmPUB25, SmPUB39, SmPUB55, SmPUB58, SmPUB64, SmPUB69) were down-regulated more markedly in roots, and the rest five genes (SmPUB14, SmPUB33, SmPUB37, SmPUB60, SmPUB68) were down-regulated in both roots and leaves. The differentexpression patterns indicated the differential response and regulatory mechanisms of the SmPUB family under various abiotic stress conditions. Notably in the leaves of plants treated with 5% PEG, almost all SmPUB genes were upregulated, which was different from all other treatments.

Figure 3: Expression patterns of 70 SmPUB genes in root (R) and leaf (L) with S. miltiorrhiza. The gene expression levels were detected via RT-qPCR. The heat map was generated using cluster software. The sources of the samples were as follows: L (CK, concentration of 100 mM/200 mM NaCl, 5% and 10% PEG 6000), R (CK, concentration of 100 mM/200 mM NaCl, 5% and 10% PEG 6000). Blocks with colors indicate low/down expression (blue), high/up expression (red), and non-expression/no change (white). Normalized expression level of SmPUBs were transformed by log2 (FPKM values).
Expression of U-box genes induced by abiotic stress in S. miltiorrhiza
The expressions of 10 genes were significantly induced under salt stress and 18 genes were induced under drought stress. The greatest increase in expression (nearly 27-fold) was detected in SmPUB54 at 5% PEG 6000 treatment in leaf and the second greatest increase in expression (nearly 25-fold) was found in SmPUB50 at 10% PEG 6000 treatment in root.
Under salt stress, the expression levels of four genes in leaves, including SmPUB35, SmPUB44, SmPUB52 and SmPUB62 (Fig. 4) and six genes (SmPUB11, SmPUB17, SmPUB35, SmPUB52, SmPUB62 and SmPUB66) in roots (Fig. 5) were gradually increased with the increasing of NaCl concentration. In addition, the expression levels of three genes (SmPUB26, SmPUB42 and SmPUB66) in the leaves reached the highest level at a concentration of 100 mM, and then the up-regulation rate was slightly reduced under higher concentration conditions. Similarly, the expression levels of two genes (SmPUB11 and SmPUB20) in leaves were upregulated at a concentration of 100 mM. It was downregulated at a concentration of 200 mM, and SmPUB26 in the root had the same expression pattern. Interestingly, SmPUB17 was down-regulated at 100 mM concentration and up-regulated at 200mM concentration in leaf, three genes (SmPUB20, SmPUB42 and SmPUB44) were also observed in the same trends of expression.

Figure 4: The expression patterns of selected genes in response to NaCl in leaves in S. miltiorrhiza. 0 = control plants without any treatment; 100 = plants exposed to 100 mM of NaCl for 48 h; 200 = plants exposed to 200 mM of NaCl for 48 h. The results are represented by means ± standard errors. Means are denoted by the same letter when there is no significant difference at P < 0.05 as determined by LSD test.

Figure 5: The expression patterns of selected genes in response to NaCl in roots in S. miltiorrhiza. 0 = control plants without any treatment; 100 = plants exposed to 100 mM of NaCl for 48 h; 200 = plants exposed to 200 mM of NaCl for 48 h. The results are represented by means ± standard errors. Means are denoted by the same letter when there is no significant difference at P < 0.05 as determined by LSD test.
Under simulated drought conditions, the expression change trend of six genes remained consistent in leaves (Fig. 6) and roots (Fig. 7). Under the stress of 5% PEG 6000, the expression amount was increased by a large extent. When PEG 6000 concentration was 10%, four genes (SmPUB7, SmPUB19, SmPUB59 and SmPUB62) were slightly upregulated, while the expression levels of SmPUB10 and SmPUB47 were downregulated compared to the control. The expression level of SmPUB37 in the leaf gradually increased with the increase of PEG 6000 concentration, while three genes (SmPUB28, SmPUB35 and SmPUB53) in the root showed the same increasing trend. Excluding the genes mentioned above, there were seven genes (SmPUB17, SmPUB20, SmPUB22, SmPUB26, SmPUB28, SmPUB35 and SmPUB53) which expression levels in leaves were up-regulated the most under 5% PEG 6000 stress, and the overall trend was up-regulation, and three genes (SmPUB50, SmPUB54 and SmPUB66) had the same pattern in roots. The expression levels of SmPUB32, SmPUB50, SmPUB54 and SmPUB66 in leaves showed an increasing trend at first and then decreasing, other four genes (SmPUB20, SmPUB22, SmPUB26 and SmPUB37) showed the same pattern in roots. It is worth noting that the expression of SmPUB32 in roots was downregulated under 5% PEG 6000 treatment conditions, whereas a large amount of upregulation was shown under 10% PEG 6000 conditions.

Figure 6: The expression patterns of selected genes in response to PEG-induced water dificit in leaves in S. miltiorrhiza. 0 = control plants without any treatment; 5 = plants exposed to 5% PEG for 48 h; 10 = plants exposed to 10% PEG for 48 h. The results are represented by means ± standard errors. Means are denoted by the same letter when there is no significant difference at P < 0.05 as determined by LSD test.

Figure 7: The expression patterns of selected genes in response to PEG-induced water dificit in roots in S. miltiorrhiza. 0 = control plants without any treatment; 5 = plants exposed to 5% PEG for 48 h; 10 = plants exposed to 10% PEG for 48 h. The results are represented by means ± standard errors. Means are denoted by the same letter when there is no significant difference at P < 0.05 as determined by LSD test.
Structure features of S. miotiorrhiza
We selected 11 SmPUB proteins that responded positively under abiotic stresses. The predicted 3D structures are shown in Fig. 8. The structures of SmPUB17 and SmPUB53, SmPUB23 and SmPUB35, SmPUB44 and SmPUB62 were similar, suggesting shared functions. The secondary structures of SmPUBs comprised an α-helix, extended chain, and random coil. Eight out of all the SmPUB proteins (SmPUB17, SmPUB22, SmPUB23, SmPUB35, SmPUB44, SmPUB53, SmPUB59, SmPUB62) had a large proportion of α-helix (>45%), followed by random coil. However, the number of random coils in SmPUB19, SmPUB28, and SmPUB32 accounted for 45.75%, 52.87%, and 72.73%, respectively, which were the highest proportions.

Figure 8: Predicted three-dimensional domains of SmPUB proteins from S. miltiorrhiza.
Salvia miltiorrhiza is a well-known Chinese herb; the key secondary metabolites and bioactive compounds, tanshinones and phenolic acids, play vital roles in this plant. Biosynthesis and regulation mechanism of the S. miltiorrhiza secondary metabolite is the basis of S. miltiorrhiza quality control. Substantial research has focused on the transcriptional regulation of phenolic acids biosynthesis, but less is known about the protein post-translational modification controlling phenolic biosynthesis. Production of secondary metabolites is influenced greatly by environmental stimuli. Generally, production of secondary metabolites is enhanced when a plant undergoes stress, which costs energy, photosynthate, and nutrients (Waterman, 1992). This overproduction might cease at the removal of stress. Hence, turning on and turning off the biosynthetic pathway play equally important roles in the plant life cycle. The ubiquitin-proteasome system plays an important role in turning off the biosynthetic pathway by mediating the degradation of target proteins such as transcription factors or biosynthetic enzymes. For example, under cold condition, excessive generation of reactive oxygen species (ROS) leads to oxidative damage. Production of proanthocyanins effectively scavengers ROS and facilitates cold tolerance (Yu et al., 2020).
E3 ubiquitin ligase is the largest family of the ubiquitin proteasomal degradation mechanism that regulates the ubiquitination of the substrates (Duplan and Rivas, 2014; Vierstra, 2009). U-box E3 ubiquitin ligase is widely distributed in the plants and reported to participate in many cellular functions (Duplan and Rivas, 2014; Sharma et al., 2016; Santner and Estelle, 2010). We have identified 70 S.miltiorrhiza U-box E3 ubiquitin ligase genes with U-box domains utilizing HMM search. The S. miltiorrhiza U-box E3 ubiquitin ligase is largely hydrophilic that provides continuous hydrogen bond bridge for recurrent substrate interaction. The phylogenetic analysis of the S. miltiorrhiza U-box E3 family showed a great similarity among all the seven classes due to the presence of the core U-box domain in all the members. Most SmPUBs show closer phylogenetic distance to their putative S. miltiorrhiza homologs than to their corresponding putative Arabidopsis orthologs.
In the present study, 10 and 18 genes exhibited specific responses under salt and drought stress, respectively. Hu et al. (2018) analyzed the expression pattern of PUB genes in bananas found that the expression of 45 MaPUB genes was upregulated by more than 10 times under drought conditions. It was also found that 60 TaPUBs in wheat showed specific response to drought stress (Kim et al., 2021). Interestingly, among the 18 upregulated U-box E3 genes under drought condition, six genes also responded to salt stress. Similar results have occurred in the U-box family of soybeans (Wang et al., 2016). The GmPUB8 gene screened in this study was upregulated under drought, salt, and ABA treatment, suggesting that GmPUB8 plays a negative role in plant response to abiotic stress. All the above results indicate that the U-box E3 family plays a crucial role in plant resistance to drought environment, which provides a good foundation for further research. At the same time, we noticed that the PUB genes in the roots of S. miltiorrhiza was more active in response to salt concentration under salt stress. Among the 10 up-regulated SmPUB genes, the expression of nine genes gradually increased with the increase of salt concentration. Wang et al. (2019) also found the positive function of PUB gene by overexpression of TaPUB1 in wheat under salt stress. The mechanism might be due to maintain lower cytoplasmic Na+/K+ ratio and high antioxidant enzyme activity. In contrast, the expression of 12 SmPUBs were upregulated in low-level drought stress in this study. However, gene expression levels decreased as the concentration of PEG 6000 increased. Seo et al. (2021) revealed OsPUB41 gene plays a negative role in rice under water deficit environment, and the expression of OsPUB41 in WT reached a peak value after 1h drought treatment. OsPUB41 mutant or RNAi-OsPUB41 transgenic plants showed improved drought tolerance under water deficit condition. These results were consistent with our findings that the expression level of some SmPUBs was up-regulated in low PEG stress, however, SmPUB gene depressed, with the increase of PEG concentration.
So far, the role played by the U-box family in plants remains unclear. Through our experiments, we know that some U-box E3 proteins play a more important role in plant growth under stress, and studies have shown that the ubiquitination process regulates many cellular events during plant growth, such as stress response and hormone signals, cell division, senescence, and embryogenesis. We speculated that U-box E3 protein can not only respond to environmental stress, but also affected plant development. The characterization of U-box E3 ubiquitin ligases would provide a better insight into their roles in various cellular pathways. Our research presented the important role of the U-box E3 gene family in S. miltiorrhiza under various stresses. No report has been found on the U-box E3 family in S. miltiorrhiza. Our analysis characterized U-box E3 genes in S. miltiorrhiza, which would provide foundation for studying U-box E3 ubiquitin ligase in S. miltiorrhiza and other plants.
Author Contributions: LX, JL, and JP designed and conceived the study. JP, XL, and JL performed the experiments. JL, XL, and JP analyzed the data and wrote the manuscript. LX, HL, ZH, and ZY supported and supervised the experiment. All authors revised and approved the paper.
Ethics Approval: Not applicable.
Availability of Data and Materials: The datasets generated during and/or analysed during the current study are available from the corresponding author on reasonable request.
Funding Statement: This work was supported by the National Natural Science Foundation of China (31871694, 31800255), the Fundamental Research Funds of Zhejiang Sci-Tech University (2020Q022, 14042216-Y).
Conflicts of Interests: The authors declare that they have no conflicts of interest to report regarding the present study.
Adler G, Konrad Z, Zamir L, Mishra AK, Raveh D et al. (2017). The Arabidopsis paralogs, Pub 46 and Pub 48, encoding U-Box E3 ubiquitin ligases, are essential for plant response to drought stress. BMC Plant Biology 17: 8. [Google Scholar]
Bergler J, Hoth S (2011). Plant U-Box armadillo repeat proteins Atpub18 and Atpub19 are involved in salt inhibition of germination in Arabidopsis. Plant Biology 13: 725–730. [Google Scholar]
Xing BC, Yang DF, Lin L, Han RL, Sun YF et al. (2018). Phenolic acid production is more effectively enhanced than tanshinone production by methyl jasmonate in Salvia miltiorrhiza hairy roots. Plant Cell, Tissue and Organ Culture 134: 119–129. [Google Scholar]
Li CL, Lu SF (2014). Genome-wide characterization and comparative analysis of R2R3-MYB transcription factors shows the complexity of MYB-associated regulatory networks in Salvia miltiorrhiza. BioMed Central 15: 277. [Google Scholar]
Cheng TO (2007). Cardiovascular effects of Danshen. International Journal of Cardiology 121: 9–22. [Google Scholar]
Cheng TO (2006). Danshen: A popular Chinese cardiac herbal drug. Journal of the American College of Cardiology 47: 1498. DOI 10.1016/j.jacc.2006.01.001. [Google Scholar] [CrossRef]
Duplan V, Rivas S (2014). E3 ubiquitin-ligases and their target proteins during the regulation of plant innate immunity. Frontiers in Plant Science 5: 42. DOI 10.3389/fpls.2014.00042. [Google Scholar] [CrossRef]
Hänzelmann P, Stingele J, Hofmann K, Schindelin H, Raasi S (2010). The yeast E4 ubiquitin ligase Ufd2 interacts with the ubiquitin-like domains of Rad23 and Dsk2 via a novel and distinct ubiquitin-like binding domain. Journal of Biological Chemistry 285: 20390–20398. DOI 10.1074/jbc.M110.112532. [Google Scholar] [CrossRef]
Hatakeyama S, Kei-ichi IN (2003). U-box proteins as a new family of ubiquitin ligases. Biochemical and Biophysical Research Communications 302: 635–645. DOI 10.1016/S0006-291X(03)00245-6. [Google Scholar] [CrossRef]
Hatakeyama S, Yada M, Matsumoto M, Ishida N, Nakayama KI (2001). U box proteins as a new family of ubiquitin-protein ligases. Journal of Biological Chemistry 276: 33111–33120. DOI 10.1074/jbc.M102755200. [Google Scholar] [CrossRef]
Hu H, Dong C, Sun D, Hu Y, Xie J (2018). Genome-wide identification and analysis of U-Box E3 ubiquitin-protein ligase gene family in banana. International Journal of Molecular Sciences 19: 3874. [Google Scholar]
Kim DY, Lee YJ, Hong MJ, Kim JH, Seo YW (2021). Genome wide analysis of U-Box E3 ubiquitin ligases in wheat (Triticum aestivum L.). International Journal of Molecular Sciences 22: 2699. [Google Scholar]
Kumar S, Stecher G, Tamura K (2016). MEGA7: Molecular evolutionary genetics analysis version 7.0 for bigger datasets. Molecular Biology and Evolution 33: 1870–1874. [Google Scholar]
Moon J, Parry G, Estelle M (2004). The ubiquitin-proteasome pathway and plant development. Plant Cell 16: 3181–3195. [Google Scholar]
Santner A, Estelle M (2010). The ubiquitin-proteasome system regulates plant hormone signaling. Plant Journal 61: 1029–1040. [Google Scholar]
Seo DH, Lee A, Yu SG, Cui LH, Min HJ et al. (2021). OsPUB41, a U-box E3 ubiquitin ligase, acts as a negative regulator of drought stress response in rice (Oryza sativa L.). Plant Molecular Biology 106: 463–477. [Google Scholar]
Sharma B, Taganna J (2020). Genome-wide analysis of the U-box E3 ubiquitin ligase enzyme gene family in tomato. Scientific Reports 10: 9581. [Google Scholar]
Sharma B, Joshi D, Yadav PK, Gupta AK, Bhatt TK (2016). Role of ubiquitin-mediated degradation system in plant biology. Frontiers in Plant Science 7: 806. [Google Scholar]
Smalle J, Vierstra RD (2004). The ubiquitin 26S proteasome proteolytic pathway. Annual Review of Plant Biology 55: 555–590. [Google Scholar]
Vierstra RD (2009). The ubiquitin-26S proteasome system at the nexus of plant biology. Nature Reviews Molecular Cell Biology 10: 385–397. [Google Scholar]
Wang N, Liu Y, Cong Y, Wang T, Zhong X et al. (2016). Genome-wide identification of soybean U-box E3 ubiquitin ligases and roles of GmPUB8 in negative regulation of drought stress response in Arabidopsis. Plant & Cell Physiology 57: 1189–1209. [Google Scholar]
Wang QC, Zeng WJ, Ali B, Zhang X, Xu L et al. (2021). Genome-wide identification of WRKY gene family and expression analysis under abiotic stresses in Andrographis paniculata. BIOCELL 45: 1107–1119. [Google Scholar]
Wang W, Wang W, Wu Y, Li Q, Zhang G et al. (2020). The involvement of wheat U-box E3 ubiquitin ligase Tapub1 in salt stress tolerance. Journal of Integrative Plant Biology 62: 631–651. [Google Scholar]
Wang Z, Tian X, Zhao Q, Liu Z, Li X et al. (2017). The E3 ligase DROUGHT HYPERSENSITIVE negatively regulates cuticular wax biosynthesis by promoting the degradation of transcription factor ROC4 in rice. Plant Cell 30: 228–244. [Google Scholar]
Waterman PG (1992). Roles for secondary metabolites in plants. Ciba Foundation Symposium 171: 255–269; discussion 269–275. [Google Scholar]
Wiborg J, O’Shea C, Skriver K (2008). Biochemical function of typical and variant Arabidopsis thaliana U-box E3 ubiquitin-protein ligases. Biochemical Journal 413: 447–457. [Google Scholar]
Woodson JD, Joens MS, Sinson AB, Gilkerson J, Salomé PA et al. (2015). Ubiquitin facilitates a quality-control pathway that removes damaged chloroplasts. Science 350: 450–454. [Google Scholar]
Wang WL, Wang WQ, Wu YZ, Li QX, Zhang GQ et al. (2019). The involvement of wheat U-box E3 ubiquitin ligase TaPUB1 in salt stress tolerance. Journal of Integrative Plant Biology 62: 631–651. [Google Scholar]
Yu F, Wu Y, Xie Q (2016). Ubiquitin-proteasome system in ABA signaling: From perception to action. Molecular Plant 9: 21–33. [Google Scholar]
Yu H, Jiang M, Xing B, Liang L, Zhang B et al. (2020). Systematic analysis of Kelch Repeat F-box (KFB) protein family and identification of phenolic acid regulation members in Salvia miltiorrhiza Bunge. Genes 11: 557. [Google Scholar]
Zeng LR, Park CH, Venu R, Gough J, Wang GL (2008). Classification, expression pattern, and E3 ligase activity assay of rice U-box-containing proteins. Molecular Plant 1: 800–815. DOI 10.1093/mp/ssn044. [Google Scholar] [CrossRef]
 | This work is licensed under a Creative Commons Attribution 4.0 International License, which permits unrestricted use, distribution, and reproduction in any medium, provided the original work is properly cited. |