DOI:10.32604/biocell.2022.019613
| BIOCELL DOI:10.32604/biocell.2022.019613 | |
| Article |
MDA-TOEPGA: A novel method to identify miRNA-disease association based on two-objective evolutionary programming genetic algorithm
1College of Information and Electronic Engineering, Hunan City University, Yiyang, 413000, China
2College of Computer Science and Electronic Engineering, Hunan University, Changsha, 410082, China
*Address correspondence to: Buwen Cao, cbwhj@126.com; Jiawei Luo, luojiawei@hnu.edu.cn
Received: 01 October 2021; Accepted: 29 November 2021
Abstract: The association between miRNA and disease has attracted more and more attention. Until now, existing methods for identifying miRNA related disease mainly rely on top-ranked association model, which may not provide a full landscape of association between miRNA and disease. Hence there is strong need of new computational method to identify the associations from miRNA group view. In this paper, we proposed a framework, MDA-TOEPGA, to identify miRNA-disease association based on two-objective evolutionary programming genetic algorithm, which identifies latent miRNA-disease associations from the view of functional module. To understand the miRNA functional module in diseases, the case study is presented. We have been compared MDA-TOEPGA with several state-of-the-art functional module algorithm. Experimental results showed that our method cannot only outperform classical algorithms, such as K-means, IK-means, MCODE, HC-PIN, and ClusterONE, but can also achieve an ideal overall performance in terms of a composite score consisting of f1, Sensitivity, and Accuracy. Altogether, our study showed that MDA-TOEPGA is a promising method to investigate miRNA-disease association from the landscapes of functional module.
Keywords: MiRNA functional module; MiRNA-disease association; Two-objective; Evolutionary programming genetic algorithm
MicroRNAs (miRNAs) are small non-coding RNAs of approximately 22 nucleotides in length that play critical roles in various types of biological processes and complex diseases, including cancer (Fujii, 2018; He et al., 2017). Over the past few years, numerous models have been developed for miRNA–disease association prediction (Yu and Wang, 2021; Chen et al., 2012, 2017b, 2019a, 2019b, 2019c; Wang et al., 2019). For example, Chen et al. (2020b) proposed a neoteric Bayesian model combining kernel-based nonlinear dimensionality reduction, matrix factorization and binary classification. The AUCs of 0.9132, 0.8708, 0.9008 ± 0.0044 in global and local leave-one-out and five-fold cross validation, experimental results on three human cancers showed the effectiveness of the proposed method. In Chen et al. (2021), a new computational model named neighborhood constraint matrix completion for miRNA-disease association prediction was presented to predict potential miRNA-disease associations based on the known miRNA-disease associations and integrated disease (miRNA) similarity. It provided a novel idea of utilizing similarity information to assist the prediction of miRNA-disease. Chen et al. (2020a) proposed a rule-based inference method by collecting five categories of features, experimental results demonstrated the performance of the proposed method. In addition, several other models have been introduced to discover the latent miRNA-disease association.
By integrating the association probability obtained from matrix decomposition through sparse learning method, the miRNA functional similarity, the disease semantic similarity, and the Gaussian interaction profile kernel similarity for diseases and miRNAs into a heterogeneous network (Chen et al., 2018c), a computational model of matrix decomposition and heterogeneous graph inference is introduced to predict the miRNA-disease association. In Chen et al. (2019b), a computational framework integrating ensemble learning and dimensionality reduction was developed to infer potential miRNA-disease association, the performance evaluation and case studies demonstrated the effectiveness of the proposed method. A computational model of laplacian regularized sparse subspace learning for miRNA-disease association prediction from another viewpoint (Chen et al., 2017a). Based on the known miRNA-disease associations, integrated miRNA similarity and integrated disease similarity (Chen et al., 2018b), a novel computational model of bipartite network projection was developed to predict the miRNA-disease, experimental results showed the satisfied performance. However, some top-ranked miRNAs are difficult to reveal the association between miRNAs and diseases. A couple of studies have demonstrated that miRNAs are often clustered in the genome, while miRNAs in one cluster are often co-expressed to a large extent (Baskerville and Bartel, 2005). Similar to co-expressed genes, they are likely to have some similar functions and participate in similar life processes. Therefore, a great biological significance study is to combine these miRNAs in the same cluster (i.e., module) according to the association between miRNAs and some disease.
Studies have shown that miRNAs in the same cluster are more likely to be associated with similar diseases (Lu et al., 2008). Recently, the influence of miRNA group with similar expression patterns on disease has attracted more and more attention (Li et al., 2014b; Li et al., 2018). Xu et al. (2011) developed a functional module identification method for discovering cooperative miRNAs, which has been widely used in various cancers. Zhang et al. (2012) constructed a miRNA synergistic regulatory network in small cell lung cancer and identified a network module including three miRNAs of hsa-let-7c, hsa-let-7b and hsa-let-7d. Liang et al. (2014a) identified synergistic miRNA regulatory modules by overlapping neighbor nodes expansion in ovarian, breast and thyroid cancer. In Zhao et al. (2013), a miRNA-miRNA synergistic network was constructed in colorectal cancer and eight functional modules containing miRNAs that could execute some specific function in colorectal cancer. Shao et al. (2019) investigated the miRNA-miRNA cooperative pan-caner network and found the potential of pan-caner miRNA-miRNA cooperative regulation. It helps the discovery of tumorigenesis principles and development of anticancer drugs. Yang and Wan (2020) developed a computational approach to mine miRNA regulatory modules by executing link clustering on experimentally verified miRNA-target interactions. The experimental results on three types of cancer data sets from TCGA showed that the detected miRNA regulatory modules exhibit the effectiveness of the proposed method. Li et al. (2019) designed an online miRNA similarity computing platform based on miRNA-disease association, and the enrichment analysis of miRNA functional pairs was performed. Hui et al. (2017) developed a computational method to discover multi-disease associated co-functional miRNA pairs and conducted cross disease analysis on a reconstructed disease-gene-miRNA tripartite network. The findings provide a new insight into the effects of various miRNAs on multi-diseases. Shao et al. (2018) described the principle of miRNA-miRNA synergistic regulation by studying miRNA-miRNA synergistic regulation of 18 cancer types, and analyzed the obvious reconnection of miRNA-miRNA synergistic regulation between different cancers, it indicated that the pan-cancer miRNA-miRNA collaborative modules are helpful to the identification of tumorigeneitc mechanism and the development of anticancer drugs. Luo et al. (2019) proposed a rough clustering algorithm to identify miRNA regulatory modules, which include regulator (i.e., miRNA) and its target genes. Experimental results verified the effectiveness of the method. Nalluri et al. (2017) predicted the core set of miRNA-miRNA interactions using miRNA-disease expression profiles based on network inference, and identified the miRNA- miRNA associations based on the consistency, and finally obtained pan-cancer miRNA- miRNA module features. Yang et al. (2017) developed a clustering method to identify potential miRNA combination biomarkers. In Min et al. (2016), a two-stage method based on sparse singular value decomposition (SVD) was proposed to identify miRNA-gene co-regulation modules for the integrated analysis of multiple omics data of the same cancer. The effectiveness of the algorithm was verified by testing the breast cancer data in TCGA database. Paul and Madhumita (2020) proposed an algorithm to identify relevant and functionally consistent miRNA-mRNA modules in cervical cancer using the knowledge of the miRNA-miRNA synergistic network. Zhang et al. (2020) proposed a framework named LMSM to identify LncRNA related miRNA sponge modules from heterogeneous data, experimental results showed that LMSM outperformed a graph clustering-based strategy in identifying breast cancer related modules. Zhang et al. (2021) developed a tool of miRSM to infer and analyze miRNA sponge modules in heterogeneous data including miRNA, lncRNA, mRNA expression data and putative miRNA-target interactions. We attempted a novel method to infer miRNA-disease associations base on the identification of the functional modules, 243 known disease-related miRNAs were regarded as the standard sets that analyzed the performance of the generated miRNA functional modules. The latent associations between diseases and miRNAs were inferred based on the similarity of miRNA and the known associations between miRNAs and diseases (Cao et al., 2020). From above analysis, the research about miRNA functional module mainly focus on the combination module of miRNA and mRNA, co-regulation module of miRNA and gene, miRNA pairs and synergistic regulatory modules of miRNA- miRNA for selected cancers. Although the identification of association between miRNA functional module and disease has been attempted, our knowledge of miRNA functional module in disease is still limited. And, there are interactions existed among miRNAs (Teng et al., 2020), therefore, the association between miRNA functional module and disease should be further studied.
Inspired by Shao et al. (2019), we developed a novel method for miRNA-disease association identification called two-objective evolutionary programming genetic algorithm (MDA-TOEPGA) from the viewpoint of functional module based on network topological properties, i.e., size and the average shortest path (ASP). First, the common network topological characteristics of known miRNAs relating to certain disease were analyzed in miRNA similarity network, and then the objective function was formulated according the distribution of the network topological features. Finally, the proposed algorithm was described, and implemented in miRNA functional network (Liang et al. 2014a), similar to Shao et al. (2019), MDA-TOEPGA mainly consists of three steps, population initialization, subgraph mutation and subgraph selection operation. The experiment results showed that our method can not only outperform classical algorithms, such as K-means, IK-means, MCODE, HC-PIN, and ClusterOne, but also achieve an ideal overall performance in terms of a composite score consisting of f1, Sensitivity, and Accuracy. The case studies of miRNA functional modules further demonstrated the effectiveness of our method.
According to Liang et al. (2014a); Yang and Wan (2020), the miRNA functional similarity is computed with 5100 distinct experimentally confirmed associations between 326 diseases and 491 miRNAs after eliminating duplicate records, we obtain the miRNA function interaction network including 484 miRNAs with 24061 interactions. To assess the results of the identified miRNA functional modules, 326 diseases containing associated miRNAs are used as a benchmark dataset.
Generally, the dataset (5100 miRNA functional interaction) acts as the role of data sources; the gold standard (i.e., 326 diseases) that usually provides the most reliable evidence for physical interactions are used to validate the performance of the proposed method, which can effectively evaluate match rate between the detected miRNA functional module and those in the gold standards.
For the sake of description, we denote a miRNA functional interaction network as a simple undirected graph G = (V, E), where V describes miRNAs in the miRNA functional interaction network, and E corresponds to an functional interaction between two different miRNAs. A subgraph S is described as S = (V',E'), V'⊂V, E'⊂E, it is defined as a subset of G, S⊂G. MiRNA functional modules are usually supposed to be subgraphs of miRNA functional interaction networks.
Based on the assumption that miRNAs with similar function tend to associate with certain disease (Goh et al., 2007; Chen et al., 2018a), the closer the association is, the more vertices and edges are displayed in the network, we define the relative terminologies used in our experiments. For a subgraph S, the size of a subgraph may be defined as follows (Shelokar et al., 2013; Cao et al., 2015):
where
The average shortest path (ASP) is employed to describe the tightness of a subgraph. In our experiment, the shortest path (SP) is evaluated using the Floyd algorithms (Shier, 1981). The subgraph S of the SP is described as follows:
where
Motivated by Cao et al. (2015), which presented multi-objectives (i.e., density, size and characteristic path length) evolutionary programming method for identifying protein complexes, the results showed the performance of the method proposed in Cao et al. (2015). Similar to most of reported biological networks (Cao et al., 2020; Cao et al., 2015; Cao et al., 2016), the miRNA functional interaction network shows a scale-free distribution and small world characteristics, which was analyzed in previous studies. Therefore, we propose MDA-TOEPGA for identifying miRNA functional modules from miRNA functional interaction network. First, we construct the objective function by analyzing diseases in miRNA functional interaction network. Second, the MDA-TOEPGA is described in detail. Finally, our proposed method is performed on miRNA functional interaction network, and identified miRNA functional modules are evaluated by f1, Sensitivity, and Accuracy. And, the case studies of miRNA functional modules are presented. Fig. 1 shows the overall flowchart for identifying miRNA-diseases association based on MDA-TOEPGA.
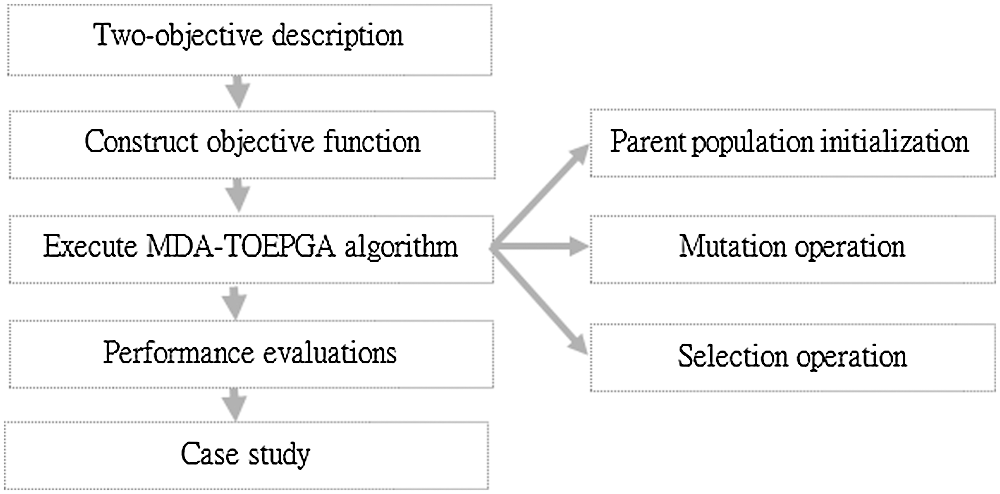
Figure 1: Overall flowchart for identifying miRNA-diseases association based on MDA-TOEPGA.
1) Construct Objective Function
Prior to constructing the objective function, we give the relative problem description. In multi-objective evolutionary programming process, non-dominant subgraphs are constantly produced at each iterative process by optimizing the constructed objective functions (Shelokar et al., 2013; Cao et al., 2015). In our study, the non-dominant subgraphs generated from MDA-TOEPGA are regarded as miRNA functional modules, which are saved to the predefined variable, Archive.
Given a graph G, the non-dominated subgraphs, which represent all the connected subgraphs in G, are defined by two user-defined objectives from the following formulas:
where F1 (S) = Max.Size
F2 (S) = Min.ASP
S.t S∈X, F(S)∈Y
where X denotes the subgraph search space, namely, miRNA functional module set, Y denotes the objective space, i.e., the set of the objective function value. The solution to the problem in Eq. (3) is optimal subgraph set in X, which describes different trade-off in the objective space Y.
To identify the all possible non-domination subgraphs from miRNA functional interaction network, the linear combination of objective function values is executed in each iterative process of MDA-TOEPGA. Based on the analysis of the single topological structures and a large number of experiments, we find that two objectives may make up for the shortcoming of single objective, and improve the quality of identified miRNA functional module. Therefore, we consider the maximization of all the objective, the formula is constructed as follows:
We set F2 (S)+1 in the denominator to avoid the condition of the shortest path is zero that a disease is only associated with a miRNA.
To understand the construction of objective function, we investigate the distribution of the different network topological features (i.e., Size, ASP) of diseases corresponding to miRNAs in the miRNA functional interaction network. The details are shown in Table 1.
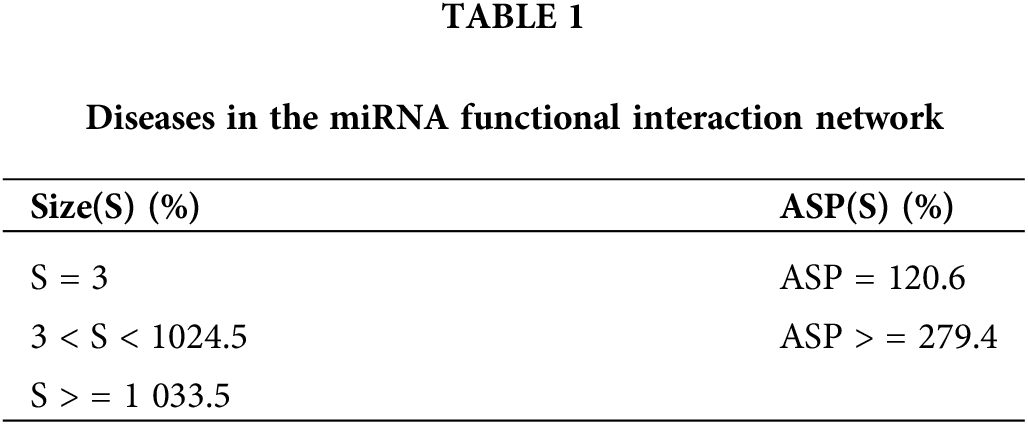
As illustrated in Table 1, 326 diseases are all found in the miRNA function interaction network. Among 326 diseases, the size with diseases between 3 and 10 accounts for 24.5%, most diseases with size of greater than 10 accounts for 33.5%, and those with size equal to 3 (two vertices and one edge) only account for 5.8%. From Table 1, we can clearly analyze that majority diseases are associated with more miRNAs, and only a few diseases are related to less miRNAs. Therefore, we strive to find more potential miRNAs for diseases and provide clues for disease treatment. In this study, we set the maximum value of the objective function of size. For ASP, the distribution of average shortest path indicates that the diseases of ASP result in a higher ratio, which is set to the minimum value of the objective function of ASP.
2) MDA-TOEPGA Algorithm
Similar to Cao et al. (2015), MDA-TOEPGA mainly consists of three steps. First, the subgraph population and preprocesses data are initiated from miRNA function interaction network. Second, the child population is generated with the mutation procedure. Finally, MDA-TOEPGA executes selection operation and produces the next generation of subgraphs.
There are two sub-stages in the first stage. Firstly, MDA-TOEPGA initiates subgraph population R with graph G, namely, one-edge subgraphs from miRNA function interaction network. Secondly, the overlapping vertices between subgraph with one edge is judged, if no overlap exists, these subgraphs will be extracted as non-dominated subgraphs from R and no longer participate in subsequent evolutionary programming genetic operations.
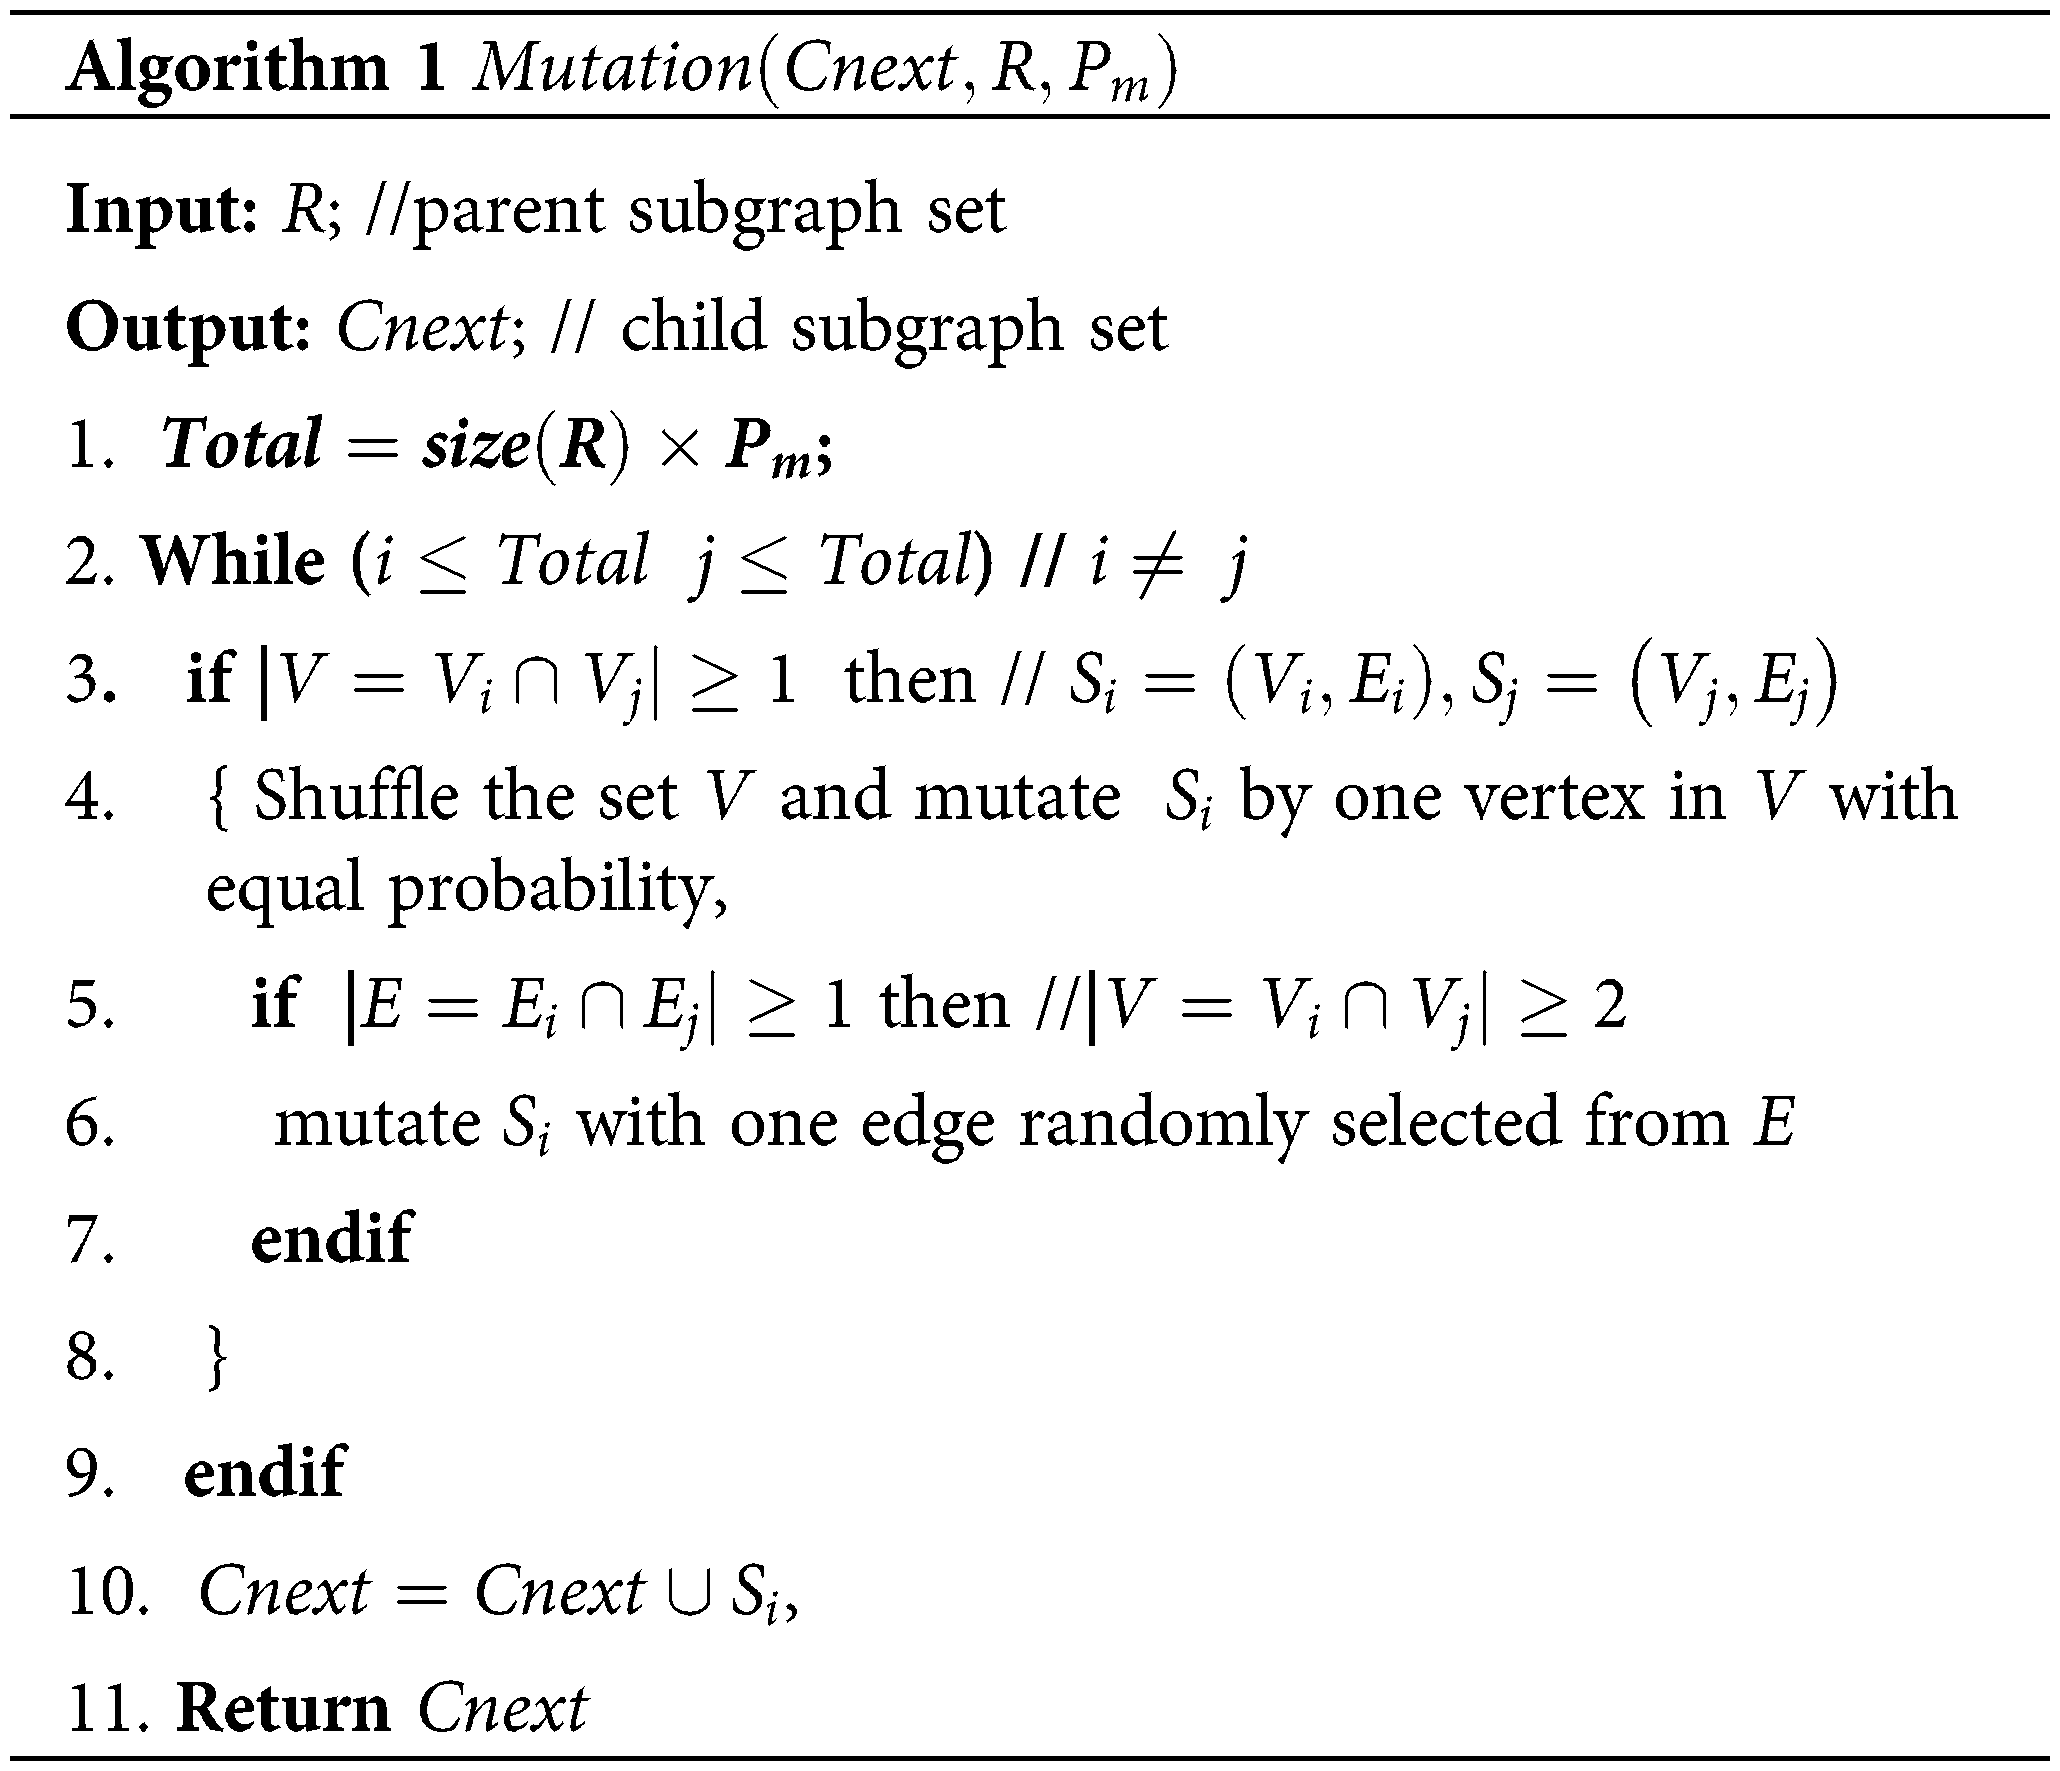
In the second stage, the mutation operation, which is executed on a subgraph S encoded in a parent individual in the population R, is performed to generate child subgraph S'. If there exists an overlapping vertex between two parent subgraphs, the mutation produces child subgraphs by extending all instances of the parent subgraph S in G by an edge. If the overlapping vertex number of two subgraphs is greater than 1, i.e., it exists at least one edge between two subgraphs, mutation will be executed by randomly selecting an edge (see Algorithm 1). The detailed illustration is presented in Supplementary file S1. Mutation is applied to all parent individuals in R to create the child population Cnext. Every child subgraph in Cnext is assessed using F(S) in Eq. (4).
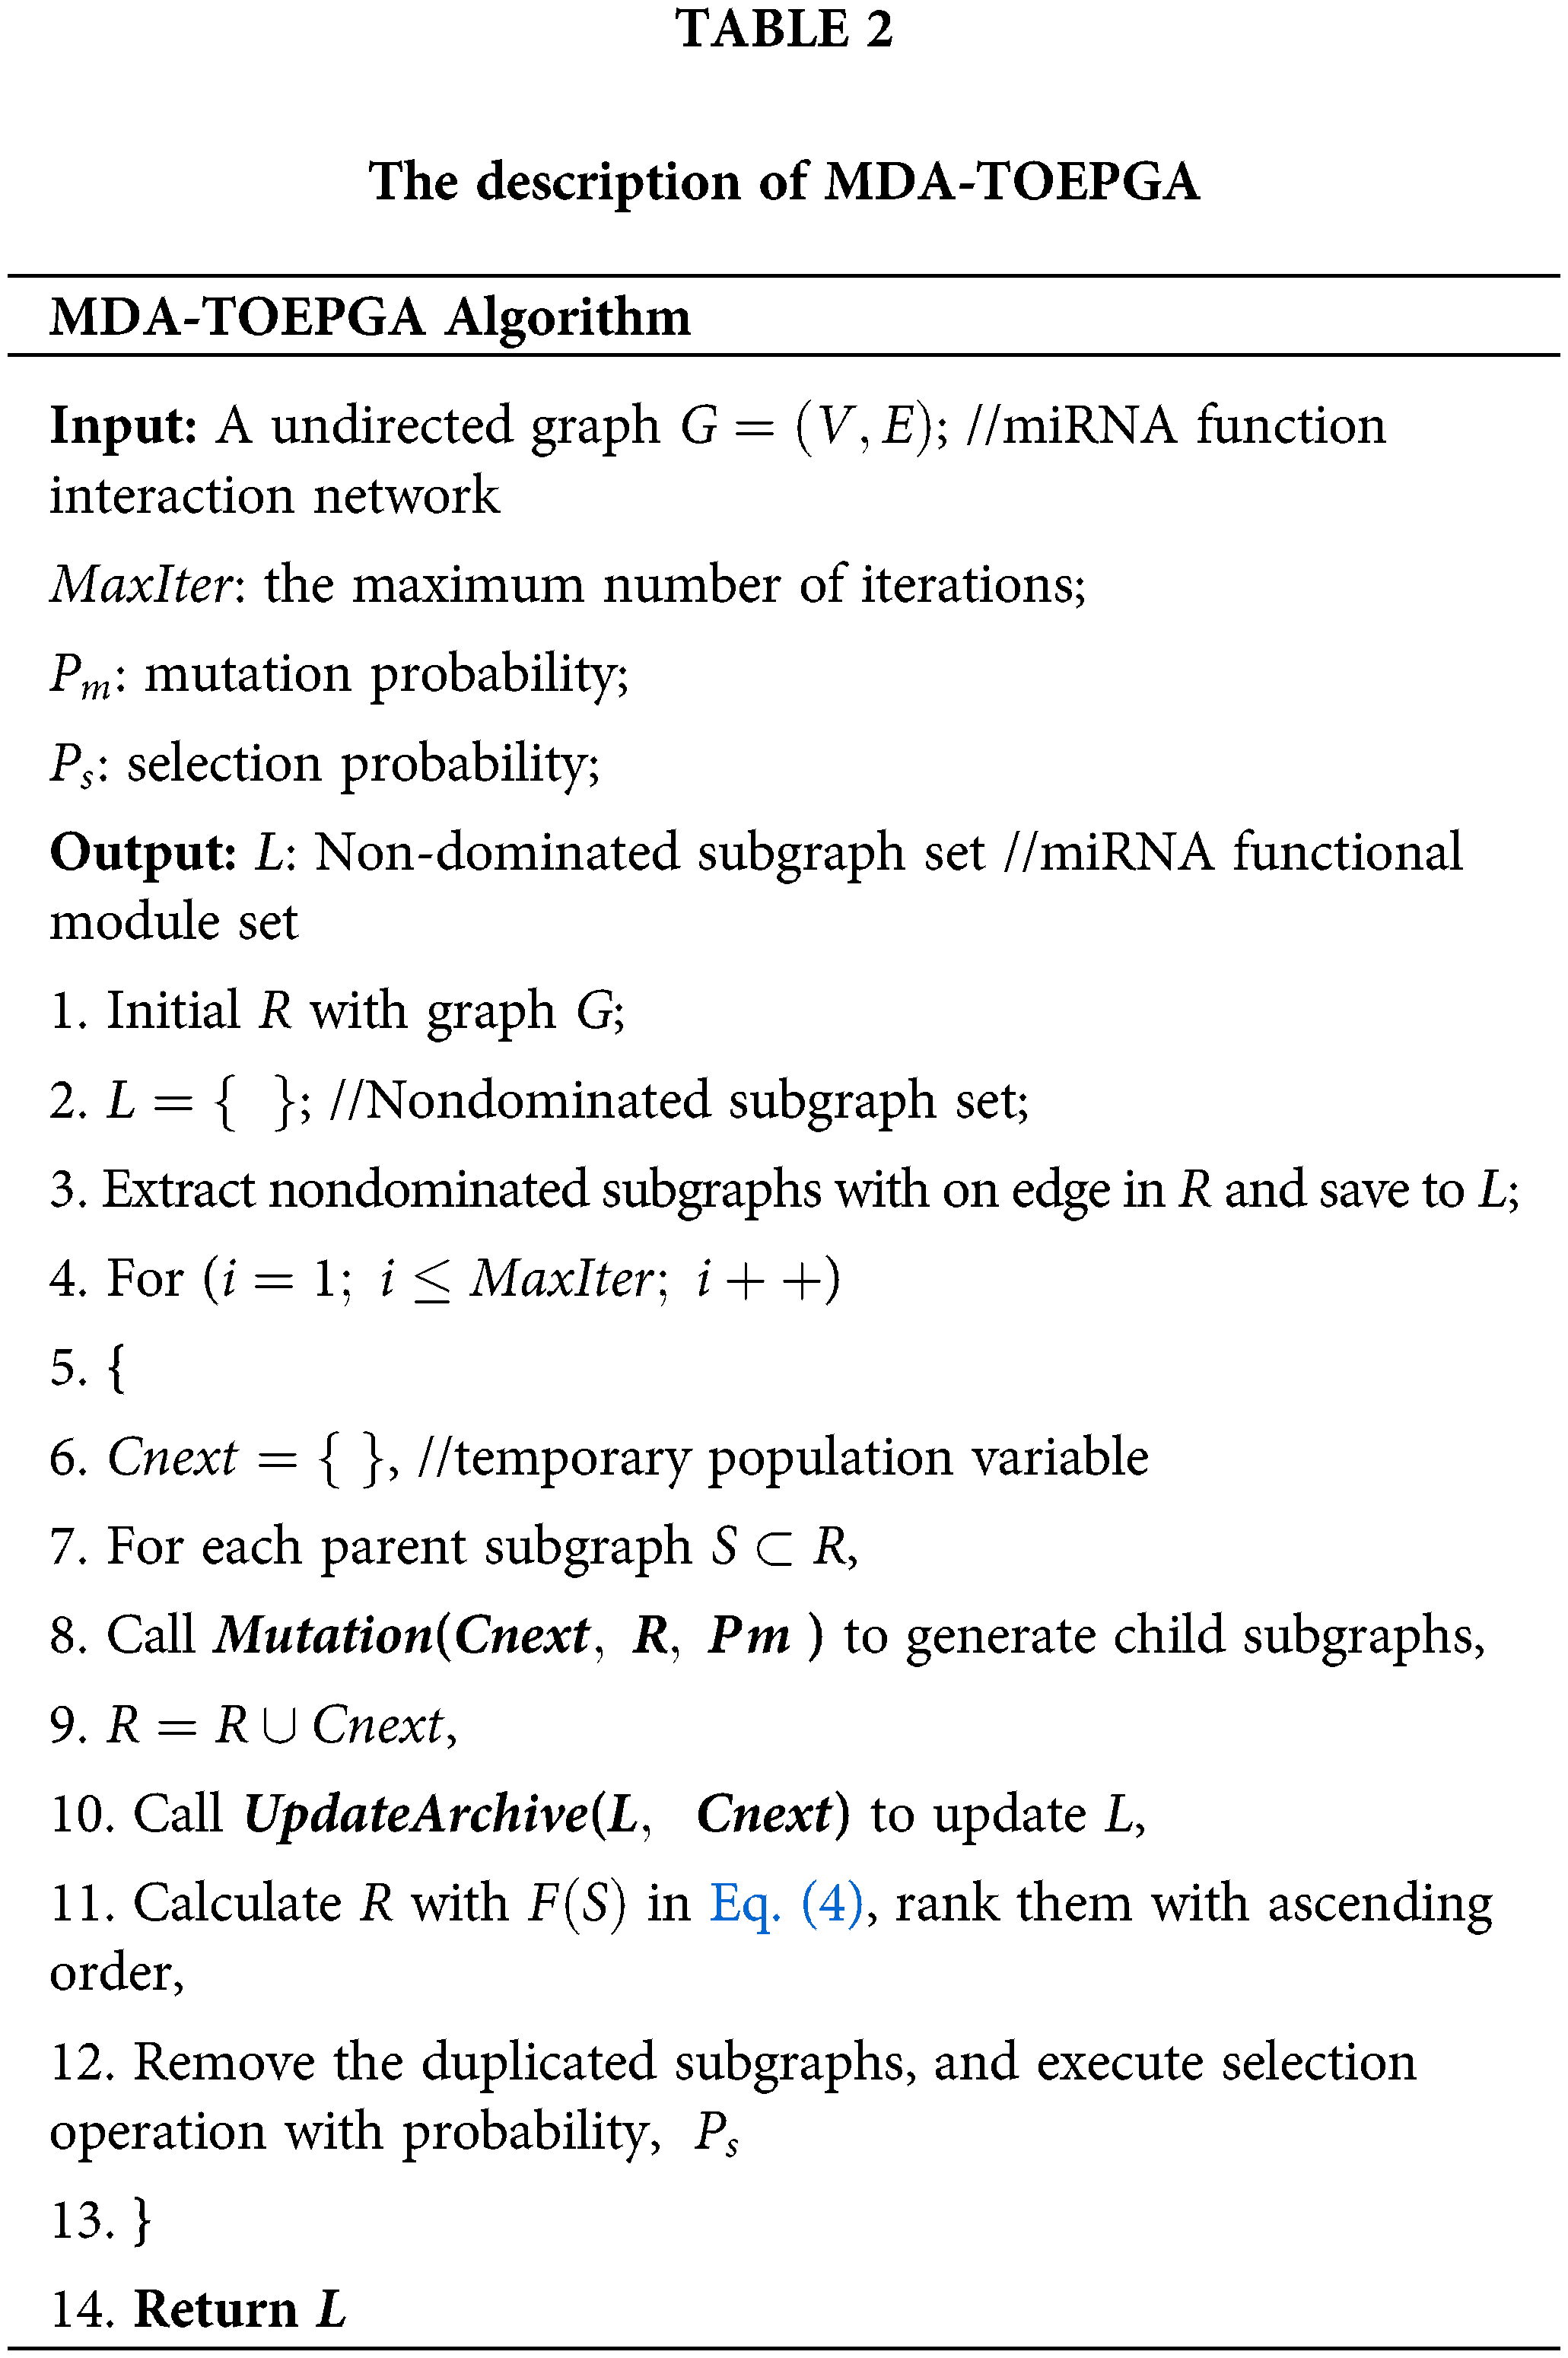
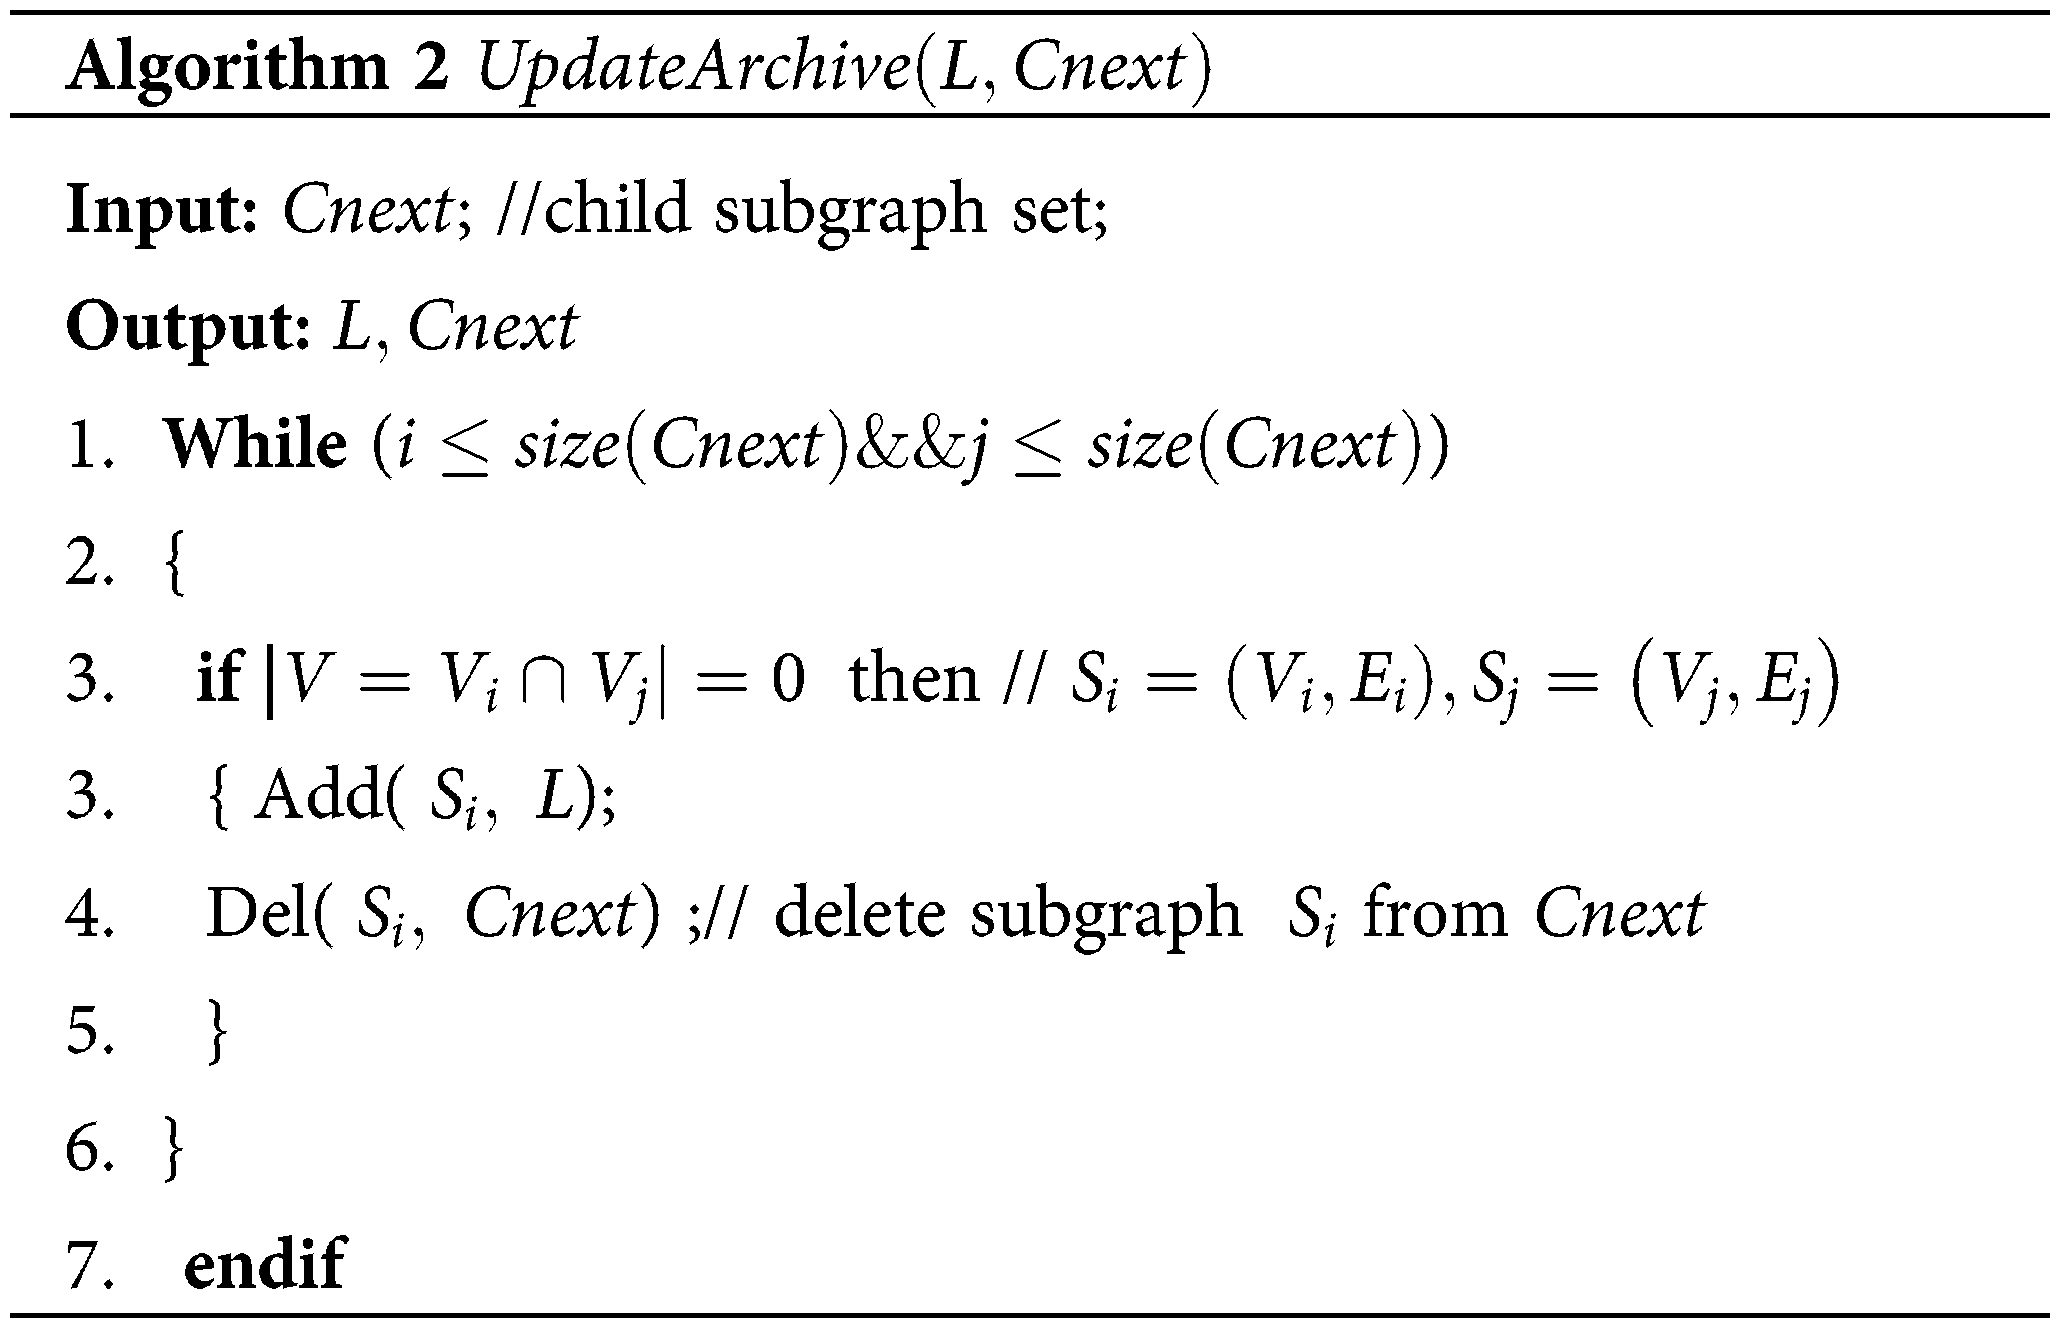
In the third stage, a new parent population R with temporary population R∪Cnext is constructed. To achieve it, MDA-TOEPGA ranks all subgraphs in R∪Cnext according to Eq. (4) and drops the duplicate subgraphs. The next generation subgraphs with probability Ps are finally produced from R∪Cnext. Notably, MDA-TOEPGA will generate numerous non-dominated subgraphs during evolutionary process. To save the non-dominated subgraphs, an external archive L which is updated at the end of each generation (see Algorithm 2). When MDA-TOEPGA has been finished, the output of MDA-TOEPGA forms the set of non-dominated subgraphs that are regarded as miRNA functional modules, which are saved to L. The description of MDA-TOEPGA is presented in Table 2.
The mutation operation (Algorithm 1) is described as follows:
The update operation of archive (Algorithm 2) is described as follows:
In this section, we first analyze the influence of
All experimental results were executed by running MDA-TOEPGA for 50 generations and 10 times on each set of parameters. In this study, the values of
In MDA-TOEPGA, the parameter of
In this study, the mutation probability is set to 0.1, whereas selection probability is set to 0.9.
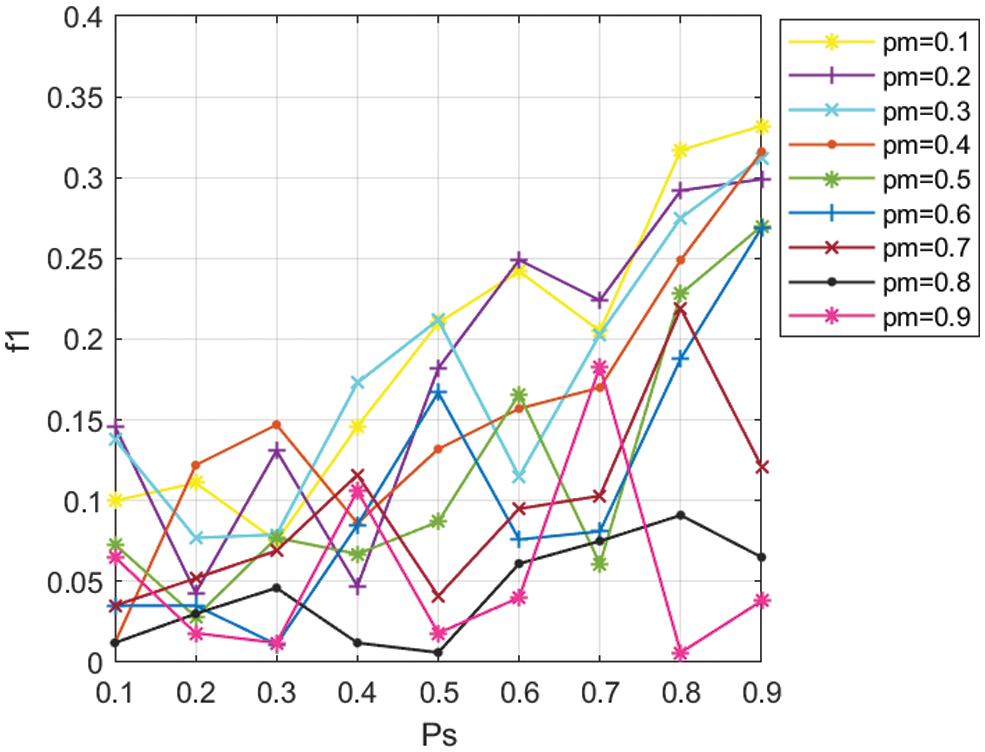
Figure 2: Values of f1 for different values of Pm, Ps in miRNA function interaction network, with a 0.1 increment.
We compare the results of MDR-TOEPGA with those methods. In our experiments, we consider IK-means algorithm (Cao et al., 2020a) and its classical method (i.e., K-means), which were used to detect miRNA functional module. In addition, the other module algorithms, such as MCODE (Jin et al., 2015), HC-PIN (Wang et al., 2011), ClusterOne (Nepusz et al., 2012), are also executed in the miRNA function interaction network. For the above methods, we consider only functional modules with size greater than or equal to 2 by eliminating singletons in our study. And, for each algorithm with which we compared our study, we set the corresponding parameters suggested by the authors to achieve the configuration corresponding to the best results for the mentioned method. The results are listed in Table 3, and the highest value of each evaluation metric is in bold.
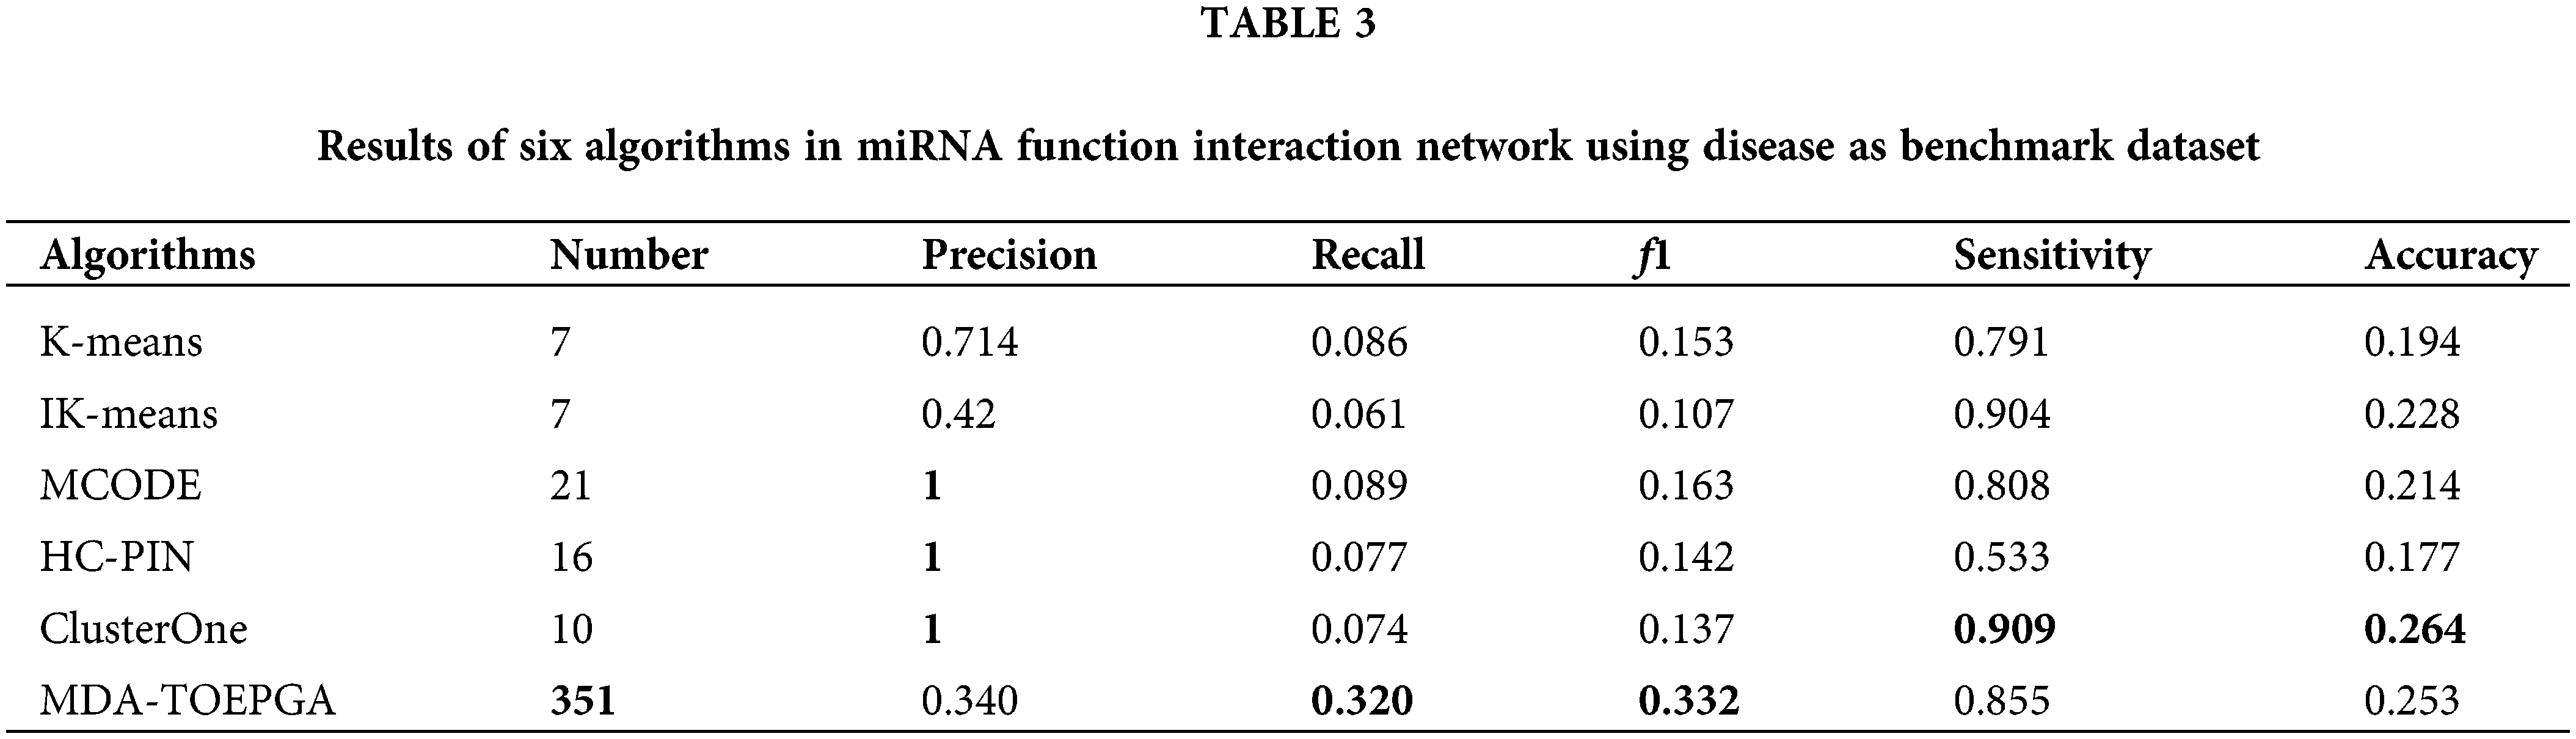
As shown in Table 3, MDA-TOEPGA achieves the satisfied experimental results on the miRNA function interaction network. In particular, our method achieved the highest f1 of 0.332 which is significantly superior to the other methods. MDA-TOEPGA also detects 351 miRNA functional modules, which is beneficial for obtaining high Recall of 0.320. We also note that ClusterOne achieves the maximum Precision of 1, which results in the best Sensitivity and Accuracy of 0.909 and 0.264. Although K-means achieves the third highest value of f1, which is 0.153, the number of the miRNA functional module is the lowest at 7 among the all methods. Similarly, IK-means achieves the minimum f1 of 0.107, however, the value of Sensitivity is 0.904, which is top 2, only lower than ClusterOne. MCODE achieves the highest value of Precision of 1, and the number of the miRNA functional module is 21, which is ranked top 2 among all algorithms.
To show the overall identification performance of algorithm, the composite score of f1, Sensitivity, and Accuracy is used to analyze the global performance of different methods and to highlight the overall performance of our proposed method (Cao et al., 2020; Nepusz et al., 2012; Cao et al., 2016). Fig. 3 presents the comparison results of the six algorithms for the miRNA function interaction network using the benchmark dataset of disease. The composite score of f1, Sensitivity, and Accuracy obtained by MDR-TOEPGA is 1.440, which are 2.65%, 1.62%, 2.15%, 6.90%, 0.99% higher that the five other methods, respectively. It further demonstrates that our proposed method has the best overall performance over the other algorithms in detecting the miRNA functional modules.
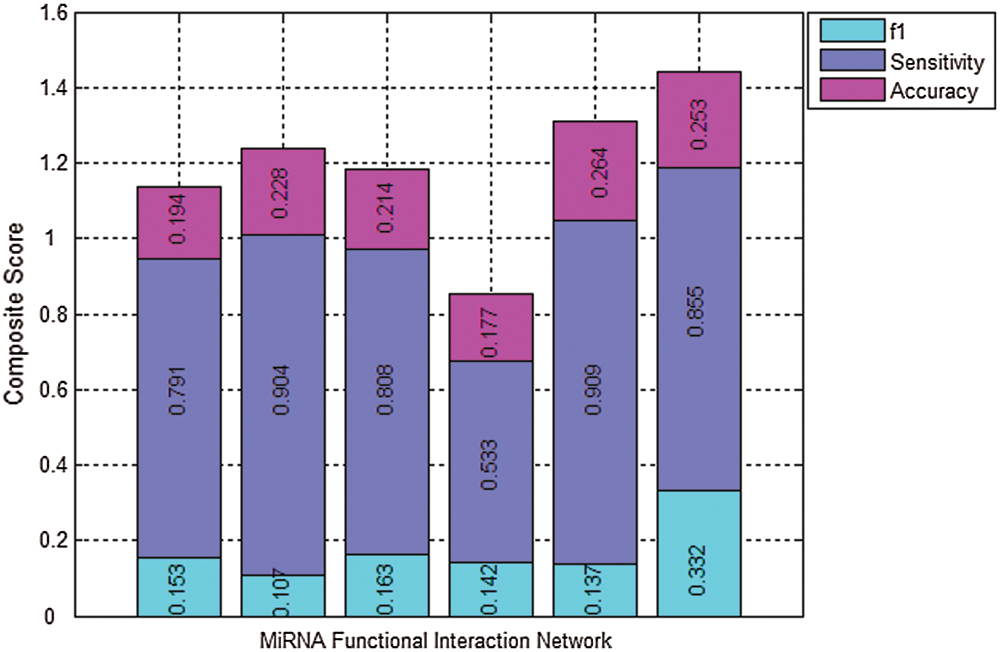
Figure 3: Results comparison of the six algorithms in miRNA function interaction network using disease as benchmark dataset. Columns correspond to the following algorithms, K-means, IK-means, MCODE, HC-PIN, ClusterOne, and MDA-TOEPGA from left to right. Various colors of the same column denote the individual components of the composite score of the algorithm (cyan = f1, bule = Sensitivity, purple = Accuracy). The total height of each column is the value of the composite score for a special algorithm. Large scores show the clustering result is better.
Two different types of case studies were implemented to demonstrate the performance of MDA-TOEPGA for the miRNA-disease association prediction. All of them have shown excellent results. The first case study is hsa-mir-16 included in three functional modules, which are #344(hsa-mir-16, hsa-mir-320a), #265(hsa-mir-16, hsa-mir-625), #329(hsa-mir-135b, hsa-mir-16), respectively. For each miRNA in above three functional modules, they are related to some common diseases, such as Breast Neoplasms and Colorectal Neoplasms. Hsa-mir-16 is important miRNA associating with 49 diseases, such as Acute Lung Injury, Adrenocortical Carcinoma, Amyloidosis, etc. Notably, although the three other miRNAs, i.e., hsa-mir-320a, hsa-mir-625, hsa-mir-135b, are associating with 15 diseases, 10 diseases, and 17 diseases, respectively, there is no associations between the three miRNAs and ACTH-Secreting Pituitary Adenoma, Acute Lung Injury (http://www.cuilab.cn/hmdd) and other diseases.
From the three miRNA functional modules identified by our method, we can infer the latent association between above miRNAs except for hsa-mir-16 and above-mentioned diseases, which provides valuable clues for biologists. Furthermore, we can clearly see that the three miRNAs (hsa-mir-320a, hsa-mir-625, hsa-mir-135b) are independent functional modules formed by hsa-mir-16. By virtue of the similarity of functional modules, we may infer hsa-mir-16 is associated with other diseases, for example, hsa-mir-625 may be closely related to Ischemia and Stomach Neoplasms, hsa-mir-320a is likely to be associated with Osteosarcoma.
MDA-TOEPGA predicts the module #308(hsa-mir-1, hsa-mir-132, hsa-mir-765). Coronary Artery Disease is associated with the disease of has-mir-765 and hsa-mir-1, however, the association between hsa- mir-132 and Coronary Artery Disease has not yet been validated (http://www.cuilab.cn/hmdd). Similar to above-mentioned analysis, we may infer that hsa-mir-132 is likely to be related to Coronary Artery Disease. And, Coronary Artery Disease (CAD) is the most common type of heart disease. It is the leading cause of death in the United States in both men and women. From the analysis of the module #308, it is beneficial to extend the understanding of CAD and seek the cause of CAD in many dimensions, thereby reducing the pain of patients.
The investigation for latent miRNA-disease association identification would help us understand the pathogenesis of disease and promote the treatment of disease. Until now, exiting methods for identifying miRNA related disease mainly rely on top-ranked association model, which may not provide a full landscape of association between miRNA and disease. In this paper, we developed a model of identifying MiRNA-Disease Association based on Two-Objective Evolutionary Programming Genetic Algorithm (MDA-TOEPGA), which identifies latent miRNA-disease associations from the view of functional module. In model of MDA-TOEPGA, 5100 distinct experimentally confirmed associations between 326 diseases and 491 miRNAs were refined to construct the miRNA function interaction network including 484 miRNAs with 24061 interactions. To assess the results of the identified miRNA functional modules, 326 diseases containing associated miRNAs are used as a benchmark dataset. The superiority and effectiveness of MDA-TOEPGA have been demonstrated by comparison with five state-of-the-art techniques in terms of f1, Sensitivity, and Accuracy and case studies.
Most of these modules display a significant association between miRNAs and disease. These associations can help in exploring the development of new drugs and further providing clinical treatments with more effective clues. In future work, our approach will be applied to study other types of biological associations, such as microbe-disease association, circRNA-disease association, cancer hallmark-gene associations.
Availability of Data and Materials: The datasets used and/or analyzed during the current study are available from the corresponding author on reasonable request.
Author Contribution: Study conception and design: Cao BW, Luo JW. Data collection and process: Cao BW, Xiao XN. Analysis and interpretation of results: Zhou XJ. Draft manuscript preparation: Cao BW, Xiao XN. All authors reviewed the results and approved the final version of the manuscript.
Ethics Approval: Not applicable.
Funding Statement: This work was supported in part by the National Natural Science Foundation of China under Grants 61873089, 62032007 and the Key Project of the Education Department of Hunan Province under Grant 20A087, the Innovation Platform Open Fund Project of Hunan Provincial Education Department under Grant 20K025.
Conflicts of Interest: The authors declare that they have no conflicts of interest to report regarding the present study.
Baskerville S, Bartel DP (2005). Microarray profiling of microRNAs reveals frequent coexpression with neighboring miRNAs and host genes. RNA 11: 241–247. DOI 10.1261/rna.7240905. [Google Scholar] [CrossRef]
Cao B, Luo J, Liang C, Wang S, Song D (2015). MOEPGA: A novel method to detect protein complexes in yeast protein-protein interaction networks based on MultiObjective Evolutionary Programming Genetic Algorithm. Computational Biology and Chemistry 58: 173–181. DOI 10.1016/j.compbiolchem.2015.06.006. [Google Scholar] [CrossRef]
Cao BW, Deng SG, Qin H, Luo JW, Li GH et al. (2020). Inferring microRNA-disease associations based on the identification of a functional module. Journal of Computational Biology 28: 33–42. DOI 10.1089/cmb.2019.0106. [Google Scholar] [CrossRef]
Cao BW, Luo JW, Liang C, Wang SL, Ding PJ (2016). PCE-FR: A novel method for identifying overlapping protein complexes in weighted protein-protein interaction networks using pseudo-clique extension based on fuzzy relation. IEEE Transactions on Nanobioscience 15: 728–738. DOI 10.1109/TNB.2016.2611683. [Google Scholar] [CrossRef]
Chen HL, Guo RY, Li GH, Zhang W, Zhang ZP (2020a). Comparative analysis of similarity measurements in miRNAs with applications to miRNA-disease association predictions. BMC Bioinformatics 21: 350. DOI 10.1186/s12859-020-3515-9. [Google Scholar] [CrossRef]
Chen HL, Zhang ZP, Feng DY (2019a). Prediction and interpretation of miRNA-disease associations based on miRNA target genes using canonical correlation analysis. BMC Bioinformatics 20: 843. DOI 10.1186/s12859-019-2998-8. [Google Scholar] [CrossRef]
Chen HL, Zhang ZP, Li GH (2019b). Relating disease-gene interaction network with disease-associated ncRNAs. IEEE Access 7: 133521. DOI 10.1109/ACCESS.2019.2941955. [Google Scholar] [CrossRef]
Chen X, Huang L (2017a). LRSSLMDA: Laplacian regularized sparse subspace learning for miRNA-disease association prediction. PLoS Computational Biology 13: e1005912. DOI 10.1371/journal.pcbi.1005912. [Google Scholar] [CrossRef]
Chen X, Li SX, Yin J, Wang CC (2020b). Potential miRNA-disease association prediction based on kernelized Bayesian matrix factorization. Genomics 112: 809–819. DOI 10.1016/j.ygeno.2019.05.021. [Google Scholar] [CrossRef]
Chen X, Liu MX, Yan GY (2012). RWRMDA: Predicting novel human microRNA-disease associations. Molecular BioSystems 8: 2792–2798. DOI 10.1039/c2mb25180a. [Google Scholar] [CrossRef]
Chen X, Sun LG, Zhao Y (2021). NCMCMDA: miRNA-disease association prediction through neighborhood constraint matrix completion. Briefings in Bioinformatics 22: 485–496. DOI 10.1093/bib/bbz159. [Google Scholar] [CrossRef]
Chen X, Wang L, Qu J, Guan NN, Li JQ (2018a). Predicting miRNA-disease association based on inductive matrix completion. Bioinformatics 34: 4256–4265. DOI 10.1093/bioinformatics/bty503. [Google Scholar] [CrossRef]
Chen X, Wu QF, Yan GY (2017b). RKNNMDA: Ranking-based KNN for miRNA-disease association prediction. RNA Biology 14: 952–962. DOI 10.1080/15476286.2017.1312226. [Google Scholar] [CrossRef]
Chen X, Xie D, Wang L, Zhao Q, You ZH, Liu HS (2018b). BNPMDA: Bipartite network projection for miRNA-disease association prediction. Bioinformatics 34: 3178–3186. DOI 10.1093/bioinformatics/bty333. [Google Scholar] [CrossRef]
Chen X, Xie D, Zhao Q, You ZH (2019c). MicroRNAs and complex diseases: From experimental results to computational models. Briefings in Bioinformatics 20: 515–539. DOI 10.1093/bib/bbx130. [Google Scholar] [CrossRef]
Chen X, Yin J, Qu J, Huang L (2018c). MDHGI: Matrix decomposition and heterogeneous graph inference for miRNA-disease association prediction. PLoS Computational Biology 14: e1006418. DOI 10.1371/journal.pcbi.1006418. [Google Scholar] [CrossRef]
Chen X, Zhu CC, Yin J (2019d). Ensemble of decision tree reveals potential miRNA-disease associations. PLoS Computational Biology 15: e1007209. DOI 10.1371/journal.pcbi.1007209. [Google Scholar] [CrossRef]
Fujii YR (2018). Quantum language of microRNA: Application for new cancer therapeutic targets. Methods in Molecular Biology 1733: 145–157. DOI 10.1007/978-1-4939-7601-0. [Google Scholar] [CrossRef]
Goh KI, Cusick ME, Valle D, Childs B, Vidal M et al. (2007). The human disease network. Proceedings of the National Academy of Sciences of the United States of America 104: 8685–8690. DOI 10.1073/pnas.0701361104. [Google Scholar] [CrossRef]
He ZZ, Wang YJ, Huang GF, Wang Q, Zhao DD et al. (2017). The lncRNA UCA1 interacts with miR-182 to modulate glioma proliferation and migration by targeting iASPP. Archives of Biochemistry & Biophysics 623: 1–8. DOI 10.1016/j.abb.2017.01.013. [Google Scholar] [CrossRef]
Hui P, Lan C, Yi Z, Hutvagner G, Li J (2017). Cross disease analysis of co-functional microRNA pairs on a reconstructed network of disease-gene-microRNA tripartite. BMC Bioinformatics 18: 193. DOI 10.1186/s12859-017-1605-0. [Google Scholar] [CrossRef]
Jin K, Musso G, Vlasblom J, Jessulat M, Deineko V et al. (2015). Yeast mitochondrial protein-protein interactions reveal diverse complexes and disease-relevant functional relationships. Journal of Proteome Research 14: 1220–1237. DOI 10.1021/pr501148q. [Google Scholar] [CrossRef]
Li J, Han X, Wan Y, Zhang S, Zhao Y et al. (2018). TAM 2.0: Tool for MicroRNA set analysis. Nucleic Acids Research 46: W180–W185. DOI 10.1093/nar/gky509. [Google Scholar] [CrossRef]
Li J, Zhang S, Wan Y, Zhao Y, Shi J et al. (2019). MISIM v2.0: A web server for inferring microRNA functional similarity based on microRNA-disease associations. Nucleic Acids Research 47: W536–W541. DOI 10.1093/nar/gkz328. [Google Scholar] [CrossRef]
Li Y, Liang C, Wong KC, Luo JW, Zhang ZL (2014a). Mirsynergy: Detecting synergistic miRNA regulatory modules by overlapping neighbourhood expansion. Bioinformatics 30: 2627–2635. DOI 10.1093/bioinformatics/btu373. [Google Scholar] [CrossRef]
Li Y, Qiu CX, Tu J, Geng B, Yang JC et al. (2014b). HMDD v2.0: A database for experimentally supported human microRNA and disease associations. Nucleic Acids Research 42: D1070–D1074. DOI 10.1093/nar/gkt1023. [Google Scholar] [CrossRef]
Lu M, Zhang Q, Deng M, Miao J, Guo Y et al. (2008). An analysis of human microRNA and disease associations. PLoS One 10: e3420. DOI 10.1371/journal.pone.0003420. [Google Scholar] [CrossRef]
Luo JW, Pan C, Xiang G, Yin Y (2019). A novel cluster-based computational method to identify miRNA regulatory modules. IEEE/ACM Transactions on Computational Biology & Bioinformatics 16: 681–687. DOI 10.1109/TCBB.2018.2824805. [Google Scholar] [CrossRef]
Min WW, Liu J, Luo F, Zhang SH (2016). A two-stage method to identify joint modules from matched microRNA and mRNA expression data. IEEE Transactions on Nanobioscience 15: 362–370. DOI 10.1109/TNB.2016.2556744. [Google Scholar] [CrossRef]
Nalluri JJ, Barh D, Azevedo V, Ghosh P (2017). miRsig: A consensus-based network inference methodology to identify pan-cancer miRNA-miRNA interaction signatures. Scientific Reports 7: 39684. DOI 10.1038/srep39684. [Google Scholar] [CrossRef]
Nepusz T, Yu H, Paccanaro A (2012). Detecting overlapping protein complexes in protein-protein interaction networks. Nature Methods 9: 471–472. DOI 10.1038/nmeth.1938. [Google Scholar] [CrossRef]
Paul S, Madhumita (2020). RFCM3: Computational method for identification of miRNA-mRNA regulatory modules in cervical cancer. IEEE/ACM Transactions on Computational Biology and Bioinformatics 17: 1729–1740. DOI 10.1109/TCBB.2019.2910851. [Google Scholar] [CrossRef]
Shao T, Wang G, Chen H, Xie Y, Jin X et al. (2018). Survey of miRNA-miRNA cooperative regulation principles across cancer types. Briefings in Bioinformatics 20: 1621–1638. DOI 10.1093/bib/bby038. [Google Scholar] [CrossRef]
Shao TT, Wang GJ, Chen H, Xie YJ, Jin XY et al. (2019). Survey of miRNA-miRNA cooperative regulation principles across cancer types. Briefings in Bioinformatics 20: 1621–1638. DOI 10.1093/bib/bby038. [Google Scholar] [CrossRef]
Shelokar P, Quirin A, Cordon O (2013). A multiobjective evolutionary programming framework for graph-based data mining. Information Sciences 237: 118–136. DOI 10.1016/j.ins.2013.02.014. [Google Scholar] [CrossRef]
Shier DR (1981). A computational study of Floyd’s algorithm. Computers & Operations Research 8: 275–293. DOI 10.1016/0305-0548(81)90015-0. [Google Scholar] [CrossRef]
Teng XY, Chen XM, Xue H, Tang YH, Zhang P et al. (2020). NPInter v4.0: An integrated database of ncRNA interactions. Nucleic Acids Research 48: D160–D165. DOI 10.1093/nar/gkz969. [Google Scholar] [CrossRef]
Wang CC, Chen X, Yin J, Qu J (2019). An integrated framework for the identification of potential miRNA-disease association based on novel negative samples extraction strategy. RNA Biology 16: 257–269. DOI 10.1080/15476286.2019.1568820. [Google Scholar] [CrossRef]
Wang J, Min L, Chen J, Yi P (2011). A fast hierarchical clustering algorithm for functional modules discovery in protein interaction networks. IEEE/ACM Transactions on Computational Biology and Bioinformatics 8: 607–620. DOI 10.1109/TCBB.2010.75. [Google Scholar] [CrossRef]
Xu JA, Li CX, Li YS, Lv JY, Ma Y et al. (2011). MiRNA-miRNA synergistic network: Construction via co-regulating functional modules and disease miRNA topological features. Nucleic Acids Research 39: 825–836. DOI 10.1093/nar/gkq832. [Google Scholar] [CrossRef]
Yang Y, Huang N, Hao LN, Kong W (2017). A clustering-based approach for efficient identification of microRNA combinatorial biomarkers. BMC Genomics 18: 1768. DOI 10.1186/s12864-017-3498-8. [Google Scholar] [CrossRef]
Yang Y, Wan X (2020). Identification of MicroRNA regulatory modules by clustering MicroRNA-target interactions. IEEE Access 8: 154133–154142. DOI 10.1109/ACCESS.2020.3018105. [Google Scholar] [CrossRef]
Yu SP, Wang H (2021). RSCMDA: Prediction of potential miRNA-disease associations based on a robust similarity constraint learning method, Interdisciplinary Sciences: Computational Life Sciences. DOI 10.1007/s12539-021-00459-y. [Google Scholar] [CrossRef]
Zhang JP, Liu L, Xu TS, Zhang W, Zhao CW et al. (2021). miRSM: An R package to infer and analyse miRNA sponge modules in heterogeneous data. RNA Biology 18: 2308–2320. DOI 10.1080/15476286.2021.1905341. [Google Scholar] [CrossRef]
Zhang JP, Xu TS, Liu L, Zhang W, Zhao CW et al. (2020). LMSM: A modular approach for identifying lncRNA related miRNA sponge modules in breast cancer. PLoS Computational Biology 16: e1007851. DOI 10.1371/journal.pcbi.1007851. [Google Scholar] [CrossRef]
Zhang TF, Cheng KW, Shi WY, Zhang JT, Liu KD et al. (2012). MiRNA synergistic network construction and enrichment analysis for common target genes in small-cell lung cancer. Asian Pacific Journal of Cancer Prevention 13: 6375–6378. DOI 10.7314/APJCP.2012.13.12.6375. [Google Scholar] [CrossRef]
Zhao XH, Song HJ, Zuo ZG, Zhu Y, Dong XS et al. (2013). Identification of miRNA-miRNA synergistic relationships in colorectal cancer. International Journal of Biological Macromolecules 55: 98–103. DOI 10.1016/j.ijbiomac.2012.12.006. [Google Scholar] [CrossRef]
Supplementary file S1-Muatation and selection operator
Fig. S1(a) shows an example of mutation through an edge. In Fig. S1(a), when the vertex number of two subgraphs is 1, the parent subgraph “
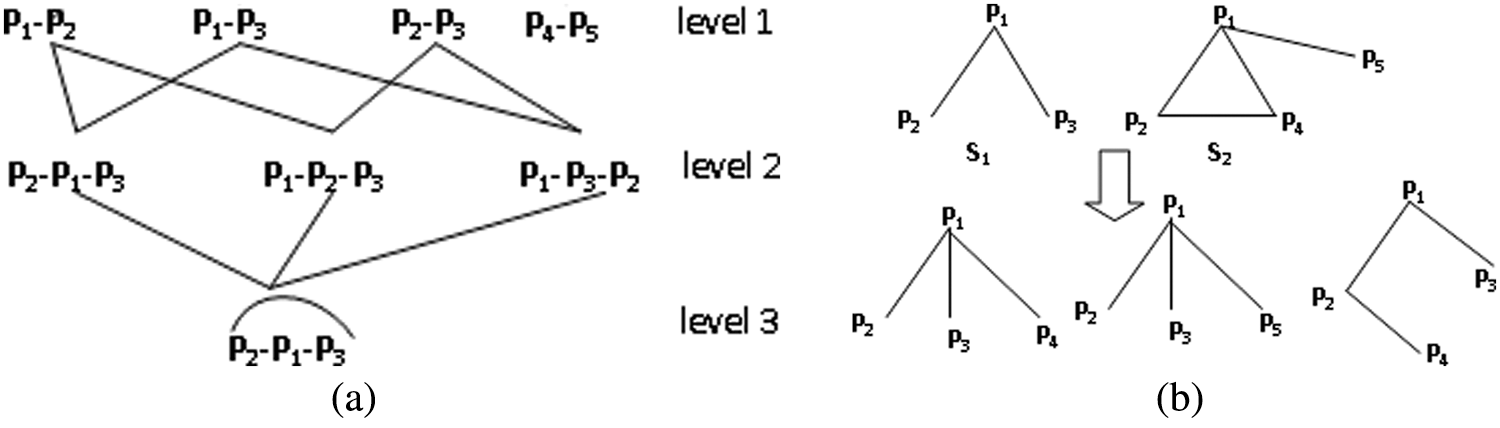
Figure S1: Illustration of mutation operation.
If the overlapping vertex number of two subgraphs is greater than 1, i.e., it exists at least one edge between two subgraphs, mutation will be executed by randomly selecting an edge. In Fig. S1(b), for subgraph
In Fig. S1(a), only one subgraph is present in level 3 because the other two subgraphs are removed. Notably, MDA-TOEPGA will generate some nondominated subgraphs during evolutionary process, such as “
 | This work is licensed under a Creative Commons Attribution 4.0 International License, which permits unrestricted use, distribution, and reproduction in any medium, provided the original work is properly cited. |