DOI: 10.32604/CHD.2021.012626
ARTICLE
Effect of Hemodilution on Fluctuation of Cerebral Oxygen Saturation during Cardiopulmonary Bypass in Children with Cyanotic Congenital Heart Disease
1Department of Anesthesiology, Damsoyu Hospital, Seoul, Korea
2Department Anesthesiology and Pain Medicine, Laboratory for Cardiovascular Dynamics, Asan Medical Center, University of Ulsan College of Medicine, Seoul, 05505, Korea
*Corresponding Author: Won-Jung Shin. Email: wjshin@amc.seoul.kr
Received: 08 July 2020; Accepted: 28 September 2020
Abstract: Background: In patients with cyanotic congenital heart disease (CHD), cerebral oxygenation may be maintained by elevations in hematocrit (Hct). Hemodilution accompanying cardiopulmonary bypass (CPB), however, can disrupt cerebral oxygen balance, leading to fluctuations in cerebral oxygen saturation (ScO2). The present study investigated the effects of Hct changes on the fluctuation of ScO2 during CPB in cyanotic CHD using performance measurement (PM). Methods: Children with CHD (51 acyanotic and 46 cyanotic) who had undergone cardiac surgery using CPB were enrolled. Median performance error (MDPE), median absolute performance error (MDAPE), and wobble parameters of ScO2 were calculated before (reference value), during, and after CPB. Correlations of PM parameters with Hct and reductions in Hct (ΔHct) were also evaluated. Results: Before CPB, patients with cyanotic CHD had lower MDPE and larger wobble than those with acyanotic CHD, although mean ScO2 did not differ significantly between the two groups. During CPB, ScO2 of acyanotic CHD increased as ΔHct increased, but PM variables were not associated with ΔHct. In cyanotic CHD, MDPE (r = −0.324, p = 0.032) and MDAPE (r = 0.339, p = 0.024) correlated significantly with ΔHct during CPB. After CPB, MDPE (r = 0.574, p = 0.025) and MDAPE (r = −0.543, p = 0.036) were significantly correlated with Hct in children with cyanotic CHD who underwent palliative surgery. Conclusion: Therefore, ScO2 fluctuation during CPB in children with cyanotic CHD may be affected by the decrease in Hct, suggesting that excessive hemodilution can negatively influence the maintenance of cerebral oxygenation in these patients.
Keywords: Cardiopulmonary bypass; cerebral oxygen saturation; children; congenital heart disease; hemodilution
The postoperative survival rate of children with congenital heart disease (CHD) is increasing due to improved surgical techniques and cardiopulmonary bypass (CPB) management, making their neurodevelopmental outcomes more significant [1]. Among several factors, adequate cerebral blood perfusion and oxygen delivery are considered particularly important in the neurodevelopment of children with CHD [2,3]. Chronic hypoxemia in patients with cyanotic CHD can persist for long periods of time before surgical correction. Increased hemoglobin concentration can compensate for chronic hypoxemia by increasing arterial oxygen content and maintaining tissue oxygen delivery. Accordingly, hemoglobin concentrations are higher in children with cyanotic than in acyanotic CHD, maintaining adequate cerebral oxygen saturation (ScO2) within the normal range [4].
Cerebral oxygenation in patients undergoing surgery involving CPB for CHD, however, is threatened by loss of pulsation, target hypothermia, rewarming, low blood pressure, and inadequate flow [5–7]. In addition, acute hemodilution accompanying CPB may have a negative impact on patients with cyanotic CHD who have maintained adequate ScO2 by having a high hematocrit (Hct) as a compensating mechanism. In children with CHD, ScO2 measured by near-infrared spectroscopy reflects a balance between oxygen delivery and consumption [6]. Therefore, fluctuations in ScO2, particularly reductions, could be considered challenges in maintaining cerebral oxygen balance at a constant level.
The present study hypothesized that an acute reduction in Hct would affect the fluctuation of ScO2 during CPB in children with cyanotic CHD. Variations in ScO2 throughout CPB were monitored using the method of performance measurement, which allows for the evaluation of discrepancies between reference and measured values.
The electronic medical records and database of pediatric patients under four years of age who had undergone cardiac surgery using CPB for CHD between September 2017 and March 2018 at Asan Medical Center, Seoul, Korea, were retrospectively evaluated. The congenital heart defects diagnosed in these patients included atrial septal defect (ASD), ventricular septal defect (VSD), tetralogy of Fallot (TOF), and functional single ventricle (FSV). Patients with ASD and VSD were classified as having acyanotic CHD, whereas patients with TOF and FSV were classified as having cyanotic CHD. Patients were excluded if they had preexisting brain malformations or craniofacial anomalies, chromosomal anomalies, cardiac lesions associated with multiorgan syndrome, total deep hypothermic circulatory arrest, unsuccessful initial weaning from CPB, or incomplete data. None of the patients with TOF who underwent the surgery had pink TOF. The preoperative room air SpO2 of patients with cyanotic CHD ranged from 77% to 88%. The study protocol was approved by the local research ethics committee (protocol number 2019-0936), with data analyzed in accordance with the ethical standards of the 1964 Declaration of Helsinki and its amendments.
2.2 General Anesthesia and CPB Management
All patients underwent general anesthesia and CPB management according to the standard protocol at the Asan Medical Center [8]. Briefly, patients were premedicated with intravenous midazolam 0.5–0.75 mg/kg, and underwent routine monitoring of noninvasive blood pressure, electrocardiography, pulse oximetry, and capnography. Cerebral oximetry based on near-infrared spectroscopy (NIRS, INVOS 5100, Somanetics, Troy, MI) was also monitored using pediatric cerebral oximetry sensors placed on each side of the patient’s forehead. Anesthesia was induced with midazolam 0.2–0.3 mg/kg, fentanyl 3–5 µg/kg, and rocuronium 0.5 mg/kg, and maintained by continuous infusion of midazolam 0.2 mg/kg/h, remifentanil 0.4 µg/kg/min, and rocuronium 0.1 mg/kg/h. Based on changes in systemic or pulmonary blood flow, the inspired oxygen concentration was set at 21%–50%, and end-tidal CO2 at 30–45 mmHg. An arterial line was inserted into the radial or femoral artery for repeated sampling and monitoring of arterial pressure. A central venous catheter (4–5.5 Fr; Arrow International Inc., Reading, PA) was inserted into the internal jugular vein under ultrasound guidance.
The CPB circuit was primed with albumin, crystalloid solution, and/or leukocyte-filtered red blood cells to achieve an expected Hct of 25%–28% during CPB. After anticoagulation with heparin, CPB was initiated by aortic cannulation and bicaval venous drainage. The target perfusion index of CPB was 2.4 L/min/m2 under moderate hypothermia (target rectal temperature: 28–31°C). The mean arterial blood pressure was maintained at 40–60 mmHg. Arterial oxygen partial pressure (PaO2) was maintained at ≥100 mmHg, arterial carbon dioxide partial pressure (PaCO2) at 35–45 mmHg, and pH at 7.35–7.40 by alpha-stat management. Modified ultrafiltration was applied immediately after the CPB was terminated. After CPB, the hematocrit was maintained at a level higher than 30%–35%, with leukocyte-filtered red blood cells transfused if needed. Before aortic decannulation, protamine was administered to reverse heparin.
2.3 Intraoperative Hemodynamic and Laboratory Variables
All intraoperative hemodynamic parameters, including electrocardiography, arterial blood pressure, central venous pressure, heart rate, rectal temperature, SpO2, and ScO2, were routinely recorded using a Vital Recorder [9] throughout the entire operation. At the beginning of CPB, the time points of body temperature change, and the end of CPB were recorded. Arterial blood gas was analyzed after the induction of anesthesia, during cold CPB, and after the termination of CPB. The parameters analyzed included pH, PaO2, PaCO2, arterial oxygen saturation (SaO2), Hct, and lactate. The difference between baseline Hct, measured after the induction of anesthesia, and the Hct at each stage of CPB (ΔHct) was determined. The oxygen extraction fraction is the ratio of the amount of oxygen supplied from the arteries to the amount of oxygen used in tissues. Since venous oxygen saturation was not separately measured in this study, the oxygen extraction fraction was estimated indirectly using the ScO2 value, mainly reflecting venous saturation (Sa-cO2/SaO2). The mean hemodynamic variables at each CPB stage were also determined.
2.4 Performance Measurement (PM) of ScO2
The PM of intraoperative ScO2 was calculated using the formula proposed in a pharmacokinetic study of drug concentration [10]. The reference ScO2, defined as the ScO2 measured before incision, after induction of anesthesia [11] was set as the target concentration and the measured ScO2 after incision as the actual concentration.
The reference ScO2 was calculated as the median ScO2 for 1 min during steady state after induction of anesthesia. Throughout the operation, ScO2 was automatically recorded at intervals of 5–6 seconds and stored in the Vital Recorder database. PM variables of ScO2 were calculated by dividing ScO2 data according to surgical stage: 1) Before CPB (from the time of surgical incision to aorta cannulation, pre-CPB), 2) During CPB (from the beginning to the end of CPB), and 3) After CPB (from protamine administration to skin closure, post-CPB). In addition, the during CPB stage was further divided and calculated into cooling stage (from CPB on to reaching target hypothermia), cold (hypothermic) stage, and rewarming stage (from the start of warming to CPB off).
Performance error (PE) was defined as the difference between the target value and the actual value. The median performance error (MDPE), defined as the median of PE values, indicated whether the actual value was higher or lower than the reference value. The median absolute performance error (MDAPE) was defined as the median of the absolute PE values, and wobble as the median of the absolute differences between MDPE and PE. The formulas used to calculate PM parameters were as follows:
PE (%) = (measured ScO2 – reference ScO2) × 100/reference ScO2
MDPE (%) = median [PEi, i = 1, 2, 3 …, N] (N, numbers of measured ScO2)
MDAPE (%) = median [|PEi|, i = 1, 2, 3 …, N] (N, numbers of measured ScO2)
wobble (%) = median [|MDPE - PEi|, i = 1, 2, 3 …, N] (N, numbers of measured PE)
Positive and negative MDPE values indicated an increase or decrease, respectively, in ScO2. MDAPE, defined as the absolute value of the difference between the measured and reference ScO2 values, did not indicate whether these values increased or decreased. Wobble was the median absolute value of the MDPE minus PE, with a larger wobble indicative of more unstable ScO2.
Data are presented as number with percentage or mean ± standard deviation. Continuous variables in the acyanotic and cyanotic groups were compared using Student’s t-tests, and categorical variables were compared using chi-square tests. The associations between laboratory variables and PM parameters at each stage were determined by Pearson correlation. All p-values < 0.05 were considered statistically significant. Statistical analyses were performed using R 3.6.0 (http://www.rproject.org/) and SPSS version 22.0 (IBM SPSS Inc., Chicago, IL, USA) software.
Of the 148 patients initially enrolled, 51 were excluded, including 5 with preexisting brain malformation or craniofacial anomalies, 14 with chromosomal anomalies, 11 with cardiac lesions associated with multiorgan syndrome, 3 with total deep hypothermic circulatory arrest, 2 who were unsuccessfully weaned from CPB on the initial attempt, and 16 with incomplete data. Of the remaining 97 children, 51 were acyanotic and 46 were cyanotic; their demographic and clinical characteristics are summarized in (Tab. 1). Patients were diagnosed with ASD (n = 12), VSD (n = 39), FSV (n = 16), and TOF (n = 30). All 51 acyanotic patients underwent total anatomical correction. Of the 46 patients with cyanotic CHD, 29 underwent total correction and 17 underwent palliative surgery. Palliative surgery was a Blalock-Taussig shunt or bidirectional cavopulmonary shunt. Total CPB time was significantly longer in patients with cyanotic than in those with acyanotic CHD (128 ± 61 min vs. 81 ± 34 min; p < 0.001).
Table 1: Demographic and clinical characteristics of the study cohort

Note: Data are presented as mean ± standard deviation, or number (%).
3.2 Hemodynamic and Laboratory Profiles
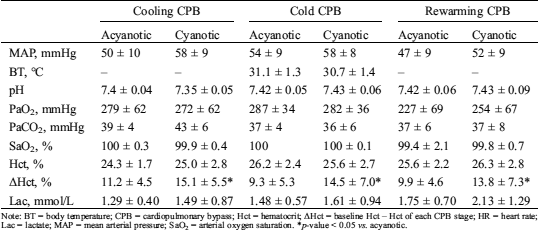
The hemodynamic and laboratory profiles according to the stages of CPB are shown in (Tab. 2) and (Tab. S1). Hct before CPB was higher in patients with cyanotic than in those with acyanotic CHD. Although Hct during CPB was higher in cyanotic than in acyanotic CHD, the difference was not statistically significant. However, ΔHct during CPB was significantly higher in patients with cyanotic than in those with acyanotic CHD. Following CPB, Hct was higher in cyanotic CHD patients who underwent palliative surgery than in the other patient groups.
Table 2: Hemodynamic and laboratory profiles according to stages of cardiopulmonary bypass

Note: BT = body temperature; C = corrective surgery; CPB = cardiopulmonary bypass; Hct = hematocrit; ΔHct = baseline Hct – Hct of each CPB stage; HR = heart rate; MAP = mean arterial pressure; P = palliative surgery; SaO2 = arterial oxygen saturation; Lac = lactate. *p-value < 0.05 vs. acyanotic; §p-value < 0.05 vs. correction.
3.3 Performance Measurement of ScO2 According to Bypass Stages
Although ScO2 before CPB was similar in patients with cyanotic and acyanotic CHD (65 ± 9% vs. 67 ± 9%; p = 0.380), MDPE was lower (decreased from the reference value) and wobble was larger in cyanotic than in acyanotic patients (Tab. 3). When CPB was started, the MDPE of the acyanotic group fell sharply and tended to be lower than in cyanotic patients, but the difference was not statistically significant (Fig. 1). When CPB time was subdivided, however, MDPE were significant lower in acyanotic group in cooling (−14.4 ± 12.2 vs. −7.0 ± 13.1; p < 0.05) and rewarming stage (−26.4 ± 12 vs. −20.6 ± 12.5; p < 0.05). After weaning from CPB, MDPE was significantly lower and MDAPE was significantly higher in cyanotic than in acyanotic patients, irrespective of the type of surgery (Tab. 3, Tab. S2).
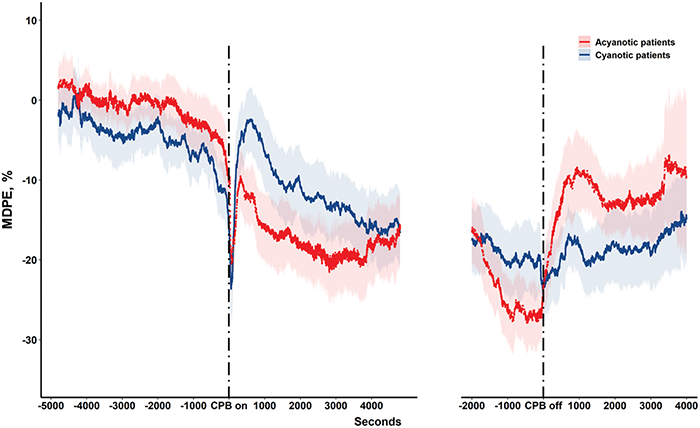
Figure 1: Median performance error of cerebral oxygen saturation (ScO2) during cardiopulmonary bypass (CPB) in pediatric patients with acyanotic (red line) and cyanotic (blue line) congenital heart disease. Shading around performance error flow lines indicates 95% confidence intervals
Table 3: Performance measurement of cerebral oxygen saturation (ScO2) according to stages of cardiopulmonary bypass

Note: C = corrective surgery; CPB = cardiopulmonary bypass; MDAPE = median absolute performance error; MDPE = median performance error; OEF = oxygen extraction fraction; P = palliative surgery; Sa-cO2 = arterial-cerebral oxygen saturation difference; ScO2 = cerebral oxygen saturation. *p-value < 0.05 vs. acyanotic. §p-value < 0.05 vs. correction.
3.4 Correlations Between Clinical Parameters and Performance Measurement of Cerebral Oxygen Saturation in Acyanotic Congenital Heart Disease
Before CPB, ScO2 of acyanotic patients correlated positively with Hct and MAP. During CPB, increased ΔHct correlated with higher ScO2. However, MDPE and MDAPE were not significantly associated with ΔHct and Hct levels. Following CPB, increased ΔHct was associated with increased ScO2 and reduced wobble (Tab. 4, Tab. S3).
Table 4: Correlations between hematocrit and performance measurement of cerebral oxygen saturation in acyanotic patients with congenital heart disease (stages of cardiopulmonary bypass)

Note: CPB = cardiopulmonary bypass; Hct = hematocrit; ΔHct = baseline Hct – Hct at each CPB stage; MDAPE = median absolute performance error; MDPE = median performance error; ScO2 = cerebral oxygen saturation; MAP = mean arterial pressure. *p-value < 0.05.
3.5 Correlations Between Clinical Parameters and Performance Measurement of Cerebral Oxygen Saturation in Cyanotic Congenital Heart Disease
Before CPB, ScO2, MDPE, and wobble of cyanotic patients correlated with SaO2, but not with Hct. During CPB, lower MDPE (r = −0.324, p < 0.05) and higher MDAPE (r = 0.339, p < 0.05) correlated with increased ΔHct (Fig. 2). In particular, MDPE showed a significant correlation with ΔHct when subdivided by cooling (r = −0.472, p < 0.05), cold (r = −0.455, p < 0.05), and rewarming CPB (r = −0.508, p < 0.05) as well as with entire CPB. After CPB, PM parameters were not significantly associated with ΔHct and Hct levels in patients with cyanotic CHD who underwent corrective surgery. Conversely, lower Hct levels correlated significantly with lower ScO2 and MDPE, and higher MDAPE, in patients with cyanotic CHD who underwent palliative surgery (Tab. 5, Tab. S4).
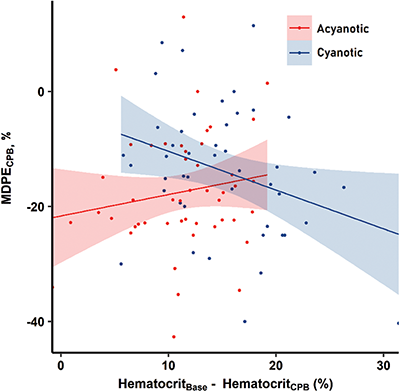
Figure 2: Correlations between changes in hematocrit and median performance error (MDPE) of cerebral oxygen saturation during cardiopulmonary bypass (CPB) in pediatric patients with acyanotic (red dots and line) and cyanotic (blue dots and line) congenital heart disease
Table 5: Correlations between hematocrit and performance measurement of cerebral oxygen saturation in cyanotic patients with congenital heart disease (stages of cardiopulmonary bypass)

Note: CPB = cardiopulmonary bypass; Hct = hematocrit; ΔHct = baseline Hct – Hct at each CPB stage; MDAPE = median absolute performance error; MDPE = median performance error; ScO2 = cerebral oxygen saturation; MAP = mean arterial pressure. *p-value < 0.05.
The present study showed that MDPE was lower and wobble larger in children with cyanotic than with acyanotic CHD before CPB, even if ScO2 did not differ significantly between the two groups. This is thought to be the result of reflecting the stress of the operation after incision. This means that the cerebral oxygen saturation of the cyanotic CHD group appears to remain similar to that of the acyanotic group, but internally, the equilibrium can be easily broken and the variability is high. During CPB, ΔHct was significantly correlated with lower MDPE and higher MDAPE in children with cyanotic CHD. Conversely, PM parameters in children with acyanotic CHD were not associated with ΔHct, but higher ScO2 levels correlated with increased ΔHct. After CPB, lower Hct levels correlated significantly with lower ScO2 and MDPE in cyanotic patients who underwent palliative surgery, but not in cyanotic patients who underwent corrective surgery.
Baseline ScO2 was similar in children with cyanotic (65 ± 9%) and acyanotic (67 ± 9%) CHD, with this level considered adequate to maintain cerebral oxygenation. Consistent with a previous study, the lower Sa-cO2 correlated with higher baseline Hct in both CHD groups, indicating a compensatory increase in Hct in patients with chronic arterial hypoxemia [4]. Before CPB, however, cyanotic patients had lower MDPE and larger wobble, indicating a relative decrease and a wide fluctuation of ScO2 below and above the reference value. In these patients, MDPE and wobble were correlated with SaO2. A hypoxic event or unbalanced circulation associated with anesthesia induction or surgical stimulation in cyanotic CHD, including TOF and FSV, may reduce SaO2, disturbing the ability to maintain stable ScO2. Hct level itself was not associated with PM parameters before CPB, however, in patients with cyanotic CHD.
In the present study, the oxygen extraction fraction, which represents the oxygen utilization rate in tissues, was indirectly estimated using ScO2, which dominantly reflects venous saturation. Although the oxygen extraction fraction in post-CPB was lower in patients who underwent palliative surgery than in acyanotic patients and in corrective surgery, there was no difference compared to those in the pre-CPB group. This result suggests that, in patients who underwent palliative surgery, preserved oxygen extraction fraction may allow ScO2 and cerebral oxygenation to be maintained at a similar level of pre-CPB under a decrease in absolute levels of ScO2.
At the start of CPB, ScO2 fell sharply and remained low during CPB in both cyanotic and acyanotic patients. The percent change of ScO2 relative to baseline was smaller in patients with cyanotic (10.9 ± 11.4%) than in acyanotic (17.6 ± 7.5%) CHD, although ΔHct was greater in cyanotic patients and mean ScO2 level during CPB did not differ significantly between the two groups. These results suggest that the MDPE during CPB tended to be higher in patients with cyanotic than in acyanotic CHD, suggesting that the CPB-induced increase in SaO2 to 100% may enable sufficient cerebral oxygen delivery under conditions involving compensatory mechanisms for chronic hypoxemia. In addition, MDPE in cyanotic patients was significantly related to ΔHct, either in the entire CPB or in the subdivided CPB stages. This means that hemodilution has had a significant impact on ScO2 variability in cyanotic patients. Regarding the mean ScO2 and PM parameters, cerebral oxygenation during CPB may be comparable in patients with cyanotic and acyanotic CHD.
Hemodilution in CPB is believed to be an advantage in children with acyanotic CHD who have normal cerebral oxygen delivery. As the viscosity of blood decreases, so do the risks to microcirculation flow and the risks of hypertension during high bypass flow. Reduced blood viscosity also reduces the need for blood transfusions [12]. The present study showed that the mean ScO2 during CPB in patients with acyanotic CHD increased as Hct decreased. Hemodilution, however, may have drawbacks in children with cyanotic CHD because a high hematocrit, which compensates for proper oxygen delivery, would no longer operate. Under these conditions, the stability of cerebral oxygenation could be threatened by fluctuations in pump flow and pressure or increased oxygen consumption associated with rewarming. In this study, the increased ΔHct during CPB in cyanotic patients correlated significantly with lower MDPE and higher MDAPE. These results indicate that a greater degree of hemodilution may result in a greater reduction of ScO2 from before to during CPB in patients with cyanotic CHD.
After weaning from CPB, MDPE was lower in cyanotic than in acyanotic CHD patients, regardless of whether they underwent corrective or palliative surgery. However, mean ScO2 and PM parameters were significantly correlated with Hct level in cyanotic patients who underwent palliative surgery, but not in those who underwent corrective surgery. Cerebral oxygen delivery may be dependent on post-CPB Hct level because arterial hypoxemia can persist in patients with a single functional ventricle after palliative surgery, including after bidirectional cavopulmonary shunt, Fontan operation, and Norwood operation. Therefore, increasing Hct after CPB in patients who undergo palliative surgery may enhance cerebral oxygenation.
To assess variations in cerebral oxygenation throughout the operation, we employed PMs, which can quantify differences between measured ScO2 and baseline ScO2 before CPB. This method which includes measurements of MDPE, MDAPE, and wobble, was originally used to study the bias and accuracy of the drug concentration in pharmacokinetic studies, was used as a method of this study with reference to a previous study applied in clinical practice. Likewise, it may account for biases, inaccuracies, and time-dependent variations in ScO2 during cardiac surgery [10,11]. Although mean ScO2 was similar in patients with cyanotic and acyanotic CHD, the fluctuations of each point ScO2 could be different significantly in these two groups according to CPB stage. Because cerebral oxygenation is autoregulated, ScO2 should be constantly maintained within the target level. Therefore, applying PM parameters such as MDPE and wobble more accurately reflects the adequacy of the cerebral oxygenation than comparing the mean value.
Besides Hct, ScO2 is also influenced by various determinants of cerebral oxygenation during CPB, including temperature, pH, and PaCO2 [7]. The present study found that pH and mean ScO2 were negatively correlated in acyanotic patients. Wobble in cyanotic patients was associated with pH, PaCO2, and temperature. Hypothermia and alkalosis could drastically impair the unloading of oxygen, as well as reducing hemoglobin concentrations, resulting in hemodilution. Hypothermia has the advantage of reducing cerebral oxygen demand, so this should also be considered. In this study, both acyanotic and cyanotic groups showed a relationship with PM parameters in the cold stage, which may reflect the importance of maintaining acid-base balance during CPB. Although ScO2 does not fully reflect the cerebral status, it is considered to be an appropriate noninvasive surveillance device for pediatric patients and is now becoming increasingly important in neurological prognosis [2,3].
The present study had several limitations, including its retrospective, single-center design with a small population of patients with various types of CHD. Further studies including large cohorts of patients are needed to analyze which degree of hemodilution causes a dependence between the decrease in Hct and ScO2, and to elucidate whether fluctuations in ScO2 are associated with hemodynamic instability and hypoxic events. In addition, cerebral oxygen balance is affected by pH, PaCO2, cardiac output, temperature, and Hct [5]. Since ScO2 fluctuation reflects oxygen delivery through cerebral blood flow and consumption, consideration of factors that reduce oxygen demand, such as hypothermia, is necessary. Although blood gas and flow management were maintained at narrow target levels, the acid-base status, pump flow, temperature, and perfusion pressure over CPB stages inevitably changed. Because we calculated the mean values of these parameters at each stage, caution should be exercised in interpreting the results of this study. Nevertheless, rapid changes in ScO2 in response to changes in the acid-base status, pump flow, temperature, and perfusion pressure would indicate problems in the autoregulation of cerebral oxygenation [13]. In addition, fluctuations in negatively directed ScO2 may be exacerbated by the reduction of Hct from the preoperative baseline level in patients with cyanotic CHD.
The ScO2 of children with cyanotic CHD may be maintained without significant differences compared to acyanotic children, but its variability is significantly higher. Hemodilution during CPB can boost cerebral oxygenation in children with acyanotic CHD. In children with cyanotic CHD, however, fluctuations in cerebral oxygenation may be affected by the magnitude of Hct reduction during CPB, emphasizing the importance of avoiding excessive hemodilution. Further studies are needed to clarify whether fluctuations in ScO2 associated with acute hemodilution during CPB have clinical implications, including neurodevelopmental outcomes, in patients with cyanotic CHD. We should also study other factors including temperature and systemic perfusion that affect changes in cerebral blood flow and oxygen consumption that can affect ScO2 variability.
Funding Statement: The authors received no specific funding for this study.
Conflicts of Interest: The authors declare that they have no conflicts of interest to report regarding the present study.
1. Lee, J. K., Easley, R. E., Brady, K. M. (2008). Neurocognitive monitoring and care during pediatric cardiopulmonary bypass—current and future directions. Current Cardiology Reviews, 4(2), 123–139. DOI 10.2174/157340308784245766. [Google Scholar] [CrossRef]
2. Spaeder, M. C., Klugman, D., Skurow-Todd, K., Glass, P., Jonas, R. A. et al. (2017). Perioperative near-infrared spectroscopy monitoring in neonates with congenital heart disease: Relationship of cerebral tissue oxygenation index variability with neurodevelopmental outcome. Pediatric Critical Care Medicine, 18(3), 213–218. DOI 10.1097/PCC.0000000000001056. [Google Scholar] [CrossRef]
3. Kussman, B. D., Wypij, D., Laussen, P. C., Soul, J. S., Bellinger, D. C. et al. (2010). Relationship of intraoperative cerebral oxygen saturation to neurodevelopmental outcome and brain magnetic resonance imaging at 1 year of age in infants undergoing biventricular repair. Circulation, 122(3), 245–254. DOI 10.1161/CIRCULATIONAHA.109.902338. [Google Scholar] [CrossRef]
4. Kussman, B. D., Laussen, P. C., Benni, P. B., McGowan, F. X. Jr., McElhinney, D. B. (2017). Cerebral oxygen saturation in children with congenital heart disease and chronic hypoxemia. Anesthesia & Analgesia, 125(1), 234–240. DOI 10.1213/ANE.0000000000002073. [Google Scholar] [CrossRef]
5. Menke, J., Moller, G. (2014). Cerebral near-infrared spectroscopy correlates to vital parameters during cardiopulmonary bypass surgery in children. Pediatric Cardiology, 35(1), 155–163. DOI 10.1007/s00246-013-0754-9. [Google Scholar] [CrossRef]
6. Haydin, S., Onan, B., Onan, I. S., Ozturk, E., Iyigun, M. et al. (2013). Cerebral perfusion during cardiopulmonary bypass in children: Correlations between near-infrared spectroscopy, temperature, lactate, pump flow, and blood pressure. Artificial Organs, 37(1), 87–91. DOI 10.1111/j.1525-1594.2012.01554.x. [Google Scholar] [CrossRef]
7. Nollert, G., Mohnle, P., Tassani-Prell, P., Reichart, B. (1995). Determinants of cerebral oxygenation during cardiac surgery. Circulation, 92(9 Suppl), II327–II333. DOI 10.1161/01.CIR.92.9.327. [Google Scholar] [CrossRef]
8. Kim, J. W., Shin, W. J., Park, I., Chung, I. S., Gwak, M. et al. (2014). Splanchnic oxygen saturation immediately after weaning from cardiopulmonary bypass can predict early postoperative outcomes in children undergoing congenital heart surgery. Pediatric Cardiology, 35(4), 587–595. DOI 10.1007/s00246-013-0824-z. [Google Scholar] [CrossRef]
9. Lee, H. C., Jung, C. W. (2018). Vital recorder—A free research tool for automatic recording of high-resolution time-synchronised physiological data from multiple anaesthesia devices. Scientific Reports, 8(1), 1527. DOI 10.1038/s41598-018-20062-4. [Google Scholar] [CrossRef]
10. Varvel, J. R., Donoho, D. L., Shafer, S. L. (1992). Measuring the predictive performance of computer-controlled infusion pumps. Journal of Pharmacokinetics and Biopharmaceutics, 20(1), 63–94. DOI 10.1007/BF01143186. [Google Scholar] [CrossRef]
11. Lee, H. C., Ryu, H. G., Jung, C. W. (2017). Performance measurement of intraoperative systolic arterial pressure to predict in-hospital mortality in adult liver transplantation. Scientific Reports, 7(1), 7030. DOI 10.1038/s41598-017-07664-0. [Google Scholar] [CrossRef]
12. Hirata, Y. (2018). Cardiopulmonary bypass for pediatric cardiac surgery. General Thoracic and Cardiovascular Surgery, 66(2), 65–70. DOI 10.1007/s11748-017-0870-1. [Google Scholar] [CrossRef]
13. Votava-Smith, J. K., Statile, C. J., Taylor, M. D., King, E. C., Pratt, J. M. et al. (2017). Impaired cerebral autoregulation in preoperative newborn infants with congenital heart disease. Journal of Thoracic and Cardiovascular Surgery, 154(3), 1038–1044. DOI 10.1016/j.jtcvs.2017.05.045. [Google Scholar] [CrossRef]
Table S1: Hemodynamic and laboratory profiles according to subdivided stages of entire cardiopulmonary bypass
Note: BT = body temperature; CPB = cardiopulmonary bypass; Hct = hematocrit; ΔHct = baseline Hct – Hct of each CPB stage; HR = heart rate; Lac = lactate; MAP = mean arterial pressure; SaO2 = arterial oxygen saturation. *p-value < 0.05 vs. acyanotic.
Table S2: Performance measurement of cerebral oxygen saturation (ScO2) according to subdivided stages of entire cardiopulmonary bypass

Note: CPB = cardiopulmonary bypass; MDAPE = median absolute performance error; MDPE = median performance error; OEF = oxygen extraction fraction; ScO2 = cerebral oxygen saturation. *p-value < 0.05 vs. acyanotic.
Table S3: Correlations between clinical parameters and performance measurement of cerebral oxygen saturation in acyanotic patients with congenital heart disease (stages of cardiopulmonary bypass)

Note: BT = body temperature; CPB = cardiopulmonary bypass; Hct = hematocrit; ΔHct = baseline Hct – Hct at each CPB stage; MAP = mean arterial pressure; MDAPE = median absolute performance error; MDPE = median performance error; SaO2 = arterial oxygen saturation; ScO2 = cerebral oxygen saturation. *p-value < 0.05.
Table S4: Correlations between clinical parameters and performance measurement of cerebral oxygen saturation in cyanotic patients with congenital heart disease (stages of cardiopulmonary bypass)

Note: BT = body temperature; CPB = cardiopulmonary bypass; Hct = hematocrit; ΔHct = baseline Hct – Hct at each CPB stage; MAP = mean arterial pressure; MDAPE = median absolute performance error; MDPE = median performance error; SaO2 = arterial oxygen saturation; ScO2 = cerebral oxygen saturation. *p-value < 0.05.
 | This work is licensed under a Creative Commons Attribution 4.0 International License, which permits unrestricted use, distribution, and reproduction in any medium, provided the original work is properly cited. |