DOI:10.32604/cmc.2020.012780
| Computers, Materials & Continua DOI:10.32604/cmc.2020.012780 | |
| Article |
On Modeling the Medical Care Insurance Data via a New Statistical Model
1Accounting Department, School of Business, Nanjing University, Nanjing, China
2Department of Statistics, Yazd University, Yazd, Iran
3Department of Mathematical and Statistical Sciences, Marquette University, Milwaukee, USA
*Corresponding Author: Zubair Ahmad. Email: z.ferry21@gmail.com
Received: 12 July 2020; Accepted: 12 August 2020
Abstract: Proposing new statistical distributions which are more flexible than the existing distributions have become a recent trend in the practice of distribution theory. Actuaries often search for new and appropriate statistical models to address data related to financial and risk management problems. In the present study, an extension of the Lomax distribution is proposed via using the approach of the weighted T-X family of distributions. The mathematical properties along with the characterization of the new model via truncated moments are derived. The model parameters are estimated via a prominent approach called the maximum likelihood estimation method. A brief Monte Carlo simulation study to assess the performance of the model parameters is conducted. An application to medical care insurance data is provided to illustrate the potentials of the newly proposed extension of the Lomax distribution. The comparison of the proposed model is made with the (i) Two-parameter Lomax distribution, (ii) Three-parameter models called the half logistic Lomax and exponentiated Lomax distributions, and (iii) A four-parameter model called the Kumaraswamy Lomax distribution. The statistical analysis indicates that the proposed model performs better than the competitive models in analyzing data in financial and actuarial sciences.
Keywords: Lomax distribution; family of distributions; financial sciences; Monte Carlo simulation; estimation
Statistical distributions play a vital role in modeling data in applied areas, particularly in the area of risk management problems, banking, economics, financial and actuarial sciences, among others. However, the quality of the approaches mainly depends upon the assumed probability model of the phenomenon under consideration. Among the applied areas, the insurance datasets are usually positive, right-skewed, unimodal shaped and with heavy tails [1–4]. The real-life data sets skewed to the right may be adequately modeled by the skewed distributions [5].
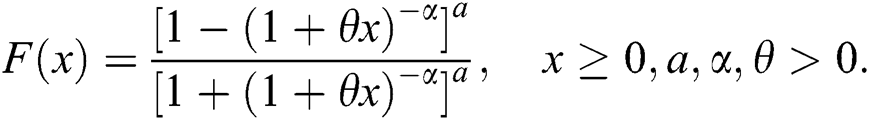
Among the right-skewed models, the Lomax distribution is one of the promising model offers data modeling in the areas of income and wealth inequality, financial and actuarial sciences, medical and biological sciences. A random variable X is said to have Lomax distribution, if its cumulative distribution function (CDF) is given by

where  is a shape parameter and
  is a scale parameter. The probability density function (pdf) corresponding to Eq. (1) is given by

Due to the importance of the Lomax distribution in applied sciences, a number of extensions of the Lomax distribution have been proposed and studied; for detail we refer the interested reader to [6–14]. For more recent developments about distribution theory [15]. We further carry this branch of distribution theory and propose another useful extension of the Lomax distribution.
Recently, [16] proposed the weighted T-X (WTX) family of distributions via the cdf given by

with pdf given by

For the illustrative purposes, Ahmad [16] studied a special-case of the weighted T-X Weibull (WTX-W) distribution. This paper proposes a new probability model with a minimum number of parameters and capable of modeling financial data sets. Henceforth, another special sub-model of the WTX family is introduced by using the Eq. (1) in Eq. (3). The new model may be called the weighted T-X Lomax (WTX-Lomax) distribution.
The rest of this paper is organized as follows. In Section 2, we introduce the WTX-Lomax distribution and provide plots of its density and hazard rate functions. In Section 3, we investigate various mathematical properties of the WTX-Lomax distribution. The characterization of the proposed model is provided in Section 4. In Section 5, estimation of the parameters is provided via the maximum likelihood estimation (MLE) method. Simulation results on the behavior of the MLEs are presented in Section 6. A real data application to medical care insurance data is presented in Section 7. Finally, in Section 8, we conclude the paper.
A random variable, say X, is said to follow the WTX-Lomax distribution, if its cdf is defined by

The density and hazard rate functions corresponding to Eq. (5) are respectively, given by

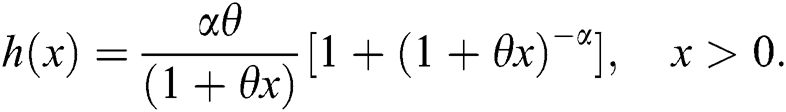
The plots for the pdf and hazard rate function (hrf) of the WTX-Lomax distribution are presented in Figs. 1 and 2, respectively.
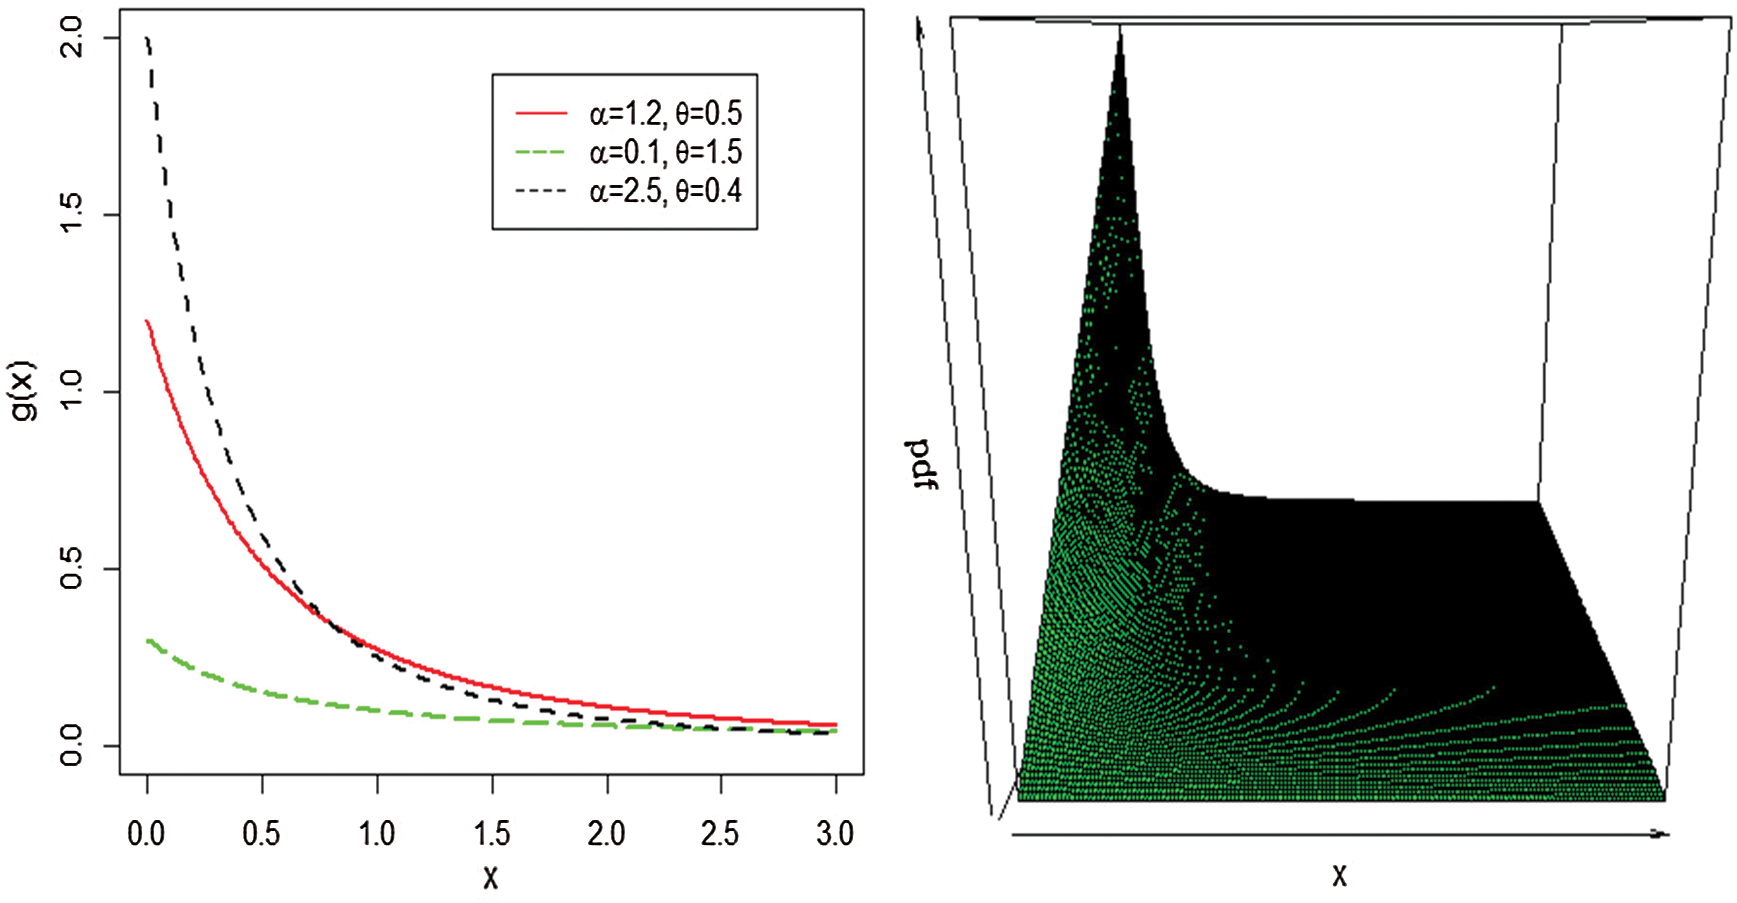
Figure 1: Plots of the WTX-Lomax pdf for some selected parameter values
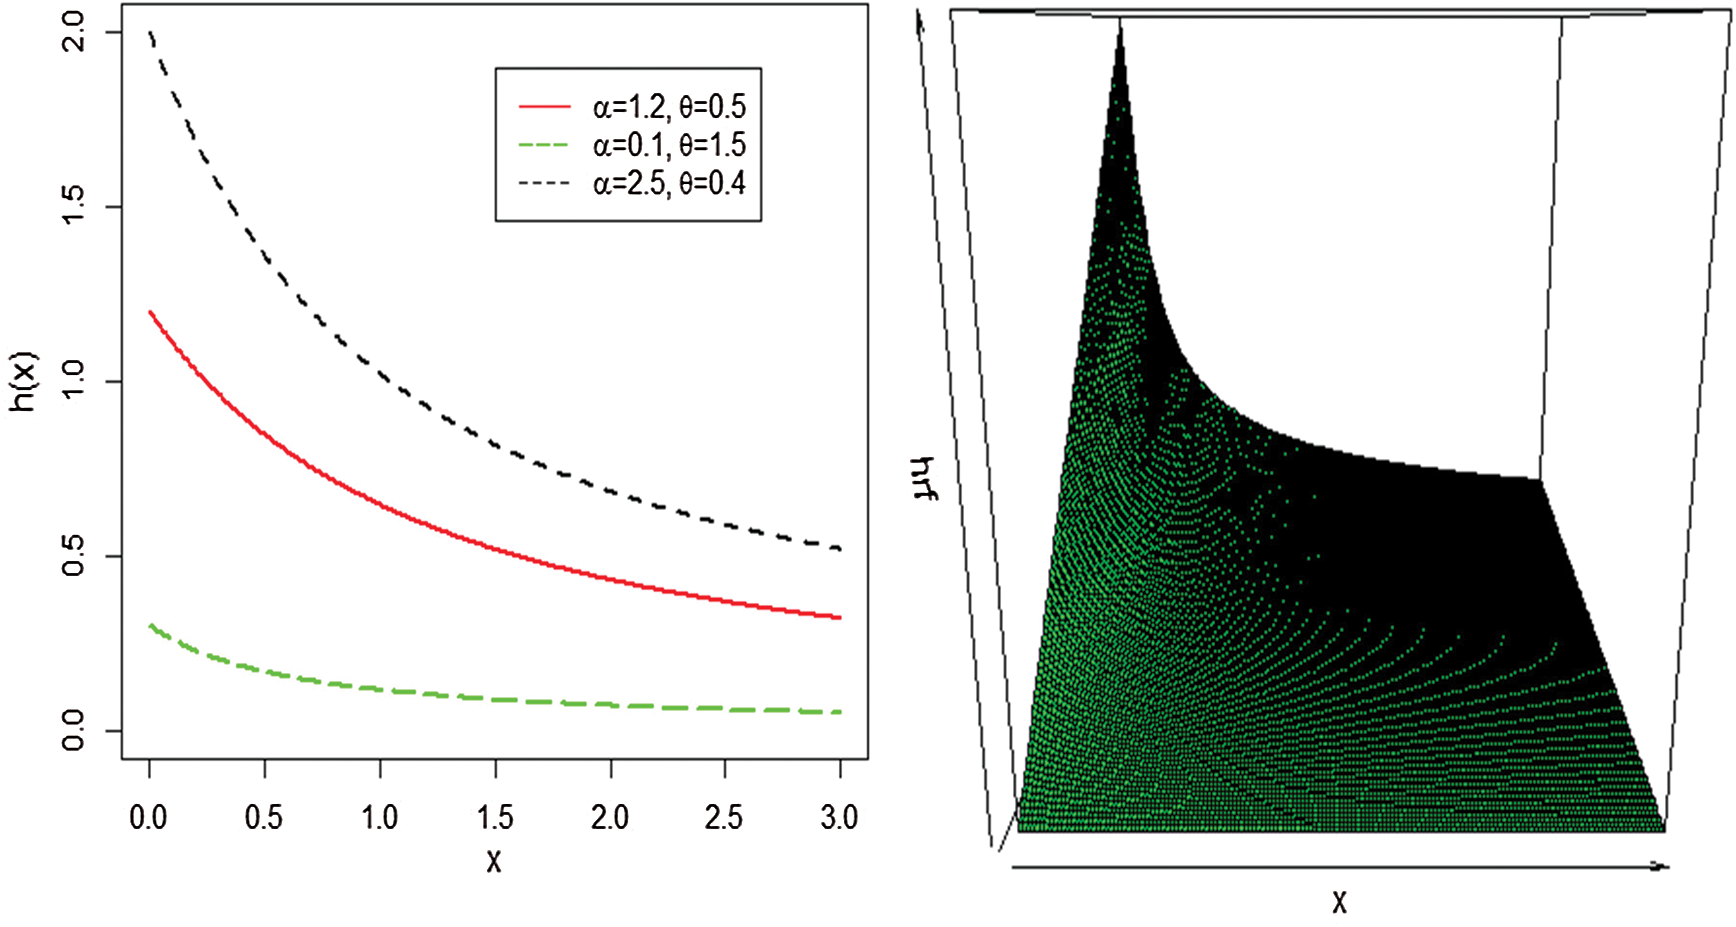
Figure 2: Plots of the WTX-Lomax hrf for some selected parameter values
This section offers some mathematical properties of the WTX-Lomax distribution.
3.1 Quantile and Random Number Generation
The distribution function of the WTX-Lomax distribution is given by Eq. (5). Inverting the expression  we get

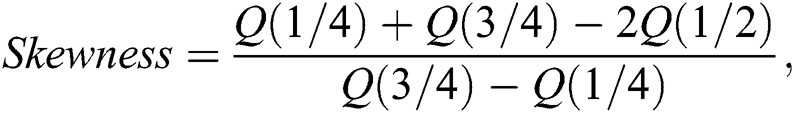
where  The Eq. (7) can be used to generate random numbers from the proposed model. Furthermore, the effects of the shape parameters on the skewness and kurtosis can be detected on quantile measures. We obtain skewness and kurtosis measures of the proposed family using Eq. (7). The Bowley’s skewness of X is given by
whereas, the Moor’s kurtosis is
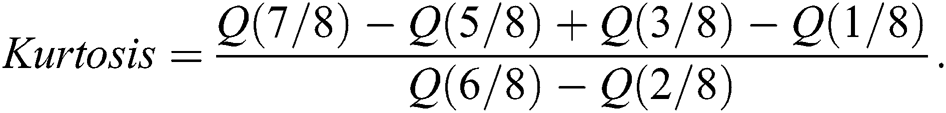
These measures are less sensitive to outliers. Moreover, they do exist for distributions without moments.
Suppose X is a WTX-Lomax distributed random variable, then the rth moment of X is derived as
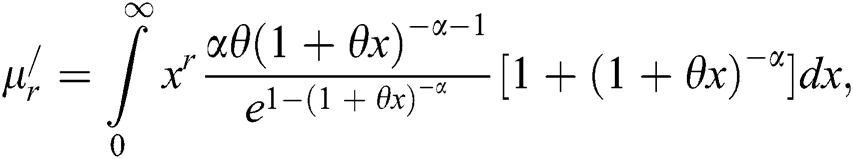
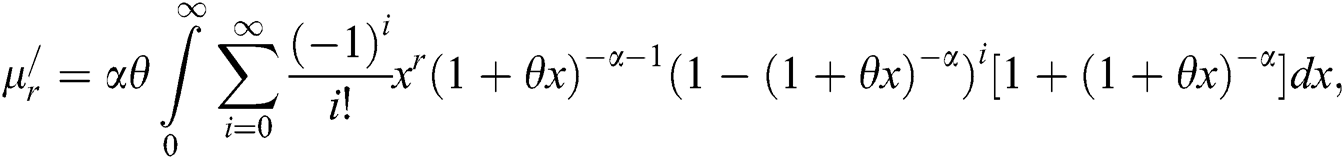
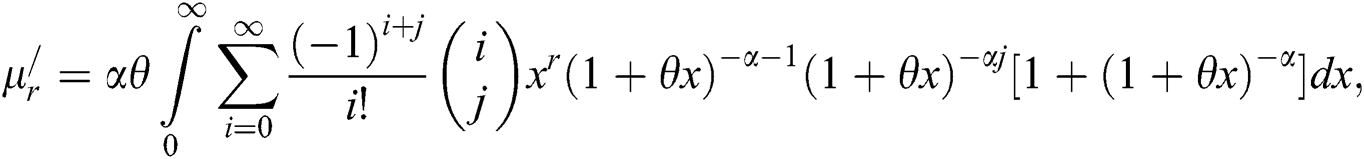

Let 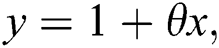
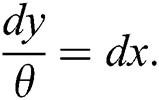 From Eq. (8), we get
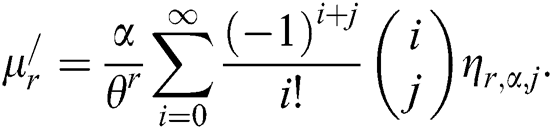
where
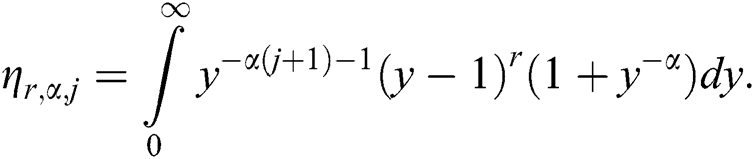
The effects of different values of the parameters  and
and  on the mean, variance, skewness, and kurtosis of the WTX-Lomax distribution are illustrated in Figs. 3 and 4.
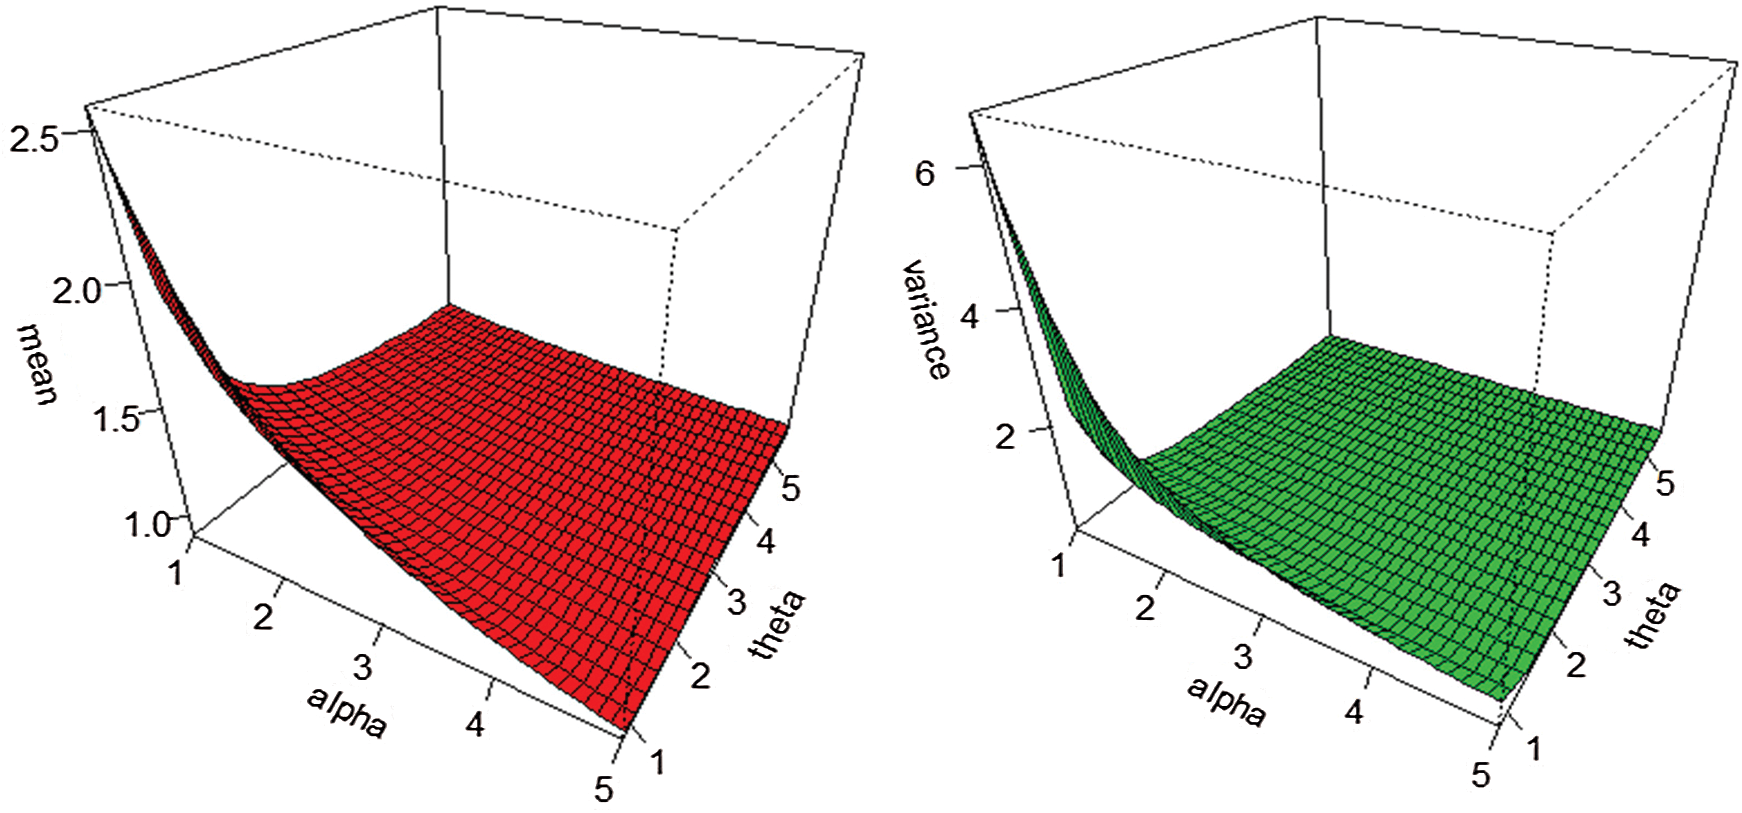
Figure 3: The mean and variance plots of the WTX-Lomax distribution
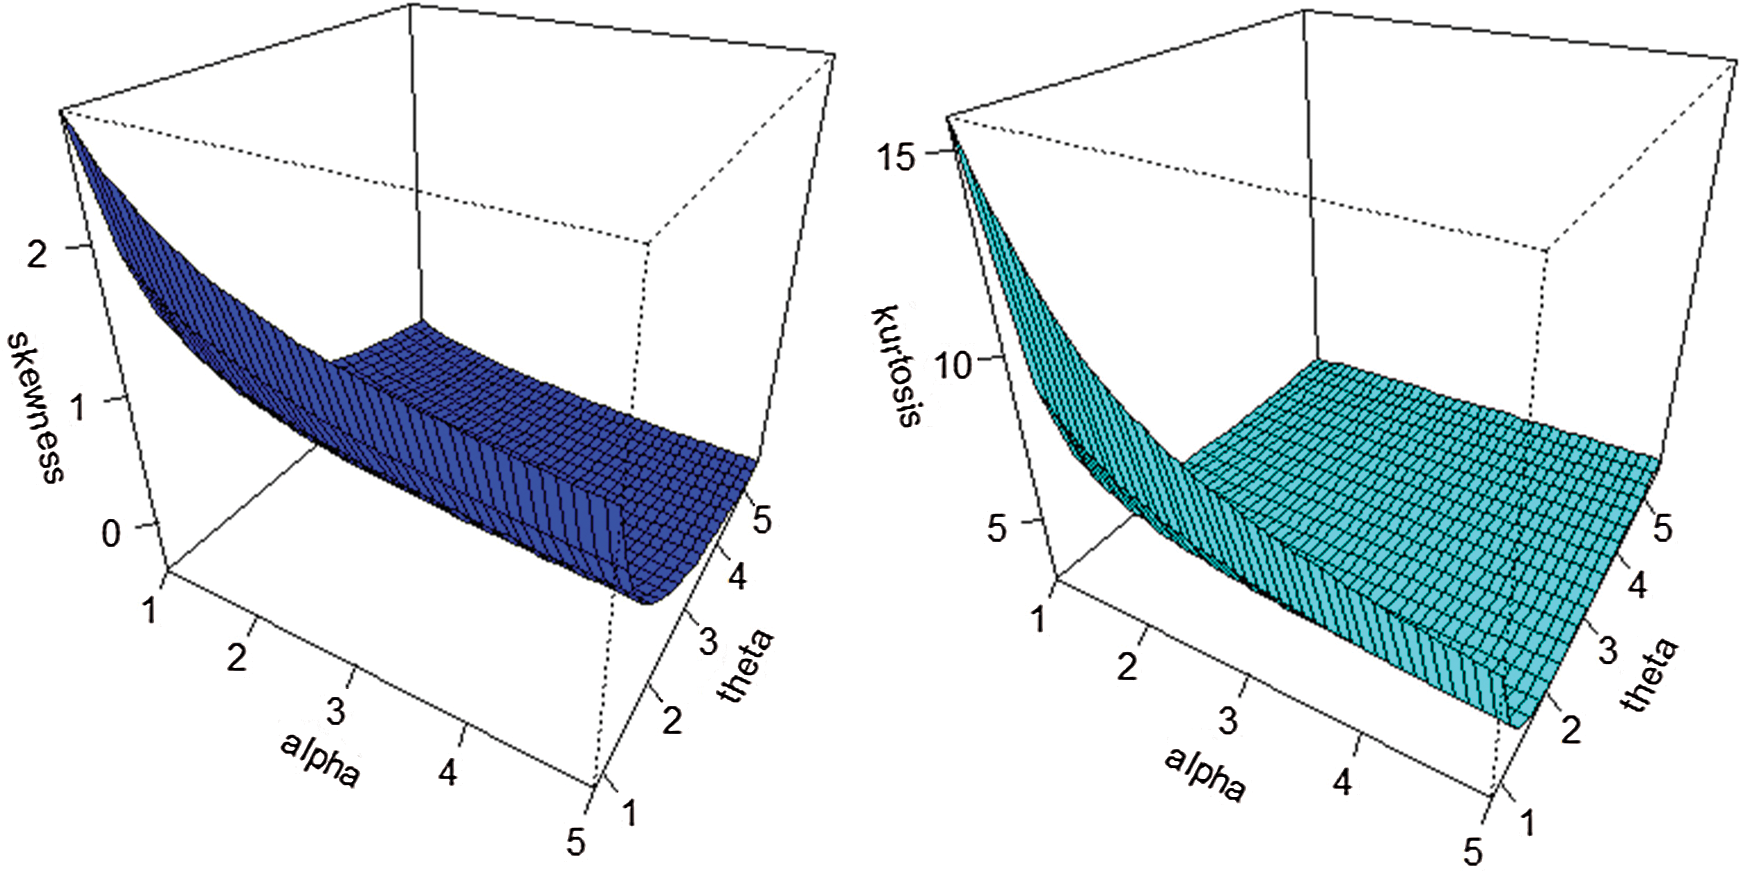
Figure 4: The skewness and kurtosis plots of the WTX-Lomax distribution
4 Characterization of the WTX-Lomax Distribution
To understand the behavior of the data obtained through a given process, we need to be able to describe this behavior via its approximate probability law. This, however, requires to establish conditions which govern the required probability law. In other words we need to have certain conditions under which we may be able to recover the probability law of the data. So, characterization of a distribution is important in applied sciences, where an investigator is vitally interested to find out if their model follows the selected distribution. Therefore, the investigator relies on conditions under which their model would follow a specified distribution. A probability distribution can be characterized in different directions. It should also be mentioned that characterization results are mathematically challenging and elegant. In this section, we present a characterization of the WTX-Lomax distribution based on the conditional expectation (truncated moment) of certain function of a random variable.
4.1 Characterization Based on Two Truncated Moments
This subsection deals with the characterizations of WTX-Lomax distribution in terms of a simple relationship between two truncated moments. We will employ Theorem 1 given in the Appendix A. This characterization is stable in the sense of weak convergence.
Proposition 4.1.1. Let X be a continuous random variable and let 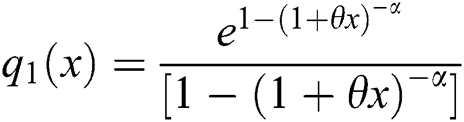 and
and 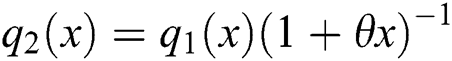 for
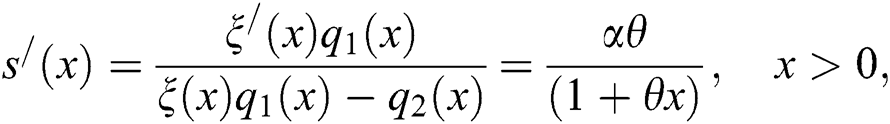
for 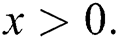 Then X has pdf given in Eq. (6) if and only if the function
  defined in Theorem 1 is of the form
Proof. If X has pdf Eq. (6), then

and

and hence

We also have

Conversely, if  is of the above form, then
and
Now, according to Theorem 1, X has density provided in Eq. (6).
5 The Maximum Likelihood Estimation
In this section, we consider the estimation of the unknown parameters of the WTX-Lomax distribution from complete samples only via the method of maximum likelihood. Let  be a random sample from the WTX-Lomax distribution with observed values
  . The log-likelihood function is

The nonlinear likelihood equations can be obtained by differentiating Eq. (9) as follows:

and

Solving  and
and  gives the maximum likelihood estimates of parameters
  and
and  , respectively. Meanwhile, the solution cannot be obtained analytically except numerically when data sets are available. Softwares like R, MATLAB, MAPLE, and so on could be used to obtain the estimates.
6 Monte Carlo Simulation Study
The behavior of the maximum likelihood estimators of the WTX-Lomax distribution has been investigated by conducting the Monte Carlo simulation studies using R software. Data sets were generated from the WTX-Lomax distribution with a replication number N = 500, random samples of sizes n = 25, 50,…, 500. The simulation is conducted for two different cases using varying parameter values. The selected true parameter values are: (i) Set 1,  and
and  and (ii) Set 1,
  and
and  The simulation results are provided in Figs. 5–8, indicating that
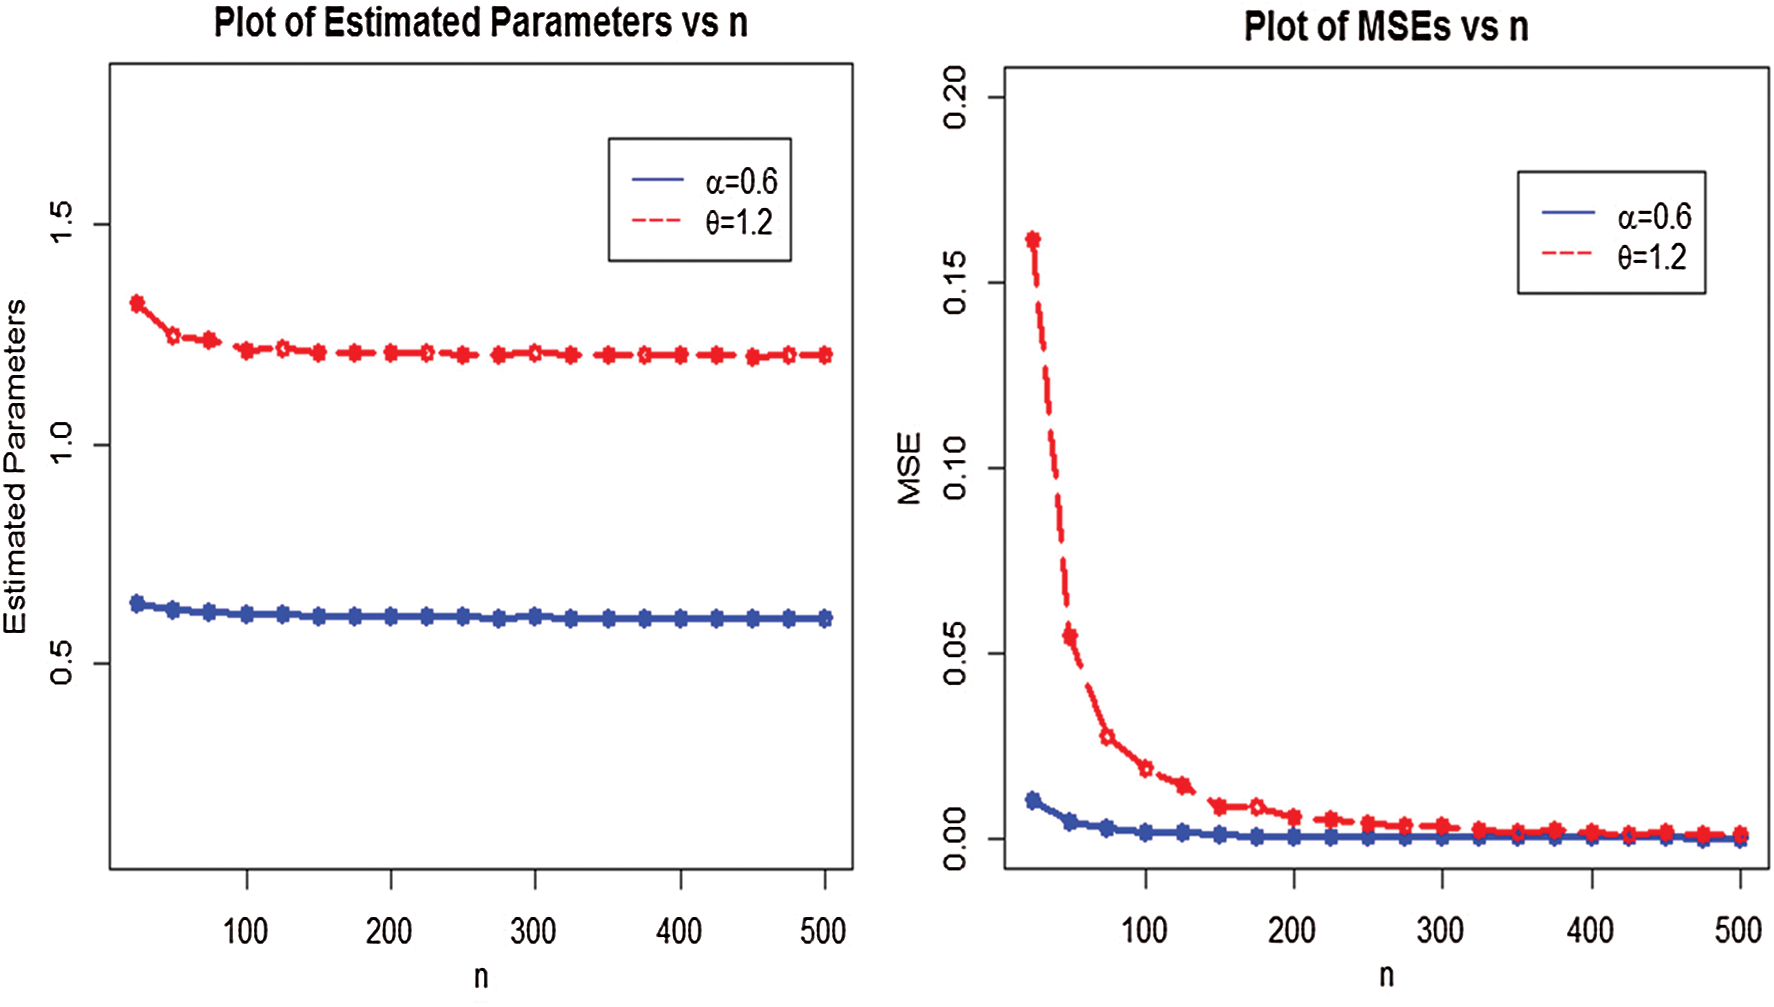
Figure 5: Plots of the estimated parameters and MSEs of the WTX-Lomax distribution
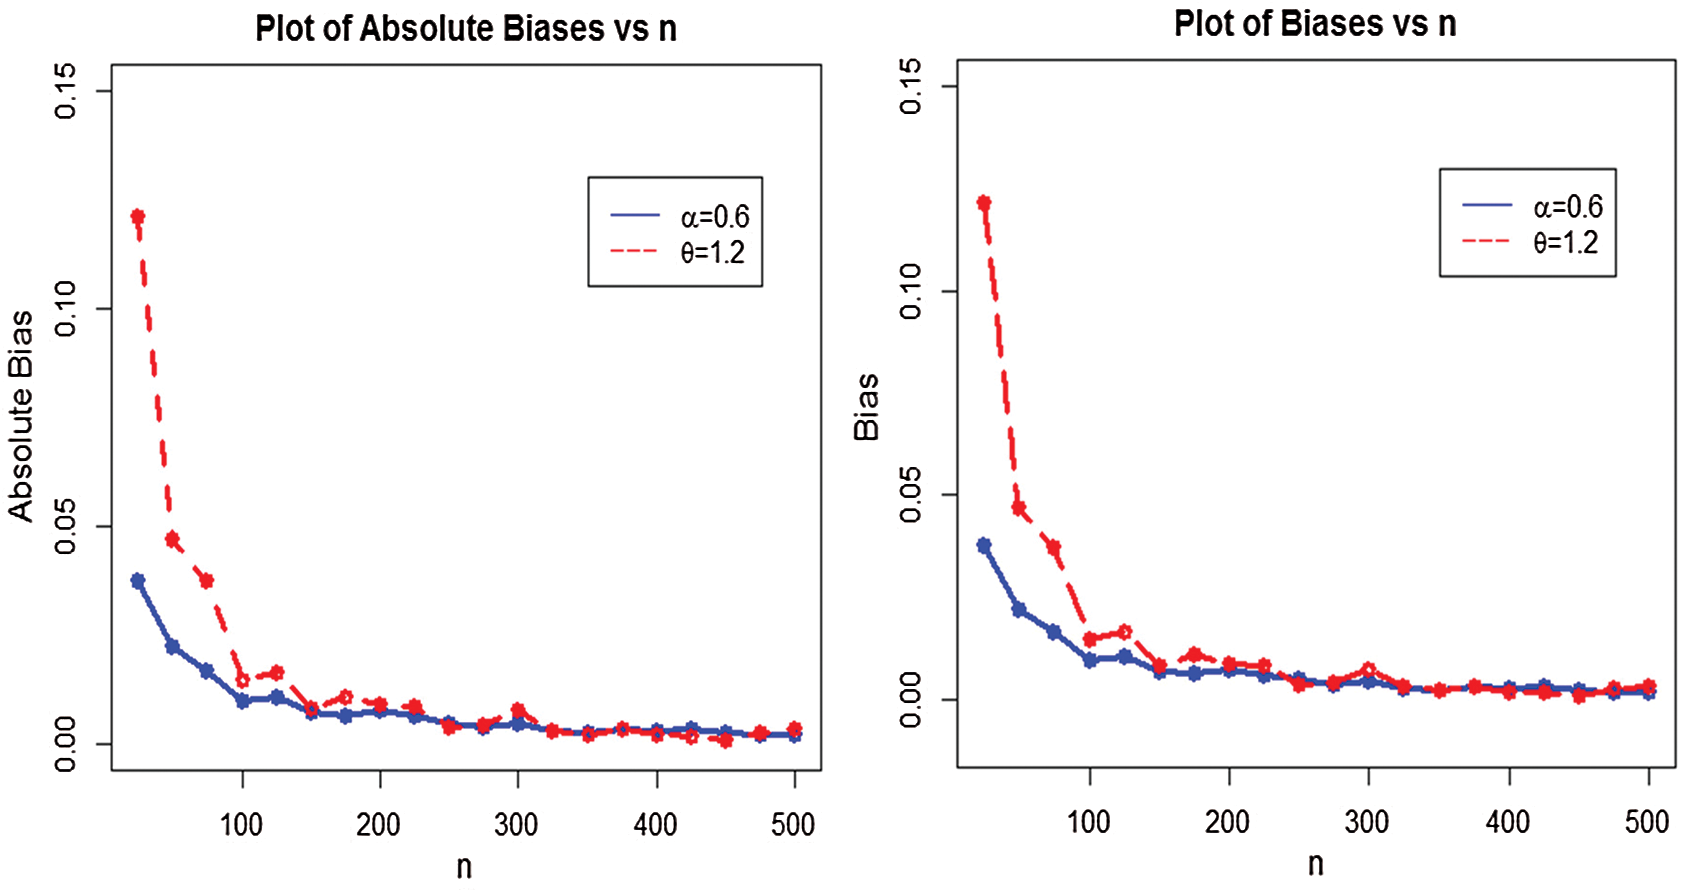
Figure 6: Plots of absolute biases and biases for WTX-Lomax distribution
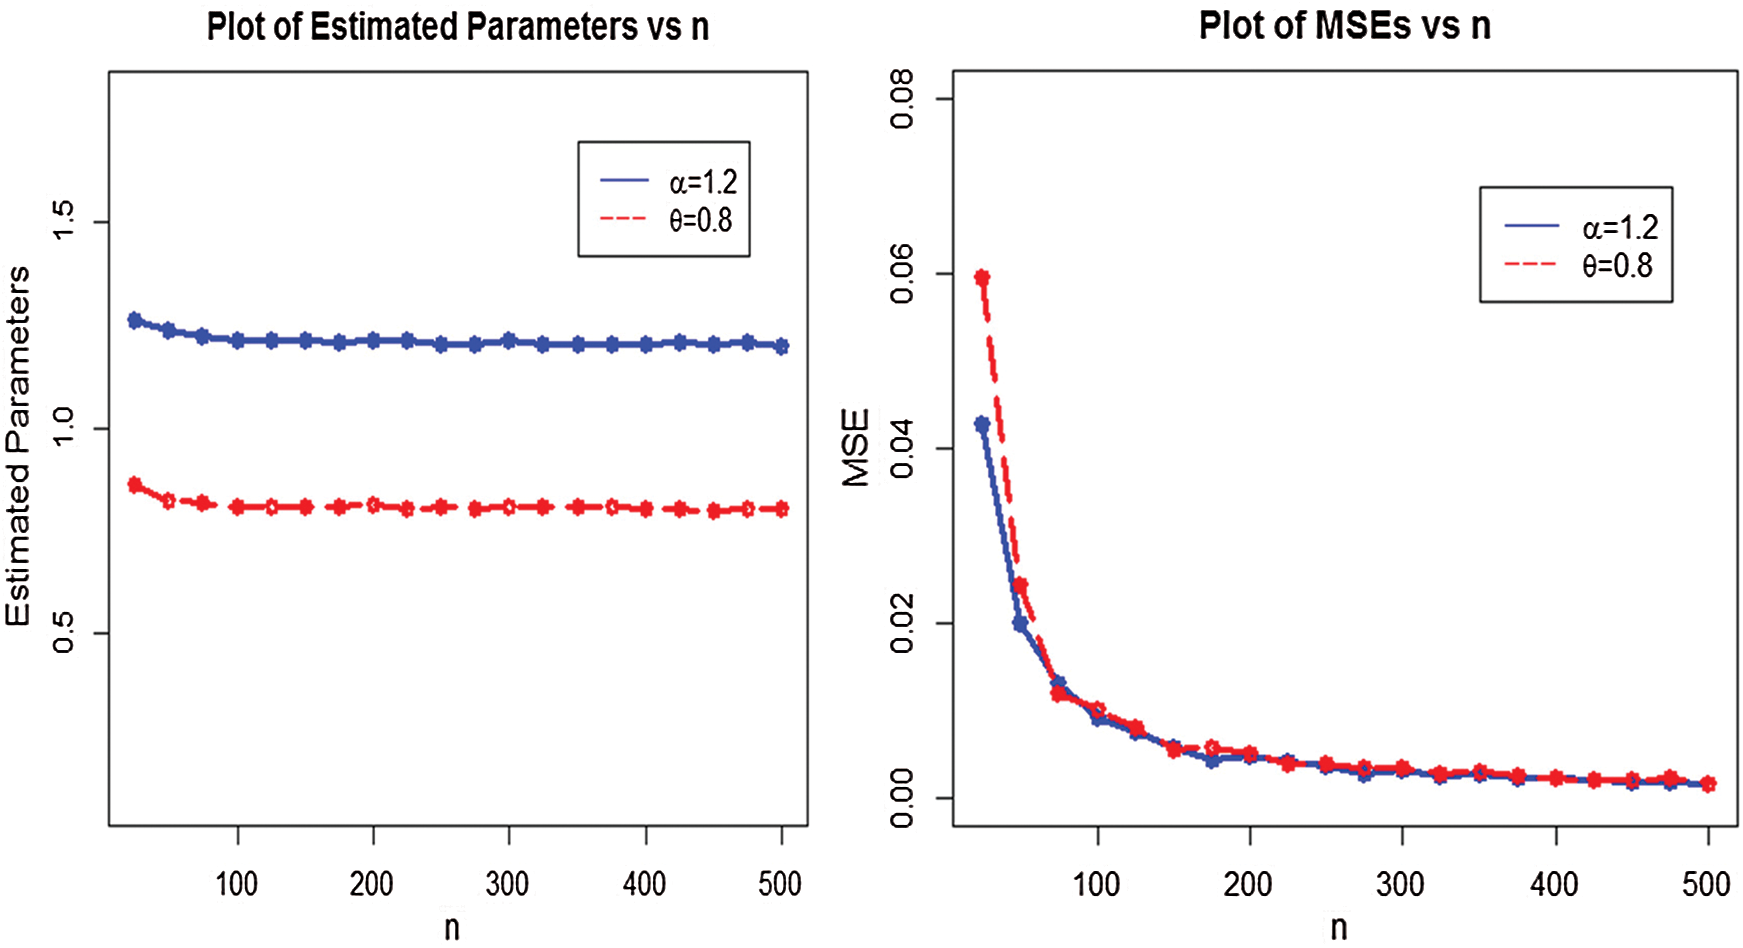
Figure 7: Plots of the estimated parameters and MSEs of the WTX-Lomax distribution
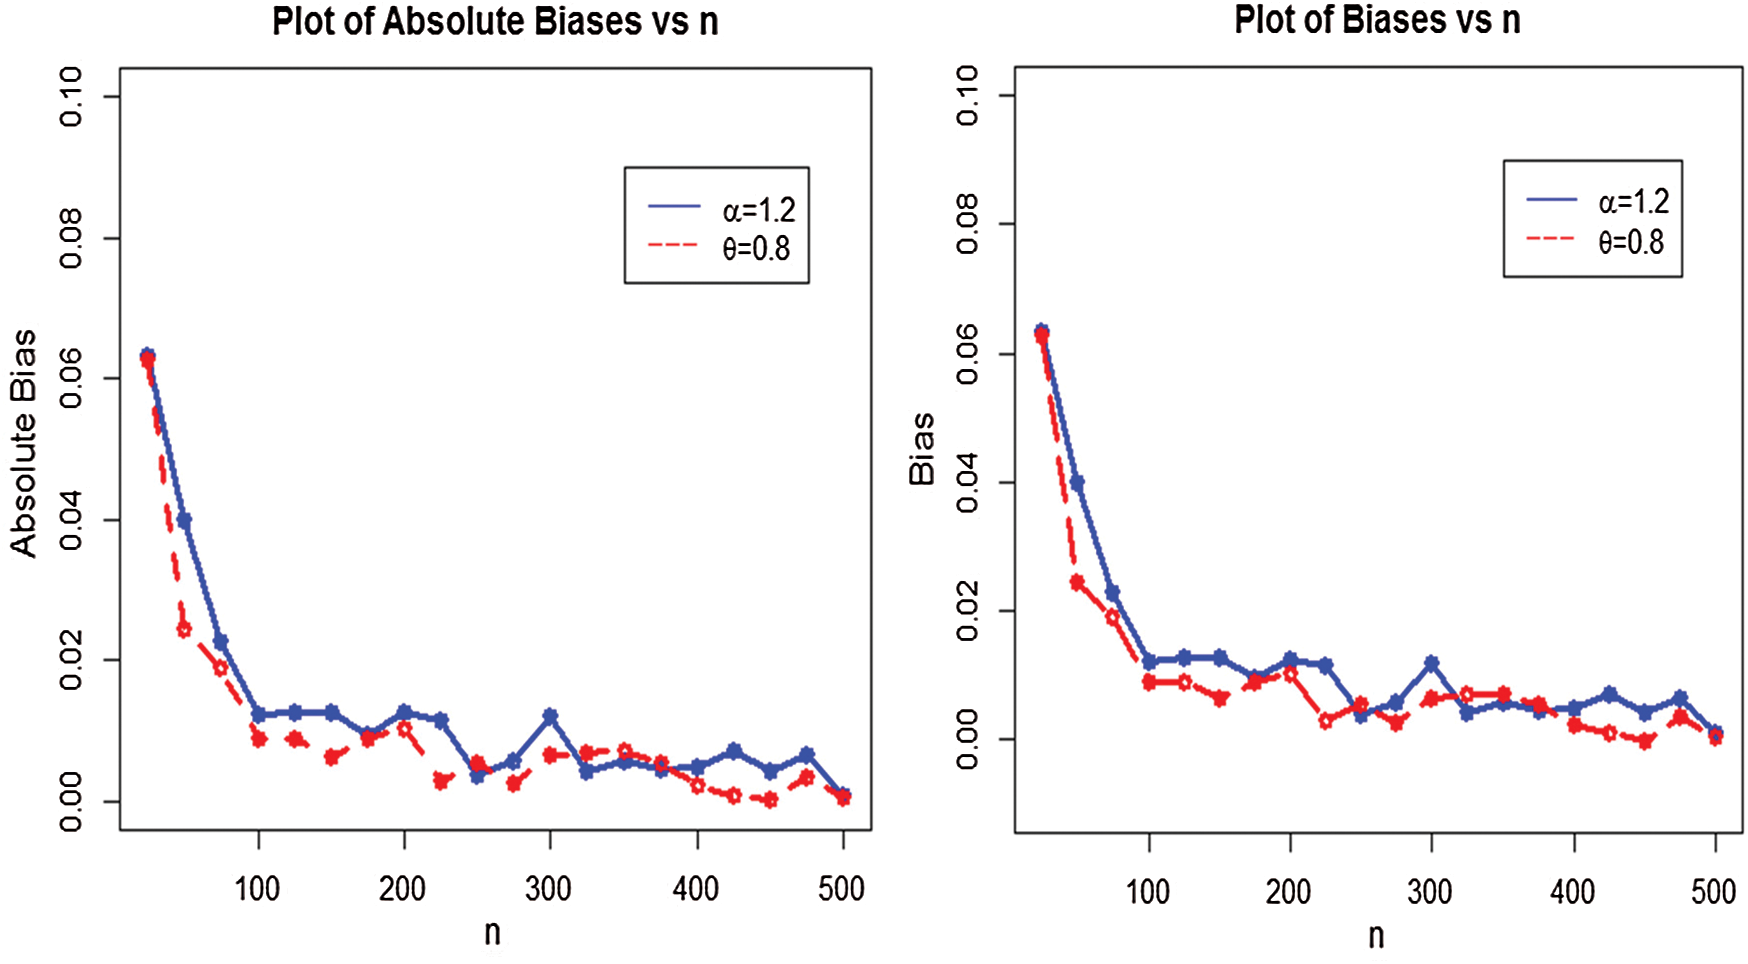
Figure 8: Plots of absolute biases and biases for WTX-Lomax distribution
i)The estimates are quite stable and, more importantly, are close to the true values for these sample sizes,
ii)The estimated biases decrease when the sample size n increases,
iii)The estimated MSEs decay toward zero when the sample size n increases.
7 An Application to Medical Care Insurance Data
The main applications of the heavy-tailed models are the so-called extreme value theory or insurance loss phenomena. In this section, we illustrate the potentiality of the proposed model via a real-life application taken from actuarial sciences. The data set representing the medical care insurances and is available at: https: instruction.bus.wisc.edujfreesjfreesbooksRegression.
The comparison of the WTX-Lomax distribution is made with two parameters, three parameters and four parameters models. The density functions of the competitive distributions are:
•Lomax distribution

•Kumaraswamy Lomax (Ku-Lomax) distribution

•Exponentiated Lomax (E-Lomax) distribution

•Half Logistic Lomax (HL-Lomax) distribution
To decide about the goodness of fit between the proposed and competing distributions, we consider certain statistical measures. In this regard, we took (i) four discrimination measures such as the Akaike information criterion (AIC), Bayesian information criterion (BIC), Hannan–Quinn information criterion (HQIC) and Consistent Akaike Information Criterion (CAIC) and (ii) two goodness of fit procedure including the Cramer–Von Messes (CM) test statistic and Anderson Darling (AD) test statistic.
The proposed WTX-Lomax and the competing distributions are applied to this data set. The maximum likelihood estimates of the models for the medical care insurance data are presented in Tab. 1, whereas the analytical and goodness of fit measures of the proposed and other competitive models are provided in Tabs. 2 and 3, respectively.
Table 1: The estimated values of the parameters of the fitted distributions
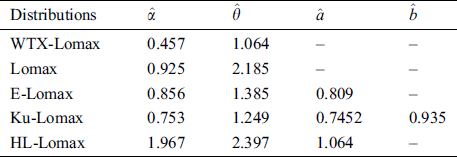
Table 2: The discrimination measures of the fitted models
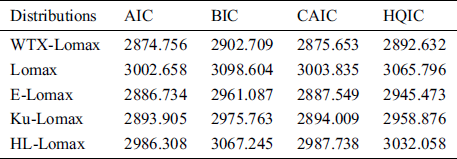
Table 3: The goodness of fit measures of the fitted models
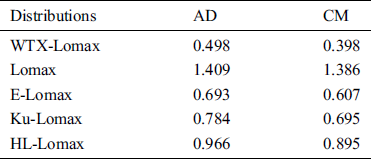
A distribution with lower values of these measures is considered a good candidate model among the applied distributions for the data under consideration. Form Tabs. 2 and 3, it is well clear that the by considering the above statistical tools, we observed that the WTX-Lomax distribution provides the best fit compared to the other competitors since the values of all selected criteria of goodness of fit are significantly smaller for the proposed distribution.
Furthermore, the fitted cdf and Kaplan–Meier survival plots of the proposed model are plotted in Fig. 9, whereas the probability–probability (PP) plot of the proposed model are sketched in Fig. 10. From Fig. 9, it is clear that the proposed model fits the estimated cdf and Kaplan–Meier survival very closely. From Fig. 10, we can easily detect that the proposed model is closely followed the PP-plot which is an empirical tool for finding a best candidate model.
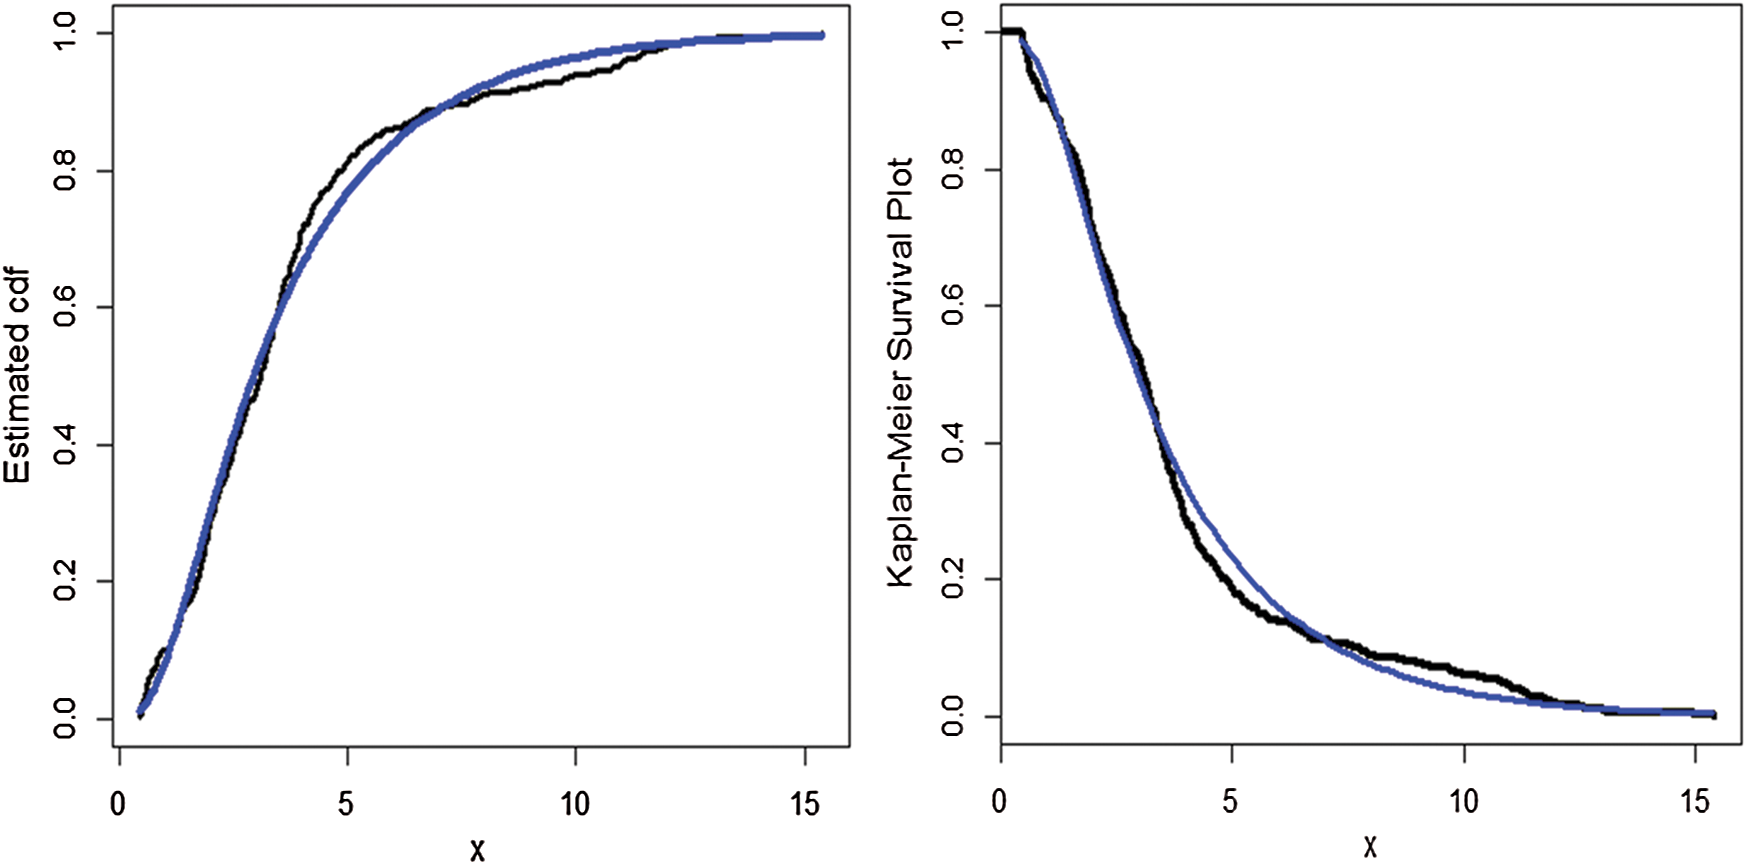
Figure 9: The estimated cdf and Kaplan–Meier survival plots of the WTX-Lomax distribution
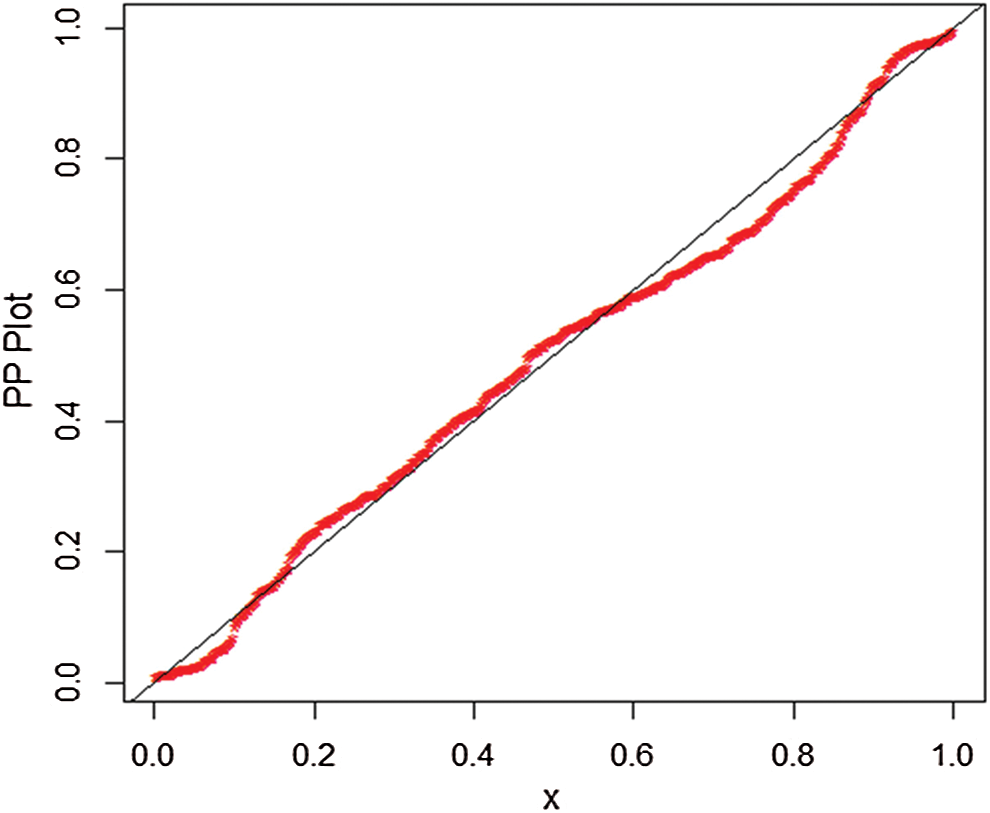
Figure 10: The PP plot of the WTX-Lomax distribution for the medical care insurance data
Over the past couple of decades, the Lomax distribution and its various extensions have been used successfully to model real phenomena in applied areas, particularly in finance, banking, accounting and actuarial sciences. In this article, a new extension of the Lomax distribution, called weighted T-X Lomax distribution has been proposed. Some mathematical properties are derived and maximum likelihood estimates of the model parameters are obtained. The Monte Carlo simulation conducted shows the maximum likelihood estimators of the proposed model are stable enough and the MSEs and biases decreased as the sample size increased. A real-life application from insurances representing medical care insurance data is analyzed showing that the WTX-Lomax distribution provides better fit than some of the other well-known statistical models.
Funding Statement: The author(s) received no specific funding for this study.
Conflicts of Interest: The authors declare that they have no conflicts of interest to report regarding the present study.
References
1. Z. Ahmad, M. E. Mahmoudi and G. G. Hamedani. (2019). “A family of loss distributions with an application to the vehicle insurance loss data,” Pakistan Journal of Statistics and Operation Research, vol. 13, pp. 731–744.
2. Z. Ahmad, E. Mahmoudi and M. Alizadeh. (2020). “Modelling insurance losses using a new beta power transformed family of distributions,” Communications in Statistics-Simulation and Computation, vol. 49, pp. 1–22.
3. Z. Ahmad, E. Mahmoudi and S. Dey. (2020). “A new family of heavy tailed distributions with an application to the heavy tailed insurance loss data,” Communications in Statistics-Simulation and Computation, vol. 49, pp. 1–24.
4. M. Bernardi, A. Maruotti and L. Petrella. (2012). “Skew mixture models for loss distributions: A bayesian approach,” Insurance: Mathematics and Economics, vol. 51, no. 3, pp. 617–623.
5. Z. Ahmad, E. Mahmoudi, G. G. Hamedani and O. Kharazmi. (2020). “New methods to define heavy-tailed distributions with applications to insurance data,” Journal of Taibah University for Science, vol. 14, no. 1, pp. 359–382.
6. A. H. El-Bassiouny, N. F. Abdo and H. S. Shahen. (2015). “Exponential Lomax distribution,” International Journal of Computer Applications, vol. 121, no. 13, pp. 24–29.
7. B. Al-Zahrani and H. Sagor. (2015). “Statistical analysis of the Lomax logarithmic distribution,” Journal of Statistical Computation and Simulation, vol. 85, no. 9, pp. 1883–1901.
8. E. H. A. Rady, W. A. Hassanein and T. A. Elhaddad. (2016). “The power Lomax distribution with an application to bladder cancer data,” SpringerPlus, vol. 5, no. 1, pp. 18–38.
9. G. M. Cordeiro, E. M. Ortega and B. Z. Popovic. (2015). “Te gamma-Lomax distribution,” Journal of Statistical Computation and Simulation, vol. 85, no. 2, pp. 305–319.
10. I. B. Abdul-Moniem. (2012). “Recurrence relations for moments of lower generalized order statistics from exponentiated Lomax distribution and its characterization,” International Journal of Mathematical Archive, vol. 3, pp. 2144–2150.
11. A. J. Lemonte and G. M. Cordeiro. (2013). “An extended Lomax distribution,” Statistics, vol. 47, no. 4, pp. 800–816.
12. N. M. Kilany. (2016). “Weighted Lomax distribution,” SpringerPlus, vol. 5, no. 1, 1862.
13. J. Gillariose and L. Tomy. (2020). “The Marshall–Olkin extended power Lomax distribution with applications,” Pakistan Journal of Statistics and Operation Research, vol. 16, no. 2, pp. 331–341.
14. M. Ijaz, S. M. Asim and Alamgir. (2019). “Lomax exponential distribution with an application to real-life data,” PLoS One, vol. 14, no. 12, pp. 1–16.
15. Z. Ahmad, G. G. Hamedani and N. S. Butt. (2019). “Recent developments in distribution theory: a brief survey and some new generalized classes of distributions,” Pakistan Journal of Statistics and Operation Research, vol. 15, no. 1, pp. 87–110.
16. Z. Ahmad, E. Mahmoudi, S. Dey and S. K. Khosa. (2020). “Modeling vehicle insurance loss data using a new member of TX family of distributions,” Journal of Statistical Theory and Applications, vol. 19, no. 2, pp. 133–147.
Appendix A
Theorem 1. Let ( , F, P) be a given probability space and let H = [a,b] be an interval for some
 . Let X:
 be a continuous random variable with the distribution function
  and let
  and
and  be two real functions defined on H such that

is defined with some real function  . Assume that
  and
and  is twice continuously differentiable and strictly monotone function on the set H. Finally, assume that the equation
  has no real solution in the interior of H. Then
  is uniquely determined by the functions
  and
and  particularly
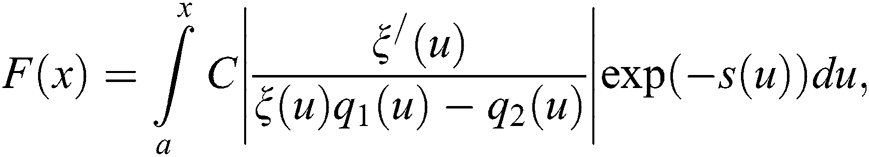
where the function  is a solution of the differential equation
 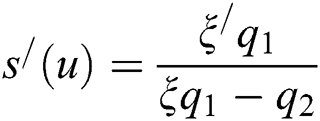 and C is the normalization constant, such that
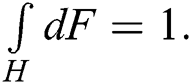
Note: The goal is to have the function  as simple as possible.
We like to mention that this kind of characterization based on the ratio of truncated moments is stable in the sense of weak convergence, in particular, let us assume that there is a sequence  of random variables with distribution functions
  such that the functions
  and
and  satisfy the conditions of Theorem 1 and let
  and
and  for some continuously differentiable real functions
  and
and  Let, finally, X be a random variable with distribution
  Under the condition that
  and
and  are uniformly integrable and the family
  is relatively compact, the sequence
  converges to
  in distribution if and only if
  converges to
  , where
This stability theorem makes sure that the convergence of distribution functions is rejected by corresponding convergence of the functions  and
and  respectively. It guarantees, for instance, the ‘convergence’ of characterization of the Wald distribution to that of the Lévy-Smirnov distribution if
A further consequence of the stability property of Theorem 1 is the application of this theorem to special tasks in statistical practice such as the estimation of the parameters of discrete distributions. For such purpose, the functions  and, specially,
  should be as simple as possible. Since the function triplet is not uniquely determined it is often possible to choose
  as a linear function. Therefore, it is worth analyzing some special cases which helps to find new characterizations rejecting the relationship between individual continuous univariate distributions and appropriate in other areas of statistics.
In some cases, one can take  which reduces the condition of Theorem 1 to
  We, however, believe that employing three functions
  and
and  will enhance the domain of applicability of Theorem 1.
 | This work is licensed under a Creative Commons Attribution 4.0 International License, which permits unrestricted use, distribution, and reproduction in any medium, provided the original work is properly cited. |