DOI:10.32604/cmc.2020.012148
| Computers, Materials & Continua DOI:10.32604/cmc.2020.012148 | |
| Article |
Forecast the Influenza Pandemic Using Machine Learning
1Department of Computer Science, Lahore Garrison University, Lahore, 54792, Pakistan
2Systems Limited, Lahore, 54792, Pakistan
3Computer Science Department, Umm Al-Qura University, Makkah City, 715, Saudi Arabia
4Department of Computer Science, University of Engineering and Technology, Lahore, 54000, Pakistan
*Corresponding Author: Muhammad Adnan Khan. Email: madnankhan@lgu.edu.pk
Received: 16 June 2020; Accepted: 24 July 2020
Abstract: Forecasting future outbreaks can help in minimizing their spread. Influenza is a disease primarily found in animals but transferred to humans through pigs. In 1918, influenza became a pandemic and spread rapidly all over the world becoming the cause behind killing one-third of the human population and killing one-fourth of the pig population. Afterwards, that influenza became a pandemic several times on a local and global levels. In 2009, influenza ‘A’ subtype H1N1 again took many human lives. The disease spread like in a pandemic quickly. This paper proposes a forecasting modeling system for the influenza pandemic using a feed-forward propagation neural network (MSDII-FFNN). This model helps us predict the outbreak, and determines which type of influenza becomes a pandemic, as well as which geographical area is infected. Data collection for the model is done by using IoT devices. This model is divided into 2 phases: The training phase and the validation phase, both being connected through the cloud. In the training phase, the model is trained using FFNN and is updated on the cloud. In the validation phase, whenever the input is submitted through the IoT devices, the system model is updated through the cloud and predicts the pandemic alert. In our dataset, the data is divided into an 85% training ratio and a 15% validation ratio. By applying the proposed model to our dataset, the predicted output precision is 90%.
Keywords: Influenza pandemic; machine learning; prediction influenza; influenza pandemic prediction; forecast pandemic influenza
Influenza is a biological infection affecting the respiratory system that may harm nose, lungs, and throat of a person. The influenza virus is not alike the stomach flu virus. It is found in the body of infected animals, but in 1918 J.S Koen, a veterinarian observed that the same disease start spreading more in humans than pigs, and it is widely known as a “Spanish influenza pandemic of 1918”. Influenza is not a deadly disease but it can be catastrophic. After the end of the 1st world war, a global killer emerged that caused an estimated 14 to 15 million deaths [1]. The disease was highly infectious, when a patient coughs or sneezes, the droplets containing the virus transmits on the human body. On the physically contact with other persons, they also become infected. This is recognized as Spanish pandemic flu as it started from Spain and spread in the whole world.
The second wave of this pandemic came by the end of the 20th century. At the beginning of the 21st century, the threat of this pandemic loomed largely. In April 2009, a new pandemic arose in Mexico, the virus is a subtype of H1N1 which was the same as the Spanish flu virus that came 90 years earlier. The H1N1 virus claimed almost 200 thousand human lives. The seasonal influenza epidemic is the cause of millions of respiratory diseases and results each year in 290,000 to 650,000 deaths all over the world [2–5].
Influenza viruses are associates of the family of Orthomyxoviridae, a group of enveloped viruses containing a segmented negative-sense single-stranded RNA genome [6]. Influenza viruses are types of Ribonucleic acid (RNA) viruses. Clinically, based on its Nucleoprotein (NP) and interstitial protein matrix (M), influenza is categorized in three types: A, B, and C [6–8] and they contain further subtypes. The influenza virus A has 8 genetic fragments that can be used for protein translation and the protein surface contain 18 HA and 11 neuraminidase (NA) subtypes [7]. Different combinations of these HA and NA translation classify different subtypes that affect different hosts such as H1N1, H1N2, and H3N2 of the influenza virus [9] that infect human. The combinations of H5N1, H7N9, and H9N2 infect both animals and birds. Two more combinations of H17N10 and H18N11 are identified in bats [6,7].
Influenza viruses ‘A’ and ‘B’ lead to epidemic influenza. Influenza ‘A’ produces sporadic pandemic. Influenza virus ‘C’ causes mild disease. In all of these 3 types, the influenza virus ‘A’ is the most infectious and it leads to critical and incurable severe respiratory diseases. Furthermore, influenza virus ‘A’ and ‘B’ cause many diseases in humans, and influenza virus C causes disease mainly in animals and birds [8].
In humans, when an infected person coughs or sneezes, thousands of small droplets spread into the atmosphere. Even a very small droplet may contain thousands of viruses. These droplets transmit to the other person’s body and get absorbed with this person’s respiratory nucleus membrane. A protein on the surface of the virus combines the receptor molecule on the surface of the healthy cell. Once a virus gets attached to the cell, it enters the cell within no-time. Now the surface of the virus opens, RNA combines with a molecule, duplicates itself, and makes thousands of copies of itself. Now the cell is exhausted, it becomes very weak and dies. These new viruses start infecting nearby cells and this process is repeated many times. The damaged cell opens the door for other pathogens as bacteria and infection occurs. When the infected person coughs or sneezes, the whole process is repeated and the disease is transmitted.
As the spread of the virus is very rapid and can infect people anytime anywhere in the world, so there is a need for the implementation of machine learning algorithms on the disease data set that can be helpful to forecast the influenza pandemic. Medical facilities need to be advanced so that better decisions for patient diagnosis and treatment options can be made [10]. According to the data released by the World health organization (WHO), there were more than 1.3 million confirmed cases of H1N1 in the world, with a death toll of more than 14,000, that present a significant challenge to the world’s quarantine procedure [11].
For doctors and the government, this is a very helpful tool to arrange the medication and medical equipment, apply precautions to the specific area and alert the people about the pandemic. It is also beneficial for other people to avoid visiting the infected area so that pandemic can be contained within the specified area and its further spread can be prevented.
The pandemic prediction system is the hot research area for experts so that the best and in-time medicine possible decision can be taken. Influenza outbreak can start anytime anywhere so the prediction of this pandemic is very essential. Tapak et al. [12] applied a Support vector machine (SVM), Artificial neural network (ANN), and Random forest (RF) time series models on the same type of datasets that our model is using but he has predicted the pandemic only for a specific country (Iran). The authors have separated data into two subsets, one is for training and the other is for testing and the selection ratio is 80% to 20%. Furthermore, they have separated this data into ascending order on a yearly and weekly basis. Then they have used a Gaussian radial basis (GRB) in SVM Model. For increasing the performance of SVM, he used the grid search method to find the optimum value. After that, they have used the ANN model for forecasting. By applying these models on 80% of training data and 20% of testing data, they have achieved the test accuracy of 86.5% and the total accuracy of SVM is 89.2%.
Bhatt et al. [13] used a feedforward and backpropagation neural network for the prediction of influenza. They have divided the data into 2 subsets for 80% and 20% ratio respectively. In the first step of this model, they used the feedforward neural network on 80% of data using only one hidden layer. After feed-forward they minimized the error and applied the same model to the remaining 20% data, to predict whether a person suffers from influenza or not. The author continued the same process in all iterations and found the best results. After that, hidden layer neuron is increased by one unit and all the process is repeated. If the previous results are better than new results, the process is stopped, otherwise, the process remains continued. They tested their model on both the synthetic and real data obtained from a major hospital by hiding the patient details. The computational time can be reduced by applying the model in small iterations,
In Tapak et al. [12] model, researchers used the data only for the specific geographical area. If we apply their model on the global dataset, the results may change and we can achieve better accuracy using a feedforward neural network. In Bhatt et al. [13] model, the algorithm gives better accuracy on less hidden neurons. The computational time is increased after increasing the number of hidden layers but its accuracy is also increased, hence we can say that accuracy is not dependent on a hidden layer. So, in the proposed model, hidden layer neurons are fixed and using the feedforward neural network, the model is trained and results are stored on the cloud to make them available globally.
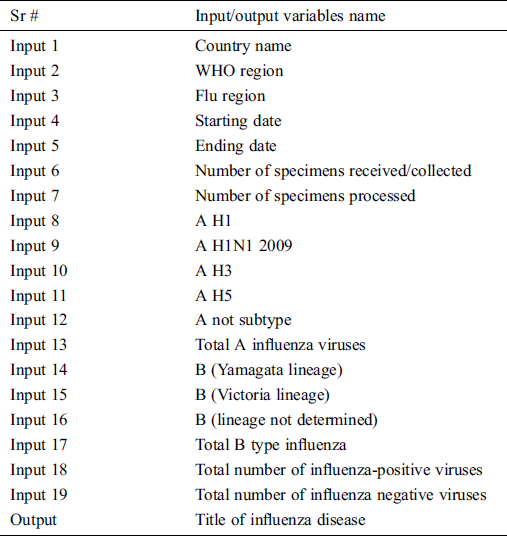
In this study, data is gathered from the World health organization (WHO) in the timespan of 19 Nov 2018 to 30 Nov 2019 [14]. After gathering data, it needs to be modified and has to be cleaned for further processing. The dataset has random values according to the WHO region-wise order so first this dataset is arranged on a yearly and weekly basis in ascending order. Then this dataset is divided according to the ratio of 85 and 15 percent. The 85% data is used for the training phase and the 15% data is used in the validation phase. The data has 19 inputs and 1 output which are shown in Tab. 1. It has five types of output i.e., sporadic, no activity of influenza, local outbreak, widespread outbreak, regional outbreak. The data has been collected from the whole world. In the period of 19th Nov 2018 to 30th Nov 2019, no widespread outbreak occurred, so by default, its values are zero. However, we cannot eliminate this output because it can occur in future and for that time it will be useful for the next pandemic situation.
Table 1: Input/output variables of the proposed MSDII-FFNN
Our research has proposed a new Modeling system for predicting the spread of the influenza infection disease using a feedforward propagation neural network (MSDII-FFNN).
The whole process consists of two phases as shown in Fig. 1. One is the training phase and the other one is the validation phase, both phases communicate to each other through a cloud.
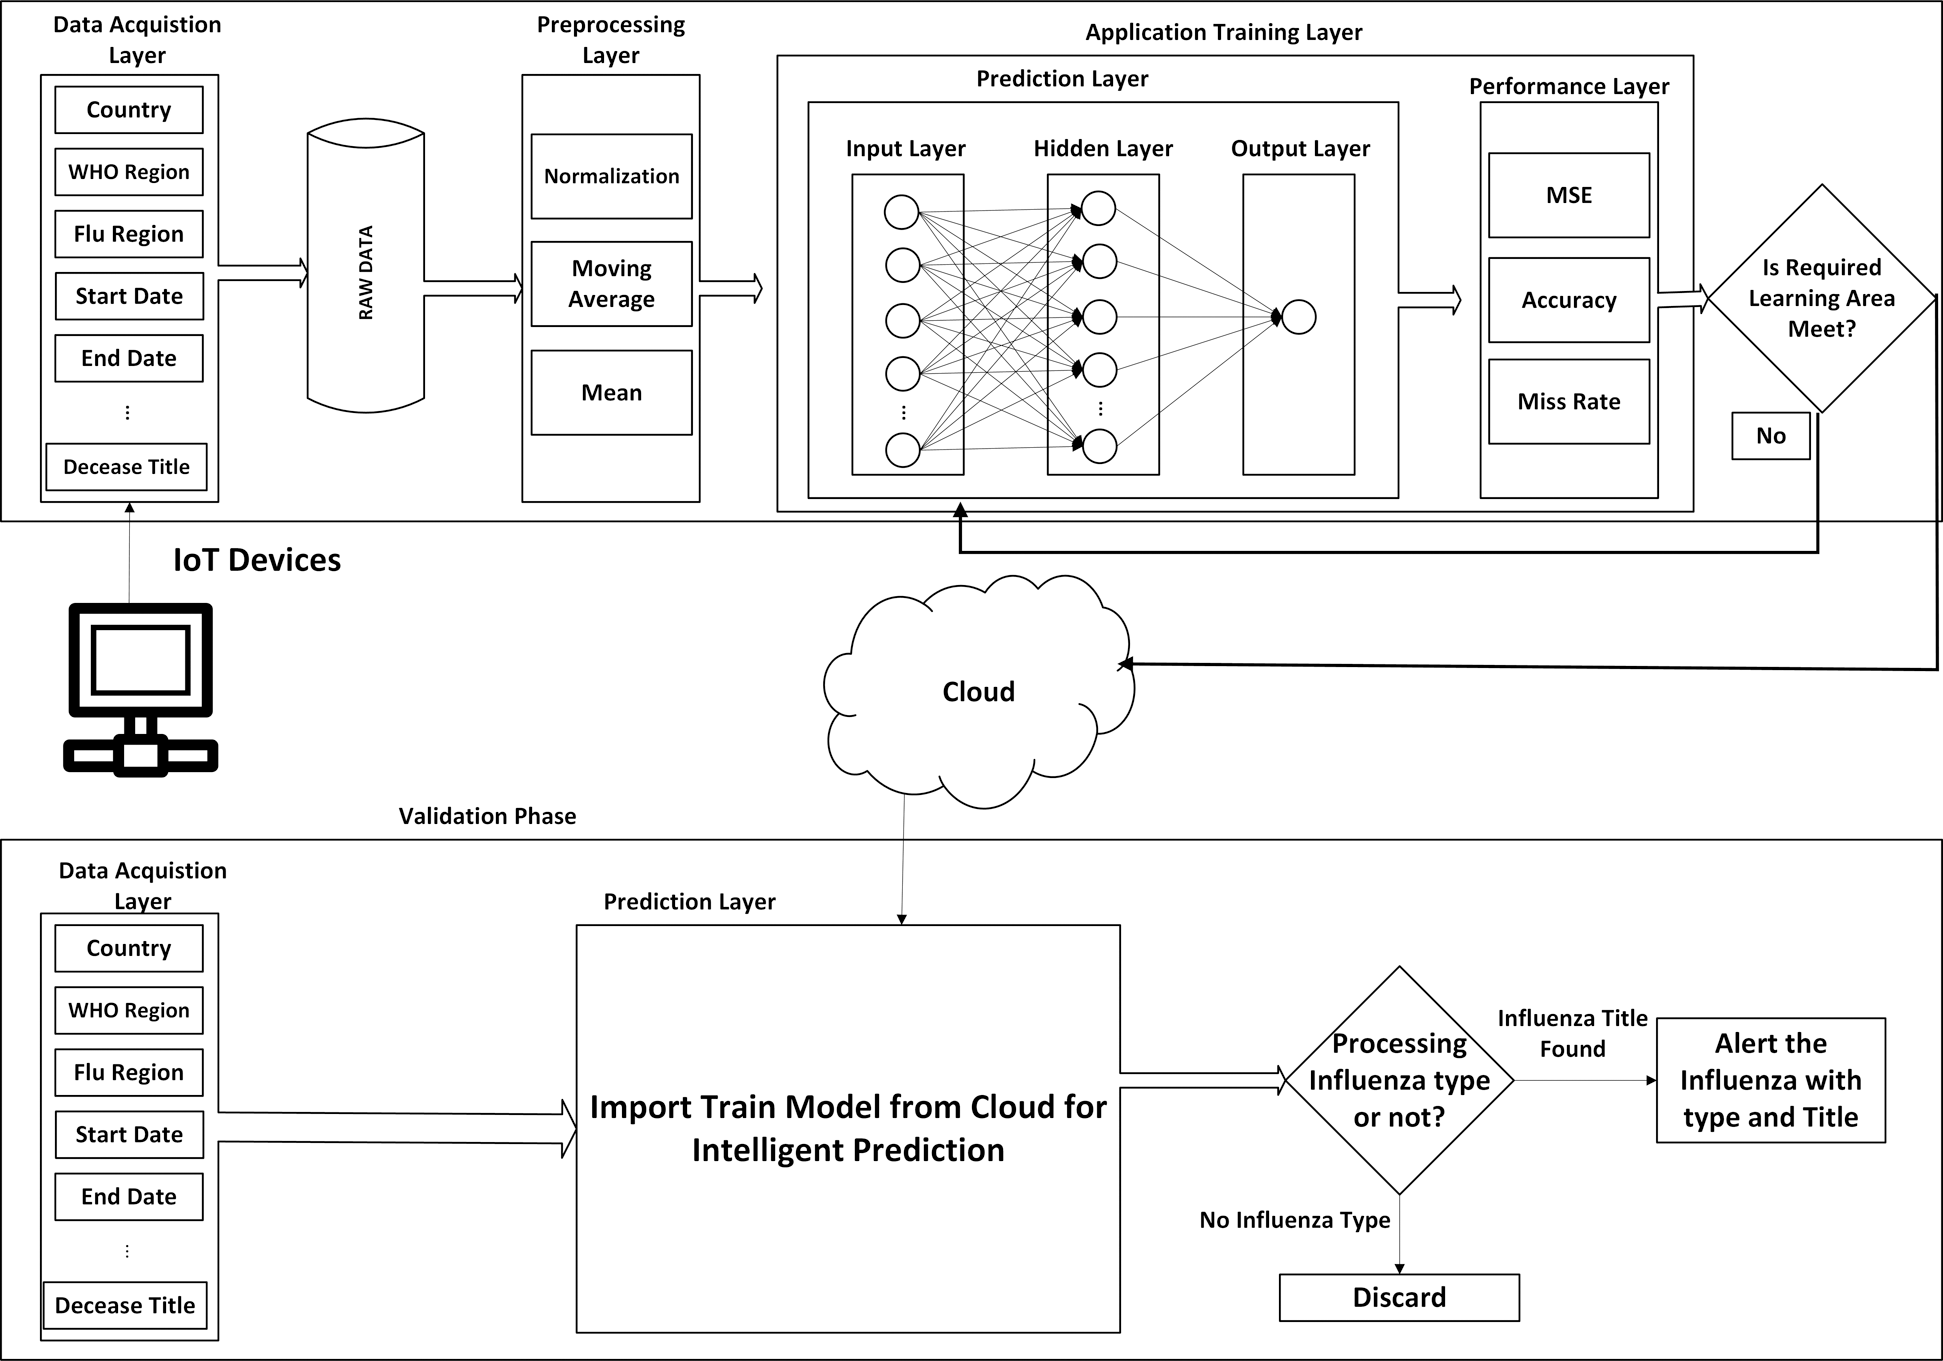
Figure 1: Proposed MSDII-FFNN system model
The training phase consists of 3 sub-layers.
1. Data acquisition layer
2. Preprocessing layer
3. Application training layer
In the acquisition layer, the data is collected from IoT enabled devices, that contain the information of countries, WHO regions, flu region, the start date of gathering data, the end date of gathering data, number of specimens received/collected, number of specimens processed, number of influenza “A” viruses detected by subtypes i.e., A H1, A H1N1 2009, A H3, A H5, number of influenza “B” viruses detected by subtypes i.e., B (Yamagata lineage), B (Victoria lineage), B (lineage not determined), total B type influenza, the total number of influenza-positive viruses, the total number of influenza negative viruses and title of influenza disease. The data is sent to the central database. The data may have some missing values so that we can call it the raw uncleaned data.
After collecting the raw uncleaned data, the preprocessing layer is activated in which we mitigate the noise and missing data using a number of methods containing the moving average method, mean method, and normalization method. The processed data is sent to the application training layer.
4.1.3 Application Training Layer
After preprocessing, the application training layer is activated, which is further divided into two sub-layers i.e., the prediction layer and the performance evaluation layer. In the prediction layer, we have used the adapted feedforward neural network. It is further divided into 3 layers which are the input layer, hidden layer, and the output layer. In the input layer, neurons are the same as in the data acquisition layer input sensors. In the hidden layer, 30 hidden neurons are used in the output layer so there is only one output as shown in Fig. 1.
To forecast the influenza infection spread, the previous data in the current system plays an important role. To predict the behavior of the neural network, the resources are dynamically allocated. The variables defined as input are enlisted in Tab. 1.
As five output neurons are sporadic, there is no activity in the local outbreak, widespread outbreak and regional outbreak. Different steps are involved in the feedforward propagation neural network. The activation function of every neuron in the hidden layer is s(x) = sigmoid(x), and the sigmoid function for input is written as shown in Eq. (1)

The hidden layer of the proposed MSDII-FFNN system using the sigmoid function is shown in Eq. (2)

Input is taken from the output layer as shown in Eq. (3)

The output layer activation function is shown in Eq. (4)

Error in feed-forward propagation is written in Eq. (5)

After that, we evaluate the performance of the prediction layer in terms of Mean squared error (MSE), accuracy, and miss rate. If required learning criteria is not met then we retrain the prediction layer. If learning criteria is met then we store the trained model on the cloud for validation purposes.
After saving the data on the cloud, the validation phase is activated which is further divided into two layers i.e., data acquisition layer and the prediction layer. In the data acquisition layer, input data is same as mentioned before. The data is sent to the prediction layer that evaluates the data and predicts the disease type and determines whether it is sporadic, local outbreak, widespread outbreak, or regional outbreak.
In the proposed research, the Machine learning (ML) algorithm has been applied to the dataset and the MATLAB tool is used for simulations. The dataset is collected from WHO [14]. In the ML approach, there were 1281 instances for training the dataset. 85% of data is used in training (1081 samples) while remaining 15% data is used for validation and testing (200 samples).
To measure the performance of the proposed MSDII-FFNN model, we used the following different statistical measures.

The total precision of the current model is calculated by the Eq. (7)

Eq. (8) represents the formula to calculate the prediction value

The specificity can be calculated by using Eq. (9)

Eq. (10) is used to calculate the sensitivity.

The false positive ratio (FPR) is calculated with Eq. (11)

Eq. (12) is used to calculated the false negative ratio

Eq. (13) is used to calculate the Likelihood ratio positive

The likelihood ratio negative can be calculated with Eq. (14)

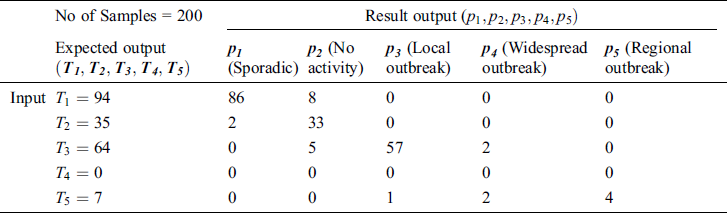
In Tab. 2, the proposed MSDII-FFNN model has predicted the spread of influenza pandemic type during the validation phase. A total of 200 samples are used in validation which are further divided into 94, 35, 64, 0 and 07 samples of sporadic ( ), no activity (
 ), local outbreak (
 ), Widespread outbreak (
 ), and regional outbreak (
 ) respectively. It clearly shows that during validation 86, 33, 57 & 4 samples are predicted correctly using the proposed model.
Table 2: Testing the accuracy of the proposed MSDII-FFNN, for the prediction of the spread of influenza pandemic type
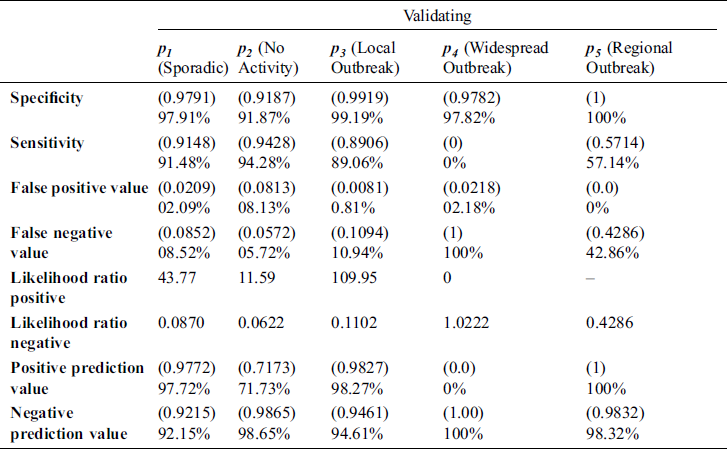
Tab. 3 shows the performance of the proposed model during validation considering different statistical parameters. It is observed that the proposed system achieves 97.91 %, 91.48 %, 2.09%, 8.52%, 43.77, 0.087, 97.72 % and 92.12 %, specificity, sensitivity, false-positive ratio, false-negative ratio, likelihood positive & negative value, and positive & negative predicted values respectively in case of Sporadic output. It is observed that in all cases such as No Activity, Local outbreak, widespread outbreak & regional outbreak, the proposed system gives more promising results according to various statistical measures.
Table 3: Different statistical measures for prediction of the influenza pandemic
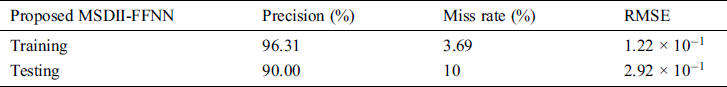
Tab. 4 shows the proposed system performance during training and testing phases in terms of precision, miss rate, and RMSE. It clearly shows that the proposed model gives 96.31%, 3.69% & 1.22 ×  accuracy, miss rate & RMSE respectively during the training phase. The proposed model gives 90.00%, 10% & 2.92 ×
  accuracy, miss rate & RMSE respectively during the validation phase.
Table 4: Performance evaluation of proposed MSDII-FFNN
In Fig. 2, the blue line represents precision while the orange line represents the miss rate. The gray line shows the specificity and while yellow color indicates the sensitivity of each pandemic’s outputs class like Sporadic (p1), No Activity (p2), Local outbreak (p3), widespread outbreak (p4) & regional outbreak (p5).
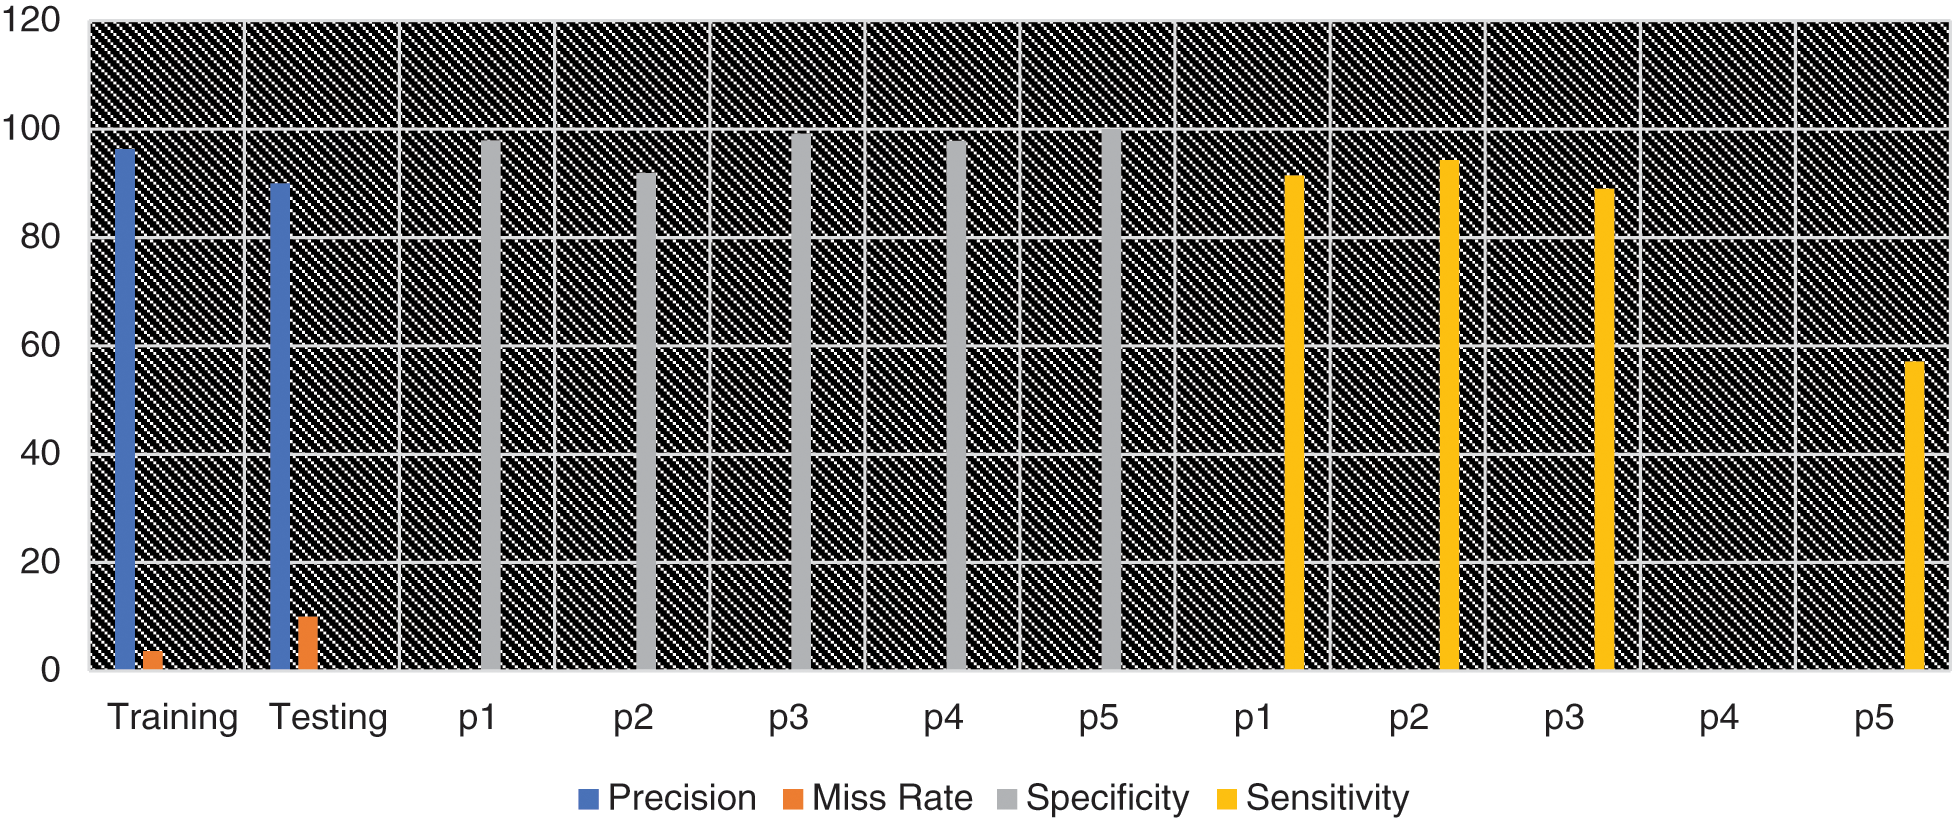
Figure 2: Graphical representation of different statistical measures for prediction of influenza pandemic using proposed MSDII-FFNN system model
Fig. 3 shows the proposed system model performance comparison with the previously published state of the art methods like SVM, RF & ANN with respect to precision & miss rate. The proposed approach with FFNN outperforms with a 90% precision rate by other prototypes like RF [12], SVM [12], and ANN [12]. It also observed that the proposed MSDII-FFNN system gives the lowest (10%) miss rate as compared to previously published approaches.
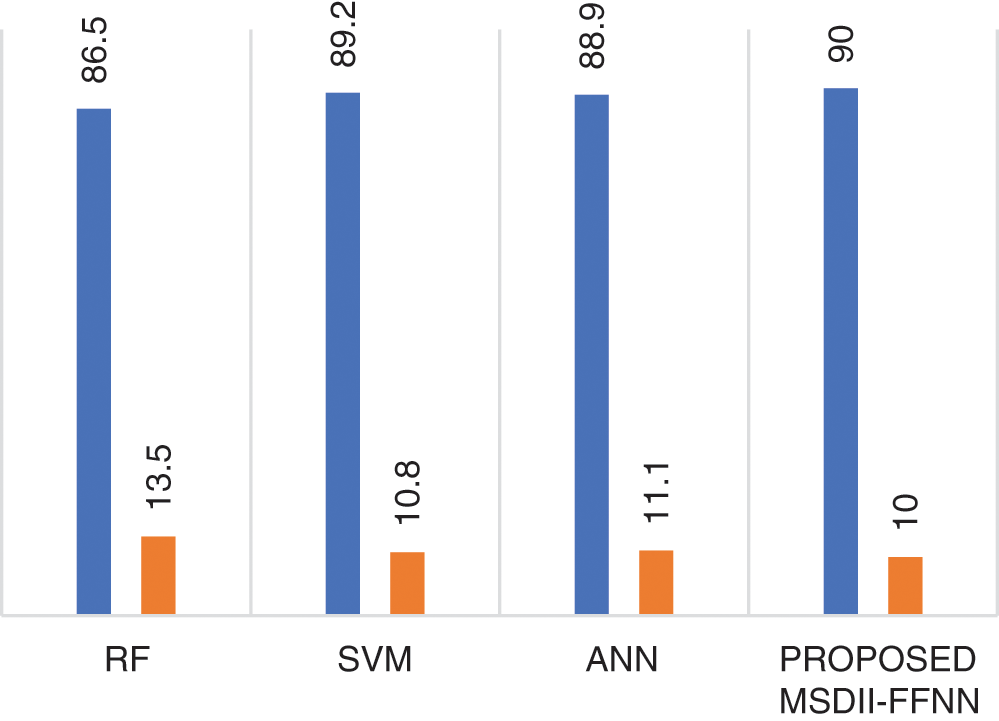
Figure 3: Comparison of the proposed MSDII-FFNN system with state-of-the-art methods
In this study, we have used the machine learning approach to forecast the spread of the deadly influenza pandemic. The influenza pandemic spread several times in 20th century [15], took one-third human lives, and have a massive impact on the world economy. The USA was one of the most affected countries from influenza. The spread was so fast that no one knew that how it became a pandemic and had such a massive impact on the world population and its economy.
In the proposed MSDII_FFNN model, the data is stored and shared using the cloud, whereas the cloud data is updated on a regular area-wide basis. The proposed model also determines which subtype of influenza may become a pandemic. This information can be used to stop the spread and control the damage in a specific area. It can also assist the government to handle the pandemic more efficiently. Simulation results have shown that the proposed MSDII-FFNN model achieves high accuracy rates of 96.31% & 90.00% during training and validation respectively that are superior in comparison to previously published approaches.
A pandemic spread can be of variable level based on environment, weather, humidity, and temperature. So, these parameters can also be used to predict influenza pandemic to achieve better performance. In future, deep extreme learning techniques will also be used to enhance the accuracy of our proposed model.
Acknowledgement: Thanks to our families & colleagues who supported us morally.
Funding Statement: This work is supported by Data and Artificial Intelligence Scientific Chair at Umm AlQura University.
Conflicts of Interest: The authors declare that they have no conflicts of interest to report regarding the present study.
1P. Spreeuwenberg, M. Kroneman and J. Paget. (2018), “Reassessing the global mortality burden of the 1918 influenza pandemic. ,” American Journal of Epidemiology, vol. 187, no. (12), pp, 2561–2567, . [Google Scholar]
2K. Su, L. Xu, G. Li, X. Ruan and X. Li et al. (2019). , “Forecasting influenza activity using self-adaptive AI model and multi-source data in Chongqing, China. ,” EBioMedicine, vol. 47, pp, 284–292, . [Google Scholar]
3D. Wellington, H. Laurenson-Schafer, A. Abdel-Haq and T. Dong. (2019), “IFITM3: How genetics influence influenza infection demographically. ,” Biomedical Journal, vol. 42, no. (1), pp, 19–26, .
4T. Lampejo, “Influenza and antiviral resistance: An overview. ,” European Journal of Clinical Microbiology & Infectious Diseases, vol. 39, pp. 1201–1208, 2020.
5Y. Cai, X. Lian, Z. Peng and W. Wang. (2019), “Spatiotemporal transmission dynamics for influenza disease in a heterogenous environment. ,” Nonlinear Analysis: Real World Applications, vol. 46, pp, 178–194, . [Google Scholar]
6J. McAuley, B. Gilbertson, S. Trifkovic, L. E. Brown and J. McKimm-Breschkin. (2019), “Influenza virus neuraminidase structure and functions. ,” Frontiers in Microbiology, vol. 10, pp, 39–45, . [Google Scholar]
7J. H. Liu, C. C. Chang, C. W. Chen, L. T. Wong and Y. W. Chu. (2019), “Conservation region finding for influenza A viruses by machine learning methods of N-linked glycosylation sites and B-cell epitopes. ,” Mathematical Biosciences, vol. 315, pp, 108217–108225, . [Google Scholar]
8S. Hassanpour, B. Baradaran, M. Hejazi, M. Hasanzadeh, A. Mokhtarzadeh et al. (2018). , “Recent trends in the rapid detection of influenza infections by bio and nano biosensor. ,” TrAC Trends in Analytical Chemistry, vol. 98, pp, 201–215, . [Google Scholar]
9X. Shen, Z. Pu, D. M. Irwin and Y. Shen. (2019), “No gene communication of ha gene between the human H3N2 and H1N1 pandemic 2009 influenza a viruses. ,” Journal of Infection, vol. 79, no. (2), pp, 174–187, . [Google Scholar]
10A. Agrawal, H. Agrawal, S. Mittal and M. Sharma. (2018), “Disease prediction using machine learning. ,” in 3rd International Conf. on Internet of Things and Connected Technologies, Jaipur, pp, 26–27, . [Google Scholar]
11C. T. Yang, Y. A. Chen, Y. W. Chan, C. L. Lee, Y. T. Tsan et al. (2020). , “Influenza-like illness prediction using a long short-term memory deep learning model with multiple open data sources. ,” Journal of Supercomputing, pp, 1–27, . [Google Scholar]
12L. Tapak, O. Hamidi, M. Fathian and M. Karami. (2019), “Comparative evaluation of time series models for predicting influenza outbreaks: Application of influenza-like illness data from sentinel sites of healthcare centers in Iran. ,” BMC Research Notes, vol. 12, no. (1), pp, 353–365, . [Google Scholar]
13D. Bhatt, D. Vyas, M. Kumhar and A. Patel. (2019), “Swine flu prediction using machine learning. ,” Information and Communication Technology for Intelligent Systems, vol. 107, pp, 611–617, . [Google Scholar]
14WHO. (2019), “Influenza virus. ,” . [Online]. Available: https://apps.who.int/flumart/Default. [Google Scholar]
15G. Neumann and Y. Kawaoka. (2019), “Predicting the next influenza pandemics. ,” Journal of Infectious Diseases, vol. 219, no. (Supplement_1), pp, S14–S20, . [Google Scholar]
 | This work is licensed under a Creative Commons Attribution 4.0 International License, which permits unrestricted use, distribution, and reproduction in any medium, provided the original work is properly cited. |