DOI:10.32604/cmc.2020.012104
| Computers, Materials & Continua DOI:10.32604/cmc.2020.012104 | |
| Article |
Prediction Model of Abutment Pressure Affected by Far-Field Hard Stratum Based on Elastic Foundation Theory
Key Laboratory of In-situ Property-Improving Mining of Ministry of Education, Taiyuan University of Technology, Taiyuan, 030024, China
*Corresponding Author: Tianhe Kang. Email: kangtainhe@163.com
Received: 15 June 2020; Accepted: 29 July 2020
Abstract: In view of the three-dimensional dynamic abutment pressure, the influence of the far-field hard stratum (FHS) in deep, thick coal seams is indeterminant. Based on elastic foundation theory, a three-dimensional dynamic prediction model of the abutment pressure was established. Using this model, the dynamic change in the coal seam abutment pressure caused by the movement of the FHS was studied, and a method for determining the dynamic change range of the abutment pressure was developed. The results of the new prediction model of the abutment pressure are slightly higher than the measured values, with an error of 0.51%, which avoids the shortcomings of the results because the Winkler foundation model results are lower than the measured values and have an error of 9.98%. As time progresses, the abutment pressure and its distribution range are affected by the FHS movement, which has the characteristics of gradually increasing dynamic change until the FHS fractures. The peak value of the abutment pressure increases linearly with time, and the influence range increases with time following a power function with an exponent of less than 1. The influence range of the FHS movement on the abutment pressure ahead of the working face, behind the working face, and along the working face is 10 times, 25 times, and 17 times the mining thickness, respectively. According to the actual geological parameters, the dynamic change range of the coal seam abutment pressure was determined by drawing an additional stress curve and by determining the threshold value. These research results are of great significance to the partition optimization of the roadway support design of deep, thick coal seams.
Keywords: Abutment pressure; far-field hard stratum; Kerr elastic foundation model; dynamic change; mechanical model; influence range
Abutment pressure is the main reason for the compression and shear failure of the rock mass around the goaf. After the coal seam is mined, the abutment pressure acts on the rock body, which causes the cracks in the rock body to expand significantly. This causes the rock surrounding the adjacent working face roadway to be greatly deformed [1]. In addition, improving the accuracy of the prediction model can improve the prediction efficiency [2–4] and reduce the probability of safety problems [5]. Therefore, the accurate prediction of the abutment pressure distribution is conducive to optimizing the roadway support method [1], to determining the coal pillar size [6–8], and to avoiding possible safety problems in the mining process.
Based on this, many scholars have carried out fruitful research. The most common method used is to establish a mechanical model based on the roof collapse angle [9] and to study the load transfer of the hard stratum (HS) to obtain the abutment pressure. He et al. [10,11] points out that the abutment pressure comes from two parts: the stress generated in the coal body by the deadweight of the overlying strata, and the stress generated in the coal body by the load of each group of rock beams transmitted through the supporting points in the overburden rock. Then, the elastic theory was used to calculate the two parts of the stress. The sum of the two parts of the stress is the abutment pressure. Zhou et al. [12–14] assumed that the HS is a beam or plate built on a Winkler elastic foundation. Based on the deflection of the hard stratum on the coal seam, the force on the underlying strata is calculated, and then the elastic theory of load propagation in a semi-infinite elastic body was used to obtain the abutment pressure distribution.
In the above studies, in the study based on the roof collapse angle, the influence of the mechanical properties of the interlayer between the HS and the coal seam was not considered, but in the study based on the Winkler foundation model, it was considered. However, there are some disadvantages to using the Winkler foundation model to predict the abutment pressure. One of which is the assumption that the roof collapse angle is 90°, which contradicts the actual situation, and the roof collapse angle has an important influence on the abutment pressure distribution [10]. The other is that the displacement and stress of the beam or plate based on the Winkler foundation model are smaller than the actual values [15]. However, the prediction of the abutment pressure distribution is based on static two-dimensional analysis, while the overburden movement is a quasi-static or dynamic process [16], and its three-dimensional distribution characteristics change with time. At present, there are few reports on abutment pressure calculation models based on three-dimensional dynamic change. Moreover, the mechanical performances of the elastic foundation directly affect the predicted results of the abutment pressure. A method of determining the mechanical parameters of the elastic foundation should be adopted, which can improve the accuracy of the prediction model and simplify the calculation process. Tests [17], numerical simulations [18–20], theoretical estimations [21–24], and combinations of methods [25,26] are commonly used to determine material performances, such as the mechanical parameters of materials.
Far-field hard stratum (FHS) is a kind of HS that is located far away from the coal seam under certain conditions, so it is more difficult for it to collapse in a short time period after mining [27]. The movement of the FHS may cause coal-rock dynamic disasters during underground coal mining [28] due to the influence of the FHS movement on the abutment pressure. However, the influence of the FHS on the dynamic change in the abutment pressure distribution is indeterminant, especially when the prediction error of the abutment pressure is large.
The goal of this study is to establish a three-dimensional dynamic abutment pressure prediction model to solve the problem of the influence of the FHS movement on the abutment pressure distribution being indeterminant. Subsequently, the dynamic evolution law of the coal seam abutment pressure is clarified, and a method to determining the distribution range of the abutment pressure is proposed. The research results clarify the abutment pressure distribution of the rocks surrounding the goaf in deep, thick coal seams, which is conducive to the reasonable selection of a support form. In the subsequent sections, first, the prediction model is introduced and validated using field data. Then, the validity of the model is validated, and the dynamic evolution law and distribution range of the abutment pressure are studied according to the model.
2 Prediction Model for Abutment Pressure Affected by FHS
2.1 The Abutment Pressure Prediction Model
(1) Thin plate hypothesis
The thickness of the thin plate to the minimum side length ratio is less than 1/5–1/8 [29]. In general, the ratio of the thickness of the FHS to its breaking distance meets this condition. That is, the FHS meets the thin plate hypothesis.
(2) Assumption of an elastic foundation
The FHS is clamped between the overlying strata and underlying strata. After the coal seam is mined, the FHS can only move downward due to the in-situ stress and mining stress. Generally, the coal seam is the weakest rock stratum resisting the downward movement of the FHS, so the coal seam and the strata between the coal seam and the FHS can be regarded as an elastic foundation, and the FHS is the thin plate on the elastic foundation.
The main mining method used for thick coal seams is the longwall top coal caving (LTCC) method [30–34]. In this method, the advancement length of the working face is far longer than the length of the working face, which provides conditions for the development of many fractures in the FHS (the fracturing of the FHS was checked using the phase-field model [35,36]). Therefore, the influence of the FHS movement from the beginning of the fracturing on the abutment pressure was studied using the prediction model. The prediction model includes the FHS mechanical model and the load transfer model.
The FHS mechanical model was established, as shown in Fig. 1. Rectangular area ABCD (S1) is the FHS, which is separated from the lower strata but is not fractured. As shown in Fig. 2, along the working face, the area outside of S1 is an elastic foundation area, which is divided into S2 and S3. Among them, S2 is the area between the coal wall and the FHS fracture line, and S3 is the area, except for S2, in the elastic foundation area.
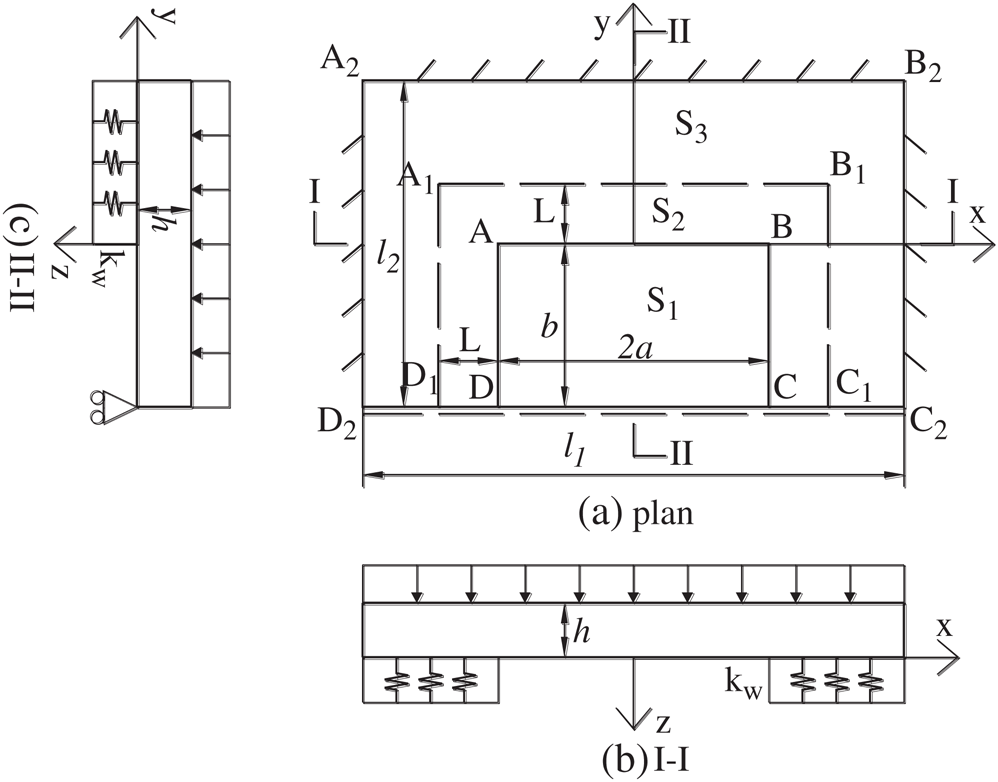
Figure 1: Mechanical model of FHS on an elastic foundation
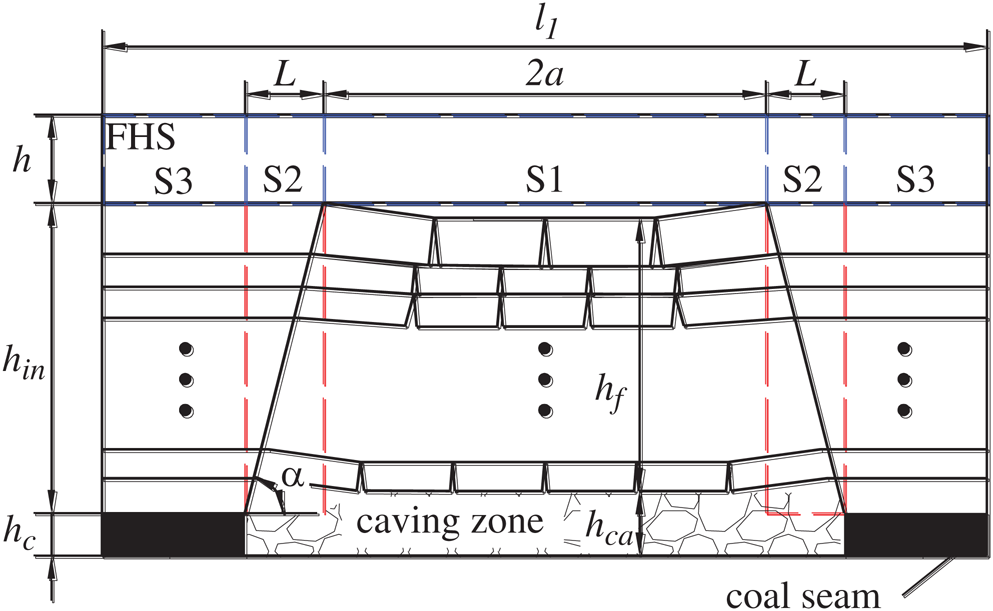
Figure 2: Section along longwall working face. Here,  is the roof collapse angle;
  is the FHS thickness;
  is the interlayer layer thickness;
  is the coal seam thickness;
  is the distance between the caving zone and the FHS;
  is the height of the caving zone
In addition to the FHS, there are many layers of HS in the strata overlying the coal seam. The HS load transfer is shown in Fig. 3. For any two adjacent HS, according to the transfer law of the load in the space, HSm+1 transfers the load to HSm, causing HSm to generate additional stress. Then, HSm transfers the load to HSm–1, causing HSm–1 to generate additional stress, that is, HSm–1 generates additional stress due to the HSm+1 load and the HSm load transfer. The HS mechanical model is similar to the FHS mechanical model.
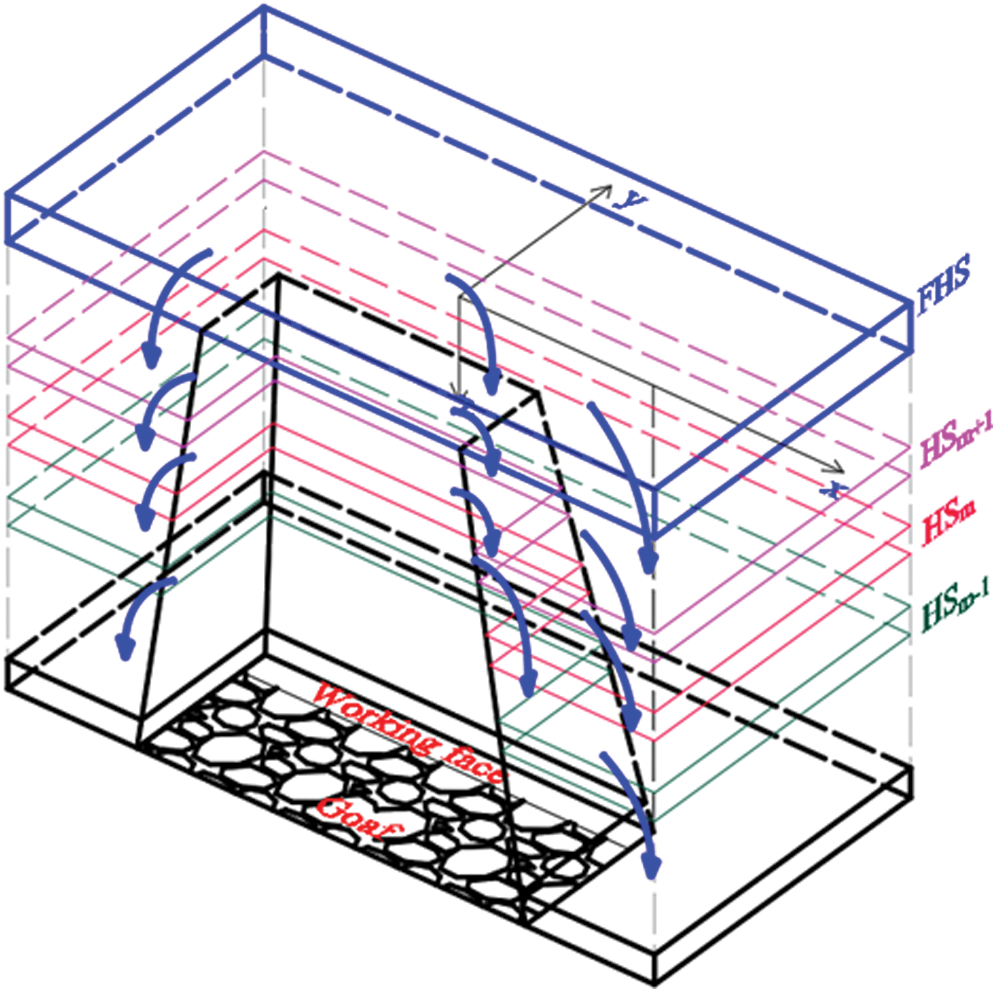
Figure 3: Load transfer model
2.2 Dynamic Displacement of the FHS Boundary
As shown in the FHS mechanical model (Fig. 1), edge AB, edge BC, and edge AD are all clamped edges, and their displacement is always 0. Therefore, the following mainly analyzes the displacement of the simply supported edge CD with time.
After the coal seam is mined out, the overlying stratum subsides until it is stable, and its movement time is from the beginning of the movement until stability. However, it is very difficult and unnecessary to obtain the complete movement track of a certain rock boundary. Therefore, selecting the spatial location of the key time nodes of the rock movement is a feasible method. The key time nodes of the FHS movement can be divided into the start of the movement, touching the gangue, before fracturing, and after fracturing.
(1) Displacement of edge CD at the beginning of the FHS movement
The movement time of the FHS lags behind the movement time of the direct roof, which also causes the change in the coal seam abutment pressure to lag. When the underlying rock layer collapses and falls behind, a separation layer appears between the FHS and the underlying rock layer, and the stress balance is broken. Therefore, it can be assumed that the time when the FHS separation layer first appears is the starting time. At this time, the FHS has just separated from the underlying rock layer, and it has not had enough time to subside, so the displacement of edge CD is 0:

(2) Displacement of edge CD when the FHS touches the rock block
After the FHS starts to move, edge CD gradually subsides. When the edge touches the goaf rock block, edge CD of the FHS changes from the friction Q of the rock block after the fracturing of the FHS to the resultant force of friction Q and the supporting force FZ of the goaf rock block, as shown in Fig. 4.
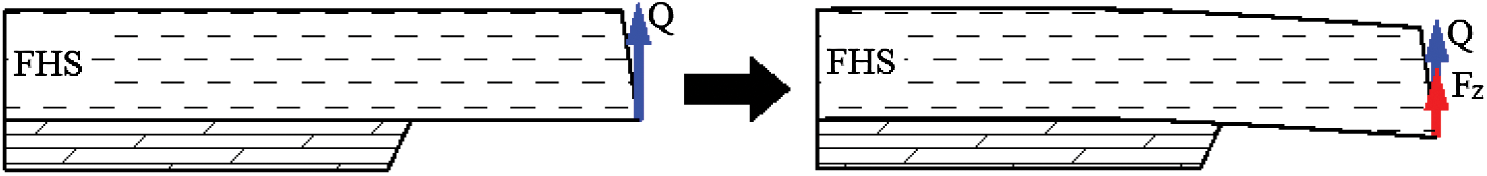
Figure 4: Stress state change of the FHS
At this time, the allowable movement distance of edge CD is the space between it and the goaf rock block, which is due to the compression effect of the gravity of the rock block between the caving zone and the FHS, resulting in the reduction of the bulking factor of the gangue in the caving zone. The length of  increases as the mining process continues, and the deflection
  increases to
  when edge CD touches the rock block. At this time, the increment of the distance between edge AB and edge CD is
  . The time from the beginning of the movement to when it touches the gangue is
  .
.
The deflection  of edge CD under a uniformly distributed load q, friction Q, and support force FZ is as follows:

 for edge CD is:

where  is the bulking factor of the gangue at time t.
Considering the quasi consolidation characteristics of the gangue [37], the relationship between the bulking factor and time under a dead load can be assumed to be

where  and
and  are constants measured in the bulking factor experiment, and
  is the time function.

The displacement of edge CD touching the goaf rock block can be obtained by solving Eq. (5) and substituting the results into Eqs. (2) and (3).
(3) Displacement of edge CD after the FHS touches the goaf rock block and before it fractures
After the FHS touches the goaf rock block, the length  increases continuously, and the load of the FHS on the underlying stratum increases continuously, which leads to the decrease of the bulking factor of the gangue in the caving zone until the FHS collapses. Based on the quasi consolidation characteristics of the gangue, its compression can be divided into three stages: Rapid compaction, slow compaction, and stable compaction. Since the FHS broken rock blocks still have a compression effect on the gangue, there are only two stages of rapid compaction and slow compaction in the gangue compression process after the FHS touches the goaf rock block and before it fractures. The change in the gangue height during these two stages is about 75%–80% of the total change in its height [38,39]. Therefore, the movement distance before the FHS fractures is

where  is the residual bulking factor, which can be obtained from bulking factor experiments.
(4) Displacement of edge CD after the FHS fractures
After the FHS fractures, the simply supported edge changes from edge CD before fracturing to edge AB after fracturing. At this time, edge AB is only affected by the friction Q, as shown in Fig. 5. Since there is displacement  before the FHS fractures, after the FHS fractures, its boundary displacement
  should be the same as that before it fractures:
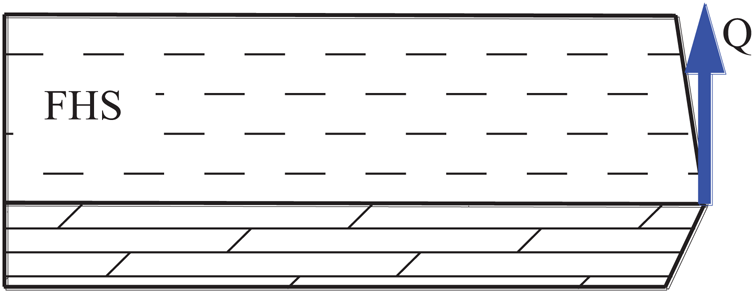
Figure 5: Stress state of edge AB after the FHS fractures

The abutment pressure of the coal seam was obtained by calculating the force that each HS exerts on the foundation using the HS mechanical model and the stress at the different positions of the coal seam according to the load transfer model.
2.3.1 Solution of the Force that the HS Exerts on the Underlying Stratum
Taking the FHS as an example, the force the FHS exerts on the foundation was obtained by solving for its deflection and foundation coefficients. The deflection was obtained using the finite difference method (FDM) to construct algebraic equations according to the deflection differential equation and the boundary conditions of the thin plate. The calculation process of any HS force acting on the underlying rock is similar to that for the FHS force acting on the underlying rock.
(1) Determination of the foundation coefficients
According to the simplified elastic space method [15], for a foundation with a thickness H, elastic modulus E, and Poisson’s ratio  , the Kerr foundation coefficients are
  ,
,  , and
, and 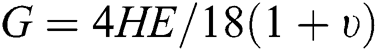 ; and the Winkler foundation coefficient is
 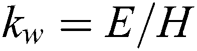 .
.
As can be seen from Fig. 2, the elastic modulus E and Poisson’s ratio  in S1, S2, and S3 are different, and the expressions for the elastic modulus E and Poisson’s ratio
  in each area are as follows:

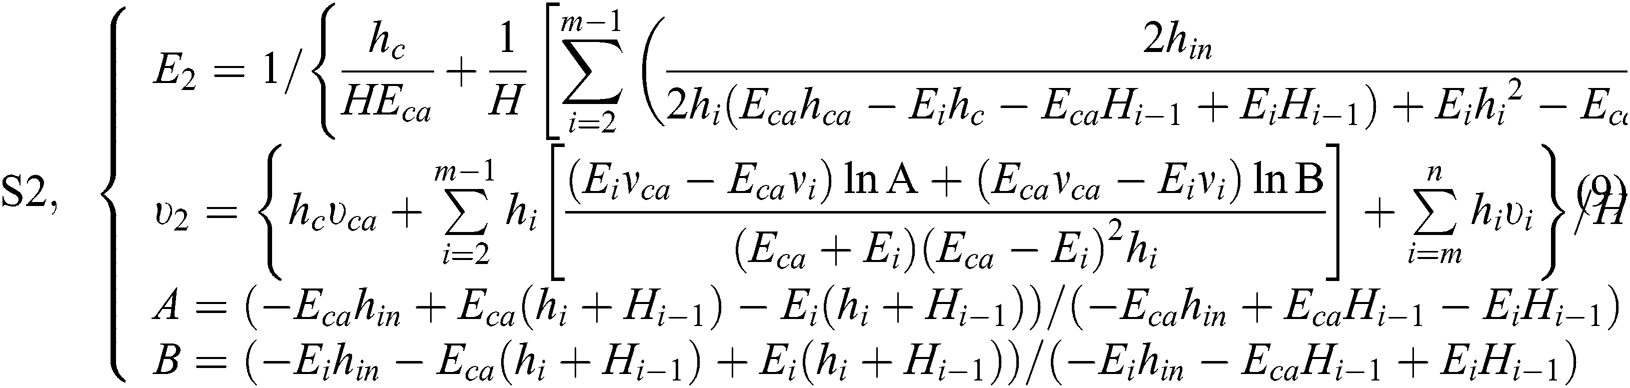
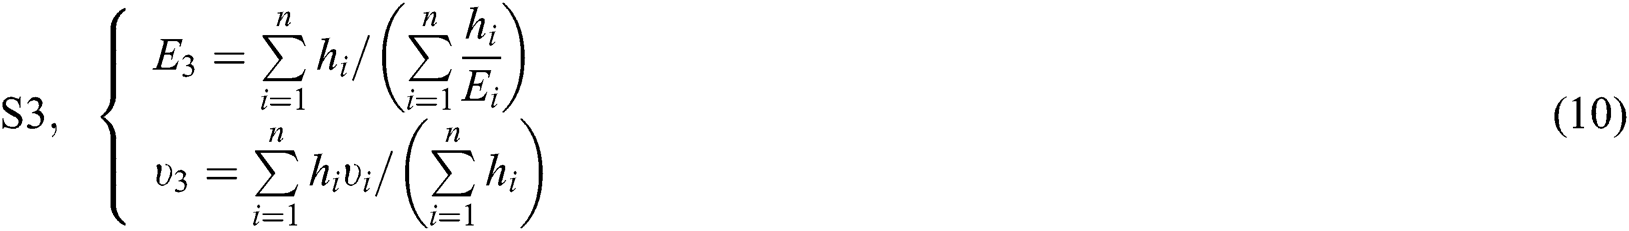
where  is the elastic modulus (GPa) of stratum i;
  is Poisson’s ratio of stratum i,
  and
and  are obtained from the rock uniaxial compression test;
  is the thickness (m) of stratum i, which is obtained from the geological data;
  is the gangue’s elastic modulus (GPa); and
  is the gangue’s Poisson’s ratio.
The elastic modulus  and Poisson’s ratio
  of the gangue in the goaf can be determined using empirical formulas [40]:


where  is time (d).
(2) Deflection differential equation of the FHS
When the Winkler elastic foundation model is used, the deflection differential equations of the FHS in S1, S2, and S3 can be summarized as follows:

where  is the deflection of the FHS in the Winkler elastic foundation model; q is the load on the FHS; and
  is the bending stiffness of the FHS,
  .
.
When the Kerr elastic foundation model is used, the deflection differential equations of the FHS in areas S1, S2, and S3 can be summarized as follows:
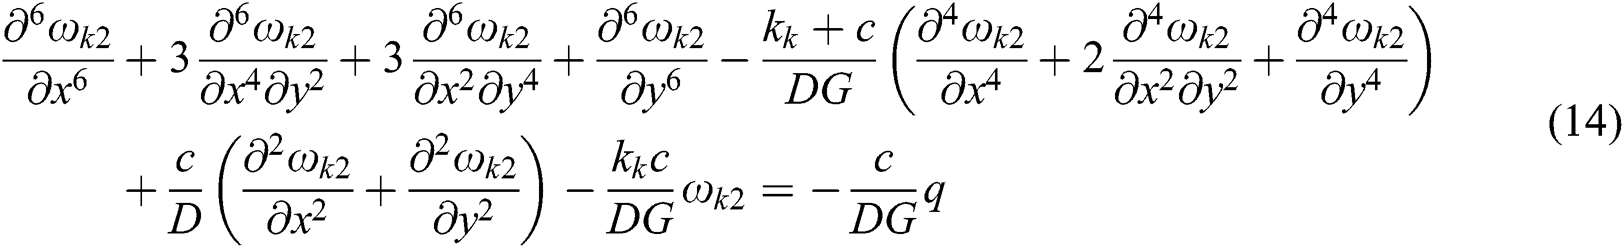

where  is the deflection of the FHS in the Kerr elastic foundation model, and
  is the deflection function of the shear layer.
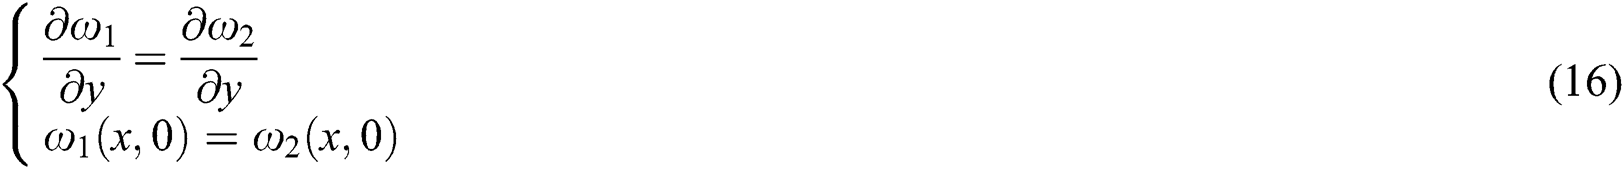
(3) Inner boundary conditions
Before the failure of the FHS, at the boundary between S1 and S2, the deflection and rotation angles are continuous. The S2 and S3 boundary conditions are similar to the S1 and S2 boundary conditions:
After the FHS breaks, the AB, BC, and AD boundaries are the existing deflections of the FHS:
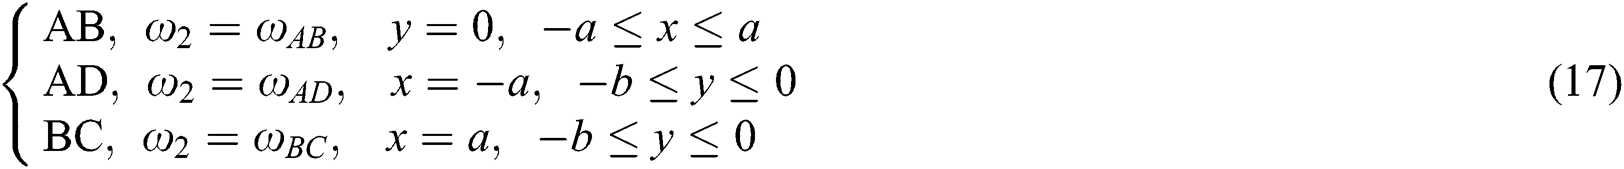
(4) Outer boundary conditions
A2B2, B2C2, and A2D2 are fixed support boundaries; the rotation angle and deflection are 0; C2D2 is a simply supported boundary; the bending moment of C2D2 is 0; and the boundary displacement at different times is obtained from Eq. (1), Eq. (3), Eq. (6), or Eq. (7):
(5) The force that the FHS exerts on the foundation
Based on the Winkler foundation model, the Kerr foundation model [41,42] adds a shear layer and a spring layer to overcome some of the disadvantages of the Winkler foundation model. Therefore, the Kerr foundation model is more accurate than the Winkler foundation model at predicting the deformation and stress of plates [15]. However, because part of the roof of the goaf is suspended, the deformation of the shear layer and the thin plate cannot be calculated at the boundary of the roof separation layer. Therefore, the calculation results of the force based on the Winkler foundation model need to be corrected. The correction coefficient  is the ratio of the force on the homogeneous foundation calculated by the Kerr foundation model to that of the Winkler foundation model. The force that the FHS exerts on underlying strata is

where  ,
,  and
and  are the deflection of the thin plates and the shear layer in the Kerr foundation model, and the deflection of the thin plates in the Winkler foundation model for a homogeneous foundation, respectively.
2.3.2 Solution of the Coal Seam Abutment Pressure
Because the force of the HS acting on the underlying strata is not evenly distributed, the equivalent-load method was used to divide the force into several small areas and to synthesize the force on them into a small concentrated force. When several concentrated forces act on the foundation, by applying the superposition principle, the additional stress at any position is

When the coal seam is not excavated, it is already in the in-situ stress field. According to the load transfer model shown in Fig. 3, the coal seam abutment pressure  is
is

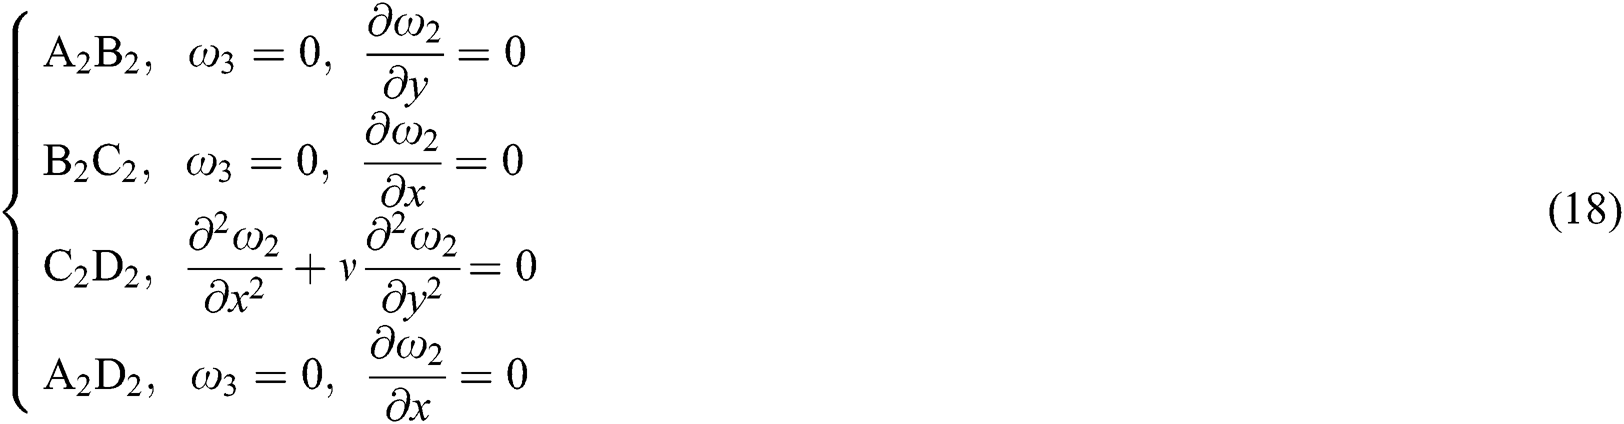
The field measured abutment pressure data are from the 14201 working face and the 14202 tailgate of Majialiang mine [43]. According to the geological and mining parameters for the Majialiang mine [43–45], the elastic foundation parameters of each HS were calculated as shown in Tab. 1.
Table 1: The elastic foundation parameters of each HS (Majialiang mine)
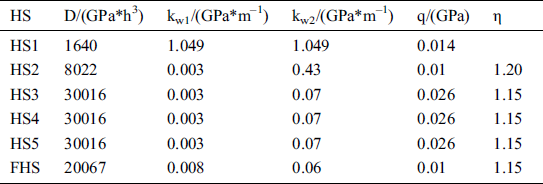
According to the abutment pressure prediction model, the influences of the distance between each HS and the coal seam and the roof collapse angle were fully considered, and the forces of each HS on the underlying strata were calculated when they were fracturing. The curve of the HS1 abutment pressure and the comparison between the new prediction model, the traditional prediction model, and the field measurements of the abutment pressure is shown in Fig. 6.
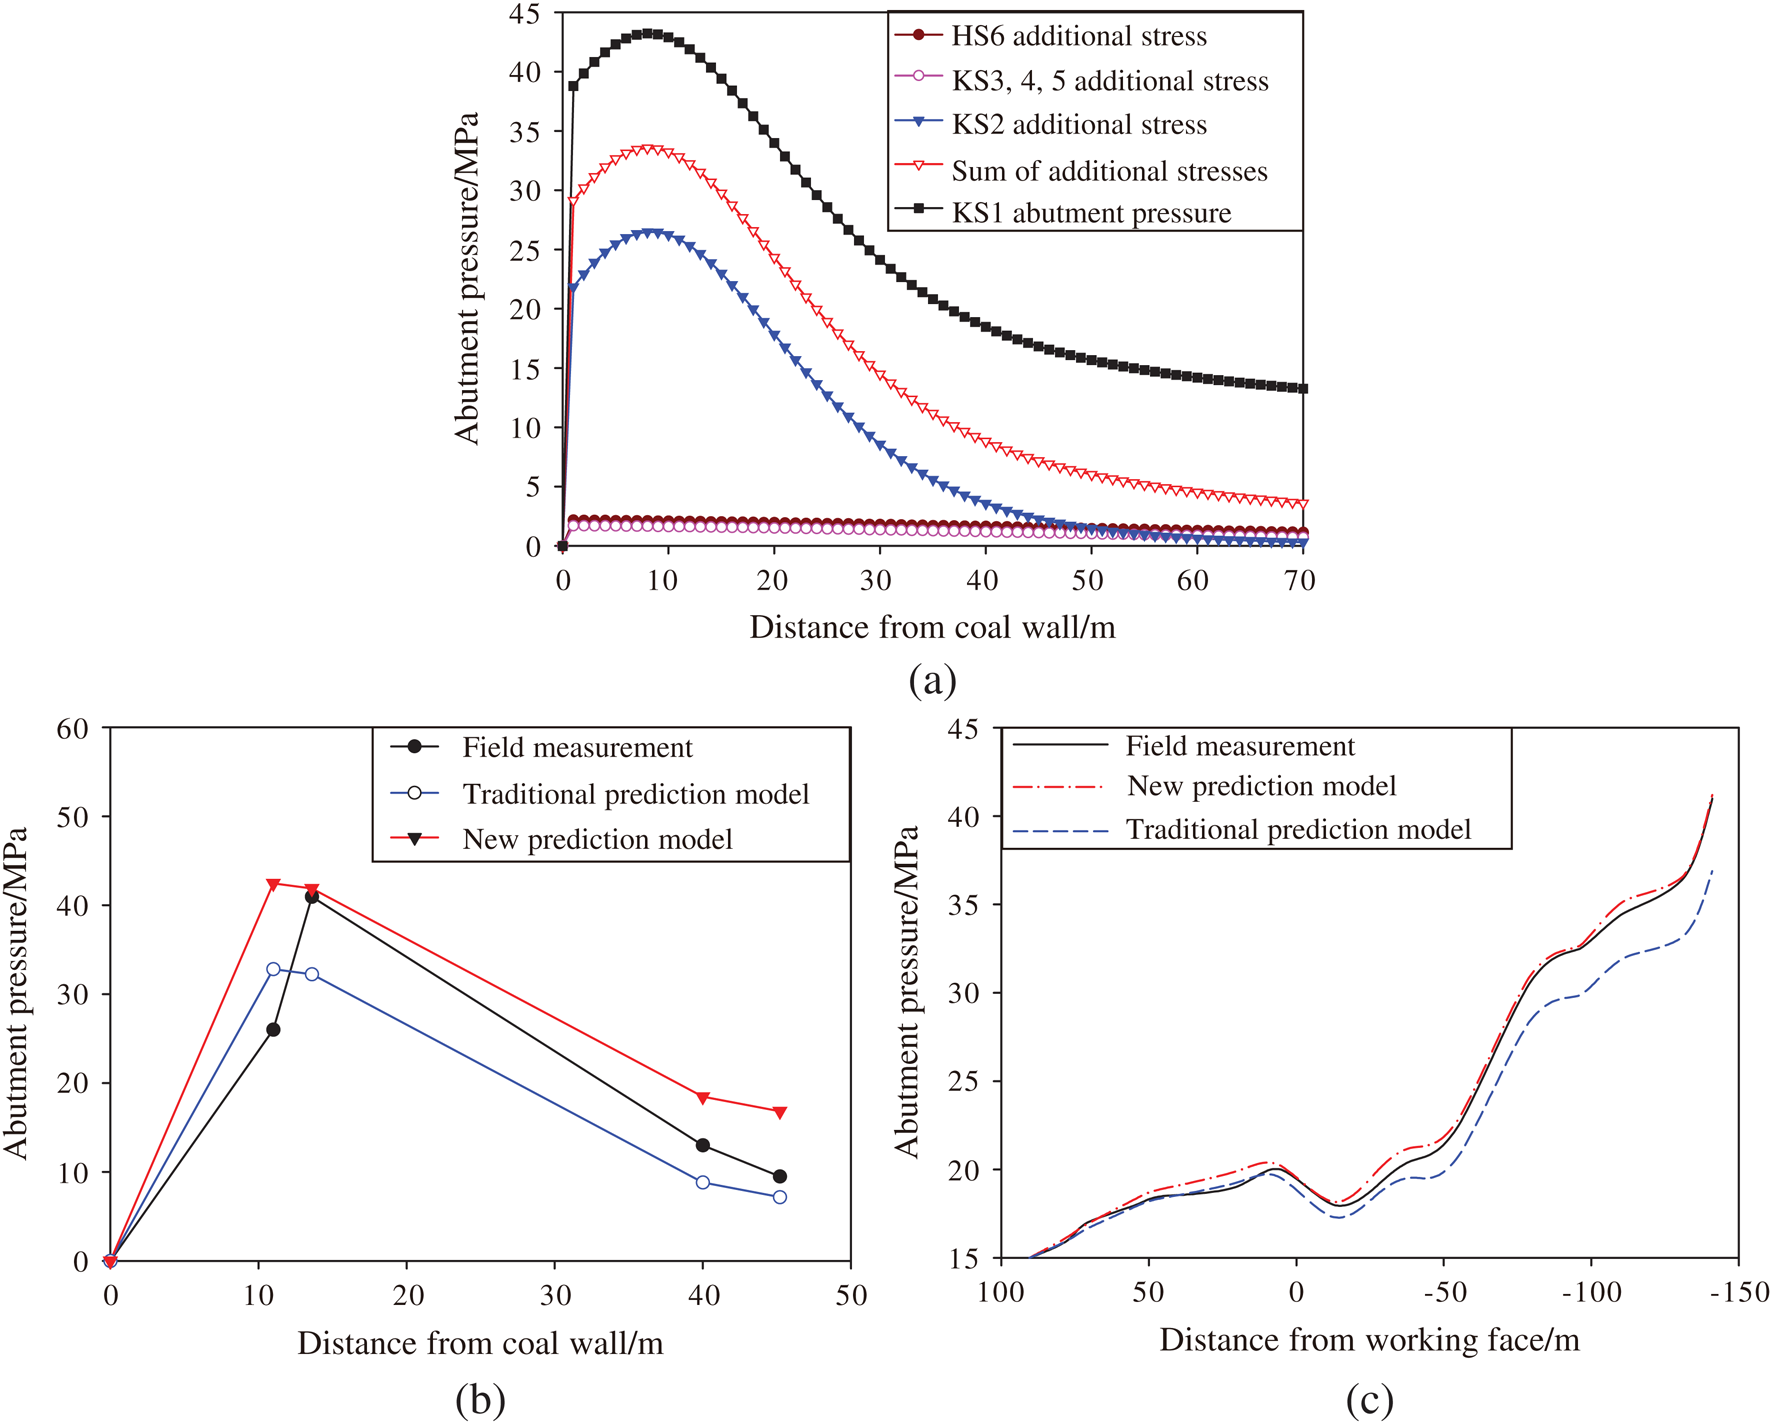
Figure 6: Abutment pressure curve: (a) Additional stress on each HS along the working face (141 m behind the working face); (b) Abutment pressure comparison along the working face (141 m behind the working face); and (c) Abutment pressure comparison along the advancement direction of the working face (13.6 m away from the coal wall)
As can be seen from Fig. 6a, the concentration coefficient of the abutment pressure was determined for the HS close to the coal seam, and the distribution range of the abutment pressure was determined for the HS far away from the coal seam, which is consistent with the conclusion of He et al. [10]. The reason for this is that the near-field hard stratum (NHS) is close to the coal seam, and the fracture distance is short. According to Eq. (20), when the distance between the HS and the coal seam is smaller, the additional stress on the coal seam is larger. The FHS is far away from the coal seam, so the additional stress on the coal seam is small. In addition, the NHS has a short breaking distance, and when the size of the finite difference mesh is the same, the upper limit of the summation in Eq. (20) is small, and the NHS has a limited influence on the abutment pressure distribution. The FHS has a long broken length, so it is the large upper limit of the summation in Eq. (20). In other words, the FHS has a larger compression range than the NHS for the underlying strata, which leads to a slow attenuation of the additional stress on the coal seam and a larger influenced range.
As can be seen from Fig. 6b, at a distance of 13.6 m from the coal wall, the abutment pressure calculated using the new prediction model is 41.19 MPa, with an error of 0.51% compared to the measured abutment pressure of 40.98 MPa. The result obtained using the Winkler foundation model was only 36.89 MPa, resulting in an error of 9.98%. The peak value of the abutment pressure is an important index for the design of the working face and the roadway support system [16,45]. Compared with the results of the traditional model, the peak value of the abutment pressure predicted using the proposed model is consistent with the measured value. Moreover, except for the large error between the predicted peak value and the measured value, the abutment pressure predicted by the traditional model is generally less than the measured value. When the working face and roadway support are designed based on this prediction curve, the safety requirements of the support design cannot be met, resulting in safety accidents in the coal mine production process, which has a significant negative impact on personnel safety and the social economy. However, the abutment pressure curve predicted using the proposed model is close to the measured curve and is larger than the measured value overall, so it can meet the safety requirements of the support design.
As can be seen from Fig. 6c, when the measuring point is ahead of the working face, the results of the two prediction models are consistent and close to the measured values. However, when the measuring point is more than 80 m behind the working face, as the distance from the working face increases, the error between the prediction value of the traditional model and the measured value gradually increases, while the proposed model has a high coincidence with the measured abutment pressure curve. This is because as the working face advances, each simply supported HS boundary continuously subsides until it fractures. The product of HS and 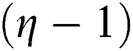 increases as the force the HS exerts on the underlying strata increases (especially considering the FHS movement). As a result, the error between the predicted abutment pressure of the traditional model and the measured value becomes larger and larger. Therefore, it is necessary to consider the introduction of the correction coefficient
  in the proposed model.
Based on the above-described evidence, the prediction model proposed in this paper can effectively predict the abutment pressure on the goaf rock surrounding deep, thick coal seams, and the predicted abutment pressure meets the safety requirements of the support design.
4 The Influence of FHS Movement on the Dynamic Changes in the Coal Seam Abutment Pressure and the Determination of Its Range
4.1 Dynamic Evolution Law of the Coal Seam Abutment Pressure Affected by FHS Movement
It is necessary to define the movement process of the FHS to determine how the dynamic evolution of coal seam abutment pressure is affected by FHS. The movement process of the FHS is the change in the foundation’s reaction at different times when the FHS is clamped between the overlying strata and the underlying strata. Using Eqs. (1)–(7), the FHS boundary displacement changes at different times were obtained, and then a contour map of the FHS foundation reaction from the beginning of the movement to the end of fracturing was drawn using the MATLAB software, as shown in Fig. 7.
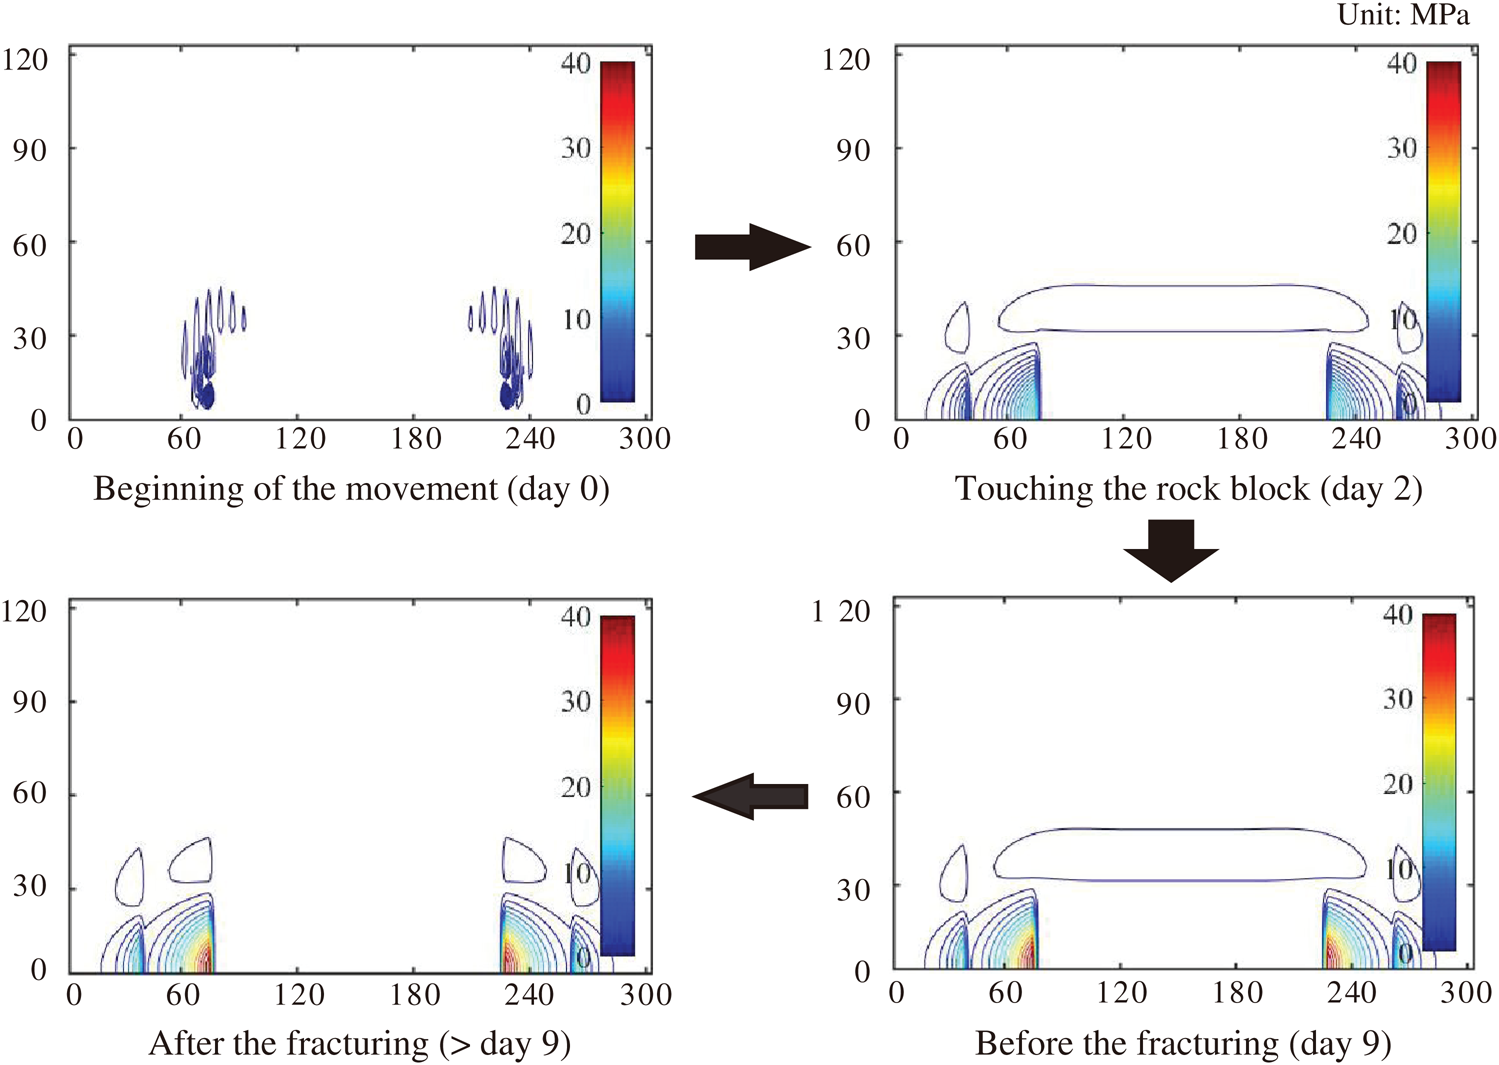
Figure 7: Contour map of the FHS foundation’s reactions at different times
As can be seen from Fig. 7, the foundation reaction was 0 at the beginning of the FHS movement. When the FHS touches the rock block, the area of the foundation reaction increased. The width of the area increased by about 120 m along the working face, and it increased by about 50 m along the advancement direction of the working face. During the time between touching the rock block before the fracturing begins, the area remained unchanged, but the foundation reaction gradually increased. After the fracturing of the FHS, the area of the foundation reaction decreased, but the maximum value of the foundation reaction remained unchanged.
The contour map of the foundation reaction at different times during the FHS movement shows that the following. As time progresses, the simple boundary of the FHS gradually subsides, which causes the stress balance between the FHS and the underlying strata to be broken, and the range of the unbalanced force (i.e., the force on the underlying strata) increases rapidly, which remains unchanged when the FHS is touching the rock block. However, the unbalanced force increases slowly, resulting in the stress on the underlying strata to be in a state of dynamic change until the FHS fractures. The response of the underlying strata to the unbalanced force is to continually adjust its internal elastic-plastic area to adjust the stress balance. In particular, the strength of the coal body in the underlying strata is low. When the coal body changes from elastic deformation to plastic deformation, plastic expansion will occur, resulting in the displacement of the coal wall.
In summary, the FHS force on the underlying stratum increases with the advancement of the working face until it reaches the maximum value when the FHS breaks. According to the load transfer model, the FHS movement continuously affects the abutment pressure of the coal seam until the FHS fractures. However, it is not clear how the FHS affects the dynamic change of the coal seam’s abutment pressure. Therefore, at a distance of 0.5 m from the coal wall of the goaf and 141 m behind the working face, the additional stress on the coal seam along the advancement direction of the working face and along the working face from the beginning of the movement to its fracturing was calculated and plotted in Figs. 8 and 9, respectively.
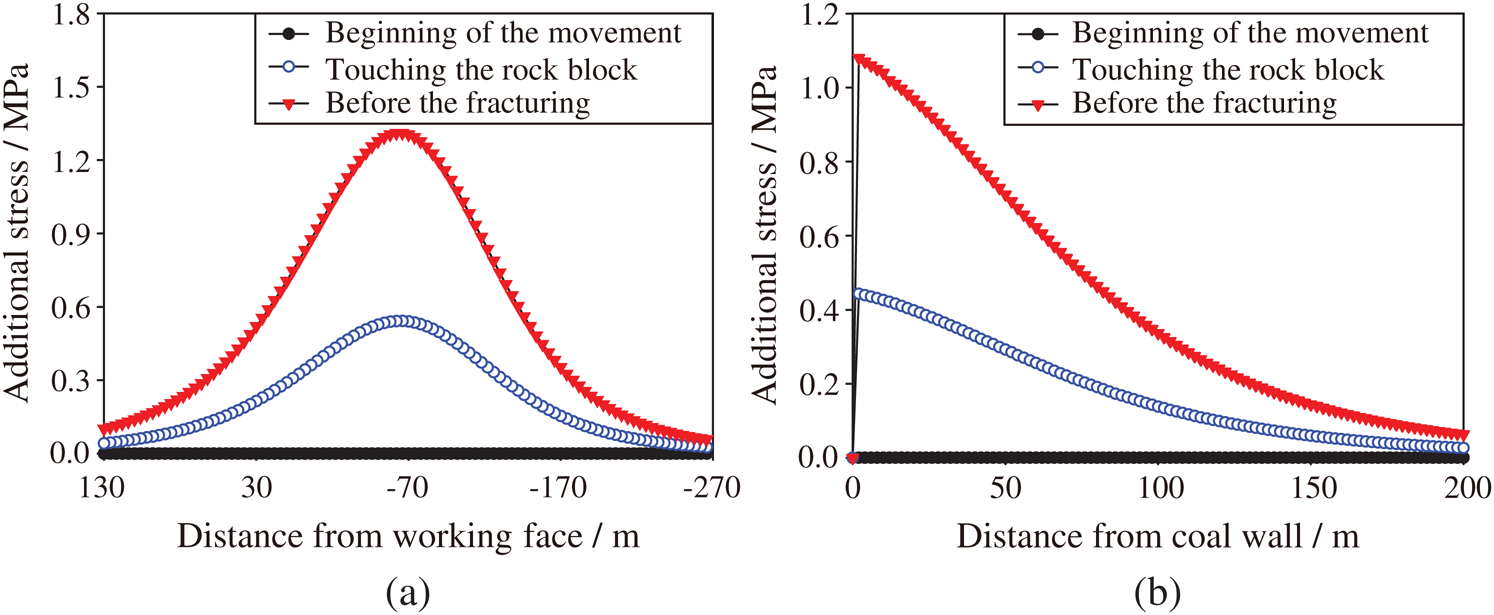
Figure 8: Additional stress on the coal seam caused by the FHS movement at different times from the proposed model: (a) Along the advancement direction of the working face; and (b) Along the working face
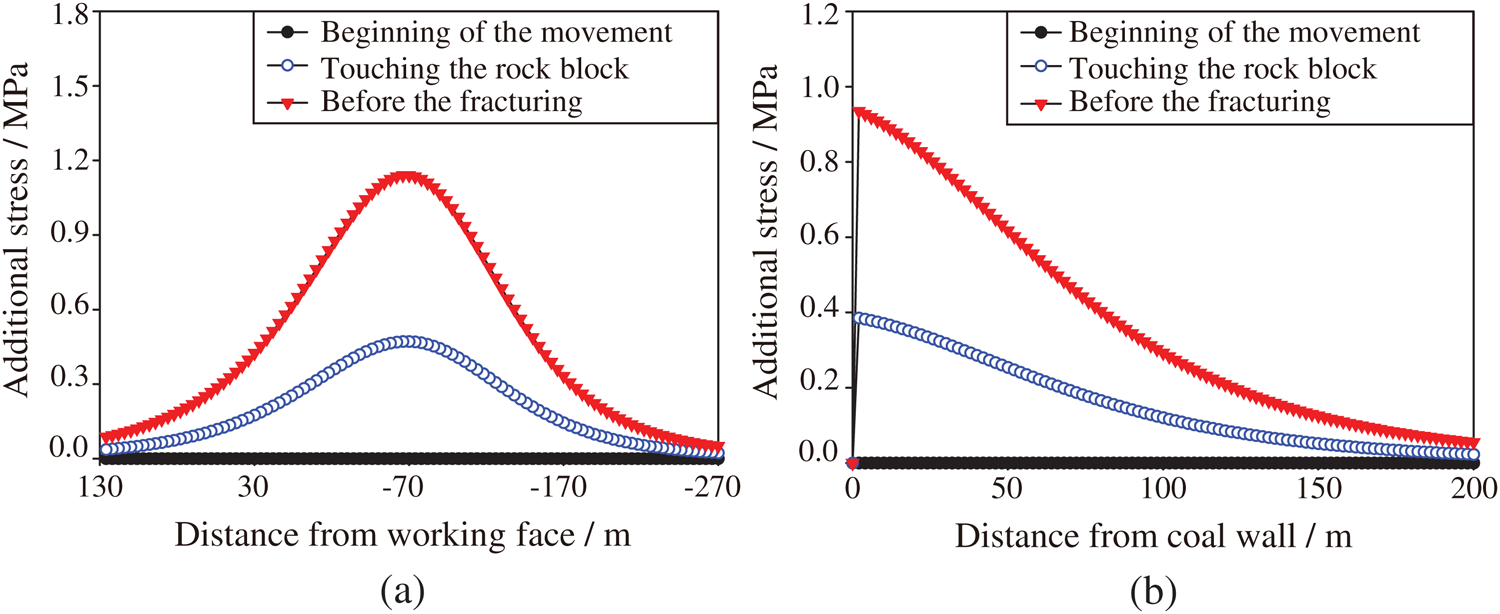
Figure 9: Additional stress on the coal seam caused by the FHS movement at different times from the traditional model: (a) Along the advancement direction of the working face; and (b) Along the working face
As can be seen from Figs. 8 and 9, over time, the movement of the FHS increases the additional stress and its range on the coal seam, that is, the abutment pressure on the coal seam exhibits a dynamic change characteristic. When the FHS starts to move, the additional stress on the coal seam is 0. When the FHS touches the rock block, the predicted results of the proposed model show that the stress begins to increase at 54 m ahead of the working face, and it is stable at 210 m behind the working face, with a maximum stress of 0.542 MPa. The stress is stable at 118 m away from the coal wall, with a maximum stress of 0.44 MPa. The results of the traditional model are 46 m, 202 m, 0.471 MPa and 110 m, 0.385 MPa, respectively. When the FHS breaks, the coal seam stress reaches the maximum value. The predicted results of the proposed model show that the stress begins to increase at 98 m ahead of the working face, and it is stable at 250 m behind the working face, with a maximum stress of 1.311 MPa. The stress is stable at 170 m away from the coal wall, with a maximum stress of 1.08 MPa. The results of the traditional model are 90 m, 242 m, 1.14 MPa and 162 m, 0.94 MPa, respectively.
In summary, over time, the FHS continues to subside until it breaks, which causes the coal seam abutment pressure and its influence range to increase. The influence range of the FHS movement of the coal seam’s abutment pressure ahead of the working face is more than 10 times that of the thickness of the coal seam, the influence range of that behind the working face is more than 25 times, and the influence range of the lateral abutment pressure is more than 17 times. Thus, the influence of the FHS movement on the abutment pressure distribution along the advancement direction of the working face is greater than that along the working face. Both along the advancement direction of the working face and along the working face, the peak value of the stress increases linearly with time, and the influence range increases with time following a power function with an exponent of less than 1. The predicted results of the traditional model for the influence range and maximum stress of the abutment pressure are lower than those of the proposed model by about 5%–7% and 13%, respectively.
4.2 Influence Range of the FHS Movement on the Coal Seam Abutment Pressure
As can be seen from the above section, the FHS movement plays a decisive role in the dynamic change characteristics of the coal seam abutment pressure, and this change is mainly manifested as the change in the additional stress. Regardless of how the coal seam abutment pressure changes, the distribution of the additional stress can be summarized as a curve that increases initially and then decreases. When the additional stress is 0, the corresponding distance from the working face is the influence range of the FHS movement on the abutment pressure along the advancement direction of the working face, and the corresponding distance from the coal wall is the influence range along the working face. Under actual geological and mining conditions, the abutment pressure prediction model can be used to draw the additional stress curve of the coal seam at different times during the FHS movement. Given the threshold value of the additional stress judgment, the influenced range of the FHS movement on the coal seam abutment pressure at different times can be determined based on the corresponding range of the additional stress curve.
In this paper, we proposed a three-dimensional dynamic abutment pressure prediction model, which clarifies the dynamic evolution of the abutment pressure affected by the FHS movement. It can also be used to determine the influences range of the FHS movement. The calculation results of the Kerr elastic foundation were used to modify the Winkler elastic foundation results, and the abutment pressure prediction model was established by combining the FHS structure and the bearing characteristics. Using the model, the dynamic evolution of the abutment pressure and the determination method of its distribution range were obtained. The results of this study are as follows.
1.The prediction results of the model were obtained and compared with the field data. The results show that the error in the peak abutment pressure predicted by the new model is 0.51%, and the predicted value is slightly larger than the measured value, so it meets the safety requirements of the working face and the roadway support design based on the abutment pressure.
2.The FHS movement causes the peak value and the distribution range of the abutment pressure to increase linearly and as a power function with an exponent of less than 1 with time until the FHS fractures.
3.The influence range of the FHS movement on the abutment pressure ahead of the working face, behind the working face, and along the working face is 10 times, 25 times, and 17 times the mining thickness, respectively.
4.Under actual geological and mining conditions, the abutment pressure distribution range was obtained by drawing the additional stress curve of the coal seam affected by the FHS movement and combining it with the threshold value.
In the future, we intend to apply the prediction model results to the optimization of roadway support designs in deep, thick coal seam mining. For example, according to the variation in the abutment pressure’s distribution range with time, the roadway support’s form can be designed in different sections.
Acknowledgement: We would like to give our sincere thanks to the editors and anonymous reviewers for their constructive opinions and comments. This work was funded by the National Natural Science Foundation of China [U1810102]. We thank LetPub (www.letpub.com) for its linguistic assistance during the preparation of this manuscript.
Funding Statement: This work was supported by the National Natural Science Foundation of China [Grant No. U1810102].
Conflicts of Interest: The authors declare that they have no conflicts of interest to report regarding the present study.
References
1R. Gao, B. Yu and X. B. Meng. (2019), “Stress distribution and surrounding rock control of mining near to the overlying coal pillar in the working face. ,” International Journal of Mining Science and Technology, vol. 29, no. (6), pp, 881–887, .
2Y. Song, Y. Zeng, X. Y. Li, B. Y. Cai and G. B. Yang. (2017), “Fast CU size decision and mode decision algorithm for intra prediction in HEVC. ,” Multimedia Tools and Applications, vol. 76, no. (2), pp, 2001–2017, . [Google Scholar]
3Y. Song, W. Cao, Y. F. Shen and G. B. Yang. (2015), “Compressed sensing image reconstruction using intra prediction. ,” Neurocomputing, vol. 151, pp, 1171–1179, .
4J. J. Ren, S. Zhao, J. D. Sun, D. Li, S. Wang et al.. (2018). , “PPP: Prefix-based popularity prediction for efficient content caching in content-centric networks. ,” Computer Systems Science and Engineering, vol. 33, no. (4), pp, 259–265, . [Google Scholar]
5Z. Q. Xia, Z. Z. Hu and J. P. Luo. (2017), “UPTP vehicle trajectory prediction based on user preference under complexity environment. ,” Wireless Personal Communications, vol. 97, no. (3), pp, 4651–4665, . [Google Scholar]
6L. Q. Shi, Y. Wang, M. Qiu, L. Han and Y. P. Zhao. (2019), “Research on the required width of a fault waterproof coal pillar based on underground pressure control theory. ,” Arabian Journal of Geosciences, vol. 12, no. (15), pp, 480, . [Google Scholar]
7J. Li, X. B. Qiang, W. S. Wang and F. Wang. (2019), “Distribution law of principal stress difference of deep surrounding rock of gob-side entry and optimum design of coal pillar width. ,” Tehnicki Vjesnik-Technical Gazette, vol. 26, no. (6), pp, 1743–1752, .
8W. R. He, F. L. He and Y. Q. Zhao. (2020), “Field and simulation study of the rational coal pillar width in extra-thick coal seams. ,” Energy Science and Engineering, vol. 8, no. (3), pp, 627–646, . [Google Scholar]
9A. K. Singh, R. Singh, J. Maiti, R. Kumar and P. K. Mandal. (2011), “Assessment of mining induced stress development over coal pillars during depillaring. ,” International Journal of Rock Mechanics and Mining Sciences, vol. 48, no. (5), pp, 805–818, . [Google Scholar]
10T. He, Z. Z. Huang, C. R. Li, F. Luo and D. P. Wang. (2018), “Temporal and spatial evolution characteristics of lateral coal stress in fully mechanized top coal caving mining working face in ultra-thick coal seam. ,” Journal of Mining and Safety Engineering, vol. 35, no. (1), pp, 100–105, . [Google Scholar]
11S. T. Zhu, Y. Feng and F. X. Jiang. (2016), “Determination of abutment pressure in coal mines with extremely thick alluvium stratum: A typical kind of rockburst mines in China. ,” Rock Mechanics and Rock Engineering, vol. 49, no. (5), pp, 1943–1952, . [Google Scholar]
12Y. J. Zhou, M. P. Li, X. D. Xu and M. Li. (2019), “A study on dual-load-zone model of overlying strata and evolution law of mining stress. ,” Computers, Materials and Continua, vol. 58, no. (2), pp, 391–407, . [Google Scholar]
13H. K. Han, J. L. Xu, X. Z. Wang, J. L. Xie and Y. T. Xing. (2019), “Method to calculate working surface abutment pressure based on key strata theory. ,” Advances in Civil Engineering, vol. 2019, 7678327, .
14H. Y. Pan, S. G. Li, T. W. Zhang and H. F. Lin. (2012), “Composite key stratum module of Winkler foundation and its mechanical properties. ,” Journal of Central South University (Science and Technology), vol. 43, no. (10), pp, 4050–4056, . [Google Scholar]
15X. Huang, H. W. Huang and D. M. Zhang. (2012), “Longitudinal deflection of existing shield tunnels due to deep excavation. ,” Chinese Journal of Geotechnical Engineering, vol. 34, no. (7), pp, 1241–1249, . [Google Scholar]
16J. H. Liu, F. X. Jiang and S. T. Zhu. (2015), “Study of dynamic and static abutment pressure around longwall face and its application. ,” Chinese Journal of Rock Mechanics and Engineering, vol. 34, no. (9), pp, 1815–1827, . [Google Scholar]
17A. Shishegaran, F. Daneshpajoh, H. Taghavizade and S. Mirvalad. (2020), “Developing conductive concrete containing wire rope and steel powder wastes for route deicing. ,” Construction and Building Materials, vol. 232, 117184, . [Google Scholar]
18A. Shishegaran, M. R. Khalili, B. Karami, T. Rabczuk and A. Shishegaran. (2020), “Computational predictions for estimating the maximum deflection of reinforced concrete panels subjected to the blast load. ,” International Journal of Impact Engineering, vol. 139, 103527, . [Google Scholar]
19N. Vu-Bac, T. Lahmer, H. Keitel, J. Zhao, X. Zhuang et al.. (2014). , “Stochastic predictions of bulk properties of amorphous polyethylene based on molecular dynamics simulations. ,” Mechanics of Materials, vol. 68, pp, 70–84, .
20C. Anitescu, E. Atroshchenko, N. Alajlan and T. Rabczuk. (2019), “Artificial neural network methods for the solution of second order boundary value problems. ,” Computers, Materials and Continua, vol. 59, no. (1), pp, 345–359, . [Google Scholar]
21H. Ghasemi, R. Brighenti, X. Y. Zhuang, J. Muthu and T. Rabczuk. (2014), “Optimization of fiber distribution in fiber reinforced composite by using NURBS functions. ,” Computational Materials Science, vol. 83, pp, 463–473, . [Google Scholar]
22A. Shishegaran, M. Saeedi, A. Kumar and H. Ghiasinejad. (2020), “Prediction of air quality in Tehran by developing the nonlinear ensemble model. ,” Journal of Cleaner Production, vol. 259, 120825, .
23Y. F. Chen, D. Q. Ding, C. H. Zhu, J. H. Zhao and T. Rabczuk. (2019), “Size- and edge-effect cohesive energy and shear strength between graphene, carbon nanotubes and nanofibers: Continuum modeling and molecular dynamics simulations. ,” Composite Structures, vol. 208, pp, 150–167, .
24C. Zhang, J. H. Zhao and T. Rabczuk. (2018), “The interface strength and delamination of fiber-reinforced composites using a continuum modeling approach. ,” Composites Part B-Engineering, vol. 137, pp, 225–234, . [Google Scholar]
25M. Fahiminia and A. Shishegaran. (2020), “Evaluation of a developed bypass viscous damper performance. ,” Frontiers of Structural and Civil Engineering, vol. 14, no. (3), pp, 773–791, . [Google Scholar]
26A. Shishegaran, M. R. Ghasemi and H. Varaee. (2019), “Performance of a novel bent-up bars system not interacting with concrete. ,” Frontiers of Structural and Civil Engineering, vol. 13, no. (6), pp, 1301–1315, . [Google Scholar]
27T. Liu, B. Lin, W. Yang, T. Liu, W. Xiao et al.. (2020). , “Study of effects of hard thick roof on gas migration and field experiment of roof artificially guided pre-splitting for efficient gas control. ,” Natural Resources Research, vol. 29, no. (3), pp, 1819–1841, . [Google Scholar]
28C. Xu, Q. Fu, X. Cui, K. Wang, Y. Zhao et al.. (2019). , “Apparent-depth effects of the dynamic failure of thick hard rock strata on the underlying coal mass during underground mining. ,” Rock Mechanics and Rock Engineering, vol. 52, no. (5), pp, 1565–1576, . [Google Scholar]
29Z. L. Xu. (2016), “ Small deflection bending of thin plates and its classical solution,” in Elasticity, 5th ed., vol. 13. Beijing, China: Higher Education Press, pp, 1, . [Google Scholar]
30T. D. Le, O. Joung, H. Bruce, C. G. Zhang and M. Rudrajit. (2018), “A discontinuum modelling approach for investigation of Longwall Top Coal Caving mechanisms. ,” International Journal of Rock Mechanics and Mining Sciences, vol. 106, pp, 84–95, . [Google Scholar]
31I. F. Oge. (2018), “Prediction of top coal cavability character of a deep coal mine by empirical and numerical methods. ,” Journal of Mining Science, vol. 54, no. (5), pp, 793–803, .
32J. C. Wang and Z. H. Wang. (2019), “Systematic principles of surrounding rock control in longwall mining within thick coal seams. ,” International Journal of Mining Science and Technology, vol. 29, no. (1), pp, 65–71, .
33S. L. Yang, J. W. Zhang, Y. Chen and Z. Y. Song. (2016), “Effect of upward angle on the drawing mechanism in longwall top-coal caving mining. ,” International Journal of Rock Mechanics and Mining Sciences, vol. 85, pp, 92–101, .
34J. Ning, J. Wang, L. Jiang, N. Jiang, X. Liu et al.. (2017). , “Fracture analysis of double-layer hard and thick roof and the controlling effect on strata behavior: A case study. ,” Engineering Failure Analysis, vol. 81, pp, 117–134, . [Google Scholar]
35X. Y. Zhuang, S. W. Zhou, M. Sheng and G. S. Li. (2020), “On the hydraulic fracturing in naturally-layered porous media using the phase field method. ,” Engineering Geology, vol. 266, 105306, . [Google Scholar]
36S. W. Zhou, X. Y. Zhuang and T. Rabczuk. (2019), “Phase-field modeling of fluid-driven dynamic cracking in porous media. ,” Computer Methods in Applied Mechanics and Engineering, vol. 350, pp, 169–198, . [Google Scholar]
37L. H. Sun, H. G. Ji, H. Jiang, P. Zeng and B. S. Yang. (2017), “Experimental study on characteristics of broken caving and regularity of compaction deformation of rocks in caving zone in the weakly cemented strata. ,” Journal of China Coal Society, vol. 42, no. (10), pp, 2565–2572, . [Google Scholar]
38C. D. Su, M. Gu, X. Tang and W. B. Guo. (2012), “Experiment study of compaction characteristics of crushed stones from coal seam roof. ,” Chinese Journal of Rock Mechanics and Engineering, vol. 31, no. (1), pp, 18–26, . [Google Scholar]
39J. W. Zhang, H. L. Wang, S. J. Chen and Y. L. Li. (2018), “Bearing deformation characteristics of large-size broken rock. ,” Journal of China Coal Society, vol. 43, no. (4), pp, 1000–1007, . [Google Scholar]
40P. Xiang, L. H. Sun, H. G. Ji, Y. Gao, Y. J. Liu et al.. (2017). , “Dynamic distribution characteristics and determination method of caving zone in overburden strata with large mining height. ,” Journal of Mining and Safety Engineering, vol. 34, no. (5), pp, 861–867, . [Google Scholar]
41Z. Zhang, C. Zhang, K. Jiang, Z. Wang, Y. Jiang et al.. (2019). , “Analytical prediction for tunnel-soil-pile interaction mechanics based on Kerr foundation model. ,” KSCE Journal of Civil Engineering, vol. 23, no. (6), pp, 2756–2771, . [Google Scholar]
42D. M. Zhang, Z. K. Huang, Z. L. Li, X. Zong and D. M. Zhang. (2019), “Analytical solution for the response of an existing tunnel to a new tunnel excavation underneath. ,” Computers and Geotechnics, vol. 108, pp, 197–211, . [Google Scholar]
43Y. Chen, S. Q. Ma and Y. Yu. (2017), “Stability control of underground roadways subjected to stresses caused by extraction of a 10-m-thick coal seam: A case study. ,” Rock Mechanics and Rock Engineering, vol. 50, no. (9), pp, 2511–2520, . [Google Scholar]
44W. L. Shen, J. B. Bai, X. Y. Wang and Y. Yu. (2016), “Response and control technology for entry loaded by mining abutment stress of a thick hard roof. ,” International Journal of Rock Mechanics and Mining Sciences, vol. 90, pp, 26–34, .
45Q. S. Bai, S. H. Tu, F. T. Wang and C. Zhang. (2017), “Field and numerical investigations of gateroad system failure induced by hard roofs in a longwall top coal caving face. ,” International Journal of Coal Geology, vol. 173, pp, 176–199, . [Google Scholar]
 | This work is licensed under a Creative Commons Attribution 4.0 International License, which permits unrestricted use, distribution, and reproduction in any medium, provided the original work is properly cited. |