DOI:10.32604/cmc.2020.012384
| Computers, Materials & Continua DOI:10.32604/cmc.2020.012384 | |
| Article |
Design and Analysis of a Water Quality Monitoring Data Service Platform
1College of Engineering and Design, Hunan Normal University, Changsha, 410081, China
2Zhaoyin Network Technology (Shenzhen) Co., Ltd., Shenzhen, 518057, China
3Big Data Institute, Hunan University of Finance and Economics, Changsha, 410205, China
4University Malaysia Sabah, Sabah, 88400, Malaysia
*Corresponding Author: Jianjun Zhang. Email: jianjun998@163.com
Received: 28 June 2020; Accepted: 25 July 2020
Abstract: Water is one of the basic resources for human survival. Water pollution monitoring and protection have been becoming a major problem for many countries all over the world. Most traditional water quality monitoring systems, however, generally focus only on water quality data collection, ignoring data analysis and data mining. In addition, some dirty data and data loss may occur due to power failures or transmission failures, further affecting data analysis and its application. In order to meet these needs, by using Internet of things, cloud computing, and big data technologies, we designed and implemented a water quality monitoring data intelligent service platform in C# and PHP language. The platform includes monitoring point addition, monitoring point map labeling, monitoring data uploading, monitoring data processing, early warning of exceeding the standard of monitoring indicators, and other functions modules. Using this platform, we can realize the automatic collection of water quality monitoring data, data cleaning, data analysis, intelligent early warning and early warning information push, and other functions. For better security and convenience, we deployed the system in the Tencent Cloud and tested it. The testing results showed that the data analysis platform could run well and will provide decision support for water resource protection.
Keywords: Water quality monitoring; data analysis; big data; tencent cloud
Water is the foundation of human survival and development. The protection of water resources has been becoming a global environmental issue, that is of common concern and increasing attention of many countries all over the world [1]. In order to ensure the safety of water resource, it is extremely urgent to establish a water monitoring and data analysis system [2,3]. With the rapid development of sensor technology, a variety of water quality sensors, such as Electrode sensor, Biological water quality sensor, Optical water quality sensor, etc., have appeared in the market. This provides a good foundation for water quality monitoring data collection, and data analysis [4–6].
An online water quality monitoring system is a comprehensive automatic monitoring network involving modern sensor technology, computer application technology and communication network. However, many existing water quality monitoring systems focus only on water quality data monitoring, ignoring data analysis and the resource attributes of water quality data. In addition, some dirty data and data loss may occur due to power failures or transmission failures, further affecting water quality monitoring data analysis and its application. So, we designed and implemented a water quality monitoring data acquisition and data analysis platform based on the Internet of Things, which can clean the collected water quality data, ensure data quality, and lay the foundation for further data analysis. At the same time, because this data analysis platform has event early warning function, it can also be called an intelligent water quality monitoring data processing platform.
With the continuous influence of human life on the earth’s environment, water pollution occurs constantly. Prasad et al. introduced a program that investigate the quality of drinking water of Obulavaripalli Mandal YSR district based on water quality Index (WQI). To evaluate WQI in the study area, twenty groundwater samples were collected and different physico-chemical parameters viz., pH, EC, TDS, TH, total alkalinity (TA), calcium (Ca2+), magnesium (Mg2+), chloride (Cl−), sulphate (SO42−) and fluoride (F−) were analyzed. WQI data for groundwater samples indicated that 30% of the samples fall under excellent rating, 40% of the samples fall under good category and another 30% of the groundwater is under poor category. Overall groundwater quality is not suitable for drinking purpose [7]. Water pollution sources mainly include phosphate, nitrate and other chemical pollution and copper, cadmium, lead and other heavy metals pollution, even microplastics can be found in contaminated water [8].
In order to grasp the pollution of water resources, it is necessary to sample water resources. The U.S. Geological Survey (USGS) maintains a place-based research program in San Francisco Bay (USA) that began in 1969 and continues, providing one of the longest records of water-quality measurements in a North American estuary. Constituents include salinity, temperature, light extinction coefficient, and concentrations of chlorophyll-alpha, dissolved oxygen, and suspended particulate matter, nitrate, nitrite, ammonium, silicate, and phosphate [9]. Collecting reliable and actionable water quality information in low-resource settings, however, is challenging [10], and most of the traditional sampling methods are still manual, time-consuming and laborious. Therefore, the effect is not good. Scott et al. introduced a research program, Fresh Water Watch (FWW), which aimed to standardize urban water sampling efforts from around the globe. This experience in the FWW demonstrates the capabilities and constraints of citizen science when applied to water quality sampling. While analytical limits on in-field analyses produce higher uncertainty in water quality measurements of individual sites, rapid data collection is possible but depends on the motivation and engagement of the group of volunteers [11]. No Line breaks between paragraphs belonging to the same section.
Now we are in an era of rapid development of science and technology. Networks and information processing technologies such as the Internet of Things, robots, big data, and cloud computing have been becoming increasingly mature. These techniques could be widely used in industry, agriculture, environmental protection, commerce and many aspects of people’s lives. By using the Internet of Things, big data, cloud computing and other related technologies, Chen et al. constructed a big data analysis and processing platform for the garlic industry chain to solve the uncertainties of planting scope and yield, price fluctuation analysis, prices forecasting and other issues. The proposed platform could provide information and decision support for the healthy development of the garlic industry [12]. In order to better predict smog in China, Wang et al. [13] proposed a two-layer model intelligent prediction algorithm based on Long Short Term Memory Neural Network and Gated Recurrent Unit (LSTM&GRU). Based on the analysis of the relationships and the mutual influence between big data knowledge and private knowledge, Wu et al. [14,15] proposed some decision models of knowledge transfer. These models take into consideration the influence of various knowledge structures on the efficiency of knowledge transfer, and can provide decision-making support for enterprises to determine the allocation of a knowledge structure in the big data environment. With the continuous development and application of Internet of Things technology, recent advances in high-frequency water-quality sensors have enabled direct measurements of physical and chemical attributes in rivers and streams nearly continuously [16]. How to use The Internet of Things technology to better protect water resources has become an important research direction of water resources protection. Sun et al. [17] presented their initial efforts to deploy STORM 3 data loggers and a wireless sensor network (WSN) to collect real-time and in-situ data at fine temporal granularities to monitor the pond at Lamar University in Beaumont, TX. Wong et al. [18] presented an architecture built upon the increasing availability of new technologies to expose environmental sensors as web services, and the merging of these services under recent innovations on the Internet of Things (IoT).
After the data collection of water quality monitoring indicators, how to analyze them and mine its data value? Based on the time-series data mining methodology, Wei-Hui Deng proposed a novel and general analysis framework for water quality time-series data, and applied this analysis framework on weekly Dissolve Oxygen time-series data collected from five monitoring stations on the upper reaches of Yangtze River, China. The experimental results discovered the relationship of water quality in the mainstream and tributary as well as the main changing patterns of DO, and show that the proposed analysis framework is a feasible and efficient method to mine the hidden and valuable knowledge from water quality historical time-series data [19].
As one of the main development directions in the information field, big data technology can be applied for data mining, data analysis and data sharing in the massive data, and it created huge economic benefits by using the potential value of data [20]. By referring to the above and other references, the authors learned that by using water quality sensor technology, Internet of Things technology, 4G communication technology, big data storage and analysis technology, a water quality monitoring big data intelligent service platform could be designed and implemented. The platform has the functions of the automatic collection of water quality monitoring data, data cleaning, data analysis, intelligent early warning and early warning information automatic push. It could provide appropriate support for water resources protection.
3 Architecture and Key Technologies
Big data technology is the general term for data collection, data storage, data processing and data visualization [21–24]. Water quality monitoring data can be obtained through water quality indicator sensors deployed in the monitoring water fields, or by the using of reptile technology from the corresponding monitoring data release network platform. To design the big data platform for water quality monitoring data processing, it is necessary to collect data from monitoring waters or information distribution network platforms to data centers for storage, analysis and data processing information visualization.
According to the information of water monitoring data, in order to meet the requirements of high performance, scalability, high reliability and low energy consumption, the water monitoring big data analysis system is divided into four layers according to the big data processing process, as shown in Fig. 1. The first layer is the physical layer of the water quality monitoring big data analysis system, whose main task is to collect water quality monitoring data. The data can be obtained through monitoring sensors for pH, turbidity, cadmium, copper and other water quality indicators deployed in the monitoring water fields or through the water quality monitoring index data release network platform. The second layer is the information layer of the water quality monitoring big data analysis system, which is tasked with storing collected water quality monitoring indicators data in data centers on cloud platforms. The water quality monitoring index data collected by the sensor is transmitted to the data center via a 4G module, while the water quality monitoring data published by the network platform water quality monitoring data is obtained and stored in the data center via reptiles. The third level is the data analysis and mining layer of the water quality monitoring big data analysis system. Through the big data processing technology, big data analysis technology and big data visualization technology, according to the system requirements, the mass data resources can be fully excavated and analyzed. The fourth level is the service layer, which mainly provides large data analysis services to users through the Web and mobile ends, including monitoring water map labeling, water quality monitoring data graphical display, water quality monitoring indicators over-standard warning and early warning information push and other services.
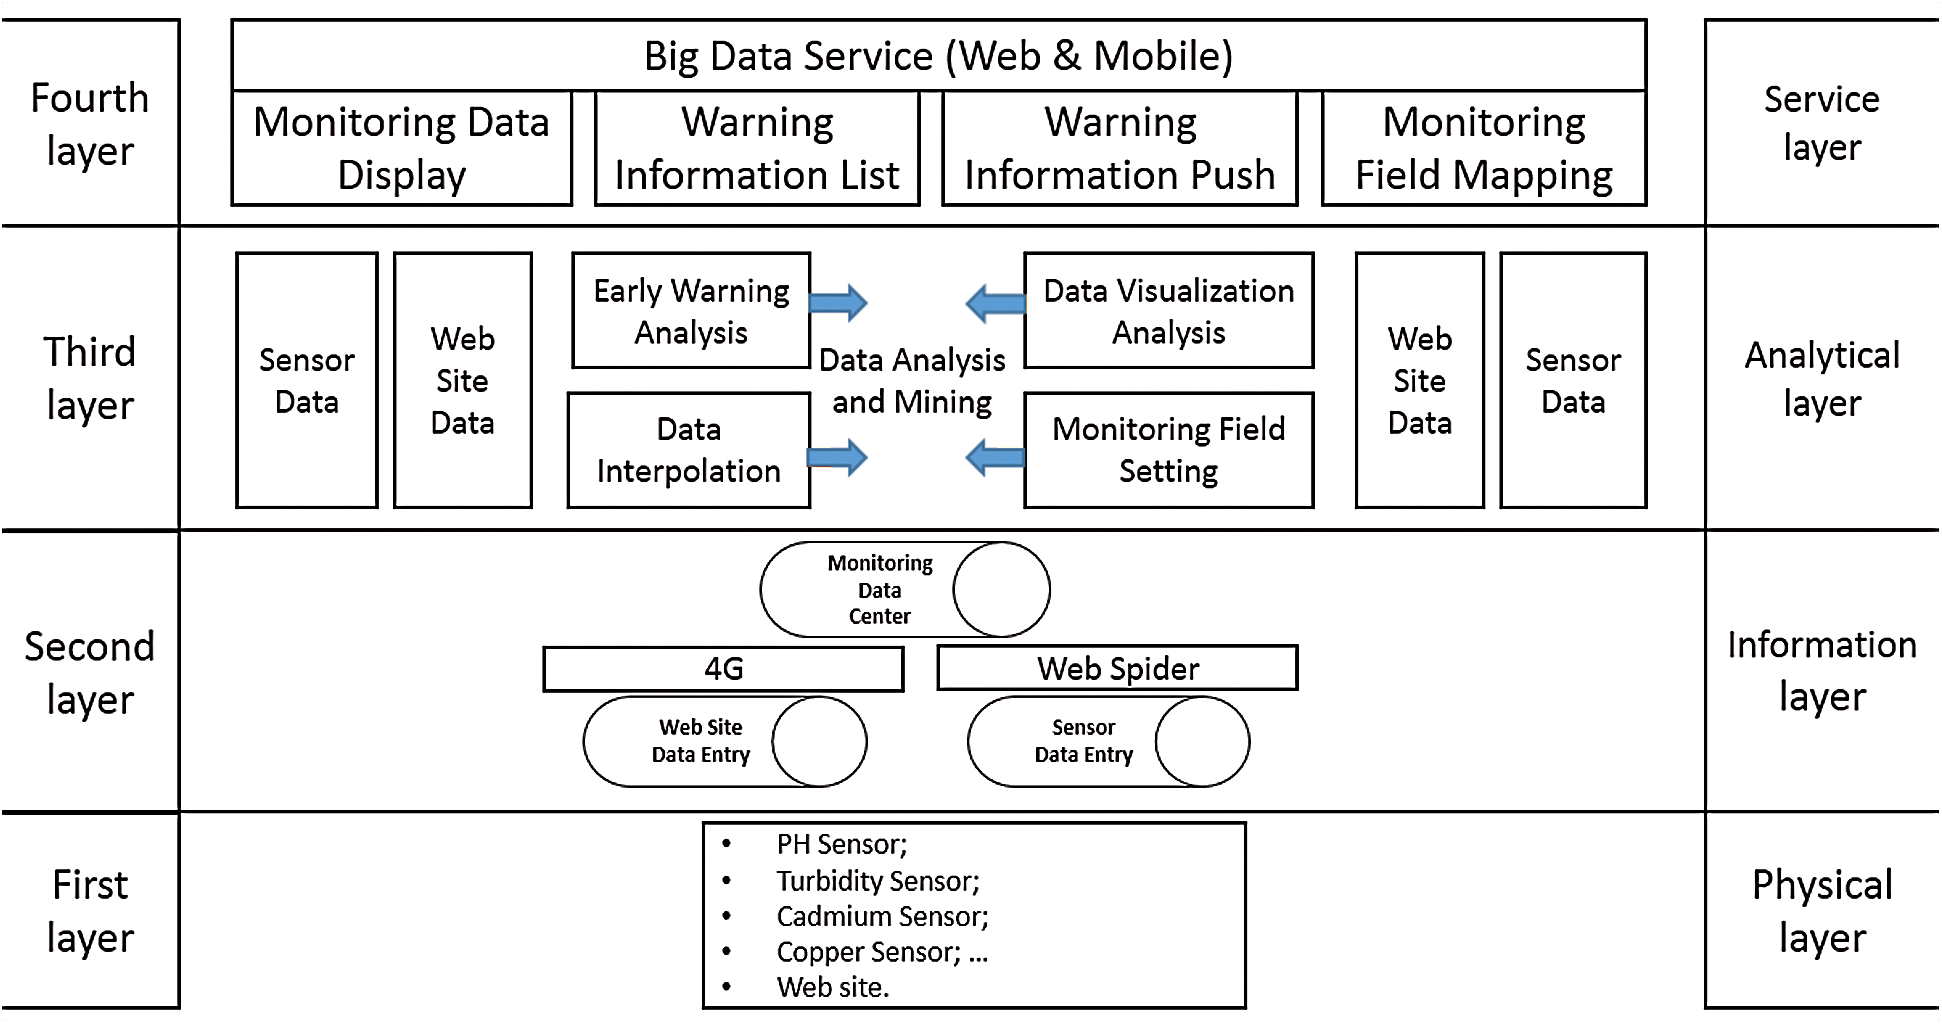
Figure 1: The architecture of the water quality monitoring data analysis platform
By using data acquisition, data storage, data processing, data visualization and other related large data processing technology, the water quality monitoring big data service system is built, as shown in Fig. 2.
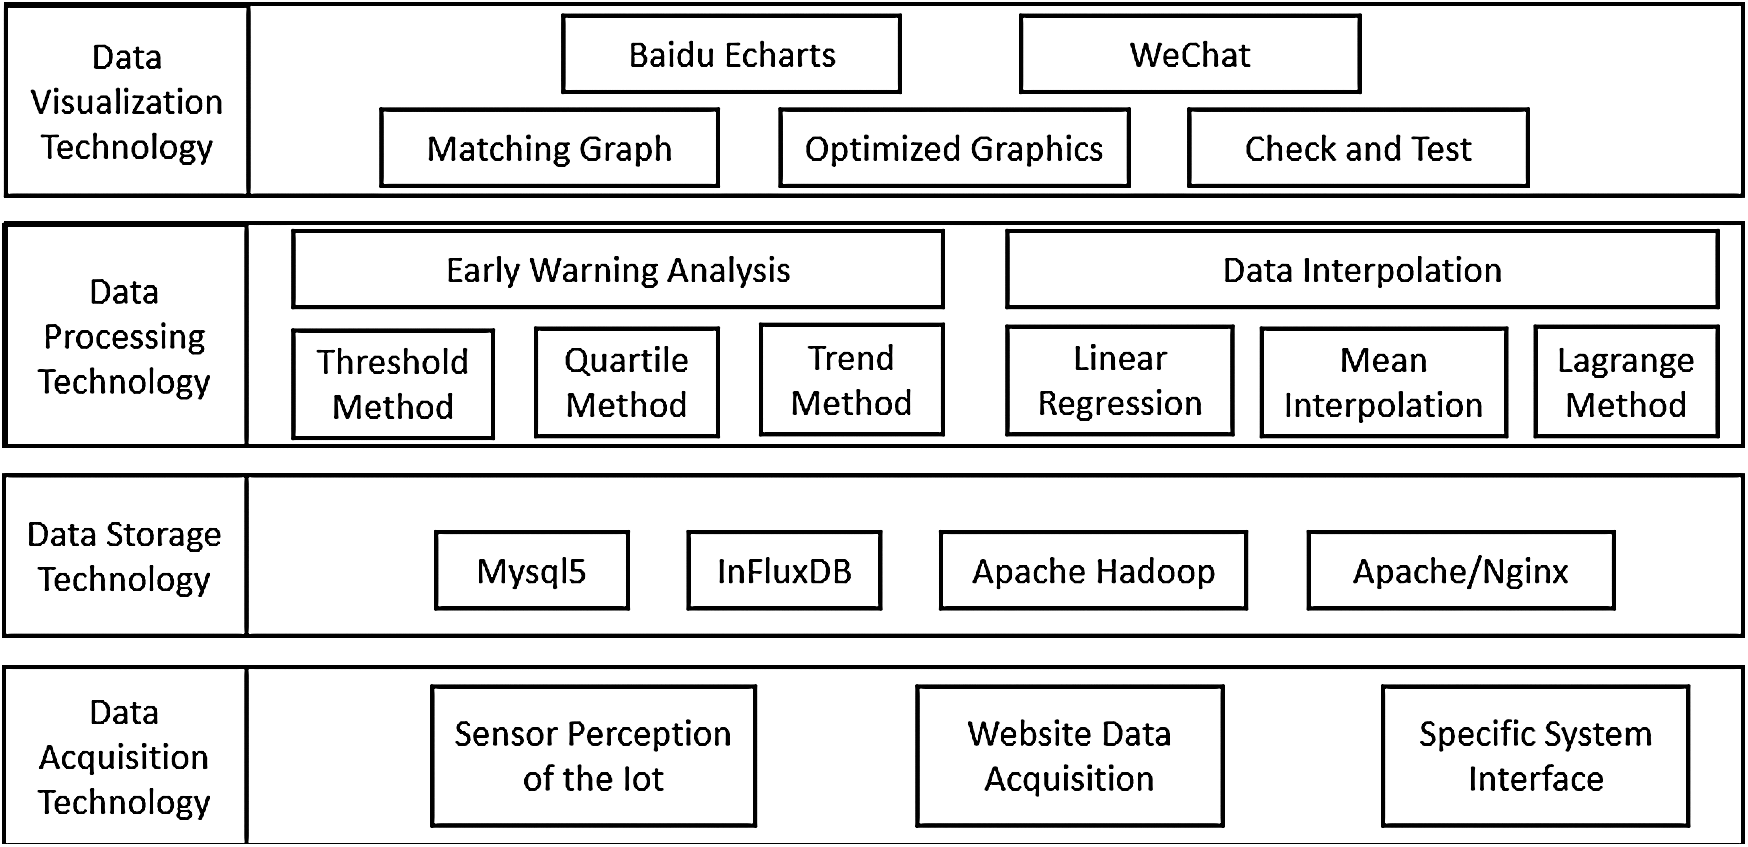
Figure 2: Big data technologies stack
3.2.1 Data Acquisition Technology
The research and development of a platform is based on data. Data as the core part of the system is the key element of the whole system. In the process of developing a water quality monitoring data centric platform, it is necessary to improve the means of data acquisition [12]. In order to achieve this goal, we have deployed PH, turbidity, cadmium, copper and other corresponding water quality index monitoring sensors in the experimental water fields, and made proper use of microcontrollers for data format conversion. At the same time, in order to improve the scalability of the system, we also designed the corresponding reptile program to capture data from some water quality monitoring index data network release platform.
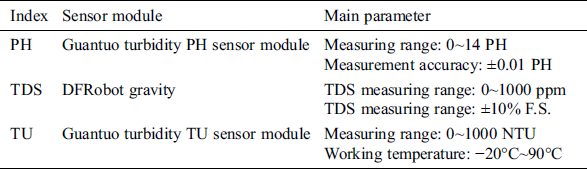
The selection of monitoring sensors is very important for the collection of the water quality indexes. We chose three commonly used water quality monitoring sensors: PH, turbidity and TDS (total dissolved solids) for collection. Of course, more indicators monitoring sensors could be added according to actual needs. The selected indicator monitoring sensors are shown in Tab. 1. These sensors are all plug-and-play models. The collected monitoring water quality data is converted by the single-chip microcomputer to the data transmission module, and then transmitted to the data center on the cloud platform for processing through the 4G module. At the same time, we have reserved interfaces for other special data collection.
Table 1: Some sensor module selection
In order to transmit the monitoring water quality data collected by sensors to the platform in time, we used 4G network to transmit information. The 4G module we selected is Gport-G43. It is a five-mode full Netcom 4G DTU that supports mobile, Unicom 2G/3G/4G, and telecom 4G networks. The network supports a maximum downlink rate of 150 Mbps and a maximum uplink rate of 50 Mbps. It can also work normally in remote areas lacking 3G and 4G network coverage (mobile, Unicom). Gport-G43 module connects serial port equipment to the internet, which conforms to TCP/IP.
Data storage is an essential link to ensure the reliability and accuracy of the analysis results. The big data storage system generally includes three aspects of the file sys-tem, the database technology and the programming model [12].
A file system is a method and data structure used by an operating system to specify files on storage devices or partitions, that is, to organize files on storage devices. Common distributed file systems include GFS, HDFS, Lustre, TFS, and so on [12]. Hadoop is a distributed system infrastructure developed by the Apache Foundation. Users can develop distributed programs without knowing the underlying details of the distribution by taking full advantage of the power of the cluster for high-speed computing and storage. Hadoop implements a distributed file system (Hadoop Distributed File System), or HDFS for short. HDFS is highly fault-tolerant and is designed to be deployed on low-cost hardware, and it provides high throughput to access application data for applications with large data sets. The core design sits in Hadoop’s framework is HDFS and MapReduce. HDFS provides storage for massive amounts of data, while MapReduce provides computations for massive amounts of data [25].
Database technology is the basic theory and implementation method of the structure, storage, design, management and application of the database, and uses these theories to process, analyze and understand the data in the database [12]. MySQL is a relational database management system developed by MySQL AB of Sweden and is owned by Oracle. MySQL is one of the most popular relational database management systems, and MySQL is one of the best RDBMS (Relational Database Management System) applications for WEB applications. InfluxDB is an open source database for storing and analyzing time series data. The main features are: ① Built-in HTTP interface for easy use; ② Data can be tagged so that queries can be flexible Query statement for class SQL; ③ Installation management is simple and reading and writing data efficiently; ④ Ability to query in real time, data can be indexed at write time and can be detected immediately. In the latest DB-ENGINES given the time series database ranking, InfluxDB ranked first, it is expected that InfluxDB will be more and more widely used.
3.2.3 Data Processing Technology
Data preprocessing refers to processing data before data mining, including cleaning up outliers and correcting erroneous data. According to the result of data quality analysis, in order to improve the utilization rate of data, it is necessary to complete the interpolation of data according to the requirements. Data interpolation usually includes Mean interpolation, Lagrange interpolation and Linear Regression interpolation.
The mean interpolation method is a simple and fast method for missing data processing. It fills the missing variable value according to the average value of the variable on all other objects, or the data that will appear the highest frequency or frequency in the same attribute data to compensate for the missing data value. This method has the ad-vantages of low data quality, easy operation and excellent interpolation results. Lagrange interpolation formula is compact in structure, and its polynomial calculation is relatively simple and convenient, so it is often used in theoretical analysis. When the interpolation node increase and decrease changes, however, the difference polynomial will also change. And when the interpolation point increases, the number of interpolation functions will become higher, resulting in data instability, which will cause the theoretical and actual values to have a large error. So it is very inconvenient in practice. For the fitting interpolation method of linear regression, the core is to approximate the actual value by using the result calculated by the least square-multiply method, which is based on the functional description of the actual problem, and can get close to the expected effect.
After the analysis and pre-processing of the data, the data can be used directly to establish classification and prediction models. In order to get more comprehensive data implications, the system’s data early warning uses the following methods to detect anomalies: fixed threshold warning, window trend warning, and quartile warning. The fixed threshold warning uses the fixed specific value for early warning mainly based on the water quality standard value. When the collected data exceeds this specific value, the system will give an alarm message. The trend warning based on the time sliding window is mainly based on the trend of the previous water quality monitoring data to judge whether the current data exceeds the trend range. We set the expected trend window (neighborhood) size based on the previous observation data to find the expectation (mean) of a monitoring indicator. If the currently monitored data exceeds this mean value, for a neighborhood, an early warning mechanism is initiated and an alarm message will be given.
3.2.4 Data Visualization Technology
Data visualization is a way of combining data and visualization technology. The visualization of big data can not only intuitively display the basic information in a large number of data, but also drive complex data analysis, facilitate the interaction between data and users, and make users more convenient to see the changes in the multiple attributes of the data of the industry objects or events, and provide the convenient operation for the industry [26].
ECharts, abbreviated from Enterprise Charts, which is commercial-grade data charts, a pure Java script chart library, its can run smoothly on PCs and mobile devices, compatible with most current browsers (IE/8/9/10/11, Chrome, firefox, Safari, etc.) The underlying reliance on the lightweight Canvas library ZRender, provides intuitive, vivid, interactive, highly customizable data visualization charts. It uses Ajax + JSON + JQuery + MVC architecture to acquire data through Ajax technology and set data using templates for configuration data. The steps are as follows: First initialize (init), then configure Option, and finally set Option (myChart.setOption (option)). Using Baidu ECharts, the focus of work only needs to be placed on the data, which greatly reducing the programming burden.
WeChat is a mobile text and voice messaging communication service that was released by Tencent in China in January 2011. WeChat eventually became one of the largest messaging applications in China, with over a billion existing accounts and 700 million active users [27]. In order to transmit the warning information in time to the user, we used the Wechat-sender, a WeChat development tool from Tencent, to develop a WeChat test public account (of course, you can also apply for a non-test version of the public account). Wechat-sender is a toolkit based on Wxpy and tornado, and it can implement websites, crawlers, scripts, etc. Various other applications (such as logs, alarms, running results, etc.) could be sent to the WeChat. Using it, we can push the water quality early warning information of the monitoring waters to the relevant users.
The data analysis system was developed with the Admin LTE framework, the Layer jQuery pop-up plug-in, the blade template, C# and PHP. The data collected by multiple sensors is uploaded to the WEBAPI through the network, and will be stored in the HBase through the API for further data clean and data analysis. The data analysis module reads relevant data from the database for data cleaning, data purification, data visualization, early warning analysis and other processing operations. With the related APIs, Baidu Echart and Tencent Wechat related modules, the data analysis system provides early warning, visualization and other related information services to the users. The data flow is shown in Fig. 3.
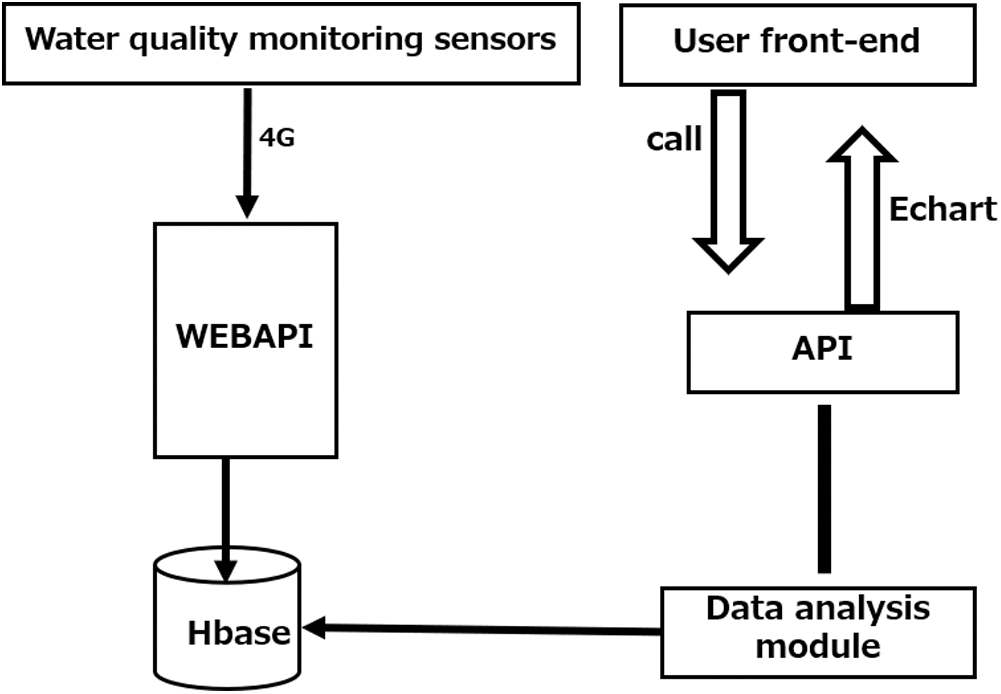
Figure 3: The system data flowchart
After requirement analysis and preliminary design, the platform software system was designed with the Internet concept, Internet of Things technology, and big data analysis. The WEB part of the system adopts the mainstream Laravel framework abroad. This framework is chosen because it uses a large number of design patterns. The framework completely conforms to the five basic principles of design patterns. The coupling degree between modules is very low. The service container can easily expand the framework functions and write tests. The background UI adopts AdminLTE, which is a lightweight background template based on Bootstrap. The framework is relatively beautiful, with various skins, and can adapt to the mobile terminal. The framework of the software system is shown in Fig. 4.
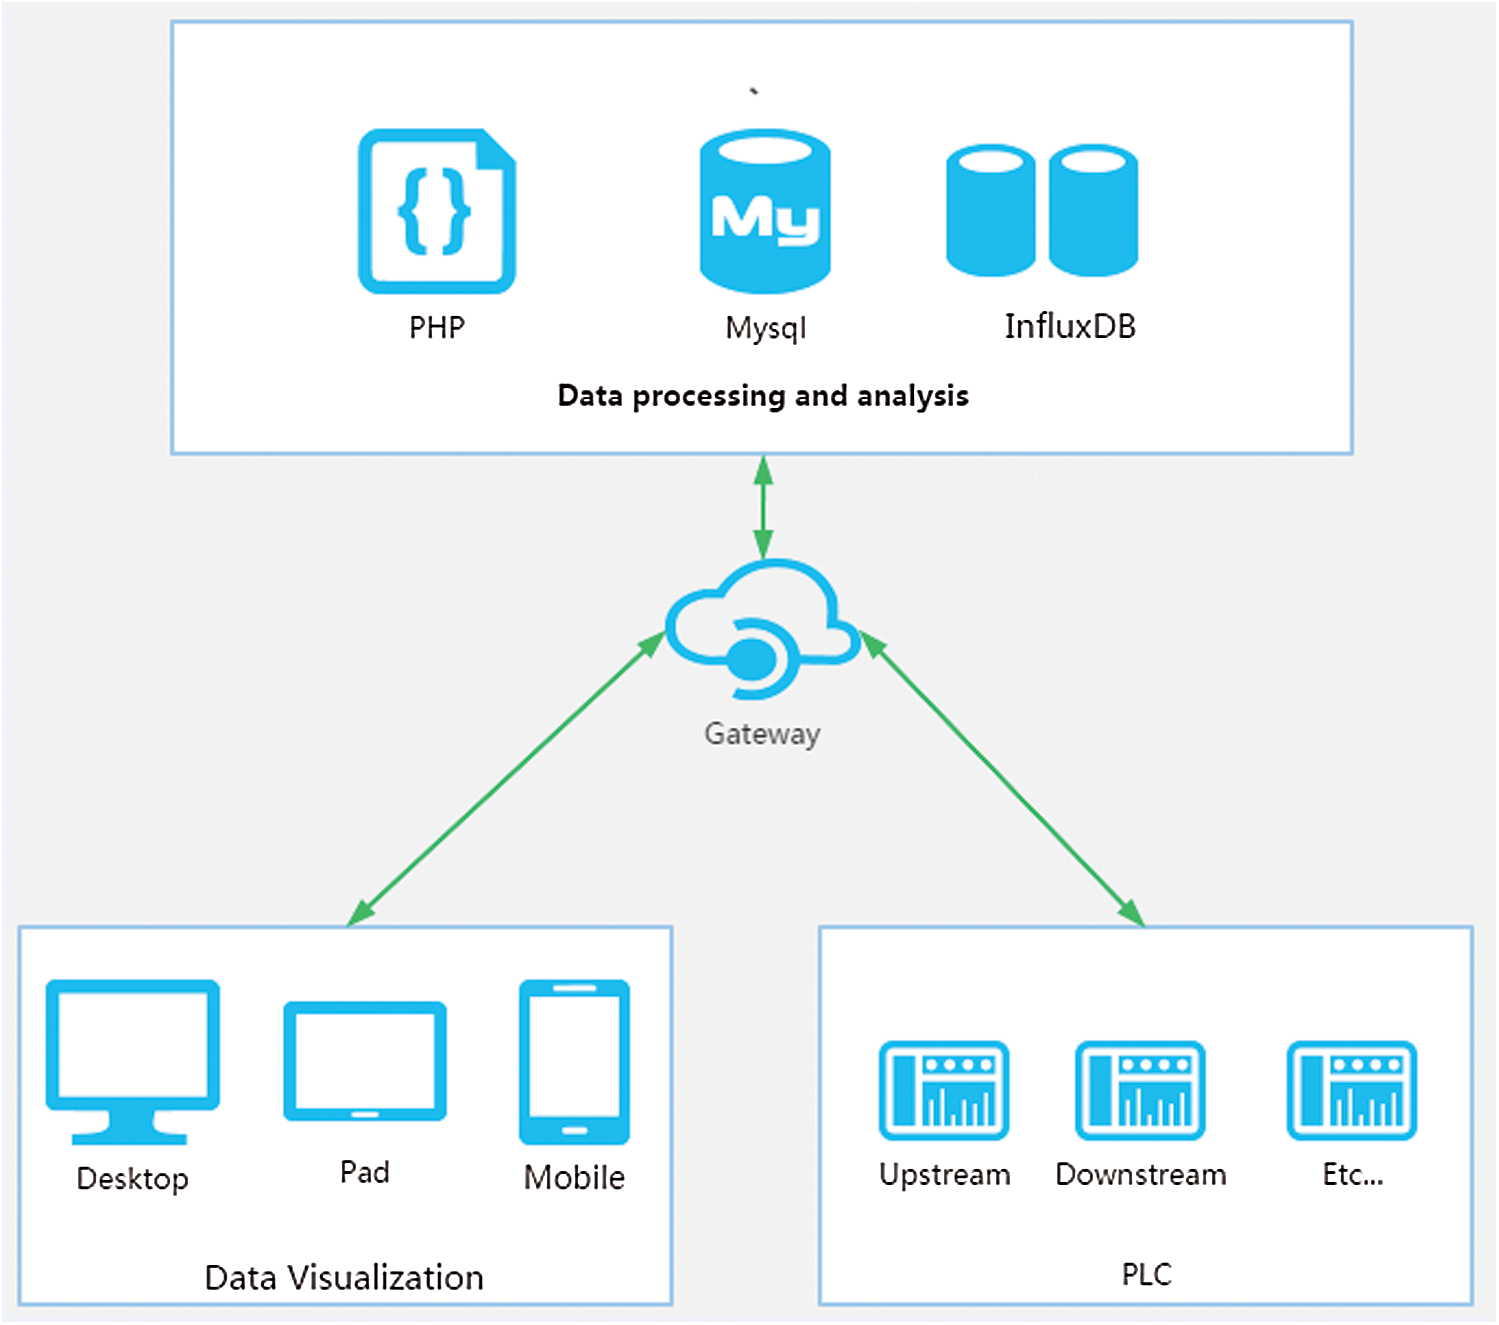
Figure 4: The framework of the software system
In order to simplify the development process, we did not directly purchase the corresponding server hardware but rented Tencent cloud space. Instead, the entire system software platform is deployed to the Tencent cloud because Tencent can provide cloud computing resources to reduce the development costs and network security pressure. The development environment and programming language are: NET Framework 4.0, Microsoft Visual Studio 2017, JDK1.8, PHP7.2, Mysql5, Apache/Nginx and InFluxDB. The collected water quality monitoring data are stored in Mysql database through API interface and Web Service, and processed and analyzed in combination with tool frameworks such as InfluxDB commonly used in big data analysis. At the same time, Echarts [28] was used to send the visualization results of monitoring data to the terminals through Web service.
Because the obtained water quality detection data has the characteristics of large data volume, frequent dynamic update, etc., and the performance stability of the water quality monitoring equipment may cause abnormality and lack of collected water quality data, it is necessary to pre-process the data collected before the data analyzing. These pre-processes mainly include judging the missing value or outlier value according to the corresponding rules. In the process of water quality monitoring data collection, there is a high risk of circuit failures or network delays, and so there is a high risk of data missing. Of course, there are may also be some abnormal data that may be caused by some water pollution. For these data, we use the indicator over-standard early warning module to deal with. For the lost data, the general processing methods are mainly divided into three categories: Delete records, data interpolation, and no processing. We interpolate the missing data to ensure the continuity of the monitoring data.
In the data analysis module running on the application layer, after the data is received by the REST API, the cleaning operation judgment is made to determine whether the received data is valid data. If the data is valid, the data is stored to the InfluxDB database, and the early warning module is performed when the warning mode of the monitoring point (data source) is on. If the warning is abnormal, the data will be put in the abnormal data table. If it is invalid data, the data will be put in a data list needed to be cleaned and the abnormal data table at the same time. The flow chart of data processing is shown in Fig. 5.
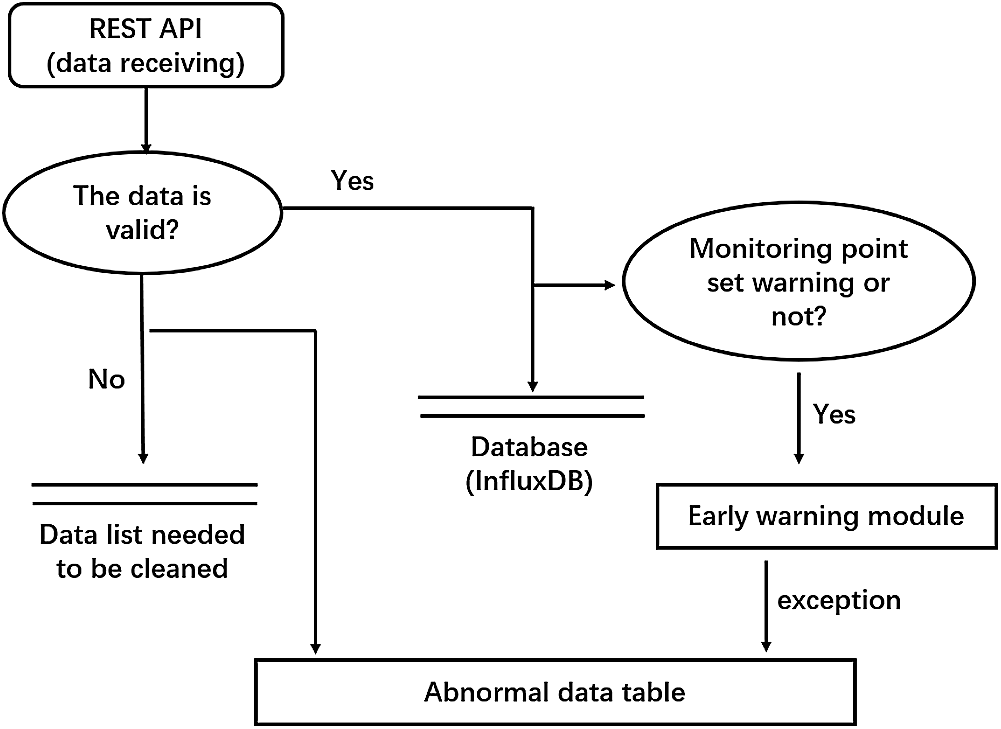
Figure 5: The data processing flowchart
4.2 Data Cleaning Module Design
Data cleaning is literally cleaning “dirty data” in order to improve the quality of the data. It mainly solves the problems of data integrity, uniqueness, authority, legitimacy and consistency of data [29–31]. The result of data cleaning is to process various dirty data in a corresponding manner, and obtain standard, clean, continuous data for using in data analysis, such as data statistics, data mining, and so on.
Data cleaning is divided into supervised cleaning and unsupervised cleaning [32–34]. Supervised cleaning process refers to collecting analytical data under the guidance of domain experts, manually removing obvious noise data and repeating records, filling in missing values and other cleaning actions. The unsupervised cleaning process refers to pre-defining the data cleaning algorithm according to certain business rules. The computer automatically executes the algorithm to clean the data set, and then generates a cleaning report. Because the labor cost is relatively high, we use the latter in most data cleaning scenarios.
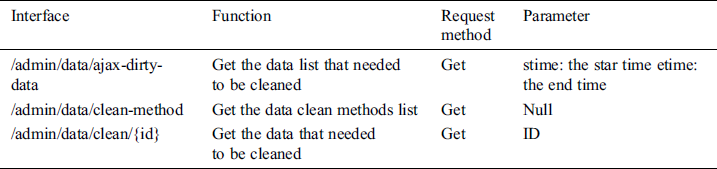
The monitoring water quality data is not always legitimate, and may sometimes be empty, non-numeric, wrong values, etc. The goal of the data cleaning module is to check data consistency, handle invalid and missing values, and so on. The module’s input is the dirty_data table in Mysql database, and its output is the data cleaned. At the same time, the dirty_data table and the data in the InfluxDB database will be updated. The program flow is as follows: Firstly, by using the GET request method, the module gets the data that needed to be cleaned. Secondly, these data will be cleaned according to the clean methods that provided by the interface “/admin/data/clean-method.” Of course, users decide to which clean methods to be used based on actual needs. The data cleaning module interface information is shown in Tab. 2.
Table 2: The interface information of data cleaning module
4.3 Early Warning Module Design
After data cleaning, the data can be used directly to establish water quality data classification, and the result of the data classification will decide whether to send these data to the early warning module. In order to get more comprehensive data analysis results, the early warning module uses the following methods to detect anomalies: Fixed threshold warning and window trend warning.
The fixed threshold warning method uses the fixed specific value for early warning mainly based on the China water quality standard. When the water quality monitoring data exceeds this specific value, the system will give an alarm message. If we selected a threshold value of 0.5 for data early warning, the early warning module will start and give an alarm message when the difference between the monitoring data and the standard value is greater than 0.5. Of course, the threshold could be set according to actual needs, and different monitoring points can set different thresholds depending on the actual situation.
The fixed threshold warning method judges whether the monitoring value exceeds the standard value by comparing these values, and then may give an early warning information. If the threshold is set too small, the early warning module starts frequently, but if the setting is too large, some monitoring data exceeding cannot be found. So, we designed a trend warning method based on the sliding time window. The sliding window trend warning method is to judge whether the current data exceeds the trend range mainly depend on the trend of the previous water quality monitoring data. Once we have set the time window size, we can calculate the average of an indicator in the monitoring data during this time. If the current monitoring data indicator exceeds this average, the early warning module starts and gives an alarm message. Of course, the time window size setting is dynamically adjusted according to the actual application to achieve more accurate prediction. This method mainly provides early warning for the pollution in the field of water quality monitoring. This allows appropriate measures to be taken in a timely manner when pollution is imminent, rather than taking action only after it occurs.
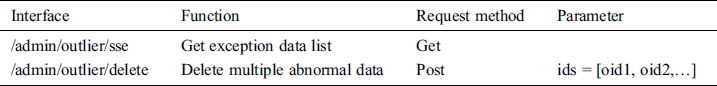
The early warning module mainly performs early warning analysis of water quality monitoring data according to some corresponding early warning methods. Its input is the real-time water quality data of the Redis queue and the historical data of Influxdb. Its output is an early warning result. If there is an abnormal, it will be stored in the outlier_data table and written to the notification queue. The interfaces provided by this module is shown in Tab. 3.
Table 3: The interface information of early warning module
The water quality monitoring data analysis platform completes the functions of monitoring water fields’ management, water quality monitoring data’s cleaning, analysis and visualization, water quality index exceeding’s warning, etc. The platform’s software interface is shown in Fig. 6. The software platform can be accessed by http://154.8.233.44/admin/login (username: admin, password: 111111).
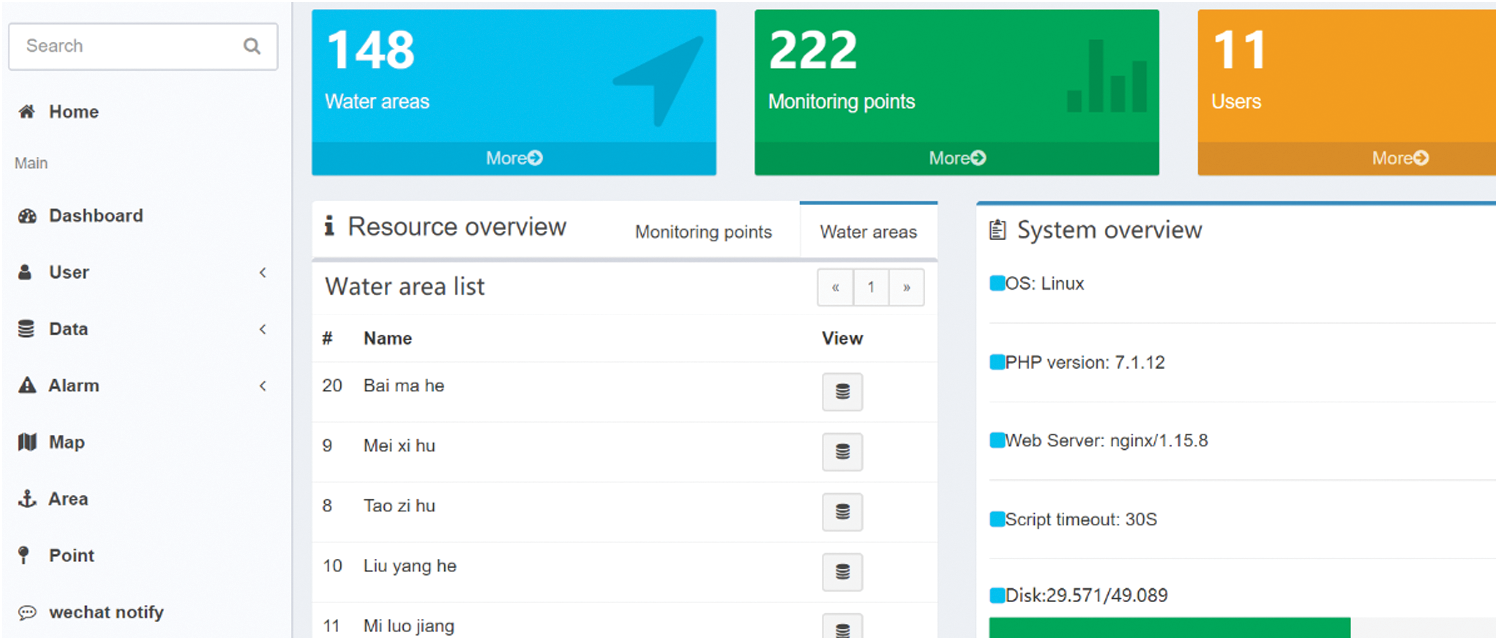
Figure 6: The platform software’s interface
5.1 Testing Data Set Construction
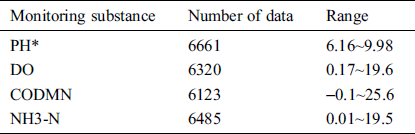
In order to better test the platform and ensure the diversity, authenticity and reliability of the data, we designed the reptile program to climb the monitoring waters quality data of the national monitoring points in the recent period from the China Environmental Monitoring Station (http://webinterface.cnemc.cn/szzdjcsssj2092933.jhtml). The monitoring fields covered 165 monitoring water fields. Nearly 25,000 water quality monitoring data were collected to construct a water quality monitoring indicator data set. The test data is shown in Tab. 4.
Table 4: Water quality monitoring data of some monitoring points
5.2 Data Cleaning Module Testing
The commonly used data clean methods mainly include Lagrange interpolation, neighborhood mean method and fitted interpolation of linear regression. In order to get better results, we tested these three methods separately. We randomly selected the 95th monitoring point “Weihe River” whose water quality monitoring data are shown in Fig. 7.
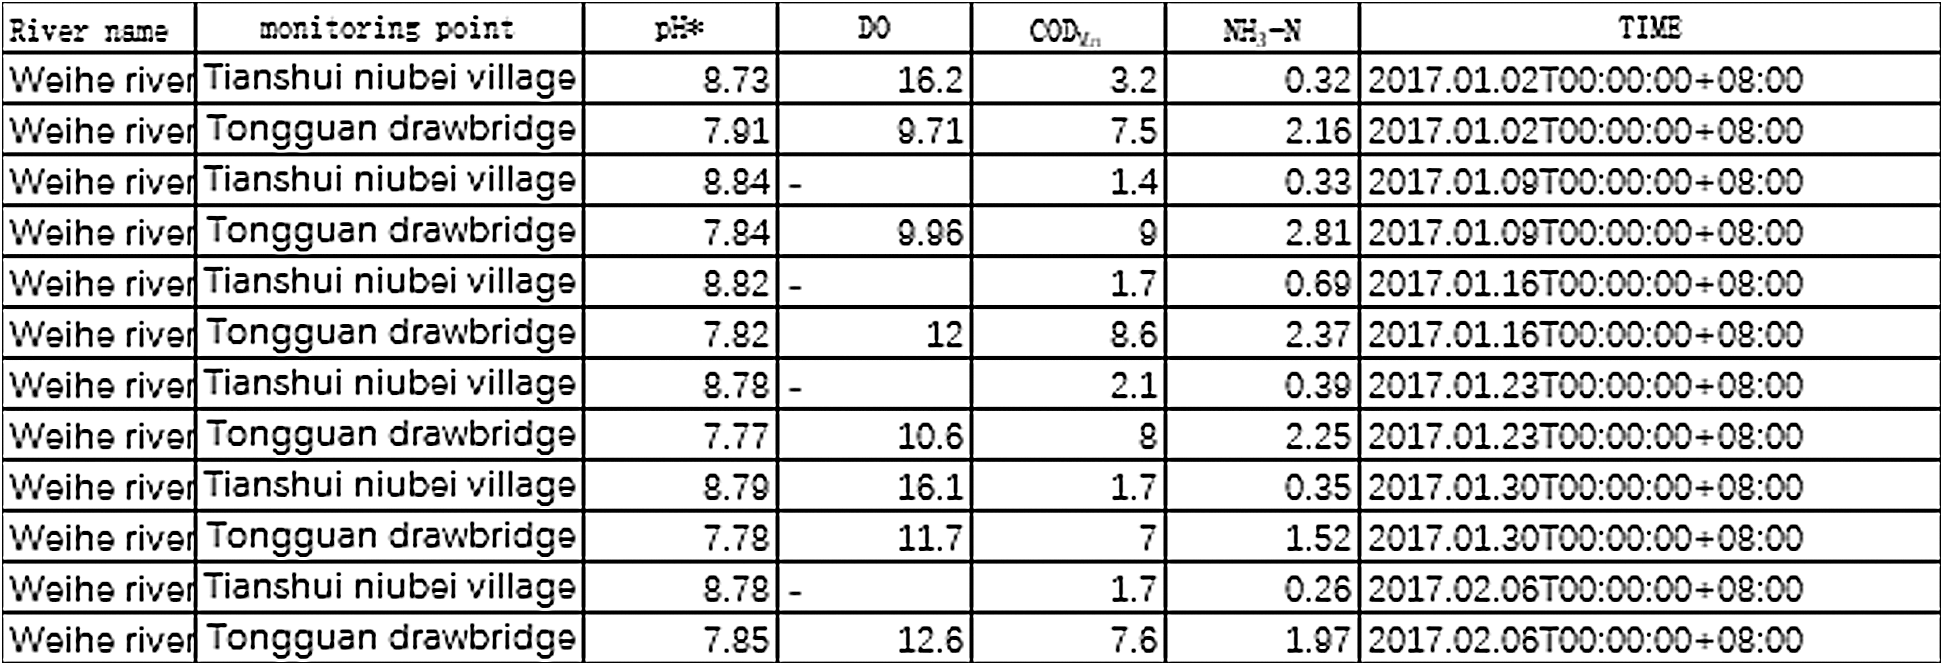
Figure 7: Some water quality monitoring data of Weihe River monitoring points
It can be seen from the table that there is some data missing in DO index. In order to get the missing value, we performed Lagrange and linear regression fitting interpolation calculation. The result of Lagrange interpolation is shown in Tab. 5, and the result of linear regression fitting interpolation is shown in Tab. 6. The first column of the table is the serial number of the data missing, the second column the serial number of monitoring point, the third column the indicator type of the data missing, the fourth column the time of data missing, and the last column the calculating result.
Table 5: The result of Lagrange interpolation
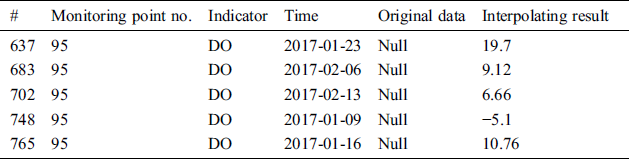
Table 6: The result of linear regression interpolation
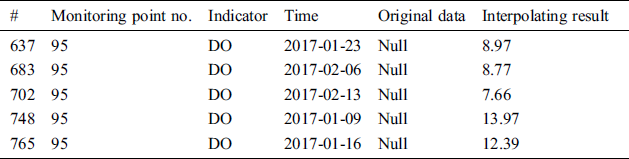
As shown in Tab. 5, there is a negative value, −5.1, in the last column. Obviously, this is not in line with the common sense. It shows the calculating results of linear regression method is better than the Lagrange interpolation. Of course, the linear regression method takes longer to calculate than the Lagrange interpolation.
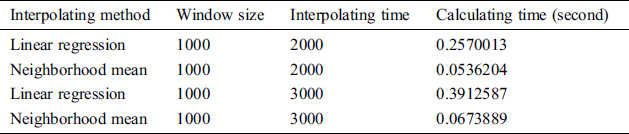
We also compared the calculation speeds of linear regression fitting interpolation and neighborhood mean method. The results are shown in Tab. 7. Obviously, the neighborhood mean method takes much less time to calculate than the linear regression method.
Table 7: Calculation speed comparison of linear regression interpolation and neighborhood mean
Lagrange interpolation formula is compact in structure, and the calculation of polynomials is relatively simple and convenient, so it is often used in theoretical analysis. However, when the interpolation nodes increase or decrease, the difference polynomials will also change, it will cause all results to recalculate. The calculation is complicated and inconvenient in practical application. Moreover, when the number of interpolation points increases, the number of interpolation functions will increase, resulting in instability of the data, which will lead to large errors between the theoretical value and the actual value. There is a negative value in the last column of the Tab. 5, which confirms this. Therefore, we chose the linear regression fitting interpolation as the method of data cleaning. Considering some special time-bound application scenarios, in addition, we also use the neighborhood mean method to clean the dirty data because its calculation is very simple and convenient. Then, we may use Echarts technology to visualize the water quality monitoring data after cleaning, as shown in Fig. 8.
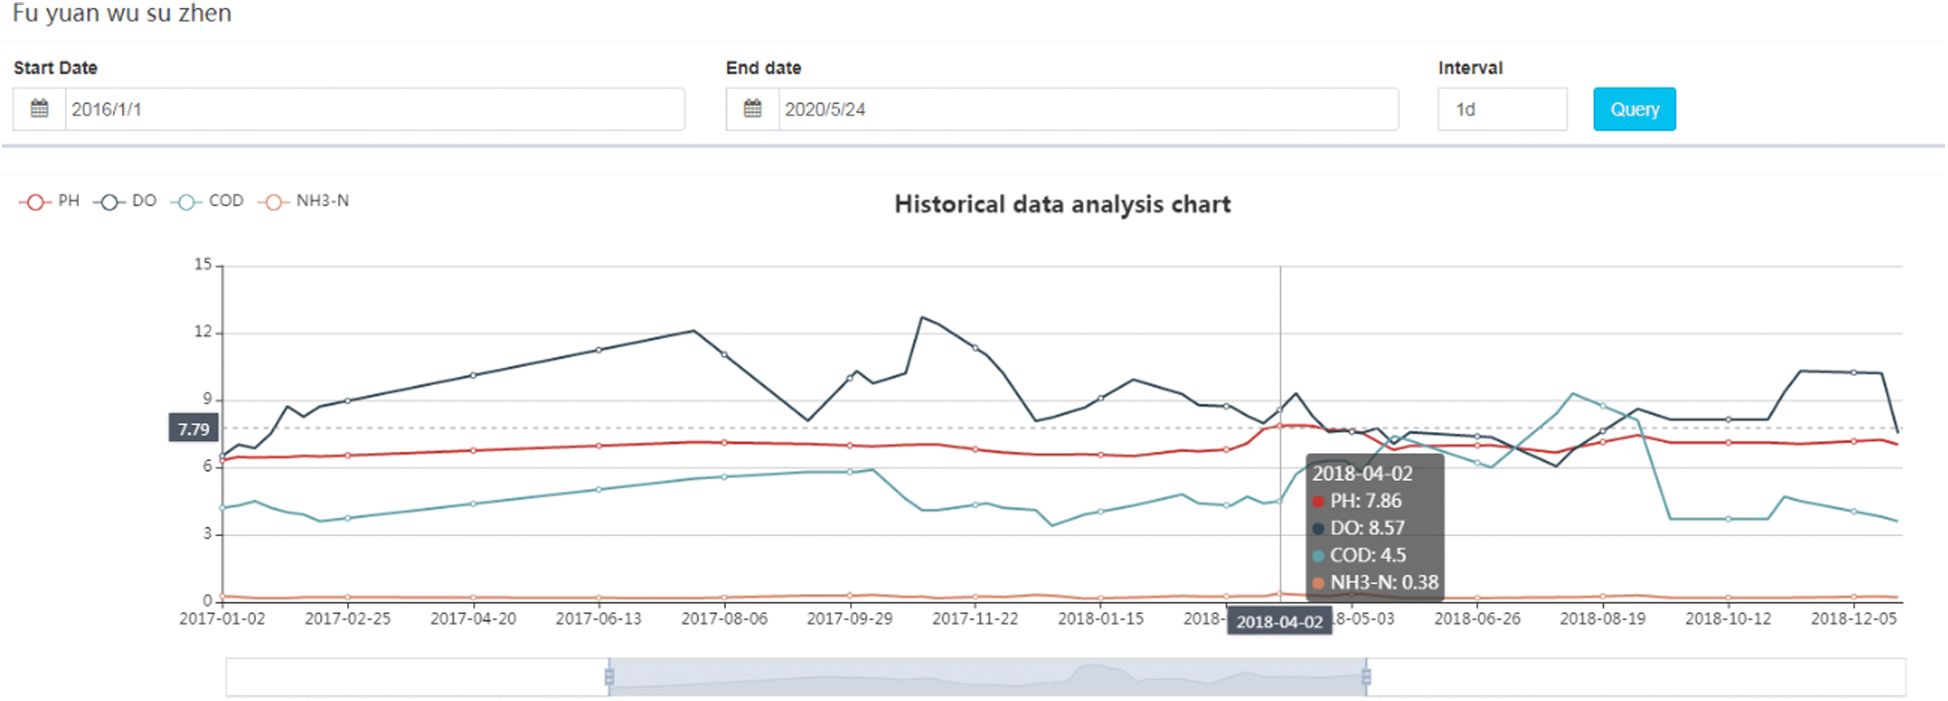
Figure 8: Visualization of water quality monitoring data
5.3 Early Warning Module Testing
For a monitoring point, we could set an early warning method for a monitoring point based on the fixed threshold warning and the time sliding window warning method mentioned above. Fig. 9 shows the warning method setting interface in the platform. As can be seen from the Fig. 9, the “Taozi Lake” site has been set two warning methods for the fixed threshold and window trend, and the “Ji ling xi liang ko” site has been set for the quartile warning method. Multiple warning methods can be set for a monitoring site according to actual needs.
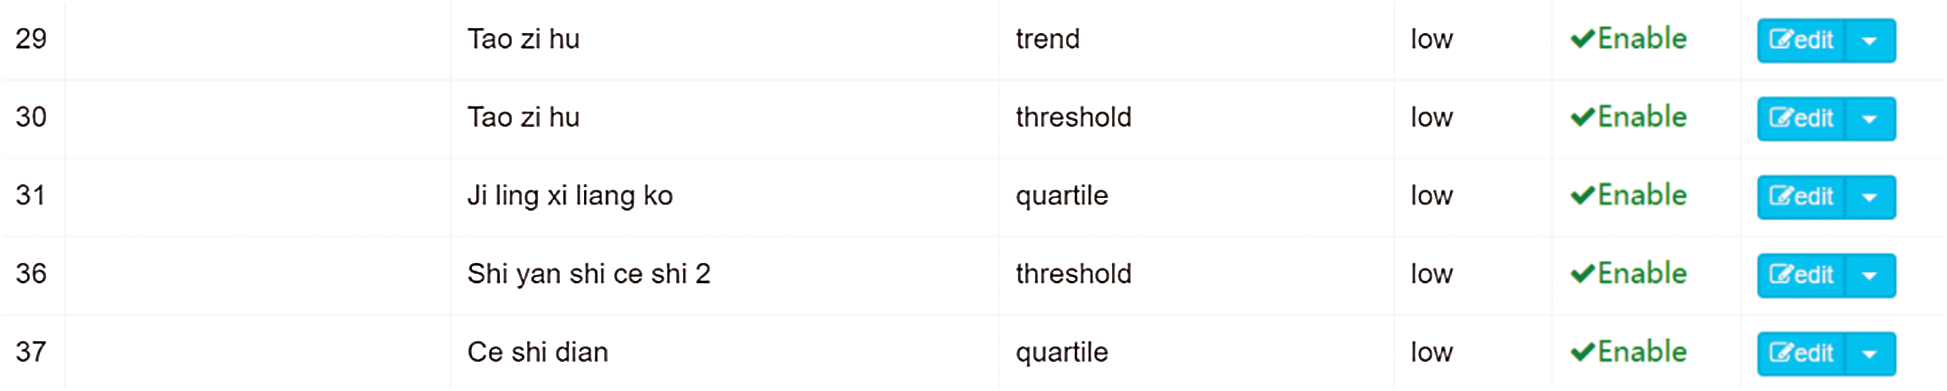
Figure 9: Warning method setting interface
Once some of the water quality monitoring data in some monitoring points exceed the value calculated with the early warning method, the early warning module will give an alarm message. The results are shown in Fig. 10. On October 2, 2019, there was an excess of CODMN indicator at “Ning Xia Zhong Wei Xin Tun” monitoring site as shown in Fig. 10.
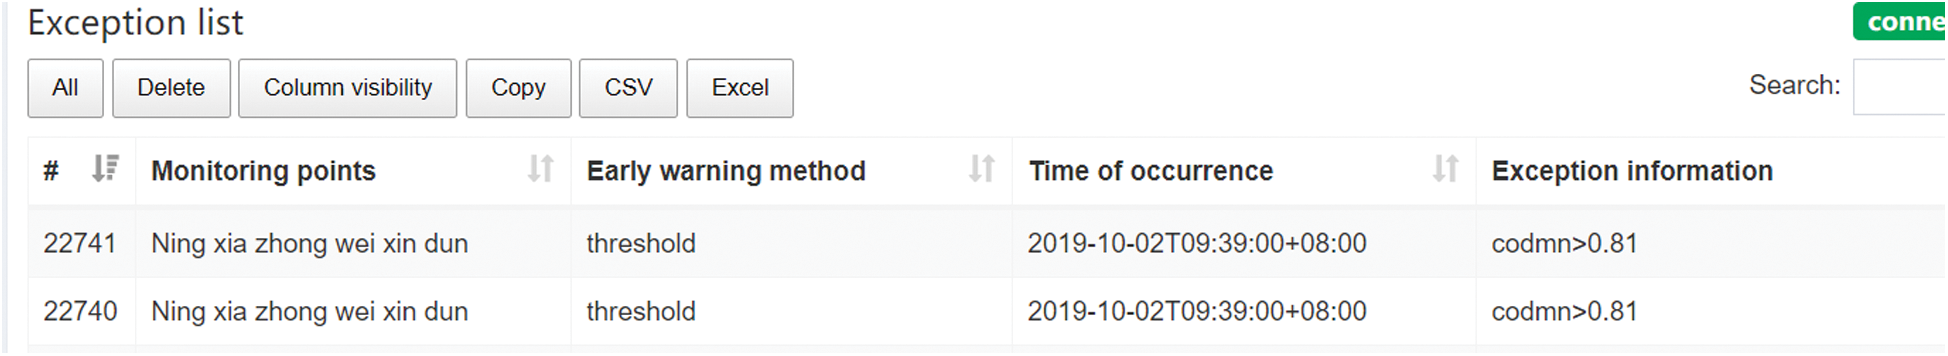
Figure 10: Some warning message showing interface
In addition, because we set up the automatic push of abnormal data information, the exception information will be automatically pushed to the user’s mobile phone when there is an exception, such as indicator exceeding the standard or there is no data. As shown in Fig. 11, there are two exception information, one is the indicator exceeds the standard and the other is that there is no data.

Figure 11: An exception information pushed to the user’s mobile phone
6 Conclusions and Future Works
In order to solve the problem of data loss in water quality monitoring and discover the value of water quality data, we designed and implemented a water quality monitoring data analysis platform by using Admin LTE framework, Layer jQuery pop-up layer plug-in, blade template, InfluxDB, C#, and PHP. Considering the security and convenience, we deployed the platform to the Tecnet Cloud. Though the 4G network, the platform could automatically receive water quality monitoring data that collected by sensors, clean the dirty data, visualize the water quality data, and give the alarm information when water quality indicators exceeding standards. To a certain extent, this system can be said to be an intelligent system for water quality monitoring and early warning. After deploying and testing, the data analysis platform has been working normally, and will provide decision support for water resources protection.
In the next step, in order to detect more water quality indicators, the water quality monitoring indicator database will be expanded by adding more water quality monitoring sensors. Meanwhile, we will use some relevant access control schemes [35] and multi-criteria network-aware service composition algorithms [36,37] to ensure access control and improve service quality. Furthermore, we will try to design a smart data analysis scheme to analyze and predict the water quality by using deep learning, neural networks and other artificial intelligence technology.
Acknowledgement: The authors would like to appreciate all anonymous reviewers for their insightful comments and constructive suggestions to polish this paper in high quality.
Funding Statement: This research was funded by the National Natural Science Foundation of China (No. 61304208), Scientific Research Fund of Hunan Province Education Department (18C0003), Research project on teaching reform in colleges and universities of Hunan Province Education Department (20190147), Changsha City Science and Technology Plan Program (K1501013-11), Hunan Normal University University-Industry Cooperation. This work is implemented at the 2011 Collaborative Innovation Center for Development and Utilization of Finance and Economics Big Data Property, Universities of Hunan Province, Open project, grant number 20181901CRP04.
Conflicts of Interest: The authors declare that they have no conflicts of interest to report regarding the present study.
References
1G. Li, H. Guo, H. Zhao, J. Zhao, C. Jia et al.. (2016). , “Development of android platform based portable water quality detector. ,” Chinese Journal of Environmental Engineering, vol. 10, no. (7), pp, 3973–3976, .
2Z. Zhang, Q. Cao and T. Xie. (2013), “Design of water quality monitoring and warming system of drinking water source. ,” Environmental Protection Science, vol. 30, no. (1), pp, 61–64, . [Google Scholar]
3W. Jiang and W. Huang. (2010), “Environmental monitoring and early warning system construction of centralized drinking water sources. ,” Environmental Monitoring and Forewarning, vol. 2, no. (6), pp, 5–7, . [Google Scholar]
4H. Li and J. Liu. (2012), “New progress of study of water quality monitoring sensors. ,” Transducer and Microsystem Technologies, vol. 31, no. (3), pp, 11–14, . [Google Scholar]
5W. Chu, Y. Zhang, D. Li, C. J. Barrow, H. Wang et al.. (2015). , “A biomimetic sensor for the detection of lead in water. ,” Biosensors and Bioelectronics, vol. 67, pp, 621–624, .
6Xiong F. B., Zhu W. Z., Lin H. F. and Meng X. G. (2014), “Fiber-optic sensor based on evanescent wave absorbance around 2.7 μm for determining water content in polar organic solvents. ,” Applied Physics B, vol. 115, no. (1), pp, 129–135, . [Google Scholar]
7M. Prasad, V. Sunitha, Y. Reddy, B. Suvarna, B. Reddy et al.. (2019). , “Data on water quality index development for groundwater quality assessment from Obulavaripalli Mandal, YSR district, A.P India. ,” Data in Brief, vol. 24, 103846, . [Google Scholar]
8A. A. Koelmans, N. H. Mohamed Nor, E. Hermsen, M. Kooi, S. M. Mintenig et al.. (2019). , “Microplastics in freshwaters and drinking water: Critical review and assessment of data quality. ,” Water Research, vol. 155, pp, 410–422, . [Google Scholar]
9T. Schraga and J. Cloern. (2017), “Water quality measurements in San Francisco bay by the U.S. geological survey, 1969–2015. ,” Scientific Data, vol. 4, 170098, . [Google Scholar]
10E. Kumpel, R. Peletz, M. Bonham and R. Khush. (2016), “Assessing drinking water quality and water safety management in sub-Saharan Africa using regulated monitoring data. ,” Environmental Science & Technology, vol. 20, no. (20), pp, 10869–10876, . [Google Scholar]
11A. B. Scott and P. C. Frost. (2017), “Monitoring water quality in Toronto’s urban stormwater ponds: Assessing participation rates and data quality of water sampling by citizen scientists in the freshwater watch. ,” Ence of the Total Environment, vol. 592, pp, 738–744, . [Google Scholar]
12W. Chen, G. Feng, C. Zhang, P. Liu, W. Ren et al.. (2019). , “Development and application of big data platform for garlic industry chain. ,” Computers, Materials & Continua, vol. 58, no. (1), pp, 229–248, . [Google Scholar]
13B. Wang, W. Kong, H. Guan and N. N. Xiong. (2019), “Air quality forcasting based on gated recurrent long short term memory model in Internet of Things. ,” IEEE Access, vol. 7, no. (1), pp, 69524–69534, . [Google Scholar]
14C. Wu, Y. Chen and F. Li. (2016), “Decision model of knowledge transfer in big data environment. ,” China Communications, vol. 13, no. (7), pp, 100–107, . [Google Scholar]
15C. R. Wu, E. Zapevalova, F. Li and D. M. Zeng. (2018), “Knowledge structure and its impact on knowledge transfer in the big data environment. ,” Journal of Internet Technology, vol. 19, no. (2), pp, 581–590, . [Google Scholar]
16G. Yang and D. Moyer. (2020), “Estimation of nonlinear water-quality trends in high-frequency monitoring data. ,” Science of the Total Environment, vol. 715, 136686, . [Google Scholar]
17B. Sun, F. Ahmed, F. Sun, Q. Qian and Y. Xiao. (2016), “Water quality monitoring using STORM 3 data loggers and a wireless sensor network. ,” International Journal of Sensor Networks, vol. 1, no. (1), pp, 26–36, . [Google Scholar]
18B. P. Wong and B. Kerkez. (2016), “Real-time environmental sensor data: An application to water quality using web services. ,” Environmental Modelling & Software, vol. 84, pp, 505–517, . [Google Scholar]
19W. Deng and G. Wang. (2017), “A novel water quality data analysis framework based on time-series data mining. ,” Journal of Environmental Management, vol. 196, pp, 365–375, . [Google Scholar]
20J. Wang, Y. Q. Yang, T. Wang, R. S. Sherratt and J. Y. Zhang. (2020), “Big data service architecture: A survey. ,” Journal of Internet Technology, vol. 21, no. (2), pp, 393–405, . [Google Scholar]
21X. Gong, B. Li, X. Chai and M. Gu. (2014), “Survey on big data platform technology. ,” Journal of System Simulation, vol. 3, pp, 489–496, . [Google Scholar]
22X. Yan and D. Zhang. (2013), “Big data research. ,” Computer Technology & Development, vol. 4, pp, 168–172, .
23Y. Low, D. Bickson, J. Gonzalez, C. Guestrin, A. Kyrola et al.. (2012). , “Distributed GraphLab: A framework for machine learning and data mining in the cloud. ,” in Proc. of the VLDB Endowment, vol. 8, no. (8), pp, 716–727, .
24H. G. Gong and X. L. Li. (2015), “A survey on big data systems. ,” Scientia Sinica Informationis, vol. 45, no. (1), pp, 1–44, . [Google Scholar]
25J. Xu, J. Zhu and H. Wang. (2018), Big Data Technologies and Application Series. Shanghai, China: Shanghai Scientific & Technical Press, pp, 46, . [Google Scholar]
26D. Keim, H. Qu and K. L. Ma. (2013), “Big-data visualization. ,” IEEE Computer Graphics & Applications, vol. 4, no. (4), pp, 20–21, . [Google Scholar]
27H. Zheng, Y. Hong, D. Long and H. Jing. (2016), “Monitoring surface water quality using social media in the context of citizen science. ,” Hydrology and Earth System Sciences, vol. 2, pp, 949–961, . [Google Scholar]
28A. Prajapati. (2020), “Data Visualization with ECharts in Angular using ngx-echarts”, . [Online]. Available: https://www.ngdevelop.tech/data-visualization-with-echarts-in-angular-using-ngx-echarts/. [Google Scholar]
29A. Paul, V. Ganesan and J. S. Challa. (2012), “HADCLEAN: A hybrid approach to data cleaning in data warehouses. ,” in Int. Conf. on Information Retrieval & Knowledge Management, Kuala Lumpur, Malaysia, pp, 136–142, . [Google Scholar]
30S. De, Y. Hu and Y. Chen. (2014), “Bayeswipe: A multimodal system for data cleaning and consistent query answering on structured big data,” in IEEE Int. Conf. on Big Data, Washington, DC, USA, pp, 15–24, .
31L. Zhang, L. Wang and L. Tan. (2017), “Data preprocessing,” Python Data Analysis and Mining, Beijing, China: Mechanical Industry Press, pp, 61–68, . [Google Scholar]
32 N. Zhang, A. Guo and T. Sun. (2017), “Research on data cleaning method based on SNM algorithm. ,” in IEEE 2nd Advanced Information Technology, Control Conf., Chongqing, China, pp, 2639–2643, . [Google Scholar]
33M. Bloodgood and B. Strauss. (2016), “Data cleaning for XML electronic dictionaries via statistical anomaly detection. ,” in IEEE Tenth Int. Conf., Laguna Hills, CA, USA, pp, 79–86, .
34N. Tang. (2015), “Big RDF data cleaning. ,” in IEEE Int. Conf. on Data Engineering, Seoul, Korea, pp, 77–79, . [Google Scholar]
35B. Wang, W. Li and N. Xiong. (2019), “Time-based access control for multi-attribute data in Internet of Things. ,” Mobile Networks and Applications, vol. 55, no. (1), pp, 1–11, . [Google Scholar]
36Y. S. Luo, K. Yang, Q. Tang, J. Zhang and B. Xiong. (2012), “A multi-criteria network-aware service composition algorithm in wireless environments. ,” Computer Communications, vol. 35, no. (15), pp, 1882–1892, . [Google Scholar]
37Y. Luo, K. Yang, Q. Tang, J. Zhang, P. Li et al.. (2016). , “An optimal data service providing framework in cloud radio access network. ,” EURASIP Journal on Wireless Communications and Networking, vol. 2016, no. (1), pp, 62, . [Google Scholar]
 | This work is licensed under a Creative Commons Attribution 4.0 International License, which permits unrestricted use, distribution, and reproduction in any medium, provided the original work is properly cited. |