DOI:10.32604/cmc.2020.012420
| Computers, Materials & Continua DOI:10.32604/cmc.2020.012420 | |
| Article |
Modelling Insurance Losses with a New Family of Heavy-Tailed Distributions
1Department of Statistics, Abdul Wali Khan University, Mardan, 23200, Pakistan
2Department of Statistics, Bahauddin Zakariya University, Multan, 60800, Pakistan
3Department of Natural Sciences and Humanities, University of Engineering and Technology, Lahore, 54000, Pakistan
4Department of Statistics, Yazd University, Yazd, 89175-741, Iran
5School of Information Science and Technology, Yunnan Normal University, Kunming, 650500, China
*Corresponding Author: Wei Gao. Email: gaowei@ynnu.edu.cn
Received: 30 June 2020; Accepted: 05 August 2020
Abstract: The actuaries always look for heavy-tailed distributions to model data relevant to business and actuarial risk issues. In this article, we introduce a new class of heavy-tailed distributions useful for modeling data in financial sciences. A specific sub-model form of our suggested family, named as a new extended heavy-tailed Weibull distribution is examined in detail. Some basic characterizations, including quantile function and raw moments have been derived. The estimates of the unknown parameters of the new model are obtained via the maximum likelihood estimation method. To judge the performance of the maximum likelihood estimators, a simulation analysis is performed in detail. Furthermore, some important actuarial measures such as value at risk and tail value at risk are also computed. A simulation study based on these actuarial measures is conducted to exhibit empirically that the proposed model is heavy-tailed. The usefulness of the proposed family is illustrated by means of an application to a heavy-tailed insurance loss data set. The practical application shows that the proposed model is more flexible and efficient than the other six competing models including (i) the two-parameter models Weibull, Lomax and Burr-XII distributions (ii) the three-parameter distributions Marshall-Olkin Weibull and exponentiated Weibull distributions, and (iii) a well-known four-parameter Kumaraswamy Weibull distribution.
Keywords: Weibull distribution; actuarial measures; heavy-tailed distributions; estimations; insurance losses
Modelling insurance risk data using a heavy tailed distribution has obtained more importance and interest for actuaries. Mostly the Insurance risk data sets are positively skewed, more peaked than meso-kurtic, unimodal and owns thick right tail; for detail, we refer to [1–3]. To obtain the estimates of business risk for insurance risk data sets, the heavy tailed distributions are very effective and suitable and gives more good fit to the data than the other models, see [4–6]. Heavy-tailed distributions have plays a major role and have great importance in the actuarial sciences offering the best description of the claim size distributions; see [7,8].
Realising the significance of these types of data modelling, researchers have shown a great interest in proposing new statistical models appropriate for modelling such data. A few of such models used for modelling insurance risk data and risk returns are Weibull, Pareto, Lognormal and gamma distributions, see for detail [9]. However, there are very few probability models in the literature which has the capability to model data with the aforesaid features, therefore, it is necessary to propose new models to fit the insurance risk data, financial returns; for more detail we refer the interested readers to [10–17].
Studying the above literature, we are inspired to develop more dynamic probability models that are flexible in data fittings. Henceforth, in this article, our main objective is to suggest a new family of heavy-tailed (for short, NEFHT) models for modelling heavy tailed data. Several characterizations of the NEFHT distributions will be discussed here. Our research focuses on the special sub case of the NEFHT distributions, named as, a new heavy-tailed Weibull (NEHTW) distribution. Moreover, the most widely used maximum likelihood method of estimation is taken into conderation for estimation of the unknown model parameters. Furthermore, value at risk (VaR) and tail value at risk (TVaR) also computed. At last, we are concentrating our contemplations on the conclusions obtained from the NEHTW distribution fitted to insurance data.
The cumulative distribution function (cdf) of the NEFHT distributed random variable say X, is follows:

where  and
and  represents the cdf of the baseline model. This might rely mostly upon the vector parameter
  . An interesting motivation of the proposed approach is that it has not been adopted yet. Henceforward, based on the introduced approach, several new model can be derived. The probability density function (pdf) corresponding to Eq. (1) is

Henceforth, representing  a random variable having density function given in Eq. (2).
The main objective of the present work is to develop and examine the proposed family in order to get new models appropriate for modelling financial data sets. Its key advantage is that it offers more flexibility to the resulting models by inserting just one extra parameter instead of including two or three parameters as appeared in other methods. Based on the NEFHT family of distributions, we introduce a three-parameter NEHTW model and give a comprehensive description of some of its mathematical properties so that it will attract the wider applications in insurance sciences and other related areas of research.
The rest of this article is structured in the different sections illustrated as: In Section 2, we have incorporated the NEHTW model and several plots displayed for its density. Section 3 contains mathematical properties including quantile function and moments. Section 4 focuses on the estimation and simulation studies of the recently recommended family. Actuarial measures VaR and TVaR of the NEHTW model are derived and based on these measures, a simulation study is conducted in Section 5. Section 6 offers insurance data modeling, While the Section 7 presented the final conclusion of the paper.
This portion of the article presents a particualr sub case of NEHT family by using the cdf of Weibull distribution with scale and shape parameters  respectively. The expressions for the cdf and pdf of the Weibull model is given by
  and
and 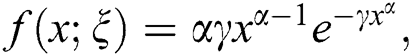 respectively. Where
  The NEHTW model’s cdf is provided by the following expression.

with density function

The pdf plots of the NEHTW model for selected parameter values are presented in Fig. 1.
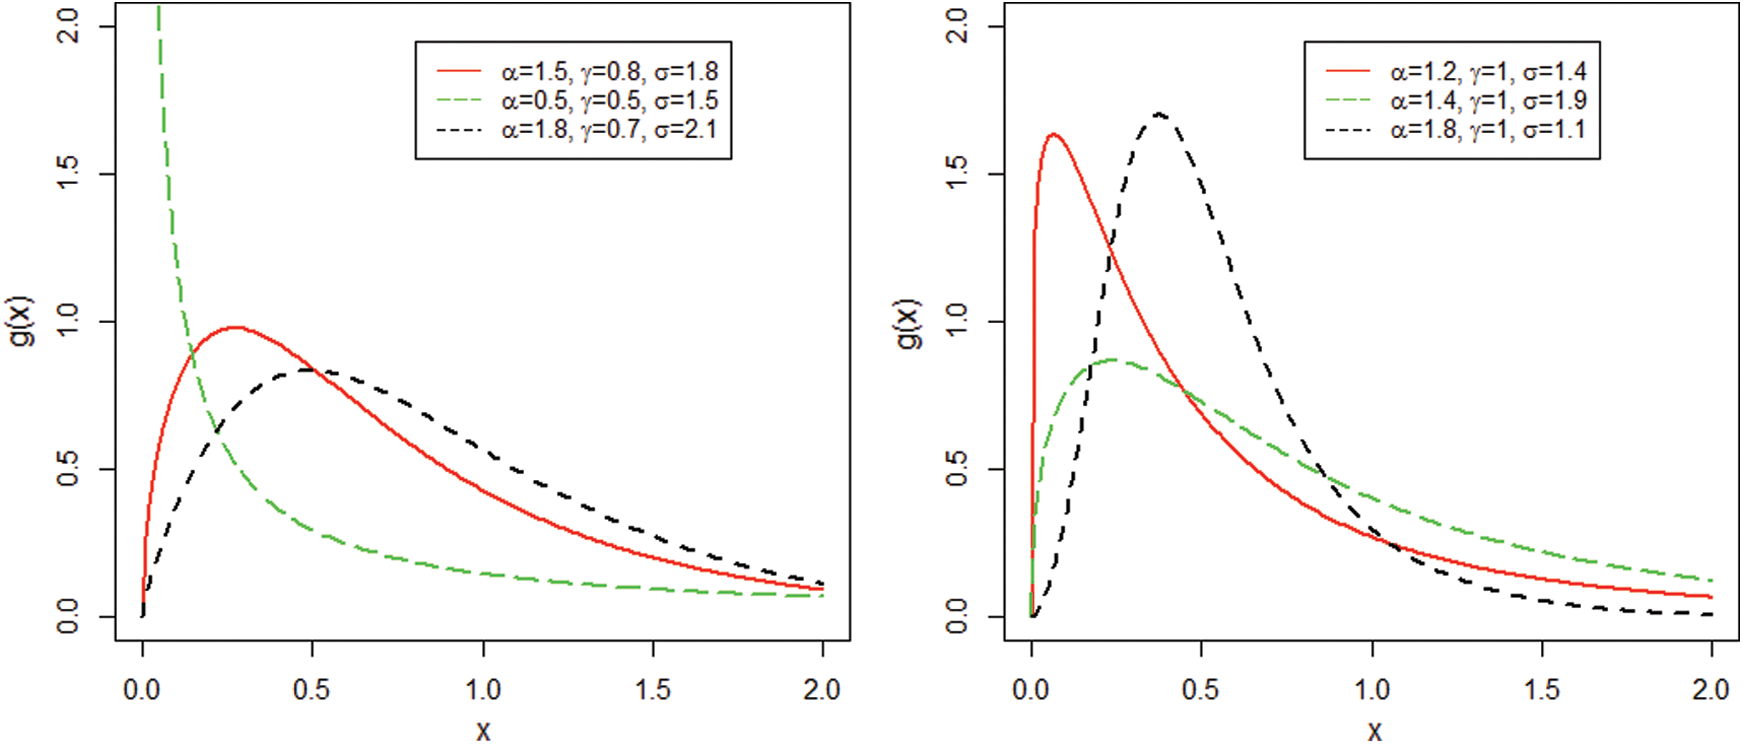
Figure 1: The NEHTW model pdf for specified values of the parameters
This section presents some important characterizations of the NEFHT family.
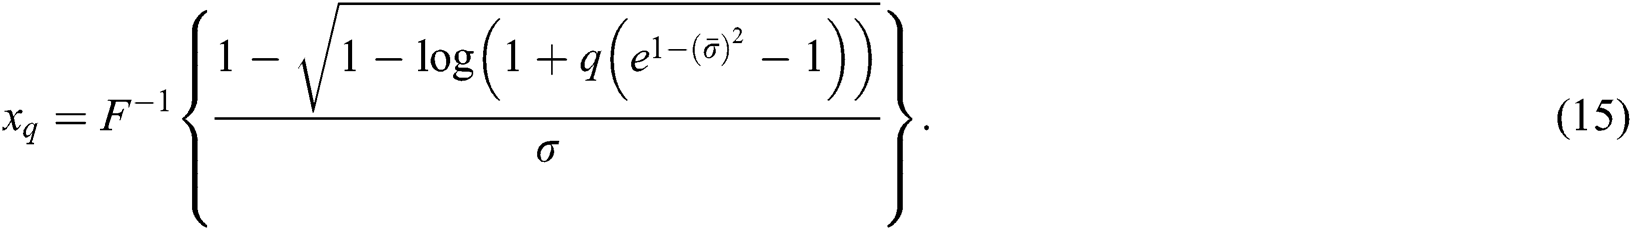
Quantile function is extensively utilized for collecting samples from a specific model. The quantile function of X, represented by  , where
  NEFHT, is exhibited by the expression given by Eq. (5) as
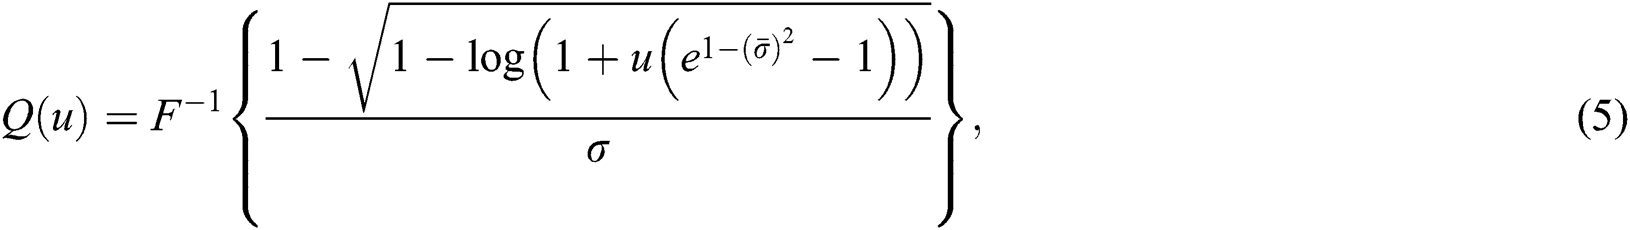
where  The quantile function is used to measure the effect of the shape parameters on the skewness and kurtosis. Henceforth, via using Eq. (5), we obtained the expressions for skewness and kurtosis. The formulas for skewness and kurtosis are presented by the following expressions.
Skewness 
and the Moor’s kurtosis is
Kurtosis 
Usually, these measures are slightly influenced by the extreme observations. For  and different values of
  and
and  graphs for the skewness, mean, variance and kurtosis of the proposed model are sketched in Figs. 2 and 3.
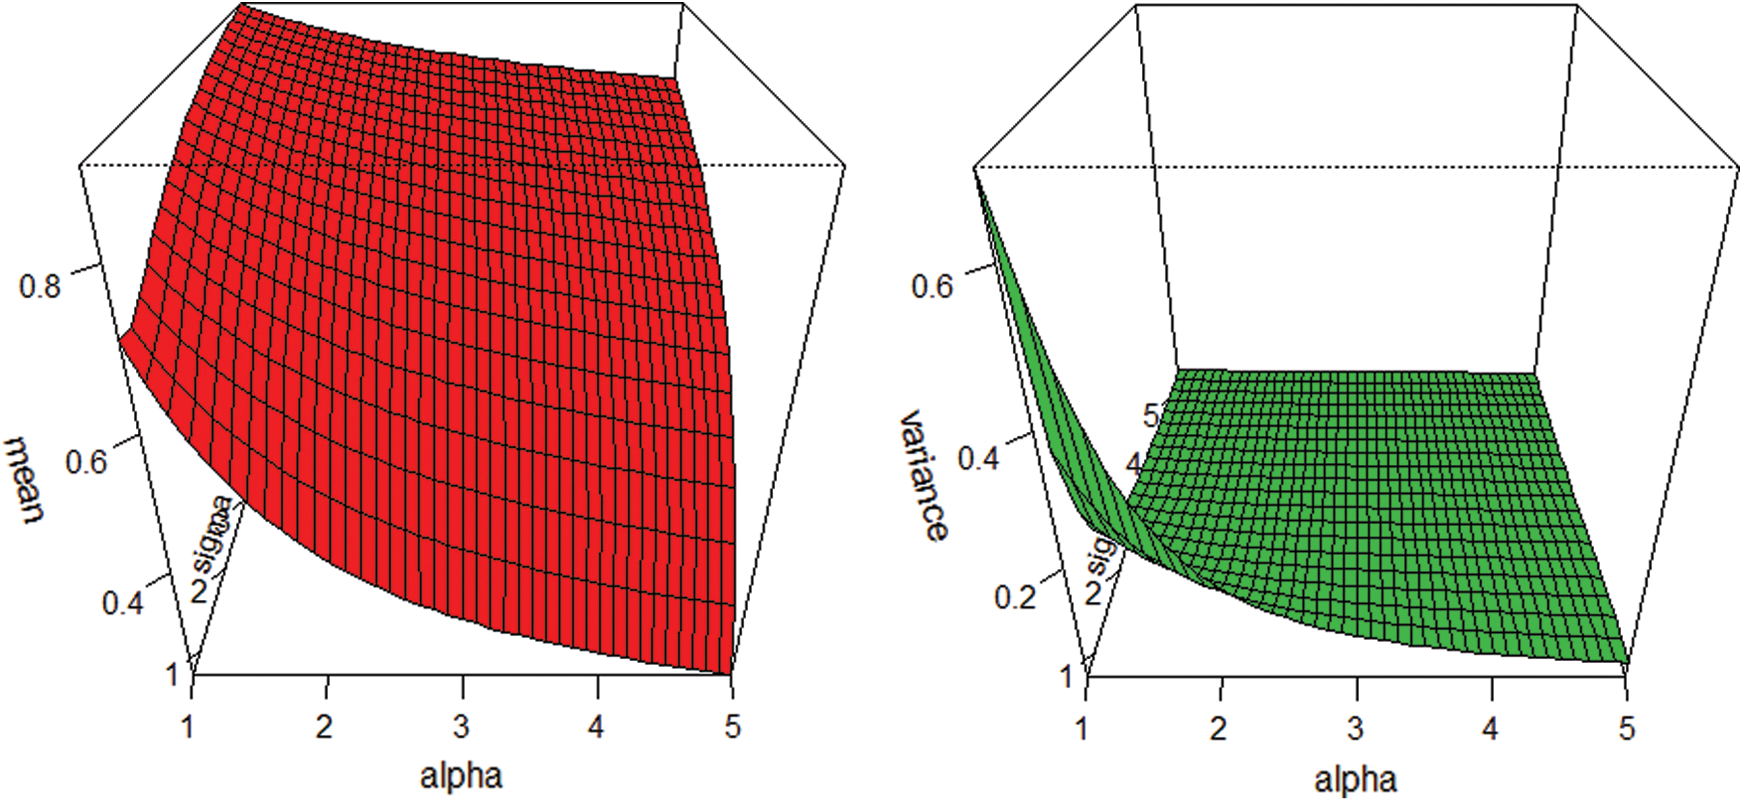
Figure 2: Graphs for the mean and variance of the NEHTW model
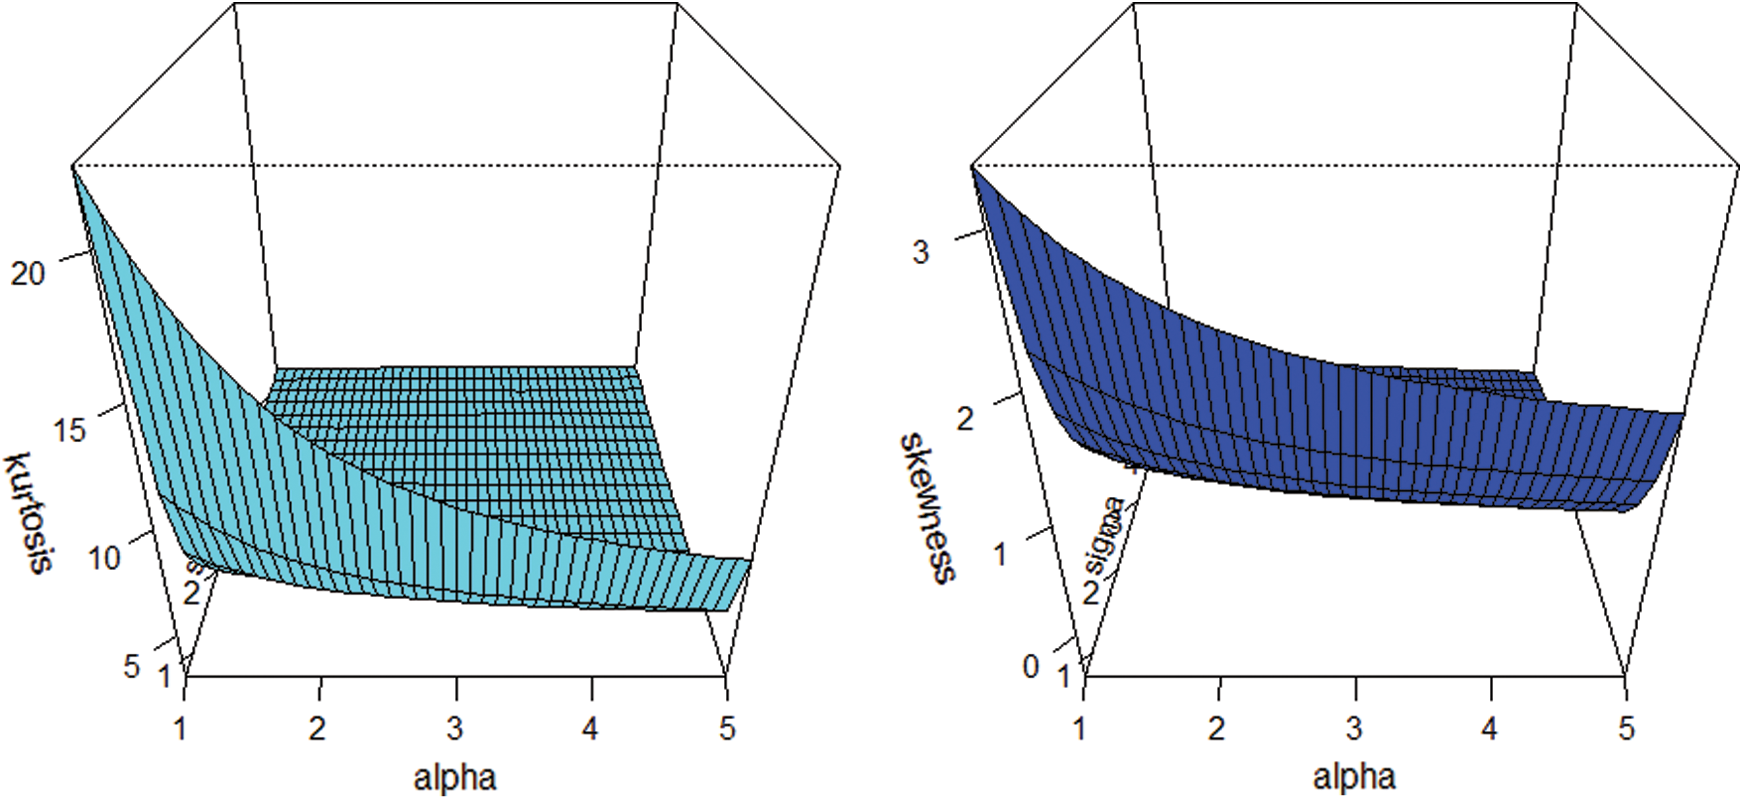
Figure 3: Plots for the skewness and kurtosis of the NEHTW model
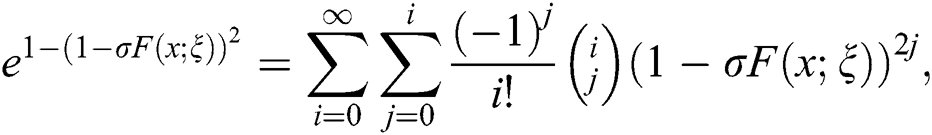
Suppose a random variable X has the NEFHT distribution. Then, its rth moments can be obtained as follows:

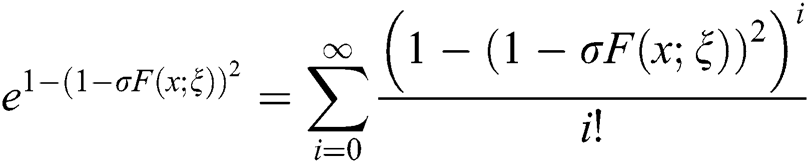
Using the series, we have

Replacing x by  in Eq. (7), we have

Using Eq. (8) in Eq. (6), we get

where, 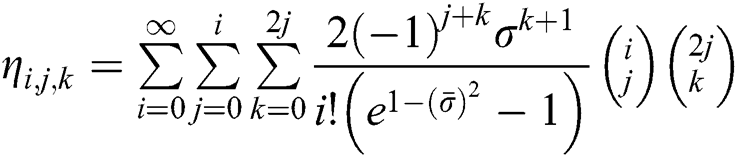 From Eq. (9), we have

where,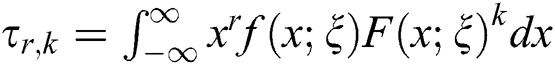 and
and 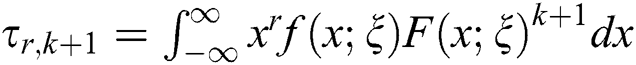
The moment generating function (mgf), say  of the NEFHT distributions can be obtained as follows

Using Eq. (10) in Eq. (11), the study obtains the mgf of the NEFHT distributions.
4 Estimation of Paramters and Monte Carlo Simulation
The following sub-section provides a well-known approach for estimation of unknown model parameters, named as maximum likelihood method estimation. Moreover, for assessing the nature of the maximum likelihood estimators (MLEs), a comprehensive analysis is performed.
This section focuses on the estimation of model parameters of the NEFHT family via the ML method of estimation. Let  be a set of observations of size n from the density function given in Eq. (2). Corresponding to Eq. (2), the log-likelihood function (LLF) is
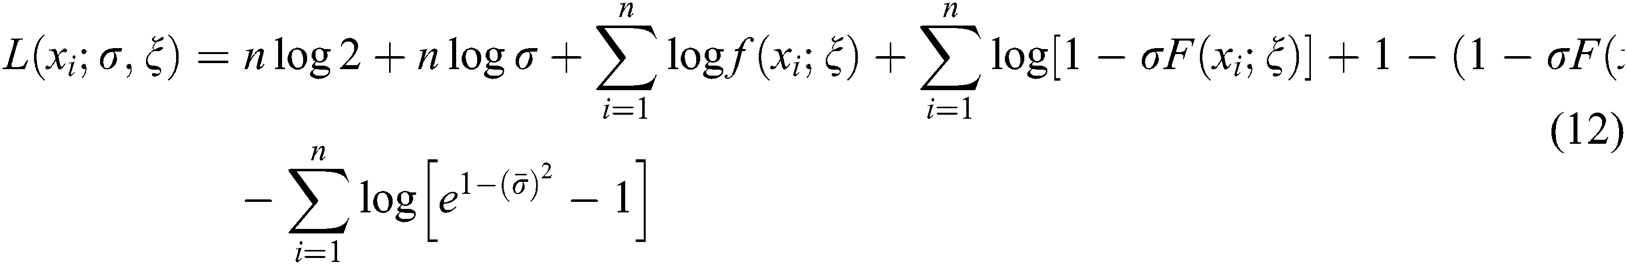
By differentiating Eq. (12), we can maximize the LLF either directly or via using a computer software. Here, the MLEs are obtained by adopting the computer software R-program with the “L-BFGS-B” programme. On behalf of the parameters, the partial derivatives of Eq. (12) are

and

Equating  and
and 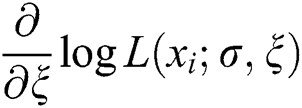 to zero, yields the MLEs of
  .
.
4.2 The Monte Carlo Simulation Study
In this portion, a comprehensive Monte Carlo simulation analysis is considered for assessing the performance of the ML estimates. The simulation study is conducted using the NEHTW distribution. The generation of random numbers is successfully performed using the inverse cdf procedure from the NEHTW model through R software. The major steps taken while performing simulation study are given below:
•We produced different samples of sizes n = 25, 50, … , 1000 from the proposed model.
•MLEs of the parameters are derived.
•MSEs and biases are calculated as
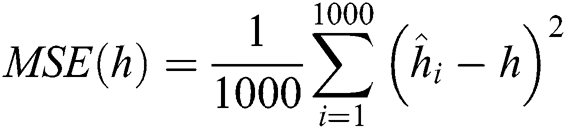 and
and 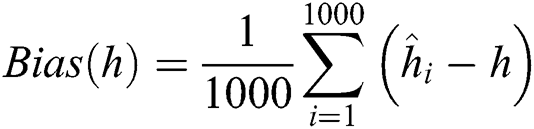 for
for  , respectively.
The numerical results of the simulation study are displayed in Figs. 4–7.
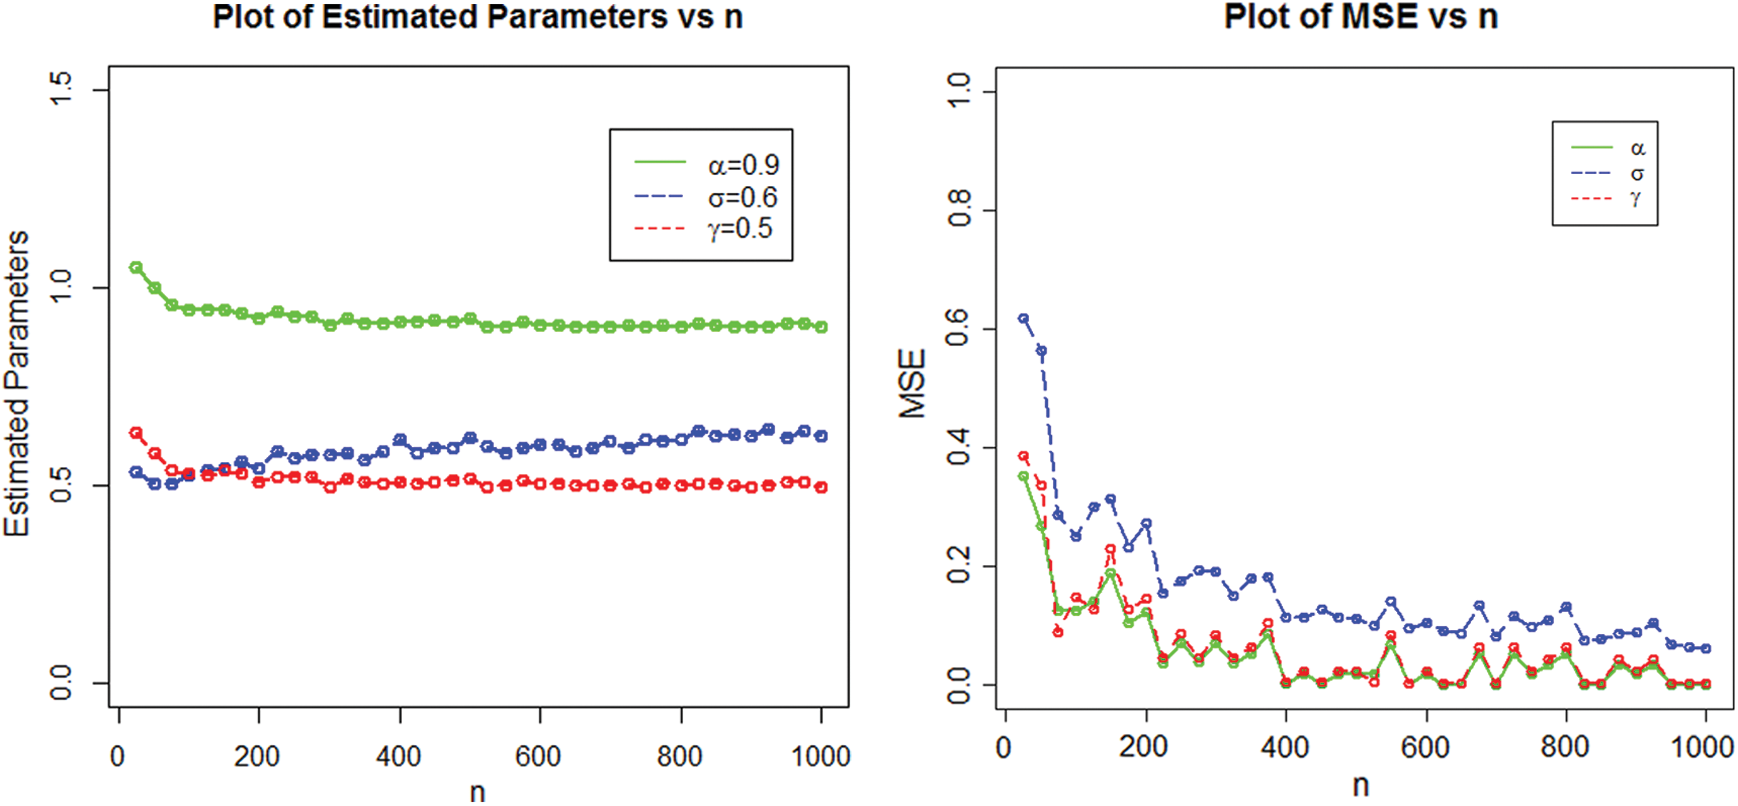
Figure 4: Estimated parameters and the MSEs of NEHTW distribution for 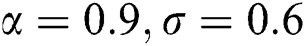 and
and 

Figure 5: Graphical display of the absolute biases and MSE of the NEHTW distribution for  and
and 
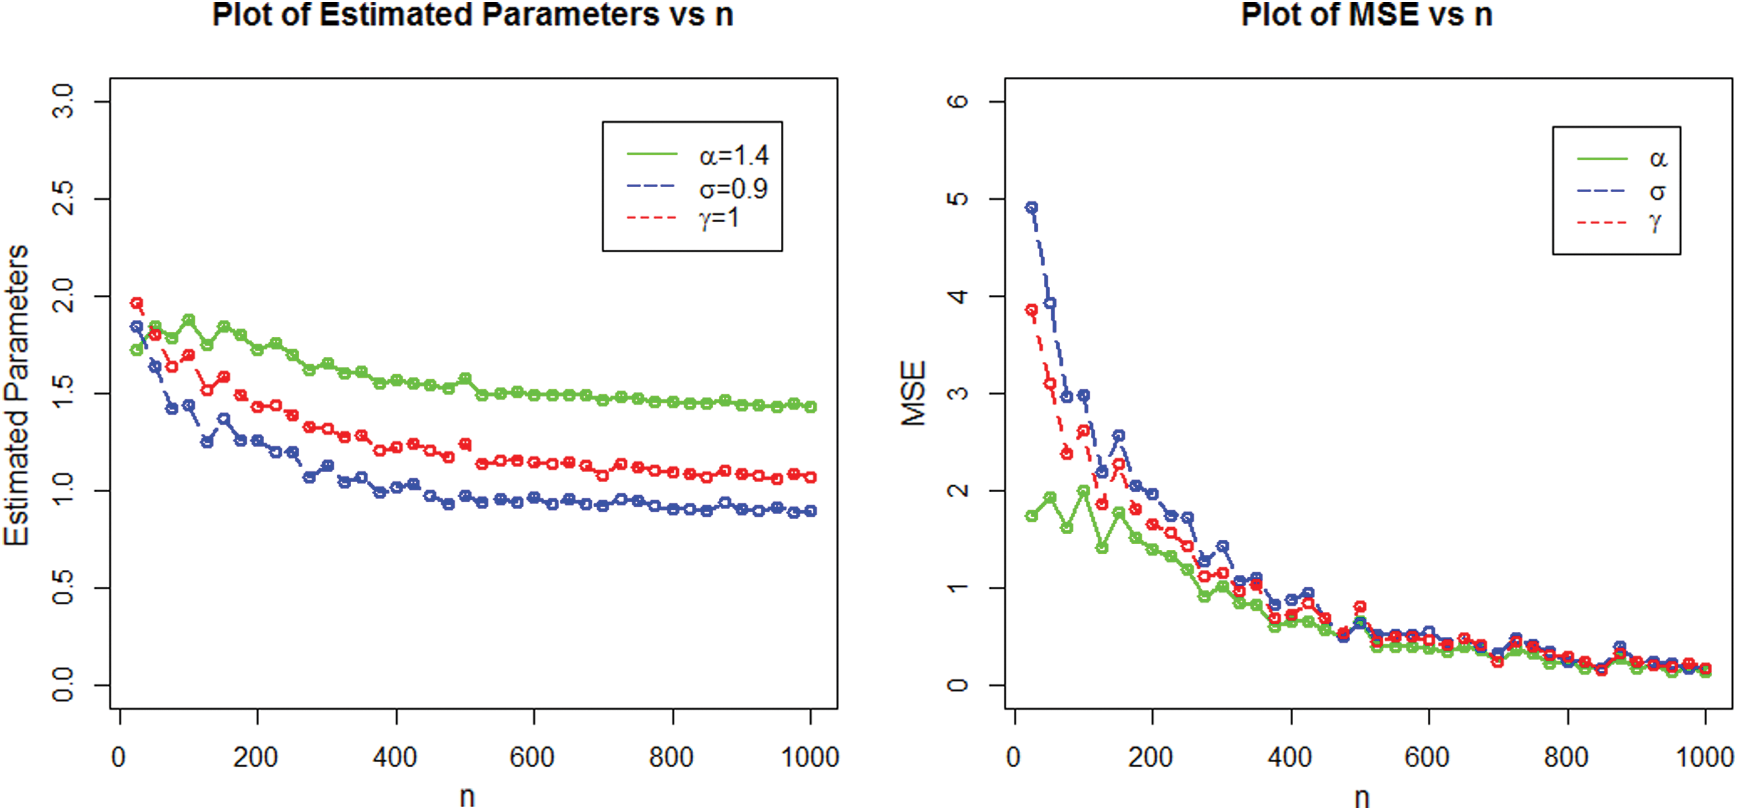
Figure 6: Plots of the estimated parameters and the MSEs of NEHTW distribution for  and
and 
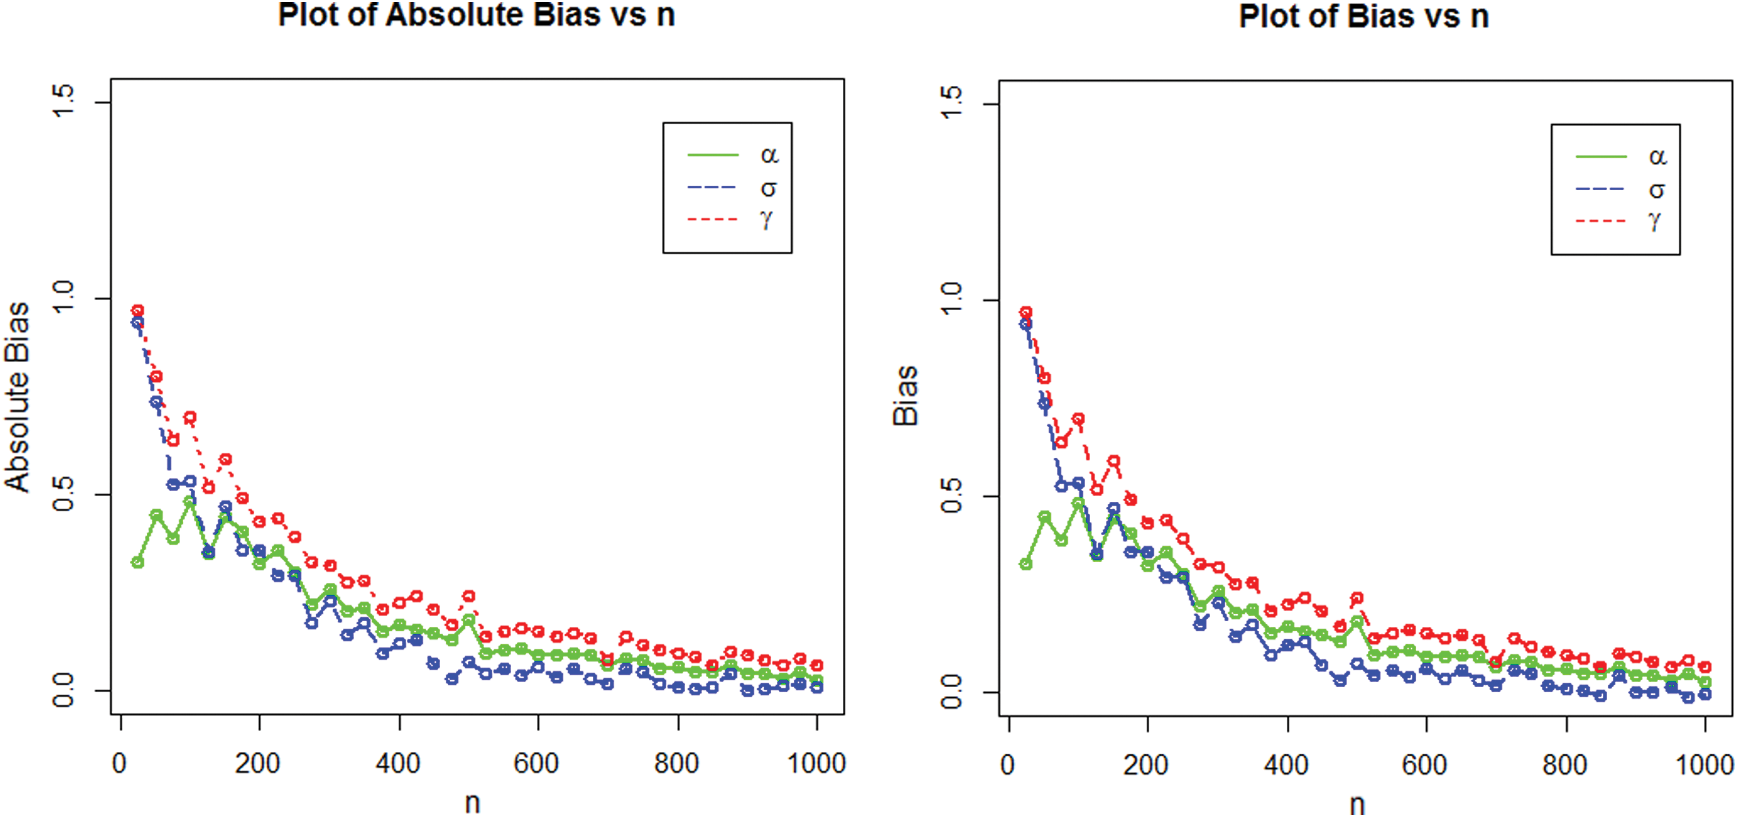
Figure 7: Graphical presentation of the absolute bias and bias for NEHTW distribution using  and
and 
One of the major role of financial science organizations is to determine the market loss. This portion contains the computation of some essential risk measures named as, VaR and TVaR for suggested model, which plays a key role in portfolio optimisation under the unpredictable situations.
The VaR is most widely considered by the professionals with in the field of insurance and finance to determine risk factor. The measure VaR is mostly specified with 90, 95 and 99% of the confidence level, representing the risk probability equal or greater than X percent of the time. The VaR measure of X is the  quantile of its cdf. If X has the density function provided in Eq. (2), then
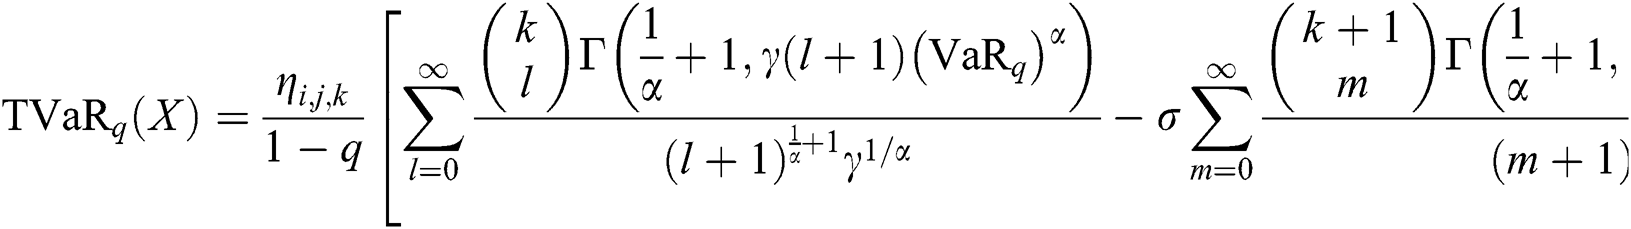
The TVaR is an essential technique used for the computation of the estimated value of the risk provided that an event turned out beyond a determined significance level has occurred. Let X be NEFHT distributioned random variable, then, the TVaR for the variable X can be determined as
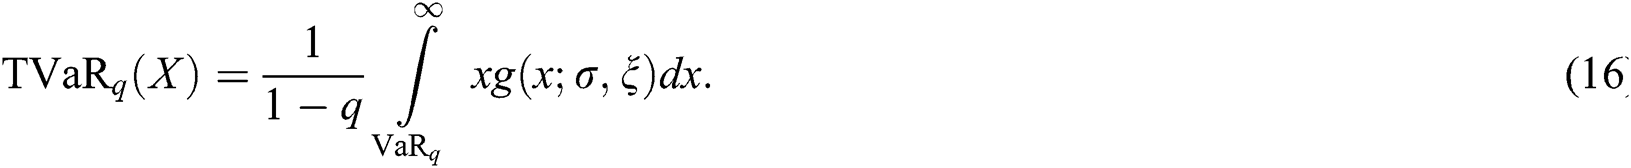
Using Eq. (2) in Eq. (16), we have
We presented a computational analysis of these risk measures using two parameter Weibull and proposed models for various combination of parameters values with in this section. This process is carried out as:
From the Weibull and NEHTW models, random samples of sizes n = 100 and 150 are obtained.
The parameters are estimated via the MLE approach.
The process is replicated 1000 times to acquire the numerical figures for VaR and TVaR for comparing the competitive models.
The TVaR and TVaR measures are reported in Tabs. 1 and 2. In the support of Tabs. 1 and 2, the graphs of the VaR and TVaR utilizing the proposed and Weibull models are sketched Figs. 8 and 9, respectively.
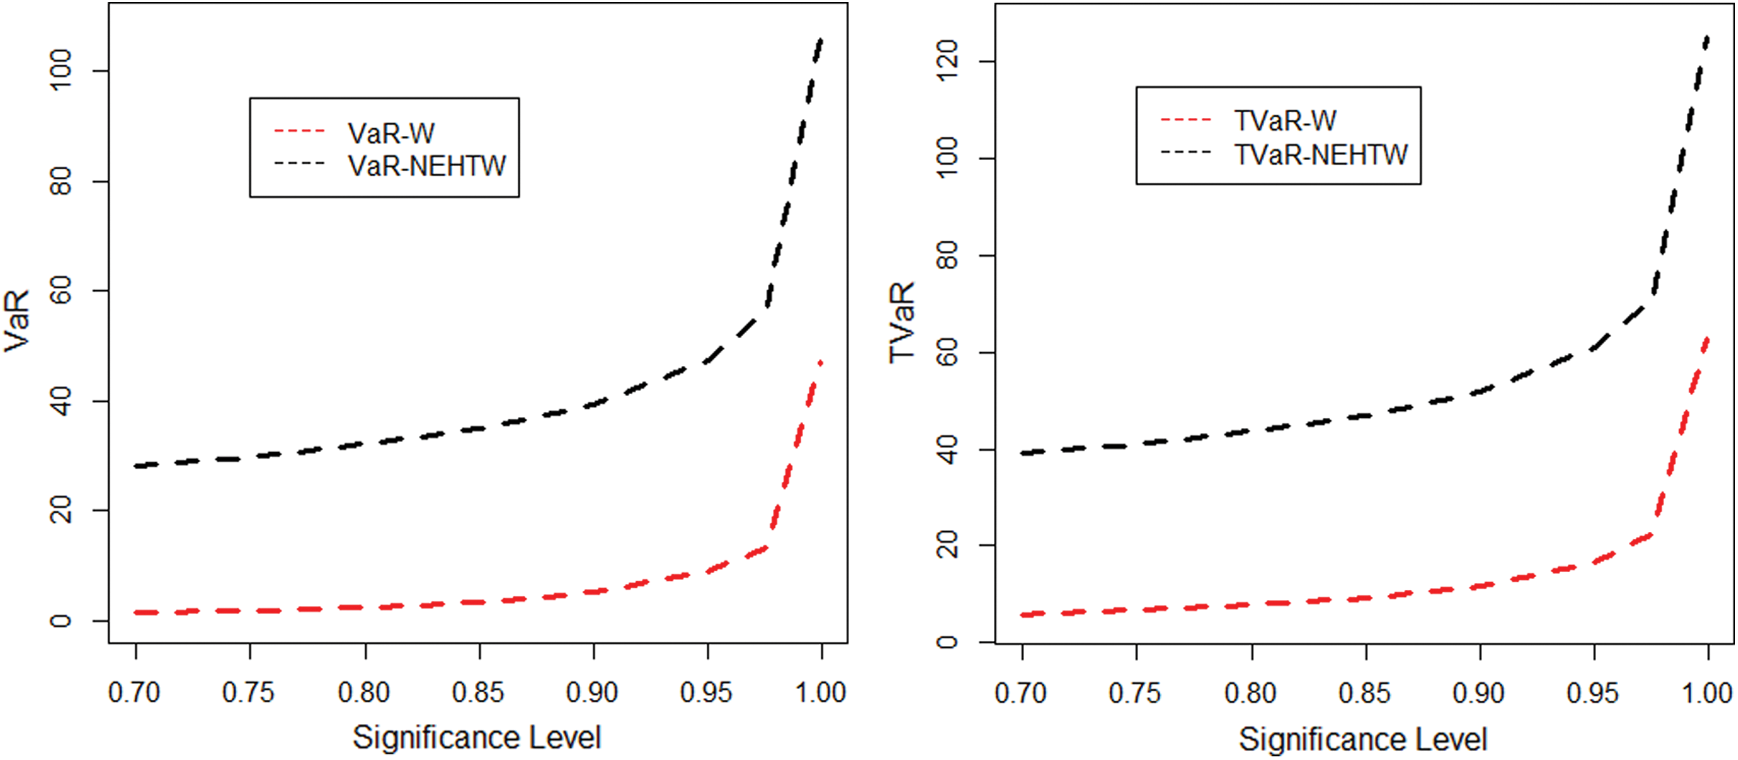
Figure 8: The graphical display of the results given in Tab. 1
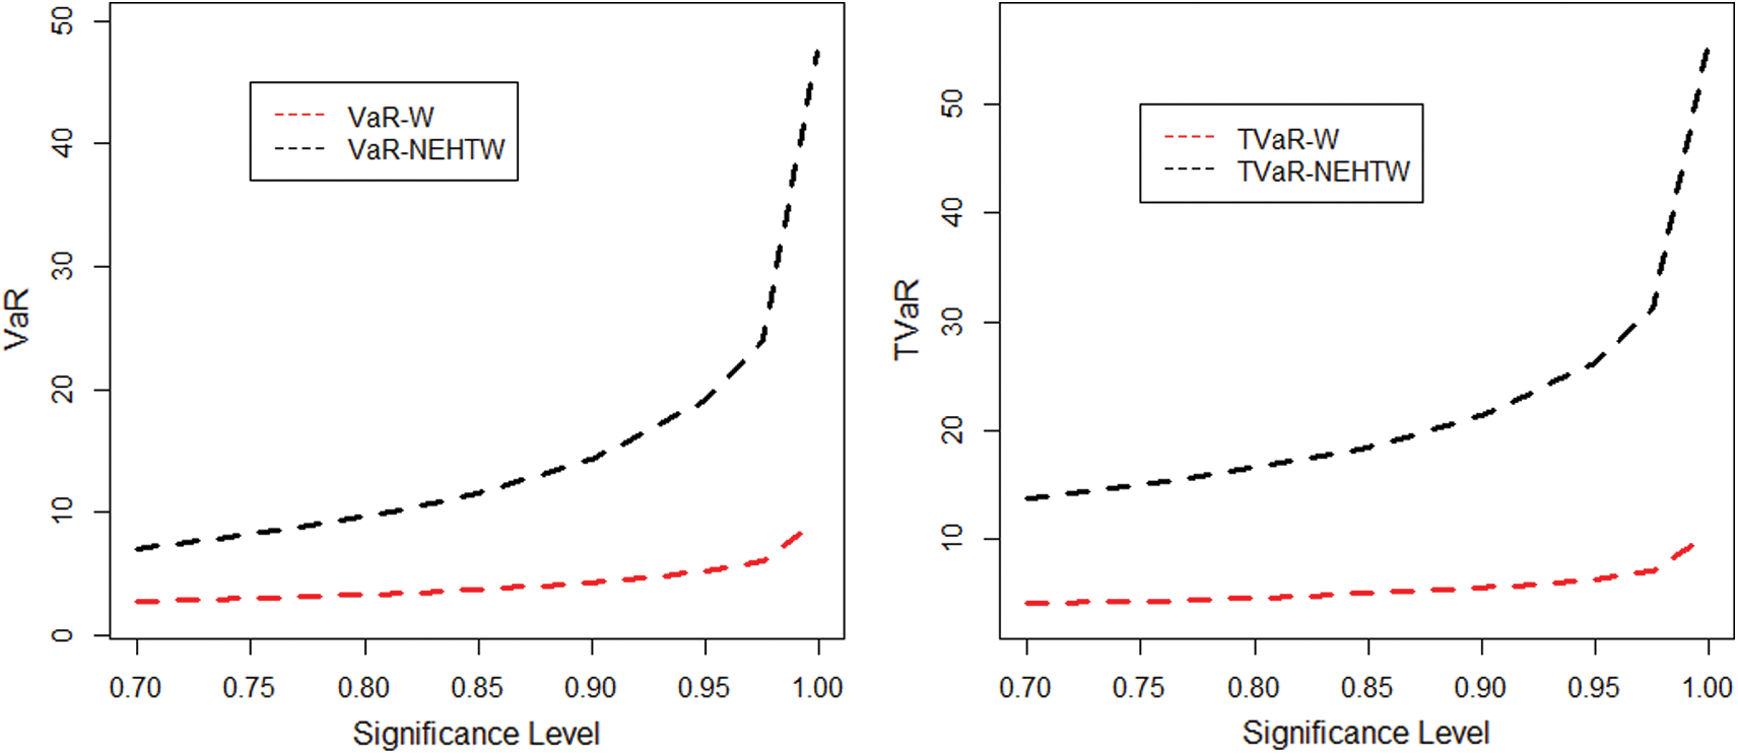
Figure 9: The graphical display of the results provided in Tab. 2
Table 1: The simulated results for the VaR and the TVaR for n =100
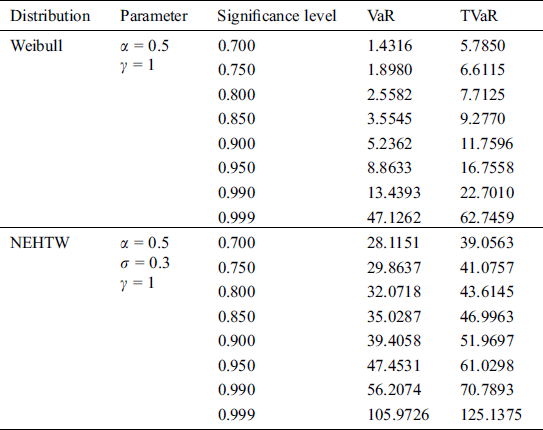
Table 2: The simulated results of the VaR and the TVaR for n = 150
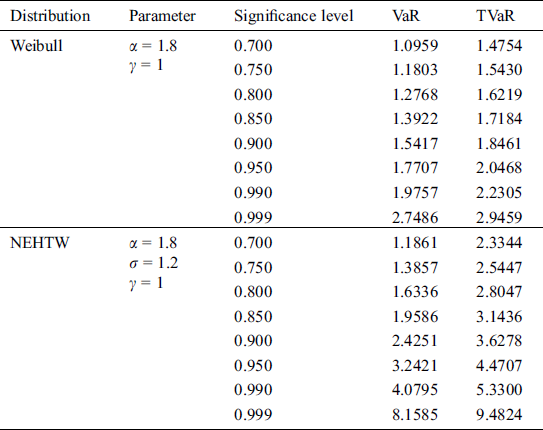
The comprehensive simulation study is conducted for suggested and Weibull model. A model is considered to be a heavy tailed, if the risk assessment values are higher. The results given in Tab. 1 and 2 exhibits, that the computed risk figures of the suggested model are higher than the standard Weibull distribution. The graphical display of the simulation results is portrayed in Figs. 8 and 9, expressing the suggested model as more heavy tailed than the Weibull distribution.
The heavy tailed models are prominently used for measuring the risk values of the data. We have considered an insurance loss data, in order to assess the performance of the proposed model. Moreover, the study provides simplified calculations of the actuarial measurements while using the existing data set for the Weibull and NEHTW models.
6.1 Application to the Vehicle Insurance Loss Data
The link given in this subsection, provides the insurance loss data available at http://www.businessandeconomics.mq.edu.au/our_departments/Applied_Finance_and_Actuarial_Studies/research/books/GLMsforInsuranceData/data_sets. To determine the better fit of our suggested model, we have compared our proposed model with other recognized famous distributions. The competing distributions contains the Weibull, Exponentiated Weibull (EW), Kumaraswamy Weibull (Ku-W), Marshall-Olkin Weibull (MOW), Lomax and Burr–XII (BX-II) models.
The maximum likelihood estimates of the model parameters are presented in Tab. 3. Whereas the model adequacy is evaluated by the well-known measures such as Hannan-Quinn information criterion (HQIC), Akaike information criterion (AIC), Bayesian information criterion (BIC) and Consistent Akaike Information Criterion (CAIC). The results of these measures are presented in Tab. 4.
Table 3: The ML estimates of the NEHTW and other compared distributions
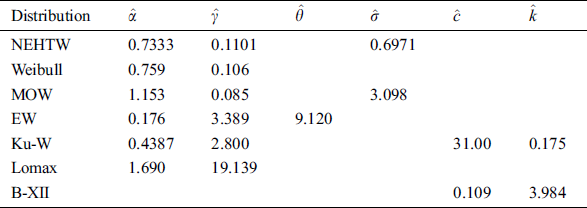
Table 4: Computational analysis of the NEHTW and six competing models
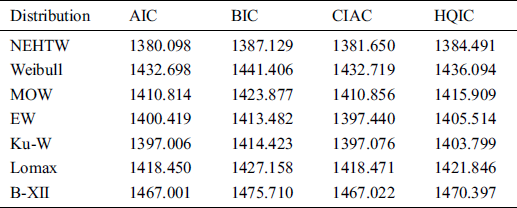
The researchers always interested in a smaller values resulted by the aforesaid measures. Tab. 4 offers the final results of these measures, which illustrates that our suggested NEHTW model delivers a superior fit than the other competent models. Furthermore, using the insurance loss data, the fitted plots of the cdf, pdf, Kaplan Meier and probability-probability (PP) plots of the NEHTW models are presented in Figs. 10 and 11 respectively.
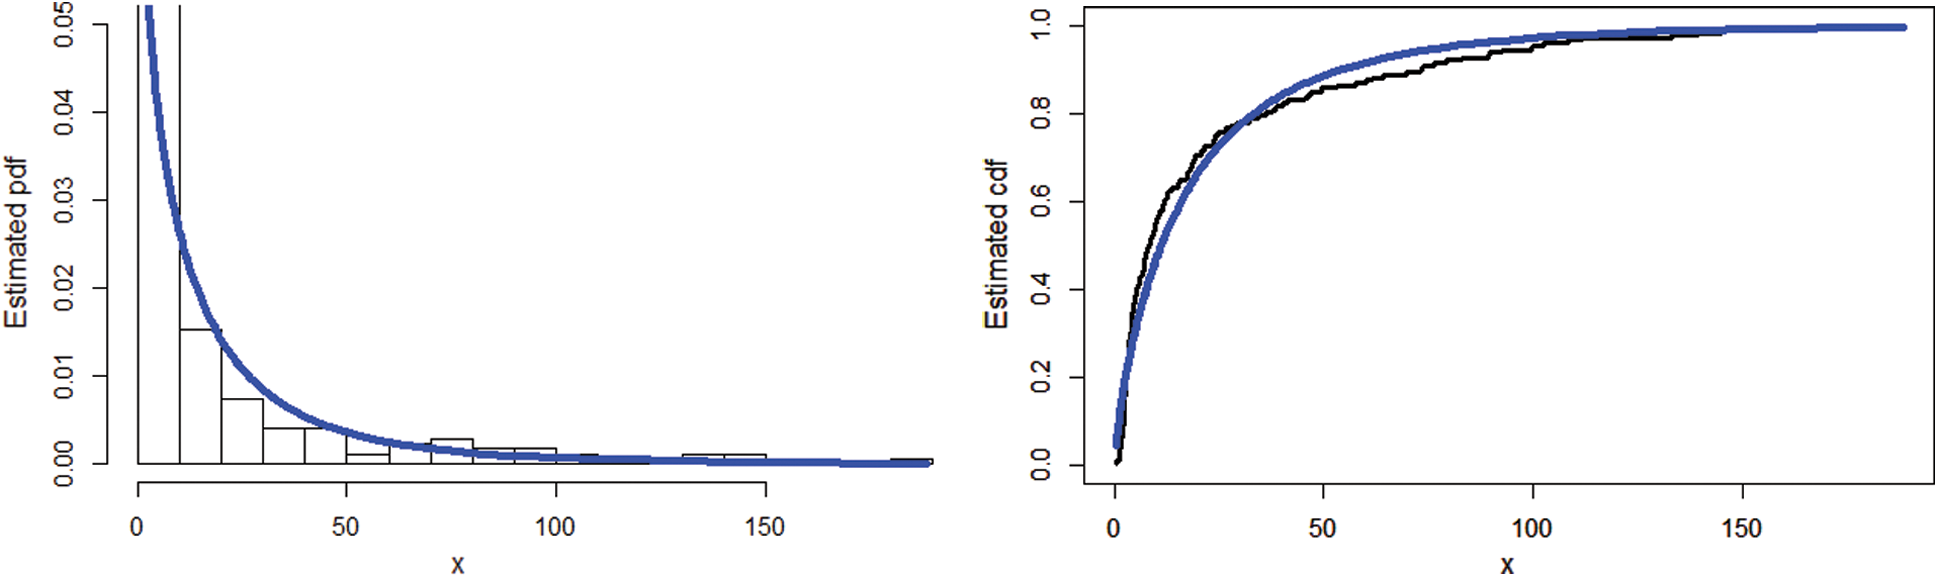
Figure 10: The estimated pdf together with the cdf of the NEHTW distribution
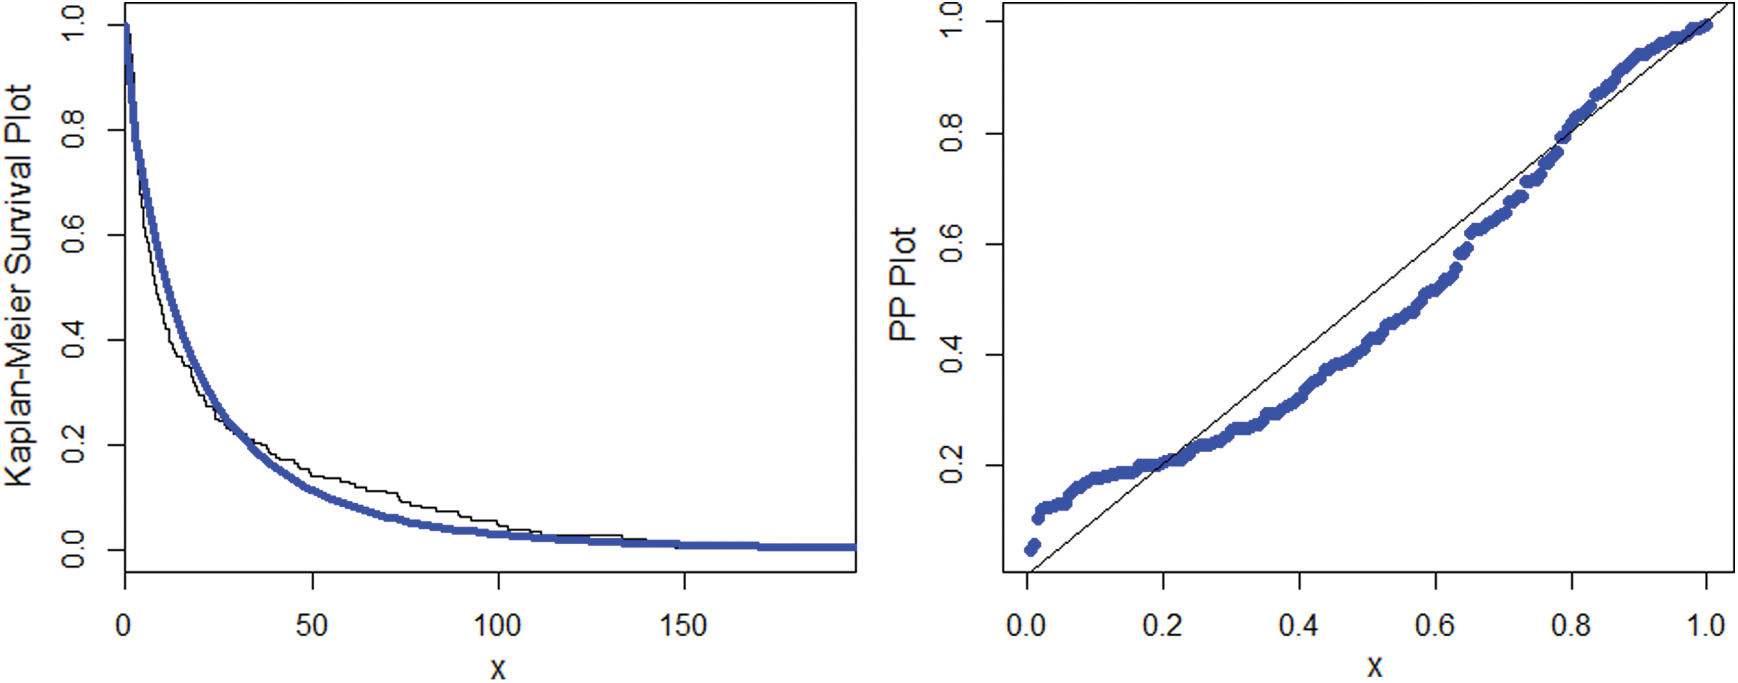
Figure 11: Sketch of the Kaplan Meier and PP plots for the NEHTW model
6.2 Calculation of Actuarial Measures Using Insurance Data
Here we have considered an insurance data set already used in Section 6.1, in order to compute the numerical values of VaR and TVaR and to compare the Weibull and NEHTW distribtuions. The obtained results of the VaR and TVaR, while considering different intervals of significance levels are illustrated in Tab. 5.
Table 5: The actuarial measures using vehicle insurance loss data
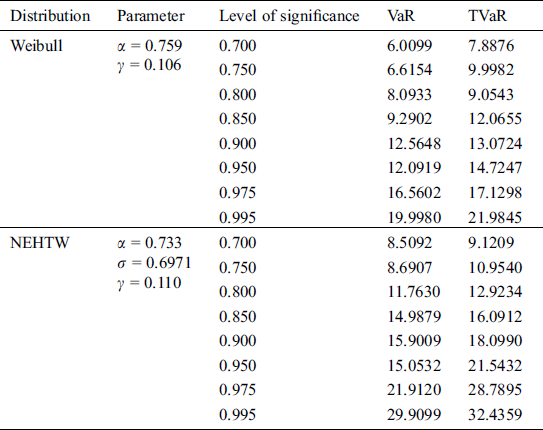
From the above discussion, it is clearly shown that while modelling data, as the risk value of a model increases, the model becomes heavier tailed. From the calculated values given in Tab. 5, it is the evident that the NEHTW model possess more longer tail than the existing Weibull model, which gives the testimony of the NEHTW as a strong candidate model for modelling insurance data sets.
In this article, we have provided the most flexible and prominent family, named as, new extended family of heavy tailed distributions. A specific three parameter form of the NEFHT class of distributions, named as, NEHTW distribution is studied, which has the capability to model heavy tailed data sets. Various basic statistical characterization have been studied. The estimates of the unknown model parameters are estimated via the most widely used ML method. A detailed evaluation of the of the simulation study is done to investigate the efficiency of the estimators. Moreover, the significance of the NEHTW model is illustrated via a practical application of the insurance loss data set. The practical application demonstrates that the NEHTW model is a prominent alternate model for modelling insurance losses. We expect that the new techniques will motivate the researchers for applications in actuarial sciences and many more different fields of research.
Funding Statement: The author(s) received no specific funding for this study.
Conflicts of Interest: The authors declare that they have no conflicts of interest to report regarding the present study.
References
1Z. Ahmad, M. E. Mahmoudi and G. G. Hamedani. (2019), “A family of loss distributions with an application to the vehicle insurance loss data. ,” Pakistan Journal of Statistics and Operation Research, vol. 13, pp, 731–744, .
2Z. Ahmad, E. Mahmoudi and M. Alizadeh. (2020), “Modelling insurance losses using a new beta power transformed family of distributions. ,” Communications in Statistics-Simulation and Computation, pp, 1–22, .
3Z. Ahmad, E. Mahmoudi and S. Dey. (2020), “A new family of heavy tailed distributions with an application to the heavy tailed insurance loss data. ,” Communications in Statistics-Simulation and Computation, pp, 1–24, . [Google Scholar]
4X. Hao and Q. Tang. (2012), “Asymptotic ruin probabilities for a bivariate lévy-driven risk model with heavy-tailed claims and risky investments. ,” Journal of Applied Probability, vol. 49, no. (4), pp, 939–953, . [Google Scholar]
5Y. Yang, K. Wang, J. Liu and Z. Zhang. (2019), “Asymptotic for a bidimensional risk model with two geometric Lévy price processes. ,” Journal of Industrial & Management Optimization, vol. 15, no. (2), pp, 481–505, .
6Z. Ahmad, E. Mahmoudi, S. Dey and S. K. Khosa. (2020), “Modeling vehicle insurance loss data using a new member of T-X family of distributions. ,” Journal of Statistical Theory and Applications, vol. 19, no. (2), pp, 133–147, . [Google Scholar]
7Z. Ahmad, E. Mahmoudi, G. G. Hamedani and O. Kharazmi. (2020), “New methods to define heavy-tailed distributions with applications to insurance data. ,” Journal of Taibah University for Science, vol. 14, no. (1), pp, 359–382, . [Google Scholar]
8C. Adcock, M. Eling and N. Loperfido. (2012), “Skewed distributions in finance and actuarial science: A review. ,” European Journal of Finance, vol. 21, no. (13–14), pp, 1253–1281, . [Google Scholar]
9M. Eling. (2012), “Fitting insurance claims to skewed distributions: Are the skew-normal and skew-student good models?. ,” Insurance: Mathematics and Economics, vol. 51, no. (2), pp, 239–248, . [Google Scholar]
10L. Bagnato and A. Punzo. (2013), “Finite mixtures of unimodal beta and gamma densities and the k-bumps algorithm. ,” Computational Statistics, vol. 28, no. (4), pp, 1571–1597, . [Google Scholar]
11R. Kazemiand and M. Noorizadeh. (2015), “A comparison between skew-logistic and skew-normal distributions. ,” Mathematica, vol. 31, no. (1), pp, 15–24, .
12Z. Landsman, U. Makov and T. Shushi. (2016), “Tail conditional moments for elliptical and log-elliptical distributions. ,” Insurance: Mathematics and Economics, vol. 71, pp, 179–188, .
13K. Abbas, N. Y. Abbasi, A. Ali, D. M. Khan and S. Manzoor et al.. (2019). , “Bayesian analysis of three-parameter Frechet distribution with medical applications. ,” Computational and Mathematical Methods in Medicine, vol. 2019, no. (93), pp, 1–8, .
14D. P. Scollnik and C. Sun. (2012), “Modeling with Weibull-Pareto model. ,” North American Actuarial Journal, vol. 16, no. (2), pp, 260–272, .
15A. Punzo. (2019), “A new look at the inverse Gaussian distribution with applications to insurance and economic data. ,” Journal of Applied Statistics, vol. 46, no. (7), pp, 1260–1287, .
16A. Punzo, L. Bagnato and A. Maruotti. (2018), “Compound unimodal distributions for insurance losses. ,” Insurance: Mathematics and Economics, vol. 81, pp, 95–107, .
17A. Punzo, A. Mazza and A. Maruotti. (2018), “Fitting insurance and economic data with outliers: A flexible approach based on finite mixtures of contaminated gamma distributions. ,” Journal of Applied Statistics, vol. 45, no. (14), pp, 2563–2584, . [Google Scholar]
 | This work is licensed under a Creative Commons Attribution 4.0 International License, which permits unrestricted use, distribution, and reproduction in any medium, provided the original work is properly cited. |