DOI:10.32604/cmc.2020.012502
| Computers, Materials & Continua DOI:10.32604/cmc.2020.012502 | |
| Article |
A Rasterized Lightning Disaster Risk Method for Imbalanced Sets Using Neural Network
1Nanjing University of Information Science & Technology, Nanjing, 210044, China
2Engineering Research Center of Digital Forensics, Ministry of Education, Nanjing, 201144, China
3Waterford Institute of Technology, Waterford, X91K0EK, Ireland
*Corresponding Author: Jin Han. Email: hjhaohj@126.com
Received: 02 July 2020; Accepted: 10 September 2020
Abstract: Over the past 10 years, lightning disaster has caused a large number of casualties and considerable economic loss worldwide. Lightning poses a huge threat to various industries. In an attempt to reduce the risk of lightning-caused disaster, many scholars have carried out in-depth research on lightning. However, these studies focus primarily on the lightning itself and other meteorological elements are ignored. In addition, the methods for assessing the risk of lightning disaster fail to give detailed attention to regional features (lightning disaster risk). This paper proposes a grid-based risk assessment method based on data from multiple sources. First, this paper considers the impact of lightning, the population density, the economy, and geographical environment data on the occurrence of lightning disasters; Second, this paper solves the problem of imbalanced lightning disaster data in geographic grid samples based on the K-means clustering algorithm; Third, the method calculates the feature of lightning disaster in each small field with the help of neural network structure, and the calculation results are then visually reflected in a zoning map by the Jenks natural breaks algorithm. The experimental results show that our method can solve the problem of imbalanced lightning disaster data, and offer 81% accuracy in lightning disaster risk assessment.
Keywords: Lightning disaster; neural network; imbalanced data
Lightning is one of the most serious public safety hazards, behind only drought and flooding. The direct and indirect losses caused by lightning disasters increase every year. Therefore, how to protect against a lightning disaster is a major concern among the scientific community. Regionalization of the lightning disaster risk refers to the method of a comprehensive analysis of relevant data, such as lightning data, lightning disaster data and geographic environment data, to delineate the spatial extent of the risk according to the Jenks natural breaks classification algorithm. Meteorological departments can formulate plans to prevent lightning based on the generated zoning map, and take certain actions in order to reduce the number of casualties and economic losses caused by lightning disasters.
The remainder of the paper is arranged as follows. Section 2 provides a brief description of the work related to lightning disaster risk assessment. Section 3 presents a machine learning algorithm for lightning disaster risk assessment. Section 4 describes the core data and schemes used in the experiment. In Section 5, the performance of the method is evaluated. We offer our concluding remarks in Section 6.
The risk assessment of lightning disasters is one of the most important ways to improve our ability to reduce and prevent lightning disasters. Some relevant researches analyze the factors that cause lightning disasters and the vulnerability of lightning-prone objects, and build appropriate models by combining lightning data, human casualties and economic property damage data, etc., to realize the risk division of lightning disasters. The core of risk assessment of lightning disaster lies in the method of weight assignments and in the establishment of an index evaluation system [1,2]. Li et al. [3] used lightning density, frequency of lightning disaster, loss of property and loss of lives to conduct the division of lightning disaster for Sanming City, with a weighted comprehensive evaluation method. Chen et al. [4] combined the weighted comprehensive evaluation method with statistical methods, disaster analysis and expert scoring to evaluate influencing factors. They used thunderstorm day (a meteorological term defined as a day in which thunder is heard) and lightning area density as two factors to analyze which zones are most vulnerable to lightning disaster in Anhui Province. According to the standard mathematical formula of natural disaster risk and the conceptual framework for flood disaster risk, Cui et al. [5] used the weighted comprehensive evaluation method and hierarchy analysis to evaluate the disaster risk and the vulnerable zones in Nanjing. The analytic hierarchy process (AHP) is based on opinions from experts and scholars in various areas of the field. Wang et al. [6] regarded states and cities as the analysis unit and used the information quantity method to evaluate the vulnerability of regional lightning disaster, then used the inverse deduction method to evaluate the vulnerability and division in Yunnan Province. Recently, Chen et al. [7] and Liu et al. [8] leveraged previous studies, and introduced population distribution, soil conductivity and other parameters to conduct a more comprehensive regionalization study. Although there are few relevant studies in this field in countries other than China, several international scholars have offered some significant ideas. Biswas et al. [9] proposed a GIS and IDW statistical model for the spatial vulnerability analysis of lightning hazards, and as a result, were able to determine the spatial heterogeneity of lightning risk. Nastos et al. [10] processed the lightning data by using the precision lightning network (PLN) to analyze the movement of thunderstorms from both temporal and spatial perspectives.
In summary, the study of lightning disaster assessment suffers from three deficiencies. First, when considering the weight of the evaluation index, the model uses the forms of expert scoring and questionnaire surveys, which rely on subjective factors to some extent. Second, some relevant studies focus on the lightning data itself, but ignore other conditions such as the demographic and economic factors of a region. Third, most lightning risk regionalization models use county (city, district) level administrative regions as basic units.
With the evolution of machine learning, the use of neural network algorithms in various research fields has increased, particularly in meteorology [11–13]. Researchers in the field of meteorology are using machine learning methods to identify meteorological cloud map, lightning clustering, rainfall prediction and air quality prediction [14]. A neural network is mainly divided into an input layer, a hidden layer and an output layer [15]. There can be multiple output layers, and each layer can contain multiple neurons. How to set the number of hidden layers and the number of neurons in each layer depends on the actual situation. The neural network usually involves two steps: Forward propagation and backpropagation. The weight of the network is updated by first forward passing the input to the final layer to calculate the error between the output and the real label, and then a backpropagation algorithm is used to minimize the error.
In response to the shortcomings of the current research, this paper proposes a rasterized lightning disaster risk assessment model for imbalanced sample sets based on neural networks. The rasterization refers to the rasterization of the entire Hunan Province, which is divided into 8953 geographic grids, each with a length of 5 km, and generates 8953 data objects. Fig. 1 shows the original geographic area rasterized in four geographic grids. Data grid processing enables the model to reflect the characteristics of small areas more deeply and finely, representing an improvement over the other researches, which were based only on administrative areas. During the experiment, we note that the data of lightning disaster are imbalanced. Some researchers in the fields of big data and machine learning have studied the problem of data imbalance with good results [16–18]. This paper proposes a method based on K-means algorithm to eliminate the imbalance of data and then trains the lightning disaster risk assessment model based on a neural network. This paper provides a reliable scheme for the assessment and prediction of lightning disaster that is much more objective than other models. The data used in this experiment include lightning data, lightning disaster data, geographical environment data, and population economic data to resolve the shortcoming of the previous researches focusing only on lightning data.
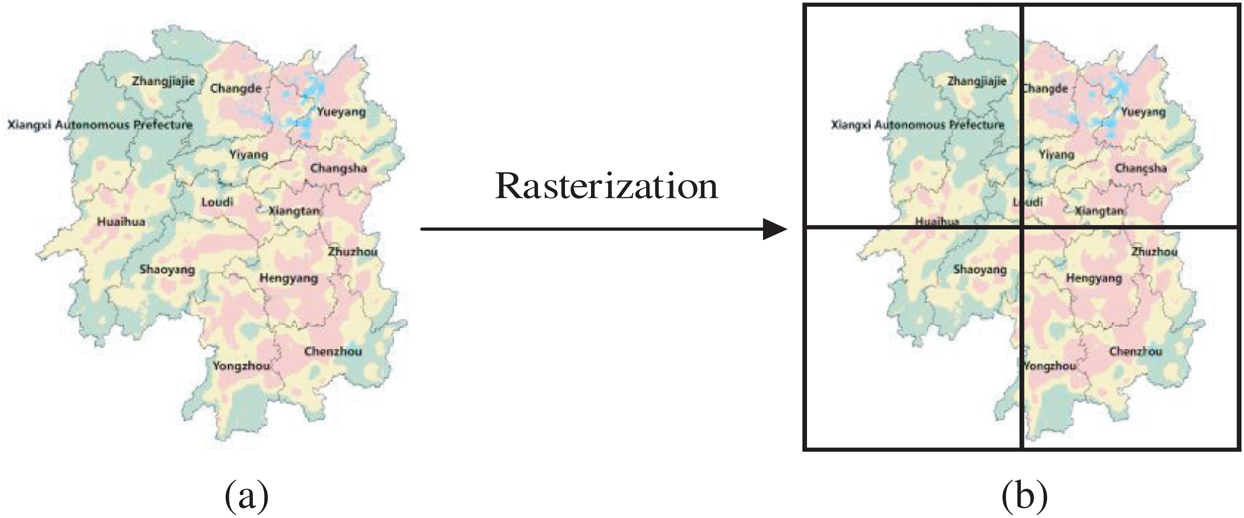
Figure 1: Geographical area rasterization. The (a) shows the original geographic area, and the (b) shows the area divided into four small grids
The risk assessment method of lightning disaster in this paper mainly consists of three tasks: data preprocessing, balancing the unbalanced data pertaining to lightning disaster and lightning, and a calculation method based on neural network. The flowchart of our method is shown in Fig. 2.
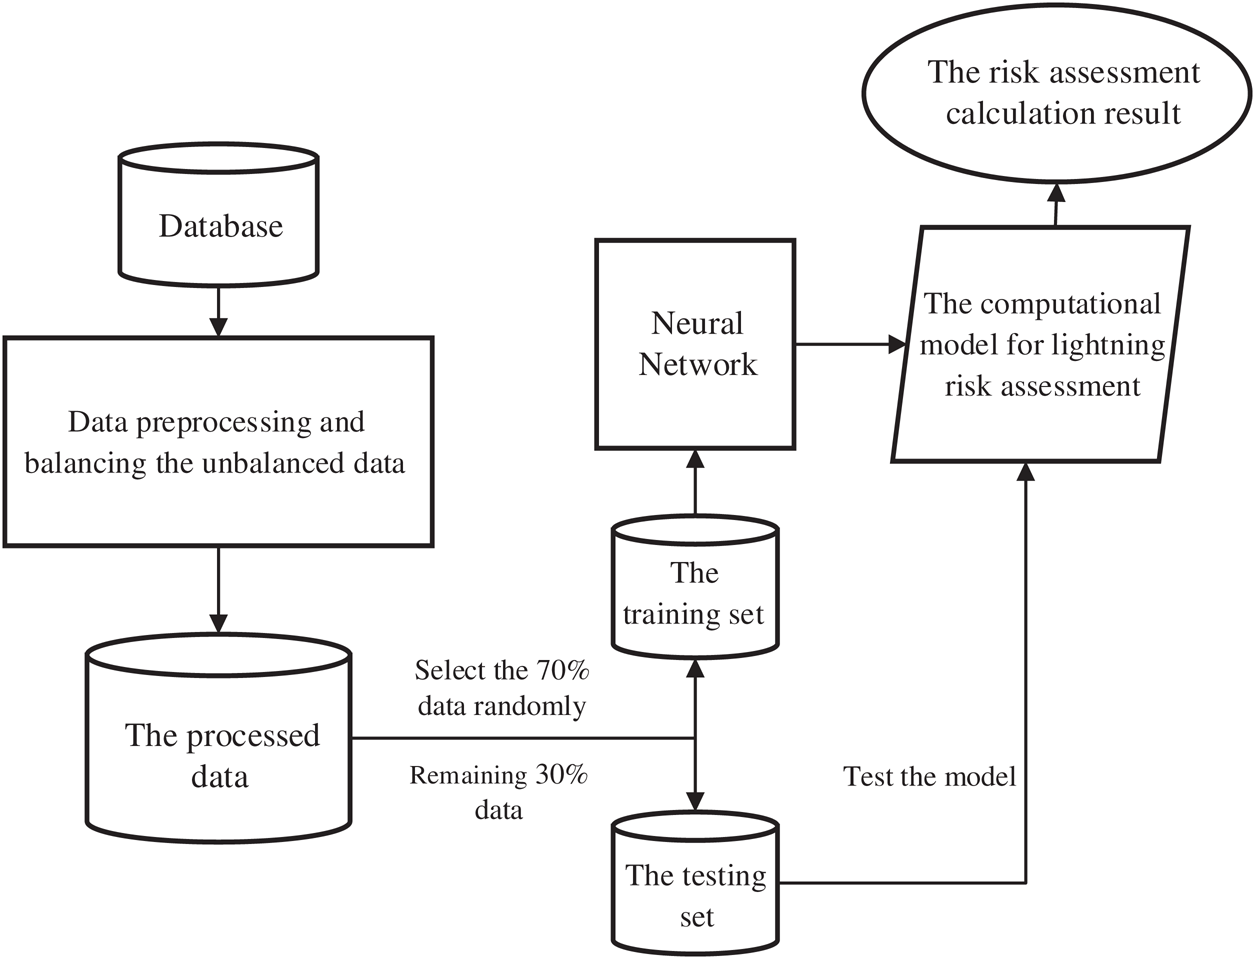
Figure 2: Flowchart of our risk assessment method
To more finely reflect the differences between the regions, our method rasterizes all the data from the data source, where the Hunan Province is sliced and divided into 8953 geographical grids of 5 km lengths. Each grid has longitude and latitude to the lower left and upper right corner for positioning, so that the location of each grid and the region can be determined. The method calculates the risk probability of each grid, so that the characteristics of each small grid can be analyzed, and the results of the risk assessment will be more accurate.
The specific data processing steps to be performed in order to obtain the data structure for the method are as follows:
•Step 1: Put the data into the corresponding grid
According to the range of each grid and with the longitude and latitude of lightning, the lightning in each grid can be determined. In the same way, the data of lightning disaster are gridded to determine the corresponding grid. At the same time, using the ArcGIS geographic information system, the elevation value and variance value of the grid are obtained in our experiment.
•Step 2: Grid data averaging
According to the actual situation, each geographic grid will contain multiple lightning data. The lightning data of each grid is averaged as

where  is an integer,
  represents the average lightning intensity in grid
  , and n represents that there are
  lightning data in grid
  .
.  is the intensity of the
  lightning data in grid
  .
.
•Step 3: Label the grid
According to the lightning disaster data, the grid with lightning disaster is marked 1, which represents positive samples; the grid without lightning disaster is marked 0, which represents negative samples.
•Step 4: Dimensionless data
In order to calculate the data with different dimensions together, this paper selected the min-max standardized method for dimensionless data. The log function is used to normalize the data. The processing formula is

where,  is the normalized data;
  is the data in the
  ith sample data; and
  is the maximum value of the sample data.
After the aforementioned four steps are performed, the standard data structure is constructed.
3.2 Processing Imbalanced Data
Compared with all the data on lightning, the proportion of data specifically related to lightning disaster is very small. In addition, the statistical work is very difficult, which aggravates the problem of data imbalanced. This problem makes it difficult to research and assess lightning disaster risk. To solve this problem, the processing flow proposed in this paper is as follows:
•Step 1: Negative samples clustering
There are 150 positive samples in the dataset, in order to balance the negative and positive samples, negative samples are clustered into 150 categories in this experiment using K-means clustering algorithm [19]. Given the  value, that is, the center point of the
  initial cluster, each point
  is divided into clusters represented by the nearest cluster center point, which satisfies the following formula:

Once all points are distributed, the center point of the cluster is recalculated according to all the points in this cluster, and then we perform an iterative process for assigning and updating the center point of the cluster until the central point of the cluster changes little, or the specified number of iterations is reached, where  represents the cluster center of each cluster.
•Step 2: Select the real lightning data points
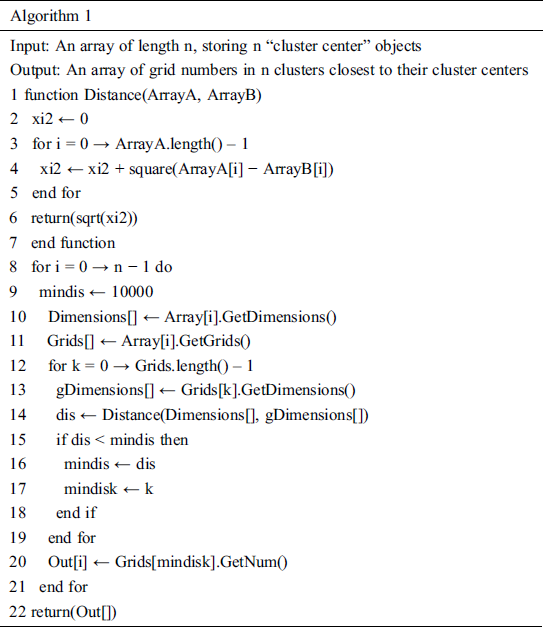
The generation of lightning data is a result of the collection of data pertaining to real phenomena in the natural world by observation instruments. However, the center of each cluster after K-means clustering is virtual and calculated, not the real data. Therefore, in our experiment, after clustering 8803 negative samples into 150 categories, we selected the real lightning data closest to the cluster center as negative samples in each cluster, thereby generating a positive-and-negative sample set with 150 pieces of data. After combining the negative and positive sample sets, a total of 300 pieces of data are mingled randomly. The pseudocode of the algorithm is shown in Tab. 1.
Table 1: Pseudocode of algorithm for the risk assessment method
Our method uses a neural network to assess the risk of lightning disaster in each area. Once the data have been processed through the two processes described in Sections 3.1 and 3.2, the data requirements for the training of the neural network have been met. At this time, the data will be mixed randomly, with 70% of the data randomly selected to train the neural network, and the remaining 30% of the data will be used as the test set. Once the model training is completed, the test set will be put into the model to test the model performance. The structure and parameters of the neural network model used in the experiment are shown in Fig. 3.
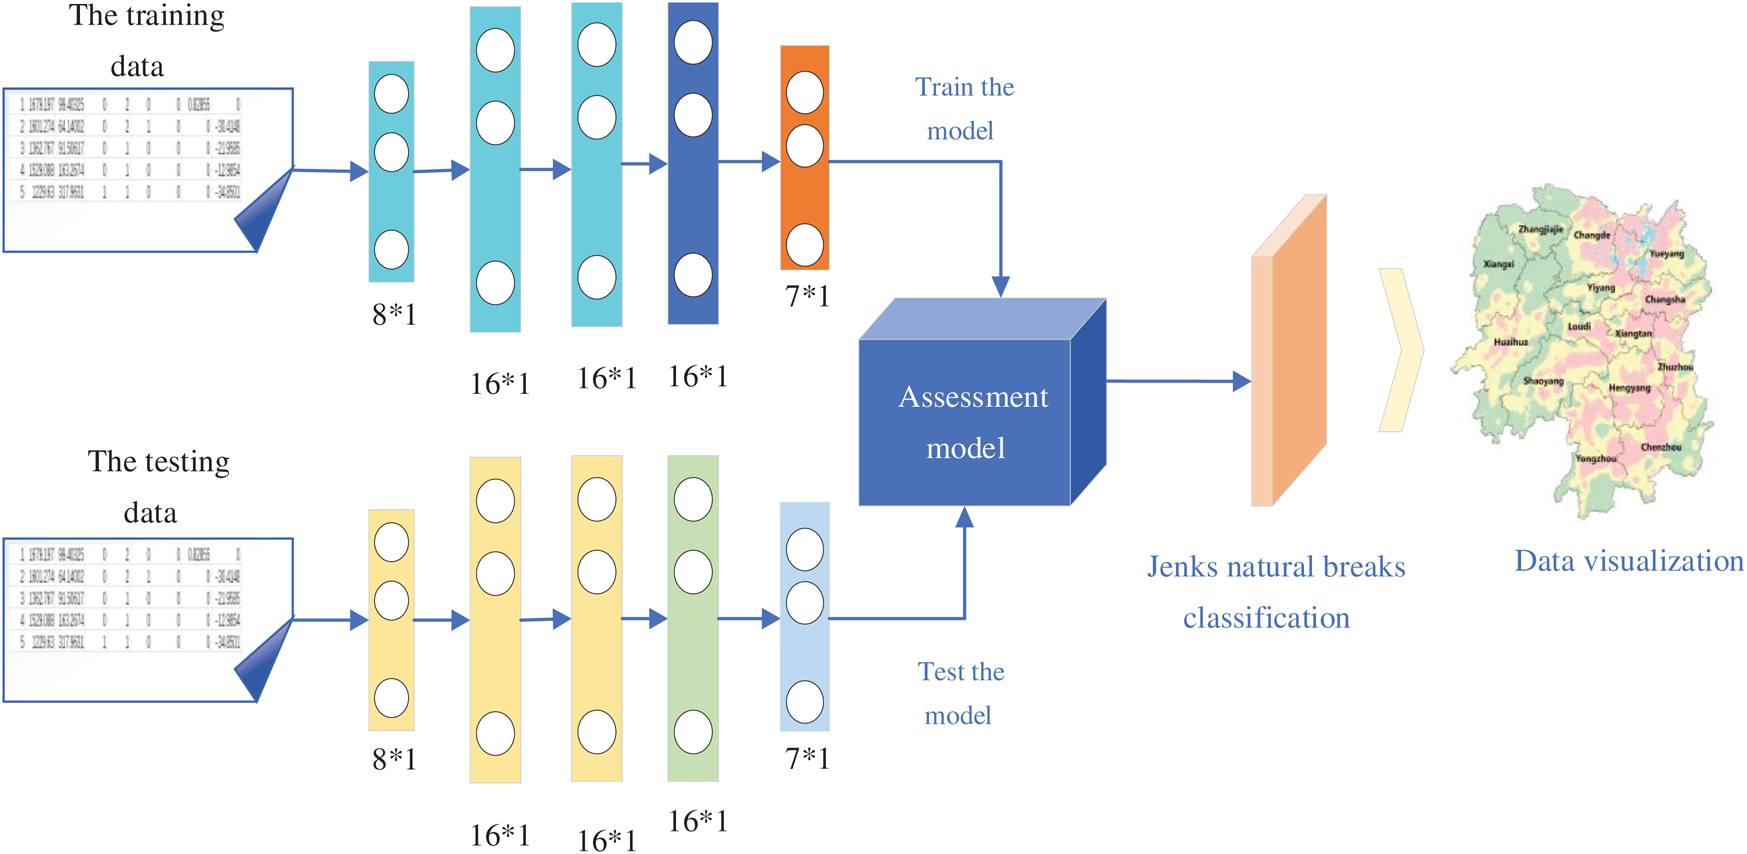
Figure 3: Hierarchical structure of the neural network in this experiment
In our experiment, the input layer of the neural network model was composed of seven neurons, each of which represents the data pertaining to lightning, geographical environment, population and the economy. The output of the input layer was the input of the hidden layer. The first hidden layer used seven neurons as the input and eight neurons as the output; both the second and third layers of the hidden layer contain 16 neurons. At the output layer, we used two neurons, one representing the probability of occurrence of lightning disaster and the other representing the probability of non-occurrence of lightning disaster. Because the data were ultimately represented as a probability value, the output activation function used the softmax function. The calculation formula of softmax function [20] is shown as follows:

where  represents the value of a neuron in the output layer, and
  represents the final result.
4.1 Introduction to Data Sources
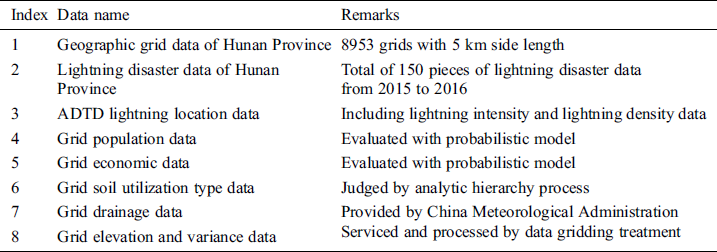
The experiment in this paper used three types of data: lightning meteorological data, geographic environment data, and population and economic data. Lightning meteorological data were the main body of our experimental data and included lightning data and lightning disaster data. This experiment collected a total of 80,000 pieces of lightning data from 2015 to 2016 in Hunan Province. The geographic environment data included elevation value and variance value, soil utilization type and geographic grid slice data. Grid data refer to the slice division of Hunan Province, and the data were filled into their own grid according to the longitude and latitude of lightning disaster data. This process is called data rasterization.
It was difficult for us to obtain the data for the population and economy of small areas due to various restrictions. Han et al. [21] proposed a model using maximum likelihood estimation to build a population assessment model based on a hot keyword crawler. Our experiment used this population assessment model to calculate the population and economic data of each grid in Hunan Province through an estimate based on the number of keywords in each grid. The data used in our experiment are shown in Tab. 2.
Table 2: The description of data used in the experiment
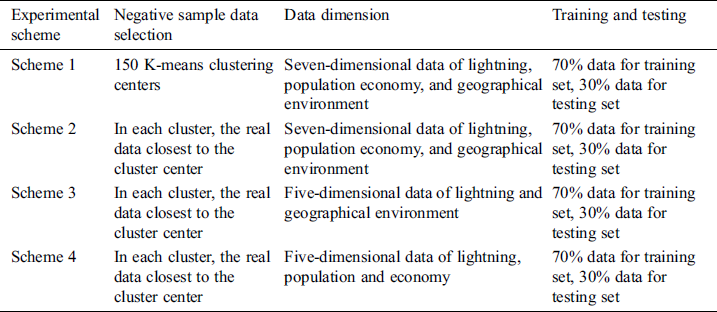
To determine the impact of population data, economic data and geographical environment data on the occurrence of lightning and lightning disaster, four schemes were designed in this experiment. Each scheme was trained with different data using the control variates method. The four experimental schemes obtained different experimental results, and the final data selection and parameter setting of the risk assessment model were determined according to the experimental results. The specific experimental scheme is shown in Tab. 3.
Table 3: Description of lightning disaster risk assessment model
5 Risk Assessment Model of Lightning Disaster Results
5.1 Binary Processing and Experimental Accuracy
There are two neurons in the output layer of the model. One represents the probability of occurrence of lightning disaster  , and the other represents the non-occurrence of lightning disaster
  in this grid, after the model’s calculation of the test data. For a more accurate comparison of the experimental results, the probability of thunderstorm in this paper is binarized using the following method:

Definition: If the value  equals to the value on an actual label, then the prediction made by the model is a correct prediction; otherwise, it is an erroneous prediction. The overall accuracy of the model is calculated as follows:

where N represents the number of correct predictions, and T represents the total number of the test data. This accuracy rate  reflects the reliability of the model used for risk assessment of lightning disasters.
5.2 Experimental Results and Analysis
In this experiment, 70% of the dataset was selected as the training set, and the remaining 30% of the data functioned as the test set. After the training of the neural network model, the test set was sent to the neural network for testing. The histogram of the accuracy of several experimental schemes is shown in Fig. 4.
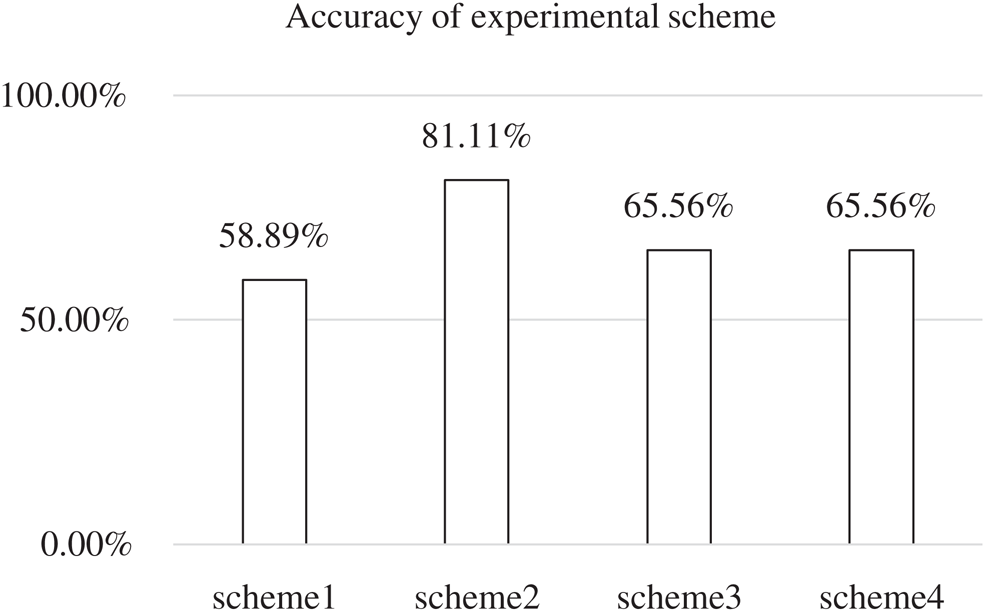
Figure 4: Accuracy of four experimental schemes
When only lightning disaster data and demographic data were taken into account, without the presence of geographical data, the accuracy of the risk assessment model was reduced by 15% but maintained at 65.56%.
When only lightning disaster data and geographical data were considered, not demographic data, the accuracy of the risk assessment model was reduced by 15% after many experiments.
When dealing with imbalanced data, if the 150 cluster center points were directly used as a sample set to perform calculations on the neural network, the accuracy was maintained at 58.89%.
Based on the analysis of our comparative experiments, lightning data hold the dominant position in the assessment of lightning disasters. The occurrence of lightning disasters is also relatively sensitive to geographical factors and demographic factors. The results show that the occurrence of lightning disasters depends not only on the meteorological data conditions, but also on the geographical environment and human activities. In other words, high-rise buildings and densely populated areas are more prone to lightning disasters. Therefore, analyzing the risk of lightning disasters in a certain area cannot be analyzed only from the lightning data itself. When lightning data, economic data, demographic data and geographical data are taken into consideration, the model is deemed to be relatively stable and accurate.
In constructing the aforementioned model, we used the K-means clustering algorithm to deal with the imbalance of some meteorological data. After several experiments, assume that a piece of data is composed of multiple meteorological data dimensions  , where
  represents a multidimensional meteorological data and
  to
to  are
are  meteorological data dimensions. Unlike traditional methods that process imbalanced data in the computer field, the real meteorological data closest to the clustering center in the high-dimensional data space are to be selected when dealing with imbalanced data, so as not to affect the results of subsequent experiments. We believe the reason for this phenomenon is that the meteorological data being the product of nature, can be considered the natural data, while the cluster center is the calculated virtual point. This method can be considered in the feature when dealing with imbalanced meteorological data.
In this paper, Hunan Province is divided into 8593 geographical grids. The lightning risk of each geographical grid is calculated by the model proposed in this paper, and then the Jenks natural breaks classification algorithm is used to divide the lightning disaster risk of Hunan Province into three risk levels: high-risk (red area), medium risk (yellow area), and low-risk (green area). The blue area in Fig. 5 represents the water system.
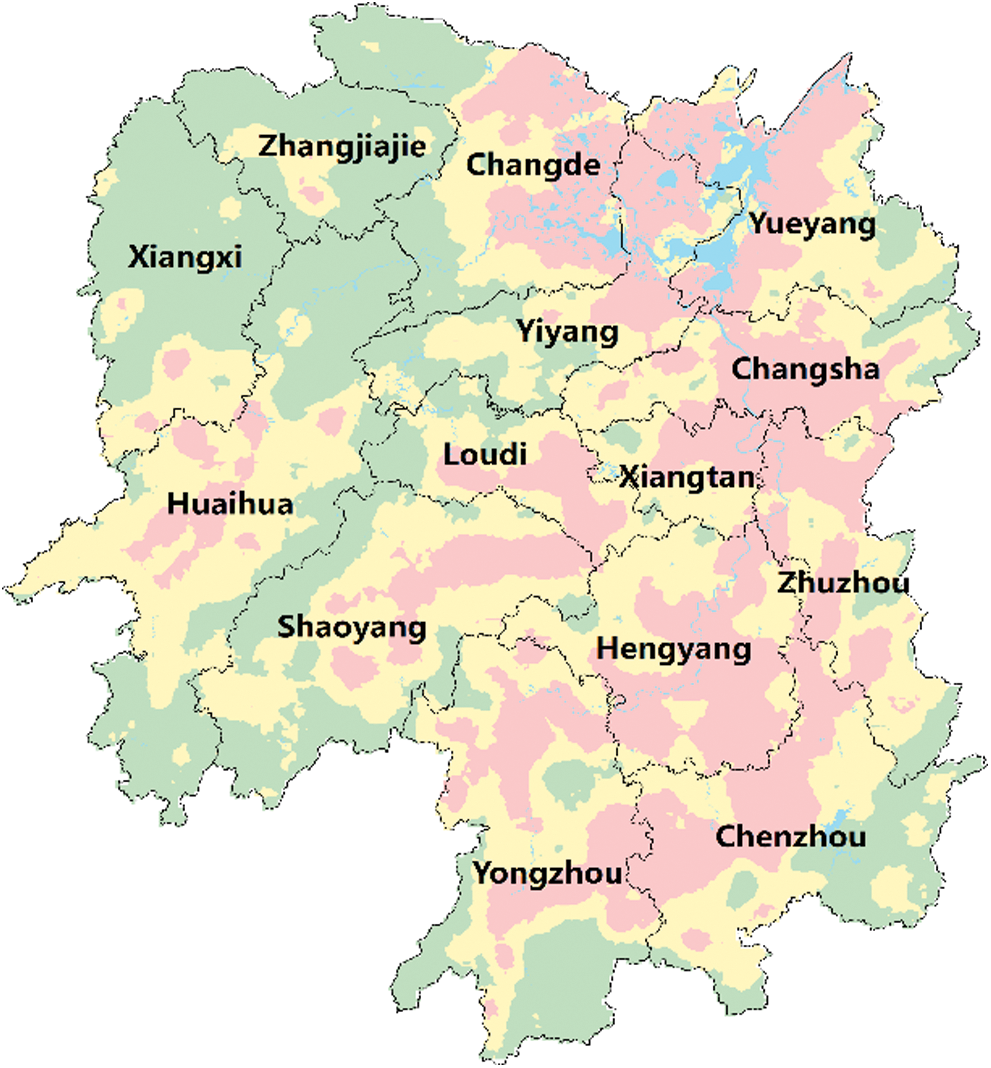
Figure 5: Zoning map of lightning disaster risk
From Fig. 5, it can be inferred that the risk of lightning disasters in Changsha City, Xiangtan City and Hengyang City is relatively high. The northeastern part of the map, consisting of Changde City, Yiyang City and Yueyang City, also has a high risk of lightning disasters. The risk of lightning disaster is higher in densely populated areas and areas with high-rise buildings. Furthermore, the closer the populated areas to the water system, the more frequent the lightning activity, and higher probability of a lightning disaster. In Western Hunan, Loudi and other sparsely populated areas, the risk of lightning disaster damage is relatively low. Although the frequency of lightning in some areas is very high, the possibility of causing a lightning disaster could be low if the population is relatively scattered in these areas.
It is useful to analyze all the different types of data that affect the occurrence of lightning disasters. However, the problem is that the weight distribution of each model in the previous research is not scientific enough. In this paper, meteorological data, geographic data, demographic data and disaster data are organically combined. After solving the problem of data imbalance, a neural network model is introduced to analyze the data. Now, the weight of our model is calculated by the neural network from the learning of the former data. Experiments have proved that when meteorological data, geographic data, population data, and economic data are comprehensively taken into account, the accuracy of the neural network for risk assessment of thunderstorm disaster is more than 80%, but when only meteorological data itself is considered, the accuracy of experiment is maintained at 65%, and the accuracy of the model is greatly reduced. When analyzing thunderstorm risk, it is also necessary to consider geographical and demographic factors. Unlike previous research on provinces, cities, counties, the analysis of geographic grid data can better analyze the details of geographic space, highlight the differences between smaller areas, and quantify the thunderstorm risk of each grid.
The combination of computer technology and meteorology has a bright future. Historically, meteorological research relied heavily on numerical and statistical calculation methods. However, the emergence of big data analysis and machine learning techniques can form new strategies that will allow researchers in the field of meteorology to conduct more in-depth studies. And we expect to conduct more researches in the interdisciplinary field of computer technology and meteorology.
Funding Statement: This work is supported by the National Key R&D Program of China under grant number 2018YFB1003205; by the National Natural Science Foundation of China under grant number U1836208, U1536206, U1836110, 61602253 and 61672294; by the Startup Foundation for Introducing Talent of NUIST (1441102001002); by the Jiangsu Basic Research Programs-Natural Science Foundation under grant number BK20181407; by the Priority Academic Program Development of Jiangsu Higher Education Institutions (PAPD) fund; by the Postgraduate Research and Innovation Plan Project in Jiangsu Province under grant number KYCX20_0934 and by the Collaborative Innovation Center of Atmospheric Environment and Equipment Technology (CICAEET) fund, China.
Conflicts of Interest: The authors declare that we have no conflicts of interest to report regarding the present study.
References
1. Y. T. Tian, M. H. Wu, F. Q. Shi and X. M. Wei. (2012). “Evaluation and regionalization of lightning disaster vulnerability over Hebei,” Meteorological Science and Technology, vol. 40, no. 3, pp. 507–512.
2. G. C. Chen, X. Cui and X. R. Tian. (2017). “Quantitative assessment and zoning of lightning hazard in Jiangsu Province,” Journal of Catastrophology, vol. 32, no. 1, pp. 32–35.
3. Y. C. Li, L. F. Wu, C. H. Yu, W. H. Lin and T. T. Wang. (2017). “Lightning characteristics and lightning disaster vulnerability zoning in Sanming of Fujian Province,” Journal of Nanjing University of Information Science & Technology (Natural Science Edition), vol. 9, no. 1, pp. 220–226.
4. X. Y. Chen, W. S. Xie, K. Wang and H. Tian. (2012). “Method research of the risk zoning of thunder and lightning and its application over Anhui Province,” Journal of the Meteorological Sciences, vol. 32, no. 1, pp. 1–9.
5. X. Cui, Y. X. Zhuang and H. S. Wang. (2015). “Combined evaluation method-based risk zoning of lightning disaster in Jiangsu Province,” Journal of Natural Disasters, vol. 24, no. 6, pp. 187–194.
6. H. Wang, Y. Deng, L. Y. Yin, Y. J. Xu and Y. S. Jing. (2007). “Vulnerability analysis and zoning of lightning disaster in Yunnan Province,” Meteorological, vol. 12, pp. 83–87.
7. L. T. Chen, S. Long, H. Y. Yu, Q. Li and X. J. Chen. (2019). “Research on risk zoning of lightning disaster in Hebei Province,” Journal of Catastrophology, vol. 34, no. 3, pp. 189–195.
8. P. Y. Liu, T. F. Zhang and Q. Q. Zhou. (2018). “Analysis of the causes of lightning disasters in Kunming City from 2006 to 2016 and vulnerability risk zoning,” Journal of the Meteorological Sciences, vol. 38, no. 6, pp. 824–831.
9. R. N. Biswas, M. N. Islam and M. J. Mia. (2020). “Modeling on the spatial vulnerability of lightning disaster in Bangladesh using GIS and IDW techniques,” Spatial Information Research, vol. 28, no. 5, pp. 507–521.
10. P. T. Nastos, I. T. Matsangouras and T. G. Chronis. (2014). “Spatio-temporal analysis of lightning activity over Greece — Preliminary results derived from the recent state precision lightning network,” Atmospheric Research, vol. 144, pp. 207–217.
11. B. Klein, L. Wolf and Y. Afek. (2016). “A dynamic convolutional layer for short range weather prediction, ” in Proc. of the IEEE Conf. on Computer Vision and Pattern Recognition, Boston, USA, pp. 4840–4848.
12. X. J. Shi, Z. R. Chen and H. Wang. (2015). “Convolutional lstm network: A machine learning approach for precipitation nowcasting, ” in Advances in Neural Information Processing Systems, Montreal, Canada, pp. 802–810.
13. G. Ayzel, M. Heistermann, A. Sorokin, O. Nikitin and O. Lukyanova. (2019). “All convolutional neural networks for radar-based precipitation nowcasting,” Procedia Computer Science, vol. 150, pp. 186–192.
14. B. W. Wang, W. W. Kong, H. Guan and N. N. Xiong. (2019). “Air quality forecasting based on gated recurrent long short term memory model in internet of things,” IEEE Access, vol. 7, no. 1, pp. 69524–69534.
15. W. P. Cao and X. Z. Wang. (2018). “A review on neural networks with random weights,” Neurocomputing, vol. 275, pp. 278–287.
16. F. Rayhan, S. Ahmed, A. Mahbub, R. Jani, S. Shatabda et al. (2017). , “Cusboost: Cluster-based under-sampling with boosting for imbalanced classification, ” in 2nd Int. Conf. on Computational Systems and Information Technology for Sustainable Solution, CSITSS 2017, Bangalore, IND, pp. 1–5.
17. D. M. Farid, M. A. Al-Mamun, B. Manderick and A. Nowe. (2016). “An adaptive rule-based classifier for mining big biological data,” Expert Systems with Applications, vol. 64, pp. 305–316.
18. T. F. Zhu, Y. P. Lin, Y. H. Liu, W. Zhang and J. M. Zhang. (2019). “Minority oversampling for imbalanced ordinal regression,” Knowledge-Based Systems, vol. 166, pp. 140–155.
19. A. K. Jain. (2010). “Data clustering: 50 years beyond K-means,” Pattern Recognition Letters, vol. 31, no. 8, pp. 651–666.
20. Y. Luo, Y. K. Wong, K. Mohan and Q. Zhao. (2020). “G-Softmax: Improving intraclass compactness and interclass separability of features,” IEEE Transactions on Neural Networks and Learning Systems, vol. 31, no. 2, pp. 685–699.
21. J. Han, W. H. Jiang, J. Shi, S. Xin and J. Peng. (2020). “A method for assessing the fairness of health resource allocation based on geographical grid,” Computers, Materials & Continua, vol. 64, no. 2, pp. 1171–1184.
 | This work is licensed under a Creative Commons Attribution 4.0 International License, which permits unrestricted use, distribution, and reproduction in any medium, provided the original work is properly cited. |