DOI:10.32604/cmc.2020.012515
| Computers, Materials & Continua DOI:10.32604/cmc.2020.012515 | |
| Article |
FogMed: A Fog-Based Framework for Disease Prognosis Based Medical Sensor Data Streams
1Jiangsu Collaborative Innovation Center of Atmospheric Environment and Equipment Technology, Nanjing University of Information Science & Technology, Nanjing, China
2Victorian Institute of Technology, Victorian, Australia
*Corresponding Author: Le Sun. Email: LeSun1@nuist.edu.cn
Received: 02 July 2020; Accepted: 22 July 2020
Abstract: Recently, an increasing number of works start investigating the combination of fog computing and electronic health (ehealth) applications. However, there are still numerous unresolved issues worth to be explored. For instance, there is a lack of investigation on the disease prediction in fog environment and only limited studies show, how the Quality of Service (QoS) levels of fog services and the data stream mining techniques influence each other to improve the disease prediction performance (e.g., accuracy and time efficiency). To address these issues, we propose a fog-based framework for disease prediction based on Medical sensor data streams, named FogMed. This framework aims to improve the disease prediction accuracy by achieving two objectives: QoS guarantee of fog services and anomaly prediction of Medical data streams. We build a virtual FogMed environment and conduct comprehensive experiments on the public ECG dataset to validate the performance of FogMed. The experiment results show that it performs better than the cloud computing model for processing tasks with different complexities in terms of time efficiency.
Keywords: Ehealth; disease prognosis; fog computing; QoS guarantee
Both remote and in-hospital healthcare mechanisms use body sensors and patient monitoring devices to collect and display the continuous signals of multiple physiological parameters, which are usually presented in the form of data streams. These data streams will be referenced by doctors or intelligent medical decision systems to detect or predict diseases, and to give accurate prognosis decisions in time [1]. The elders or patients having chronic diseases usually need to be monitored consistently. For example, it is of great value to predict abnormal heartbeats as early as possible and send a response to user terminals as soon as possible. Care workers can take effective measures in advance, so that the survival chance of patients with heart diseases can be increased. This work aims to develop an ehealth system based on IoTs to provide robust healthcare support for those people.
Some researches [2,3] apply cloud computing techniques to ehealth industry. Cloud computing enables on-demand utilization of software and hardware resources [4]. The centralization of cloud resources and their flexible provision facilitates the analyzing of a large volume of Medical data streams. For example, it is possible to easily perform deep learning algorithms for big data processing and mining. In addition, cloud computing reduces the costs of building high performance servers and databases for individual service users. An obvious disadvantage of just applying cloud computing to solve ehealth problems is that cloud resources are usually far away from end users. This may result in slow answers for a diagnosis event, which can cause terrible consequences in a real-time Medical event.
Fog computing is the current optimal solution for ehealth services [5]. The design of fog computing is especially adaptive to the applications requiring fast answers. Fog computing is a combination of edge computing and cloud computing. The tasks demanding low latency and few resources will be distributed to edge devices. The tasks requiring a large amount of resources will be delivered to the cloud computing center (CCC). In an ehealth system, data streams consistently collected from body sensors can be monitored, displayed and processed by edge devices. A large volume of historical data can be stored in cloud databases for further analysis. Existing fog-based data analyzing [6,7] and QoS controlling [8] techniques have dramatically improved the machine-based health monitoring and anomaly detection. However, there are still a number of unresolved issues worth to be explored. For example, there lacks an investigation on anomaly (e.g., heart disease) prediction based on Medical data streams in fog computing; and limited studies show how the Quality of Service (QoS) optimization of fog services and the anomaly prediction of Medical data streams influence each other to improve the prognosis accuracy.
In this paper, we propose an environment-friendly Medical data stream management system based on fog computing, called FogMed. It can collect and store patients’ physical information, analyze and predict anomalies based on the information, and optimize QoSs of fog services. The purpose of monitoring patients is to detect or predict their anomalies as early as possible, so that the accurate treatments can be taken in advance to maintain patient health. Therefore, we focus on two problems: anomaly detection and prediction of Medical data streams, and QoS optimization of fog services. To demonstrate the efficiency of FogMed, we illustrate an example of Atrial Fibrillation (AF) prediction from Electrocardiogram (ECG) data streams. A two-layer stacked long short term memory (LSTM) model is proposed for AF prediction (abbreviated as SLAP). Based on the AF prediction results, we evaluate the response time of fog nodes for processing simple Medical tasks and that of CCC for processing complex Medical tasks. At last, we build a virtual FogMed environment and conduct comprehensive experiments. Experiment results show that FogMed performs better than the cloud computing model for processing both complex and simple Medical tasks. Overall, this work has the following contributions:
•We introduce a fog-based disease prediction framework to explore the correlation between QoS optimization of fog computing and the performance of disease prediction.
•We illustrate an example of heartbeat anomaly prediction based on FogMed and introduce a deep learning model for anomaly prediction.
•We conduct comprehensive experiments to validate the efficiency of FogMed for processing both complex and simple Medical tasks.
The structure of this paper is: Section 2 describes the architecture, functions and characteristics of FogMed, and illustrates an example of abnormal heartbeat prediction based on FogMed; Section 3 demonstrates the efficiency of FogMed based on experiments. Section 4 reviews state-of-the-art; and Section 5 concludes this paper.
2 A Fog-Based Framework for Disease Prognosis Based on Medical Data Streams
This section introduces the key physiological parameters that need to be monitored and analyzed in ehealth. We propose a system of analyzing, mining and managing Medical sensor data streams based on fog computing techniques, namely FogMed, and introduce the structure of a fog device in FogMed. We summarize the main notations used in this paper in Tab. 1.
Table 1: Summary of the main notations in this paper
2.1 Types and Collections of Medical Data Streams
Advanced handheld or wearable monitors can help collect different types of physiological signals of patients or elders. For example, a handhold multi-parameter patient monitor [9] is capable of consistently monitoring pulse rate, information of blood constituents (e.g., arterial carbon monoxide saturation and arterial oxygen saturation), plethysmograph data, and perfusion quality. This information is normally presented in the form of data streams. A number of medical devices [10] have been developed to store and analyze these data streams.
2.2 Requirements on Computing Model for Processing Medical Data Streams
Real-time generated healthcare data streams have features of variety, large volume, and high velocity [11]. Some researches propose cloud-based methods to process this type of data. However, the centralization of cloud resources and the inflexibility of cloud network structures make the cloud incapable of handling healthcare data streams rapidly. Low velocity may result in serious consequences in healthcare contexts [11]. The computing model capable of handling such healthcare data streams must satisfy the following requirements [12,13]: (1) Easy to achieve very low latency. Fast responses can save treatment costs and patient lives, which requires not only the speed of data transmission and analysis, but also the right places to make decisions. Places close to the data generation mobile devices are more appropriate for fast decision making than remote clouds. (2) Reduce the waste of network resources. Not all the data need to be sent to the cloud. (3) Guarantee data security. Healthcare data are the privacy of patients, so they should be secured during collection, transmission, storage and analysis. (4) Ensure data accuracy and reliability. Healthcare data determine the correctness of diagnosis. They are usually collected by mobile devices in geographically dispersed locations, which may cause the collected data noisier and less integral than the data collected inwards. (5) Capable of communicating with different types of mobile devices. Cloud devices use the Internet Protocol (IP) to communicate with each other [12]. However, different mobile devices may use different communication protocols.
2.3 Overview of the Architecture of FogMed
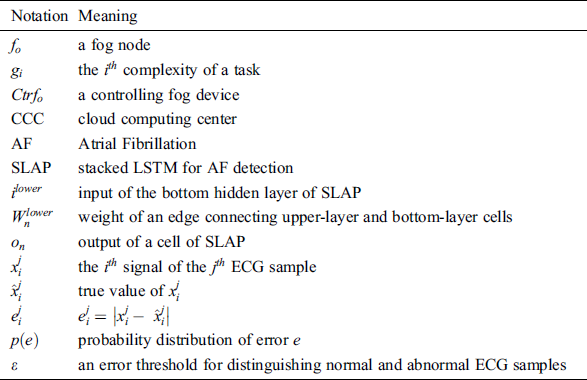
The architecture of FogMed is shown in Fig. 1. The sensor layer is the edge of the architecture, where different types of sensors consistently sense the physiological signals of patients. We use the wearable health monitoring sensors [14] to monitor a patient’s physical status. A wearable hub [14] is used to communicate these data streams with mist devices, such as mobile devices (e.g., laptops or mobile phones), microcomputers or microcontrollers that have data processing and storage capabilities. These mist devices are at the bottom of the fog layer. They can analyze a small amount of data and make fast decisions. Tasks requiring more computing resources are forwarded to the second fog layer. Cloud resources are far away from sensors, which can process non-urgent tasks requiring a large amount of resources. Both fog and cloud layers have capabilities of analyzing and summarizing data, making diagnostic decisions, and determining service scheduling strategies.
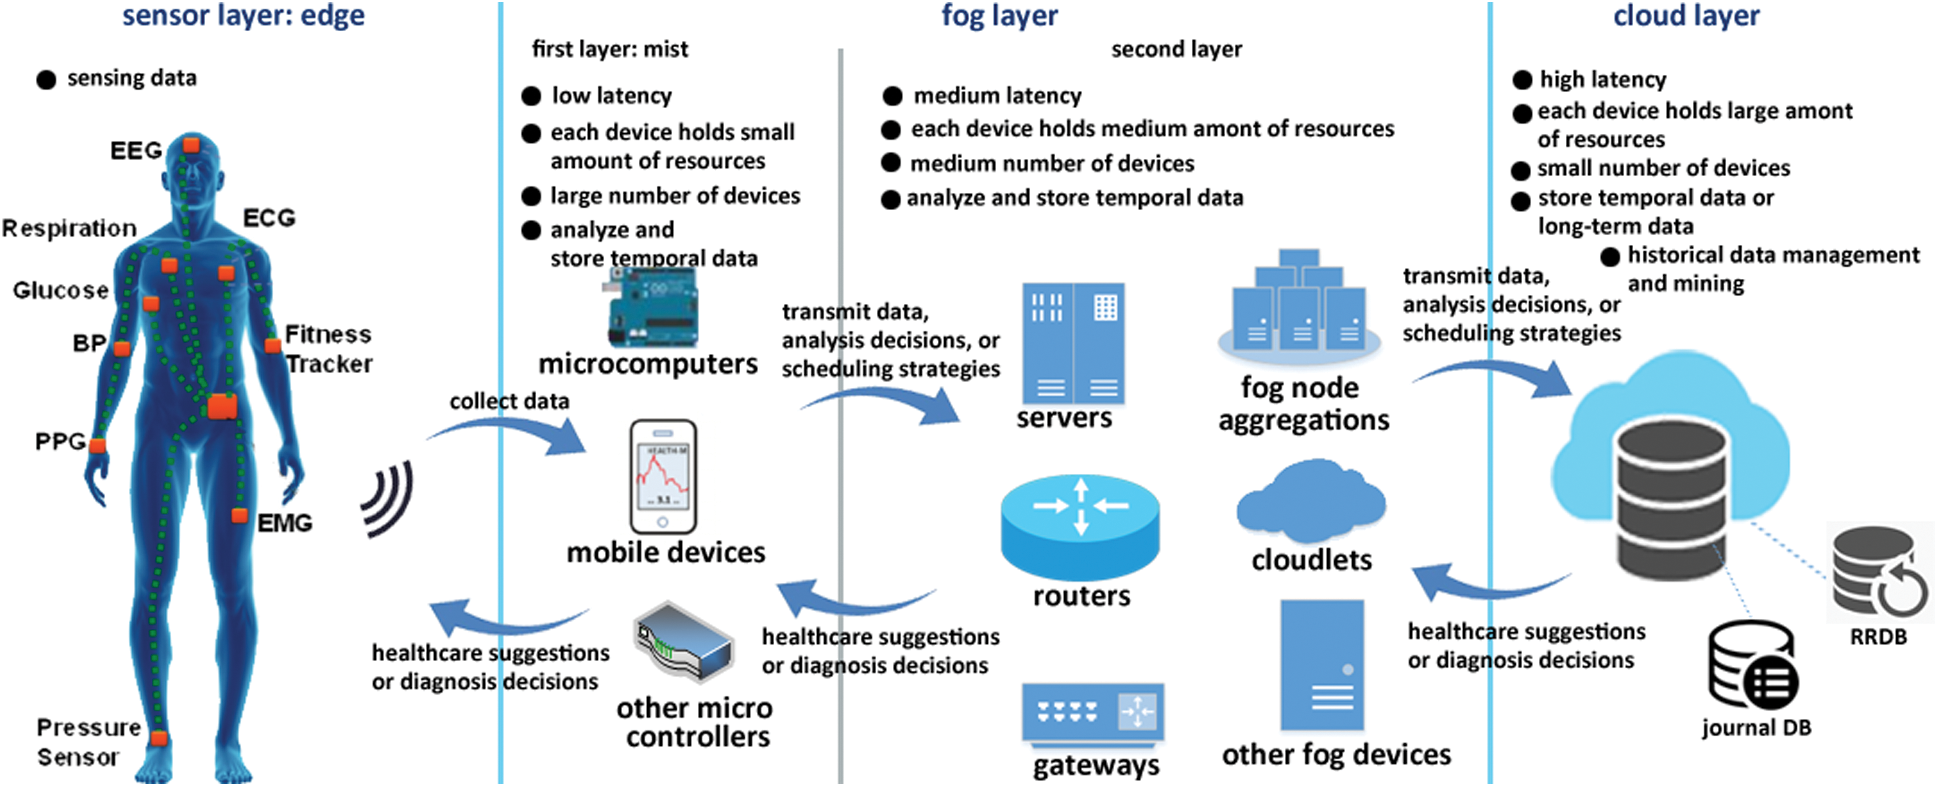
Figure 1: FogMed: A framework for fog-based disease prognosis and Medical sensor data stream management
We use the round-robin database (RRDB) in fog layer to store small and temporal data streams; and use both the RRDB and the journal database (JDB) in cloud layer to store large and long-term historical data [1]. For example, an RRDB stores physical data streams from sensors of a patient, and a JDB stores the information of important medical events, e.g., an illness breaking or a device failure.
2.3.1 Geographical Partition and Function Components of Fog Devices
FogMed works in a constrained geographic area. It further partitions devices of a wide area into a number of subareas and manages each subarea through some controlling devices. Fig. 3 shows geographical partitions of fog devices. There is at least one controlling fog device in a subarea, which has the following functions:
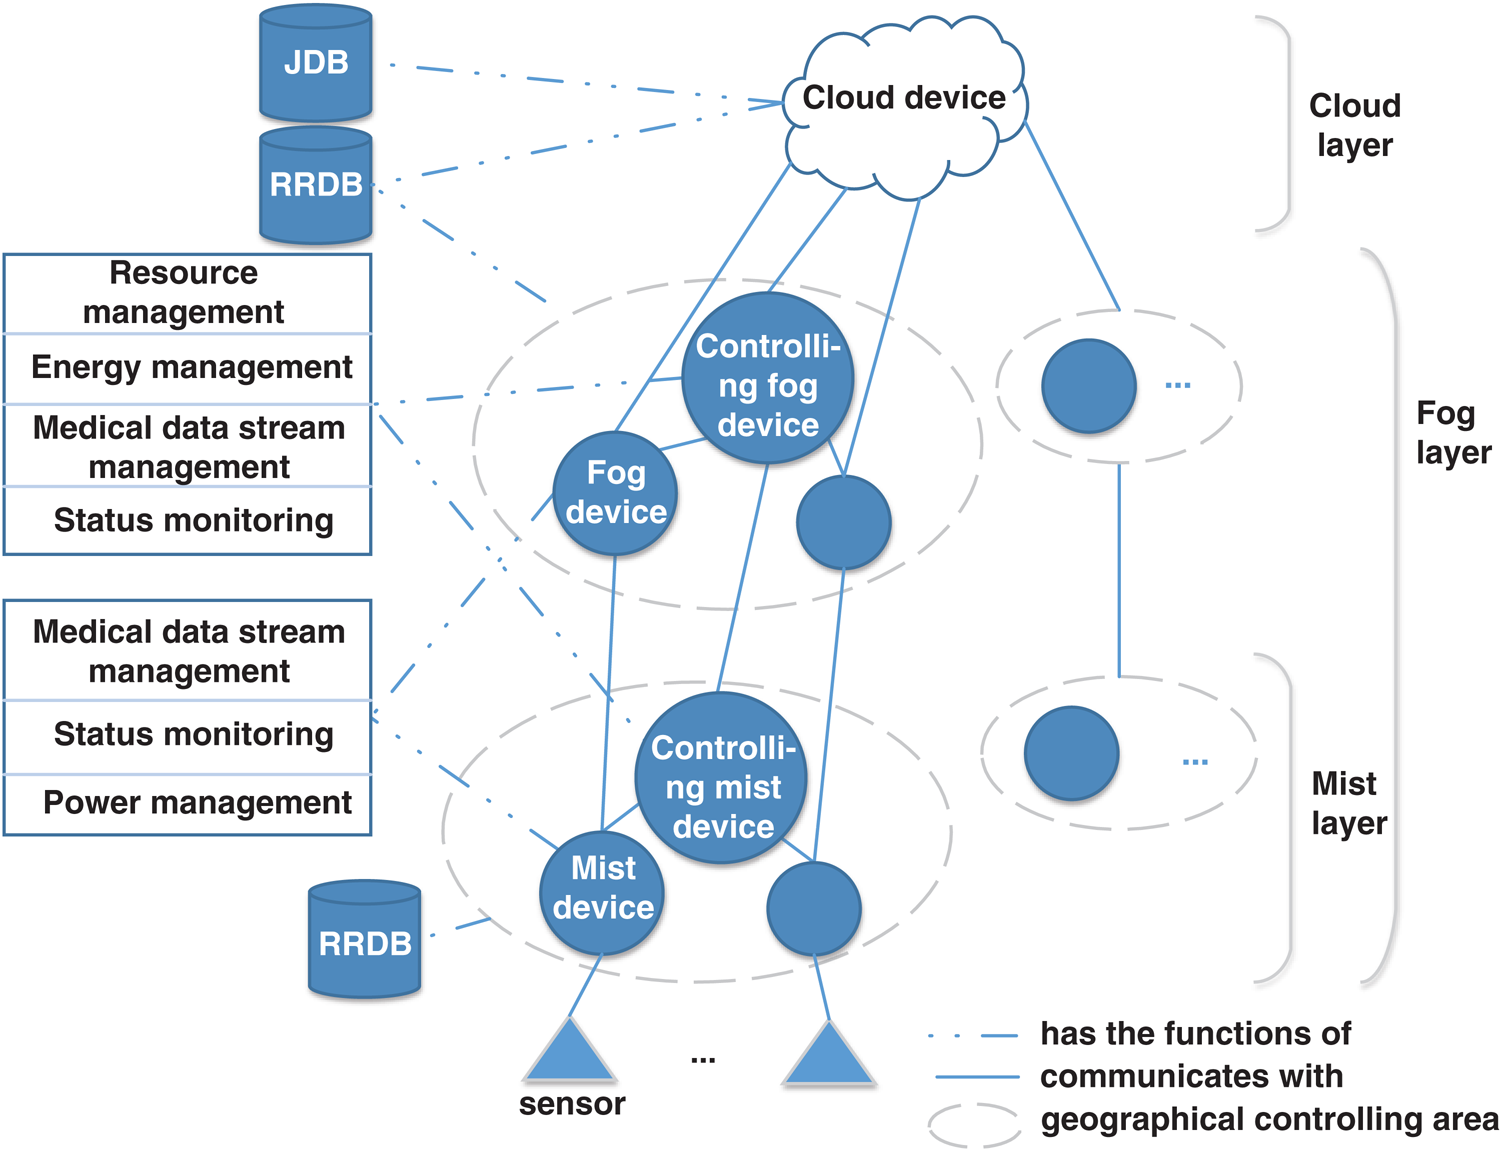
Figure 3: Geographical partition and controlling of fog devices
•Resource management: Manages both practical and virtual resources to guarantee successful executions of multiple Medical tasks, by simultaneously optimizing QoS levels [15].
•Power management: Power management is critical in an ehealth system. Both cloud and fog devices have power constraints [16], so it is necessary to develop an appropriate energy saving strategy by considering the power drain and battery lifetime of fog nodes [17] to guarantee the success of real-time Medical tasks.
•Monitoring devices: Monitor both resource utilization and energy consumption. The monitoring data can be used for real-time resource and energy management. It can be stored in a cloud JDB for subsequent system analyses.
•Medical data stream management: Pre-process, store, and analyze Medical data streams. Especially, by cooperating with the resource management, energy management and status monitoring components, a fog node should be capable of determining which data streams and tasks should be sent to cloud and which should be processed by fog devices.
Basically, non-controlling fog devices in a subarea have functions of Medical data stream management, status monitoring and power management. They execute instructions from controlling devices and send information to places designated by controlling devices (e.g., databases, other fog devices, user terminals or cloud devices).
2.3.2 Architecture of a Fog Device in FogMed
Fig. 2 shows the structure of a controlling fog device of FogMed, which references the fog node architecture defined by [18]. This structure takes into account resource management (including hardware and software resources), QoS optimization, data processing and analyzing, database management, interfaces to the Web, connections to the other fog nodes and the cloud layer, data organization, network communication and data security [19] for designing both hardware and software.
Figure 2: Structure of a controlling fog device
The structure of a non-controlling fog device is similar to that of a controlling fog device, but based on its specific functions, it might be configured by different software or hardware.
2.4 Main Challenges and Solutions in FogMed
2.4.1 Workflow of Medical Data Stream Processing and Analyzing
The application scenario of FogMed is to monitor physiological conditions of patients by using sensors and monitors inside or outside a hospital. The workflow of Fogmed is as follows:
•By using monitor components (see Fig. 2), a fog device directly connects to one or more sensors on the body of a patient. The fog device is managed by an operating system and deployed by a number of software services. The monitors, coupled with the protocols/services of the network communication and device interaction, collect data streams generated by sensors in certain generating rates. The data streams collected in a time interval are pre-processed (e.g., removing noises), formatted, compressed, and stored in the random access memory (RAM) or the RRDB. In this step, we need to develop advanced techniques to organize (i.e., format, compress, federate and store) different types of data streams collected from sensors or patients.
•A fog device is deployed by a system of Medical data stream management, which includes the services of real-time processing and analyzing consistently generated data streams. Based on specific requirements, the fog device calls corresponding services to analyze data streams. If this analyzing task requires a short-term history information, the fog device accesses the RRDB. However, if a long-term history information is required and the fog device cannot provide such information, this analyzing task is sent to CCC. In this step, we need to develop innovative techniques to predict or detect anomalies in data streams to diagnose diseases as early as possible.
•As soon as an anomaly is detected, the system calls services of analyzing anomalies and making treatment decisions. It then sends alarms or corrective treatments to end-devices of the patient based on some pre-determined confidence thresholds. If the system cannot automatically make right decisions based on the confidence thresholds, the anomaly will be sent to end-devices, and then artificial decisions will be made and sent to patients. In this step, we need to develop techniques of anomaly prediction and treatment decision making.
2.4.2 Resource Management, QoS Optimization and Energy Saving
The other two objectives of this work are QoS optimization and energy saving. FogMed guarantees that the requested tasks are completed, and the best trade-off among multiple quality measuring parameters (e.g., response time, latency, and availability) of services (e.g., cloud, fog and network resources) is achieved. The satisfaction degrees of a service user (e.g., a patient, a doctor, or a service using the measured services) are then optimized. Simultaneously, FogMed aims to minimize the energy (e.g., power) consumption on the premise of QoS optimization and accurate decision making.
To achieve QoS optimization, we explore techniques of resource management, including both software and hardware resources. Software resources refer to virtual resources, e.g., virtual machines on a fog or cloud platform, virtual fog nodes by separating an actual fog node or a geographically constrained area, and virtual local area networks. Hardware resources include the actual fog and cloud processors, memories, and networks. FogMed must be able to dynamically determine how many and which fog and cloud processors to be used, how many fog and cloud databases to be built, and how to distribute tasks and balance loads on fog and cloud devices. We will show the efficiency of FogMed for performing Medical tasks by comparing it with a CCC in Section IV.
2.5 Components and Functions of Cloud Layer in FogMed
A cloud computing device in cloud layer processes complex services and a large amount of data that cannot be processed in fog devices. In our medical context, the data stream mining services that do not require fast responses but require high computing power or depend on certain historical information are most probably processed by cloud computing devices. In addition, cloud layer is deployed with both JDB and RRDB, which store long-term information and time-critical information respectively. Components of cloud layer are shown in Fig. 4, which include controlling devices (represented by the oval shape) and non-controlling devices (represented by the round shape). A controlling device accepts services coming from the fog layer and allows services to non-controlling devices based on some service allocation strategies. Its functions are similar to the functions of controlling fog devices. Non-controlling cloud device has the same functions as controlling fog devices. Controlling and non-controlling cloud devices communicate with each other, and also communicate with cloud storage devices (i.e., cloud RRDBs and JDBs). We describe an example of building a deep learning model to predict AFs based on ECGs in the cloud layer of FogMed.
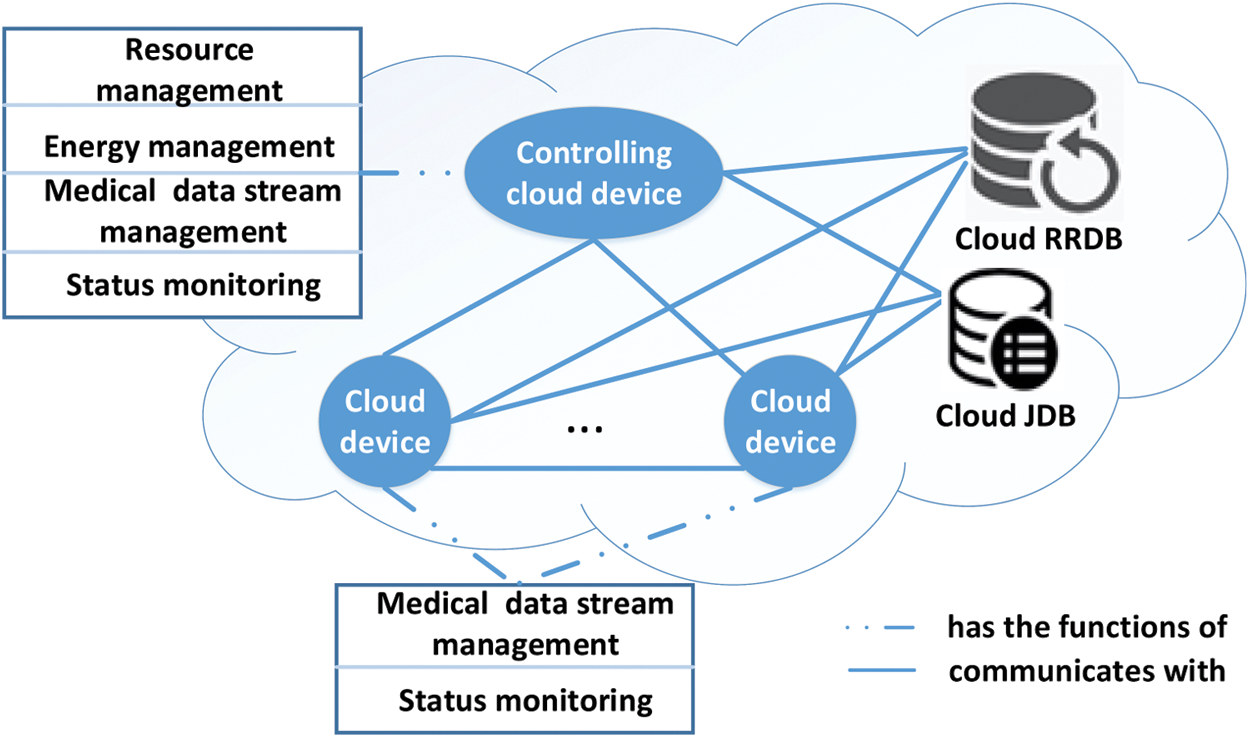
Figure 4: Components and functions of cloud layer
2.5.1 A Deep Learning Model for Predicting Atrial Fibrillation in Cloud Layer
In cloud layer, we store a large amount of history ECG data streams in JDBs, and train a deep learning model, a stacked LSTM, to predict AFs based on ECG data streams. We call this model a stacked long short term memory architecture for AF prediction (abbreviated as SLAP). The structure of SLAP is shown in Fig. 5, which contains two sub-layers of LSTM. Each edge connecting two cells has a weight value. Fig. 6 shows details of SLAP, where a hidden layer of LSTM overlays the other hidden layer, and the upper layer outputs information to the lower layer. A cell represents a time unit. The input layer inputs a multivariate time series to each cell and the output layer outputs a time series with  (
( ) time units.
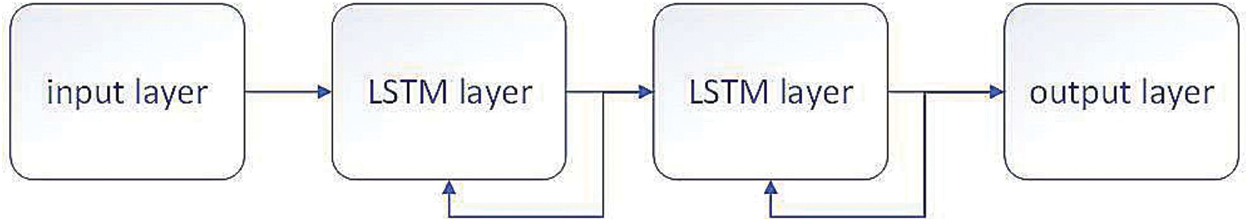
Figure 5: Structure of SLAP
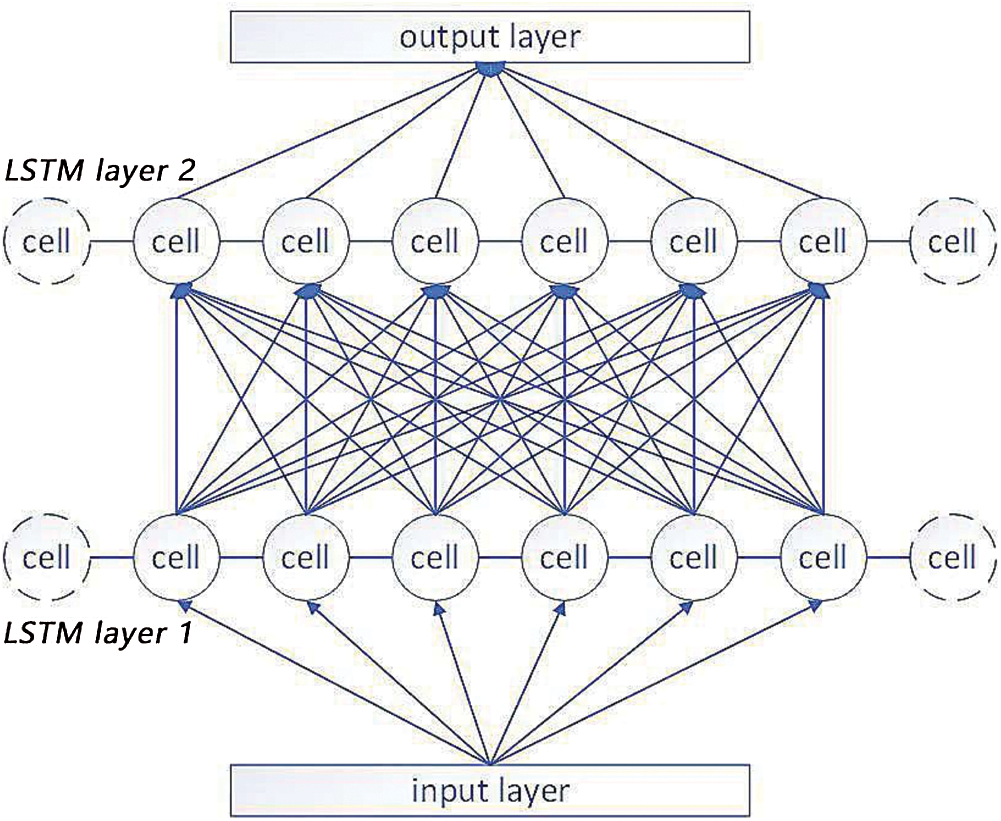
Figure 6: Details of SLAP
Eq. (1) shows the data transformation between cells [20], where  is the input to the bottom hidden layer;
  is an activation function;
  is the weight of the edge connecting the upper-layer cell and the bottom-layer cell;
  is the output number of the upper layer;
  is the output of a cell; and
  is a bias value.

SLAP takes advantage of the multiplicative structure of LSTM, in which each cell is capable of controlling the information flow. Based on the output of a time unit and the new ECG signals, SLAP predicts signal trends in next time unit with variable time lengths.
2.5.2 Modelling Errors of the Predicted Samples for Classifying Normal and Abnormal Samples
After training a SLAP model, we determine whether the predicted samples are normal or abnormal. To achieve this, we assume that the errors of the predicted samples from the true samples fit the multivariate Gaussian distribution. Suppose we have  predicted ECG samples
  , and each sample has
  digital signals
  . Let the true alues of the
  samples be
 , the error of the
  element in the
  sample is
 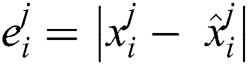 . Eq. (2) defines the multivariate Gaussian distribution
  of the error vector
  of a predicted sample
  .
.

where  is an n × 1 vector and
  is an n × n matrix, which are defined by Eqs. (3) and (4) respectively.


If  , we say
  is a normal sample, or else,
  is an abnormal sample, where
  is an error threshold and will be introduced in detail in the next section.
2.5.3 Steps of Model Learning and AF Prediction
Steps of building SLAP are as follows: (1) Data processing. At first, we divide a set of multivariate ECG samples into four subsets,  ,
,  ,
,  and
and  , to train the SLAP parameters, the multivariate Gaussian distribution of sample errors, and an error threshold
  for distinguishing normal and abnormal samples, and to test the trained SLAP model respectively. (2) Learn SLAP parameters and the multivariate Gaussian distribution. We use sample set
  to learn the SLAP model and use
  to validate the model and simultaneously fit the multivariate Gaussian distribution. (3) Determine
  . After fitting the multivariate Gaussian distribution, we determine the value of
  based on
  . The final
  should maximize the f-score in Eq. (5) [21].

where  and
and  are defined by Eqs. (6) and (7) respectively; and
  is a trade-off parameter between
 and
and  .
.


Our experiment contains two main parts: Experiment-I: evaluate the deep learning model SLAP for AF prediction; and Experiment-II: Evaluate the response time of fog layer and cloud layer for processing AFs. We describe the results of these two parts separately.
Experiment-I is based on two public ECG databases: the long-term AF database (LTAF) and the AF terminal challenge database (AFTC) [22]. LTAF includes the long-term ECG recordings of 84 subjects who have the sustained or paroxysmal AFs [23], and the duration of LTAF records are in the range of 24 to 25 hours. A record in AFTC contains two ECG signals, where the sample frequency of each signal is 128 samples/second; and a record only sustains one minute. We separate the two datasets into four subsets:  ,
,  ,
,  and
and  .
.
The settings for training an SLAP are defined as follows: divide a long term ECG into short segments (1~2 minutes), where each segment has the length of 100 unit time (1 unit time = 1 second); and input the segments into the input layer of SLAP consistently. SLAP has two hidden layers. Each layer has 55 cells. Let the learning rate to be 0.01, the termination error to be 0.00001, and  to be 0.1. We then train the SLAP based on
  . The trained SLAP can predict the trend of the ECG signals in future 10 time units. The experiment runs on a computer with a GPU of NVIDIA GeForce 10501.
Based on the above settings, we train an SLAP model and use this model to test the performance of AF prediction and then to determine  . We take about 45 seconds to fix the optimal
  = 0.92 and
  = 0.015. And then we validate the anomaly prediction results based on
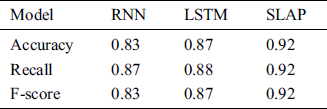
  . We compare the AF prediction performance of SLAP, single-layer LSTM and RNN in Tab. 2. The accuracy recall and f-score of SLAP are higher than those of RNN and LSTM, because the stacked LSTM layers in SLAP can extract high-level features that can result in a richer output than RNN and LSTM [21].
Table 2: Compare AF prediction performance of RNN, LSTM and SLAP
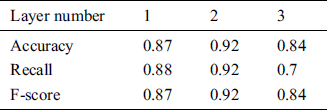
Tab. 3 shows the performance of SLAP with different number of layers. SLAP with two layers achieves the highest performance. SLAP with one layer does not have enough weight variables to support the feature diversity. SLAP with more than two layers can cause under-fitting. Experiment results demonstrate that a stacked structure can enhance feature extraction accuracy, and support the modeling of ECGs by using various weight variables and biases.
Table 3: Compare AF prediction performance of LSTM with different number of layers
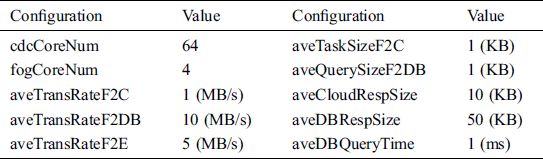
We build a virtual FogMed environment, whose topology is shown in Fig. 7. This network topology has one cloud data center and 16 fog areas (WAN1, …, WAN16). Each fog area contains 32 fog nodes that are connected with each other. Each fog area contains 16 hospitals, and each hospital contains 500 edge nodes, where an edge node represents a patient that being monitored and sends data streams to its connected fog node. The configurations of the virtual FogMed environment are shown in Tab. 4, where the computing core numbers of the cloud data center (cdcCoreNum) and a fog node (fogCoreNum) is 64 and 4 respectively; the average sizes of a task packet or a query packet from a fog node to cloud (aveTaskSizeF2C) and to an RRDB (aveQuerySizeF2DB) are both 1 KB; the average sizes of a response packet from cloud (aveCloudRespSize) and an RRDB (aveDBRespSize) are 10 KB and 50 KB respectively; the average transmission rates from a fog node to cloud (aveTransRateF2C), an RRDB (aveTransRateF2DB), and an edge node (aveTransRateF2E) are 1 Mb/s, 10 Mb/s and 5 Mb/s respectively; and the average time of querying an RRDB (aveDBQueryTime) is 1 ms.
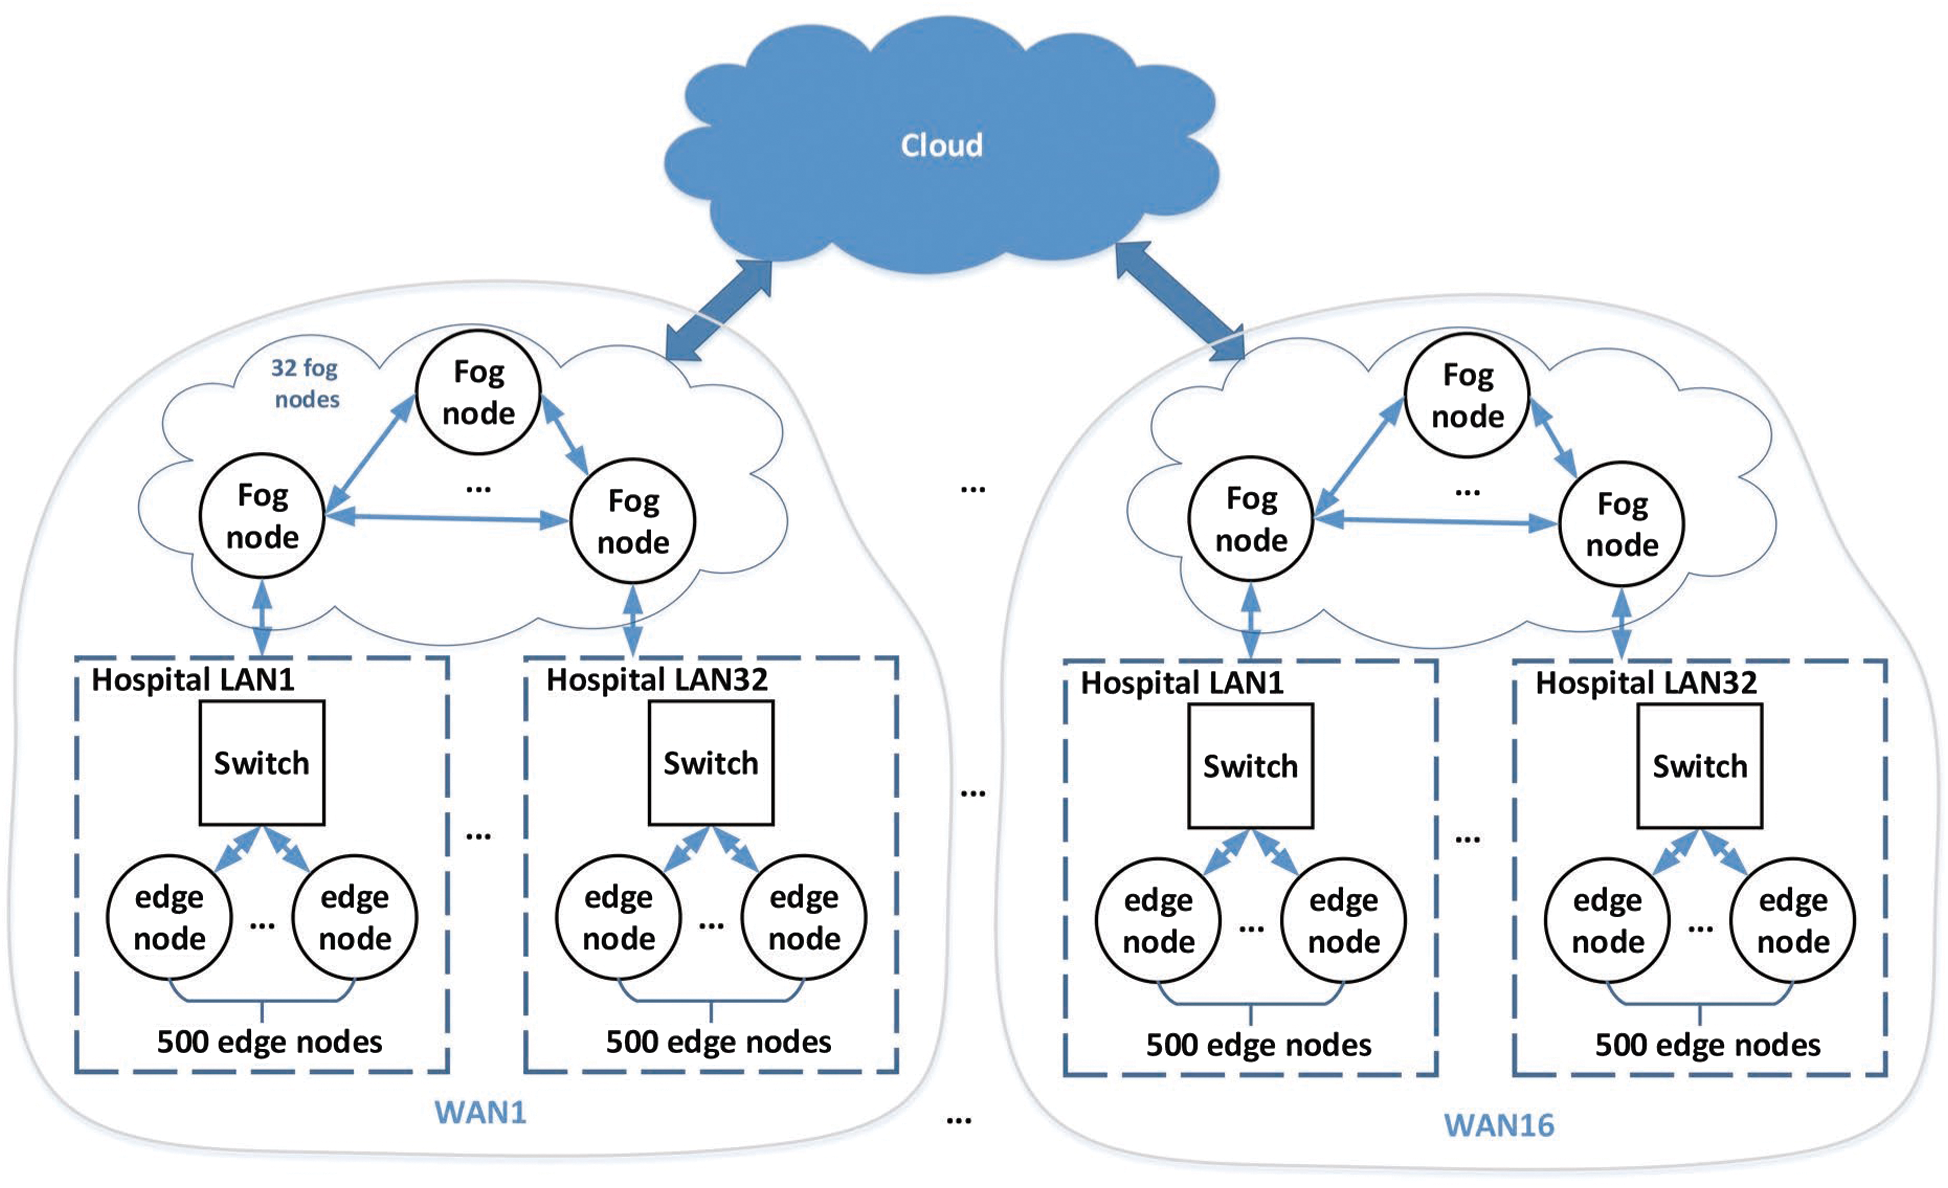
Figure 7: Topology of a virtual FogMed
Table 4: Configurations of the virtual FogMed
In the virtual FogMed, patients are monitored to detect the abnormal heartbeats. By using ECG detection sensors, a patient generates heartbeat data streams consistently. These data streams are sent to and analyzed by a mist device connected with the sensors. If an abnormal heartbeat happens, a warning signal is sent to a connected fog node  . In a certain time period (e.g., 1 ms),
  integrates the warning signals from the 500 edge nodes and establishes tasks to process these abnormal signals based on the abnormal complexities. We divide the abnormal complexity into 20 grades:
 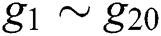 where
where  represents the simplest task. After determining
  ,
,  evaluates the computing resources needed to finish
  . If
. If  has enough capacity, it will start this task, or else, it will send this task to the controlling fog device
  in this fog area. Based on the task complexity,
  makes decisions to allocate other fog devices to
  . or send this task to CCC.
We test AFs in this experiment, and define the number ( ) of AFs happened in
  as a variable of the abnormal complexity:
  if
if  ;
;  if
if  ;…; and
  if
if  . And we use a simple scenario in this experiment for testing the performance of FogMed: We set two complexity thresholds:
  and
and  . The complexity of a task will be determined by a fog device. The complexity of a task being less than
  , between
  , and more than
  means the task is simple (
 ), moderately complex (
 ) and very complex (
 ) respectively.
Test-I: a fog node sends all arrived tasks (including  ,
,  and
and  ) to CCC. The action loop time (i.e., a time period from the point of sending a task to the point of getting a response) of CCC for tasks with different complexities is shown in Fig. 8. We can see that whatever the complexity of a task is, the average response time of CCC for the task is around 250 ms, which means the task complexity does not influence much on the processing time of CCC. And since we have defined that the packet size and the transmission rate of distributing a task on the Internet is fixed, and they cannot be influenced by task complexities, so sending a simple task from fog to cloud takes similar time to send a complex task.
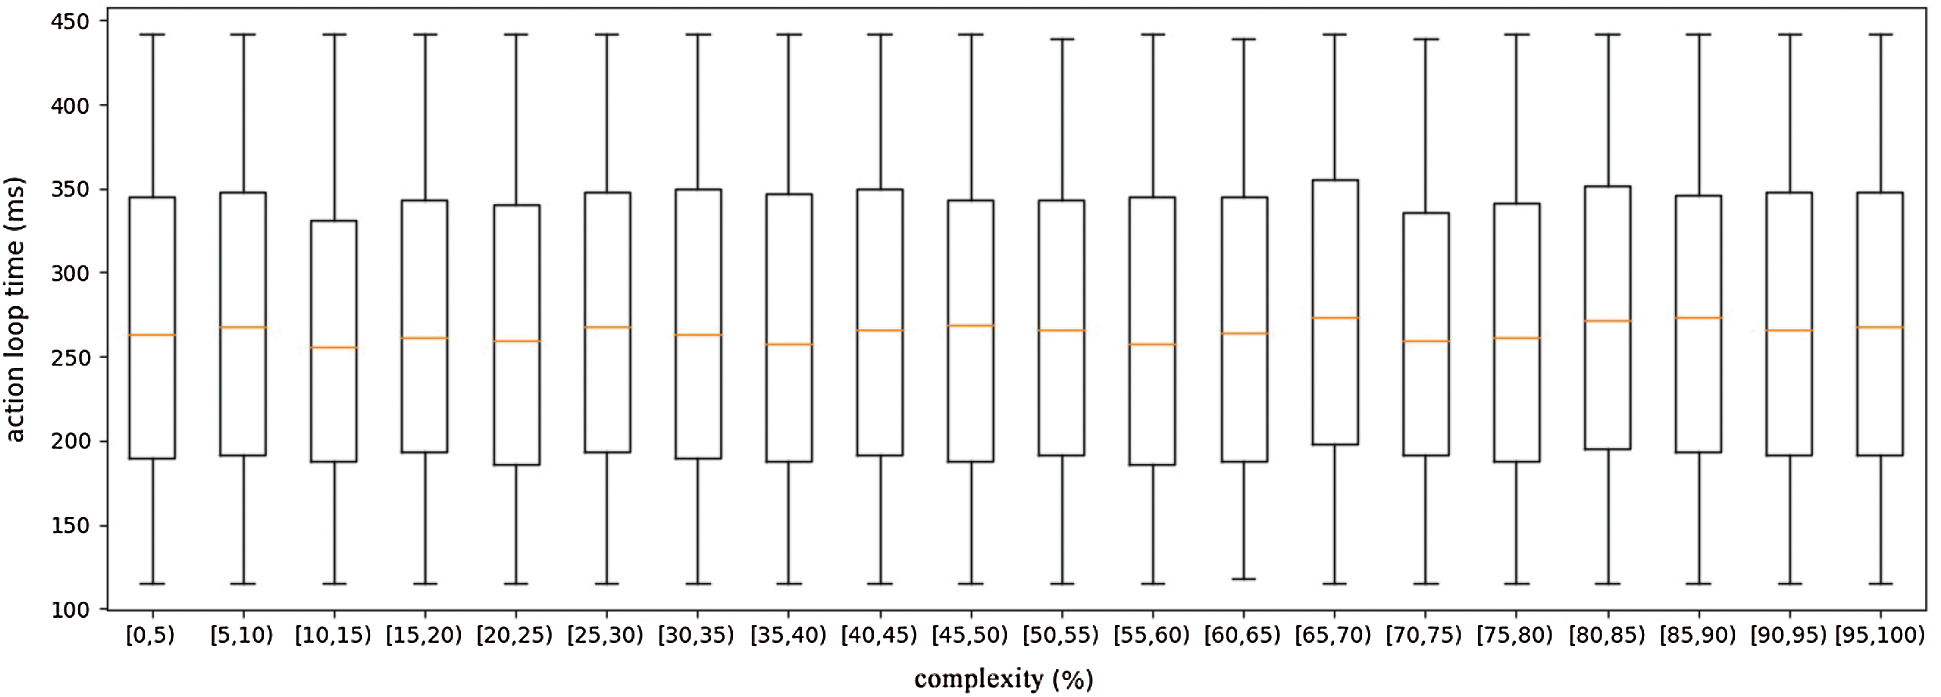
Figure 8: Response time of Cloud with respect to different task complexities
Test-II: a simple task ( ) is processed by the fog device holding the task or fog devices close to the holding device; a moderate task (
 ) needs to query ancillary data from a hospital RRDB and then is processed by the fog device holding the task or fog devices closing to the holding device; and a complex task (
 ) will be sent to cloud by a fog controlling device. We define that the complexities of a
  , a
, a  and a
and a  are less than 60, in [60,90], and more than 90 respectively. Fig. 9 shows the action loop time of 12
  s, 6
s, 6  s and 2
  s, where the average response time (i.e., average loop time) of
  s,
s,  s and
s and  s are around 50 ms, 90 ms and 150 ms respectively. On one hand, locally processing a simple task by a fog device takes little transmission time and transmitting a task from fog to cloud needs much time. On the other hand, though the processing power of CCC is stronger than that of a fog device, CCC needs to process more complex tasks than fog devices.
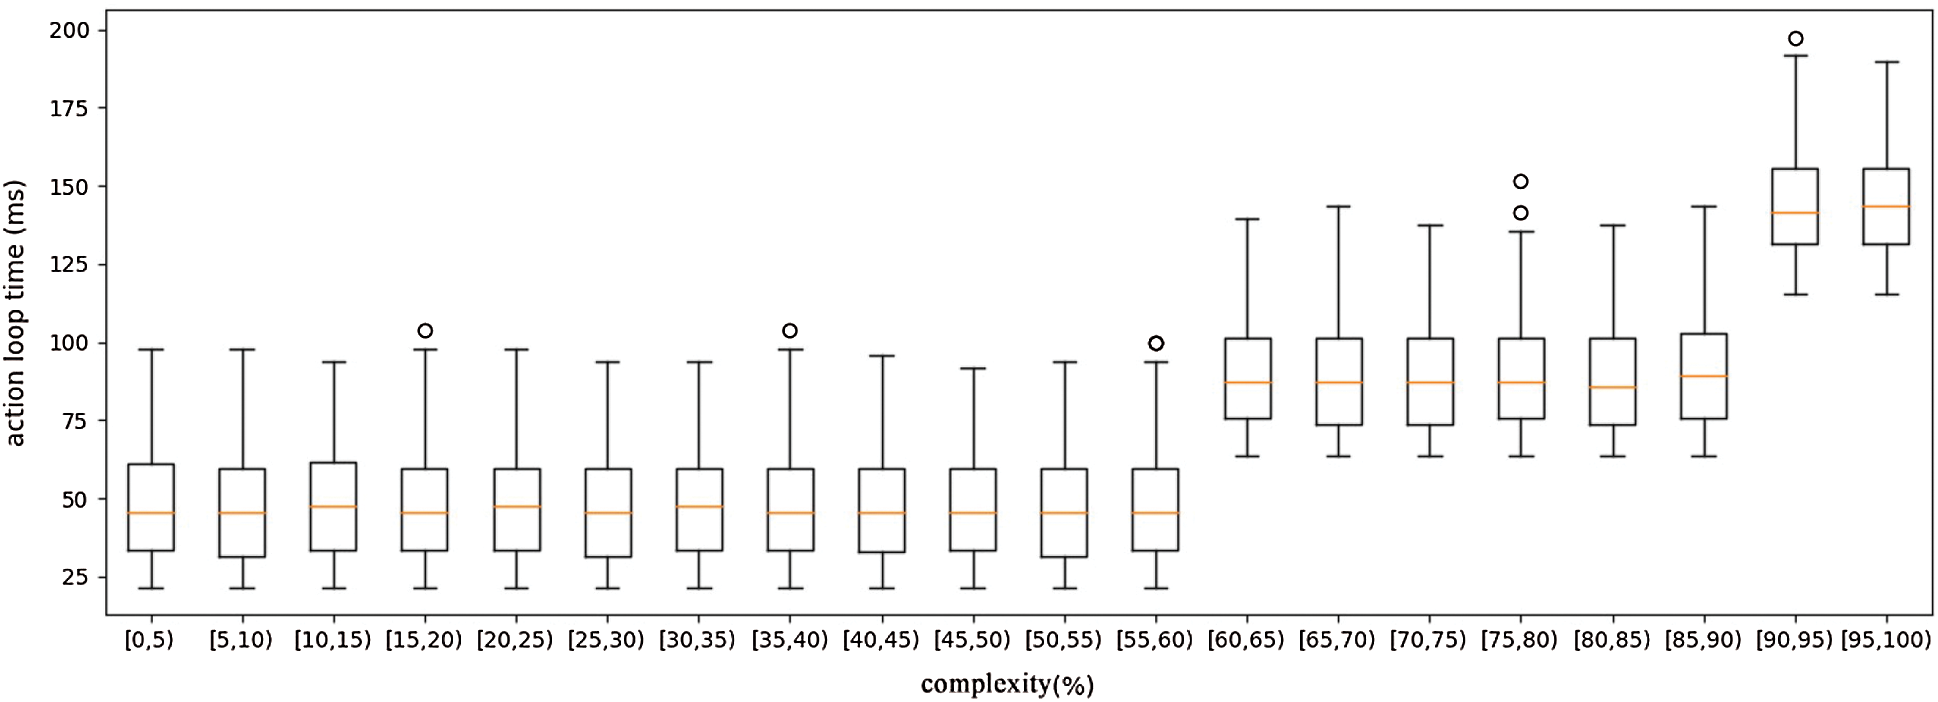
Figure 9: Response time of FogMed with respect to different task complexities
From Figs. 8 and 9, we can see that CCC takes 250 ms on average to process all types of tasks simultaneously, and 150 ms on average to just process complex tasks. This is because sending more tasks to CCC increases the occurrence possibility of network congestion in one time period, and tasks may need to be queued to wait for the free processing power.
From this experiment, we can see that distributing all tasks to cloud has to solve problems of remote transmission, network congestion and task overwhelming. However, FogMed takes advantage of both fog and cloud resources, which solves the problem that the fog layer lacks computation and storage resources, and eases network congestion and task overwhelming for the cloud layer. In addition, for small hospitals or individuals, it is simpler and more practical to build or use cheap fog devices near to them. Overall speaking, fog computing is more appropriate to solve ehealth problems and FogMed is an efficient and practical framework for disease diagnosis and prognosis.
This section reviews state-of-the-art about the fog-based ehealth, focusing on discussing disease prognosis, Medical data stream mining, QoS optimization and energy saving. Based on the literature review, we point out some unresolved issues.
4.1 QoS Optimization and Energy Saving in Fog-Based ehealth
Many scholars explored the problem of QoS optimization in fog environment. Muhammed et al. [24] proposed a network management framework to solve the QoS optimization of network latency, bandwidth, and reliability in the IoT-based ehealth system. It uses an edge device called cloudlet [25] to implement the fog framework. Different to [24], Rahmani et al. [26] designed a gateway as an intelligent fog device to connect end users and resource centers. The gateway-based healthcare system considers these QoS parameters: End-device mobility, energy saving, service availability and resource scalability. Gu et al. [27] applied the fog computing to Medical intelligent systems, and explored the problems of task allocation, virtual machine distribution, and resource collaborations among root stations. Shukla et al. [28] developed a fuzzy model for latency minimization of the fog network in healthcare IoTs. Petrakis et al. [29] developed an IoT as a Service (iTaaS) to collect and process sensor data. They applied iTaaS to Medical sensor data stream management to speed up the answering of Medical services. Asif-Ur-Rahman et al. [30] designed a five-layer framework based on fog computing to optimize the resource usage and the Medical task distribution. Wei et al. [31] proposed a model-free reinforcement learning method to solve the problem of formulating and balancing the computation offloading in a mobile edge environment.
Sensor-based fog computing faces an important problem: How to balance the limited power of fog devices and the requirements on processing a large amount of data. To solve this problem, Sodhro et al. [32] proposed an adaptive power control algorithm that can save more power, reduce packet loss and calculation complexity, and improve link reliability. Qu et al. [33] summarized the main challenges, analyzed corresponding solutions proposed by existing works, helped readers have a deeper understanding on the concepts of different computing models and studied the techniques of QoS optimization and energy saving in these models. In 2017, work [34] proposes two green and sustainable algorithms to improve the battery life in the transmission of the Variable Bit Rate (VBR) video in wireless body sensor networks. Later, an algorithm of processing various postures of subjects [35] and considering power control was proposed. Further, the work [16] designs two advanced algorithms, named Hybrid Adaptive Bandwidth and Power Algorithm and Delay-tolerant Streaming Algorithm. In addition, the work [16] explores the problem of power control in sensor-based smart healthcare, which introduces an adaptive transmission power control algorithm and a battery and power gathering model for body sensors.
4.2 Medical Data Stream Analysis in Fog-Based ehealth
Farahani et al. [18] did a survey on the fog-driven ehealth. Based on the review, they introduced an architecture of IoT ecosystem and discussed challenges in building this system. This work discusses applications of the existing resource management and data analysis techniques to the ecosystem, and reviews multiple Medical problems based on different types of Medical data. Borthakur et al. [36] introduced a fog architecture for unsupervised mining of the physical data. Nguyen et al. [37] developed a health management system for heart diseases based on low-cost fog nodes. However, this work neither investigates the data stream analysis and fog computing techniques in detail, nor designs advanced QoS optimization and energy saving strategies. Our work is different to the above works because we focus on making accurate and time-efficient predictive decisions for disease prognosis. We aim to develop new algorithms of anomaly prediction in Medical data streams, and new QoS optimization and energy saving techniques to improve the prediction accuracy and efficiency.
4.3 Disease Prognosis Based on Data Stream Mining
Some researchers explored the disease prognosis techniques without considering the network environment and the computing paradigm. For example, Yoon et al. [38] proposed a forecasting system for prognosis decision making, which monitors patients in hospitals and analyzes the disease status based on the monitored data streams of physical parameters. Tashkandi et al. [39] explored similarity calculation techniques among patients having similar diseases, aiming to improve the prognosis results based on the historical information of the other patients. Sow et al. [40] investigated the techniques of fast online predictions in a short period based on the live data of patients in hospitals. One problem of the above work is that they only discuss the disease prognosis in hospitals, but do not consider the cases of remote monitoring of the patient status. Wang et al. [41] discussed big data processing and analysis according to different service requirements and introduced the detailed cloud computing service system based on big data. Yin et al. [42] analyzed the feature and problem of finite state automata and improved nondeterministic finite automata by reducing the conversion edge to reduce the memory usage.
4.4 Differences of the Above Works to FogMed
The main objective of FogMed is to support disease prediction based on Medical data streams. The above works are not appropriate for solving the problem considered in FogMed. To achieve the objective, FogMed should have a mechanism to automatically segment a long-term Medical data stream precisely, learn association rules between a preceding segment and a future abnormal segment, and allocate and store the segments and rules properly to support fast information query. Therefore, QoS optimization strategies for making predictive Medical decisions should consider how to transmit, allocate and store the correlated segments and rules in a fog environment, and when to perform predictions and make decisions based on the rules and the current QoS levels of fog services. In addition, few of the existing works investigate how fog computing techniques will affect the design of Medical data stream mining algorithms, and then affect the disease prediction performance. Therefore, it is necessary to design adaptive Medical data stream mining algorithms to fit the dynamic environment variables of fog computing.
In this work, we implemented a deep learning algorithm for anomaly prediction and validated the capability of Fog computing processing anomalies in Medical data streams in terms of the average response time. In the future, we will consider more QoS variables and explore how these QoS variables influence disease prediction tasks.
We proposed FogMed, a fog-based framework for disease prognosis based on Medical sensor data streams. FogMed aims to improve the prognosis accuracy by achieving two objectives: QoS optimization of fog services, and anomaly detection and prediction based on Medical data streams. In addition, we built a virtual FogMed environment and conduct comprehensive experiments on the public ECG dataset. In the future, we will consider power constraints of fog devices and develop advanced power saving techniques in FogMed. Furthermore, we will explore power-aware task allocation algorithms to improve the anomaly prediction performance in power-constrained environment.
Funding Statement: This work is supported by NUIST Students’ Platform for Innovation and Entrepreneurship Training Program, the National Natural Science Foundation of China (Grants No 61702274), the Natural Science Foundation of Jiangsu Province (Grants No BK20170958), and PAPD.
Conflicts of Interest: The authors declare that they have no conflicts of interest to report regarding the present study.
References
1. T. G. Bilal Muhsin and A. Sampath. (2015). “Systems and methods for storing, analyzing, retrieving and displaying streaming medical data,” US Patent 9142117B2.
2. S. Cao, G. Zhang, P. Liu, X. Zhang and F. Neri. (2019). “Cloud-assisted secure ehealth systems for tamper-proofing her via blockchain,” Information Sciences, vol. 485, pp. 427–440.
3. Y. Zhang, C. Xu, H. Li, K. Yang, J. Zhou et al.. (2018). , “HealthDep: An efficient and secure deduplication. scheme for cloud-assisted ehealth systems,” IEEE Transactions on Industrial Informatics, vol. 14, no. 9, pp. 4101–4112.
4. L. Sun, J. Ma, H. Wang, Y. Zhang and J. Yong. (2018). “Cloud service description model: An extension of USDL for cloud services,” IEEE Transactions on Services Computing, vol. 11, no. 2, pp. 354–368.
5. A. A. Mutlag, M. K. A. Ghani, N. Arunkumar, M. A. Mohammed and O. Mohd. (2019). “Enabling technologies for fog computing in healthcare iot systems,” Future Generation Computer Systems, vol. 90, pp. 62–78.
6. M. Muzammal, R. Talat, A. H. Sodhro and S. Pirbhulal. (2020). “A multi-sensor data fusion enabled ensemble approach for medical data from body sensor networks,” Information Fusion, vol. 53, pp. 155–164.
7. Y. Lin, X. Jin, J. Chen, A. H. Sodhro and Z. Pan. (2019). “An analytic computation-driven algorithm for decentralized multicore systems,” Future Generation Computer Systems, vol. 96, pp. 101–110.
8. A. H. Sodhro, Z. Luo, G. H. Sodhro, M. Muzamal, J. J. Rodrigues et al.. (2019). , “Artificial intelligence based QoS optimization for multimedia communication in IoV systems,” Future Generation Computer Systems, vol. 95, pp. 667–680.
9. A. Al-Ali and J. E. Kiani. (2012). “Noninvasive multi-parameter patient monitor,” US Patent 8130105.
10. B. Muhsin and A. Sampath. (2012). “Systems and methods for storing, analyzing, retrieving and displaying streaming medical data,” US Patent 8310336.
11. S. Yang. (2017). “IoT stream processing and analytics in the fog,” IEEE Communications Magazine, vol. 55, no. 8, pp. 21–27.
12. Cisco. (2015). “Fog computing and the internet of things: Extend the cloud to where the things are,” USA: Cisco, . https://www.cisco.com/c/dam/en_us/solutions/trends/iot/docs/computingoverview.pdf
13. M. Iorga, L. Feldman, R. Barton, M. J. Martin, N. Goren et al.. (2018). , “Fog computing conceptual model,” Special Publication (NIST SP) -500-325.
14. S. Maity, D. Das and S. Sen. (2017). “Wearable health monitoring using capacitive voltage-mode human body communication,” in 2017 39th Annual Int. Conf. of the IEEE Engineering in Medicine and Biology Society, Jeju Island, Korea, pp. 1–4.
15. H. Gupta, A. V. Dastjerdi, S. K. Ghosh and R. Buyya. (2017). “IFogSim: A toolkit for modeling and simulation of resource management techniques in the Internet of Things, edge and fog computing environments,” Software: Practice and Experience, vol. 47, no. 9, pp. 1275–1296.
16. A. H. Sodhro, S. Pirbhulal, G. H. Sodhro, A. Gurtov, M. Muzammal et al.. (2019). , “A joint transmission power control and duty-cycle approach for smart healthcare system,” IEEE Sensors Journal, vol. 19, no. 19, pp. 8479–8486.
17. A. H. Sodhro, S. Pirbhulal, Z. Luo and V. H. C. de Albuquerque. (2019). “Towards an optimal resource management for IoT based green and sustainable smart cities,” Journal of Cleaner Production, vol. 220, pp. 1167–1179.
18. B. Farahani, F. Firouzi, V. Chang, M. Badaroglu, N. Constant et al.. (2018). , “Towards fog-driven IoT ehealth: Promises and challenges of IoT in medicine and healthcare,” Future Generation Computer Systems, vol. 78, pp. 659–676.
19. X. Huang, Y. Xiang, E. Bertino, J. Zhou and L. Xu. (2014). “Robust multi-factor authentication for fragile communications,” IEEE Transactions on Dependable and Secure Computing, vol. 11, no. 6, pp. 568–581.
20. H. M. Rai, A. Trivedi and S. Shukla. (2013). “ECG signal processing for abnormalities detection using multi-resolution wavelet transform and artificial neural network classifier,” Measurement, vol. 46, no. 9, pp. 3238–3246.
21. P. Malhotra, L. Vig, G. Shroff and P. Agarwal. (2015). “Long short term memory networks for anomaly detection in time series,” in 23rd European Sym. on Artificial Neural Networks, Computational Intelligence and Machine Learning, ESANN 2015, Bruges, Belgium.
22. A. L. Goldberger, L. A. N. Amaral, L. Glass, J. M. Hausdorff, P. C. Ivanov et al.. (2000). , “Physiobank, physiotoolkit, and physionet: Components of a new research resource for complex physiologic signals,” Circulation, vol. 2000, no. 101, pp. 215–220.
23. H. Li, Y. Wang, H. Wang and B. Zhou. (2017). “Multi-window based ensemble learning for classification of imbalanced streaming data,” World Wide Web, vol. 20, no. 6, pp. 1507–1525.
24. T. Muhammed, R. Mehmood, A. Albeshri and I. Katib. (2018). “Ubehealth: A personalized ubiquitous cloud and edge-enabled networked healthcare system for smart cities,” IEEE Access, vol. 6, pp. 32258–32285.
25. M. Satyanarayanan, P. Bahl, R. Caceres and N. Davies. (2009). “The case for VM-based cloudlets in mobile computing,” IEEE Pervasive Computing, vol. 8, no. 4, pp. 14–23.
26. A. M. Rahmani, T. N. Gia, B. Negash, A. Anzanpour, I. Azimi et al.. (2018). , “Exploiting smart e-health gateways at the edge of healthcare internet-of-things: A fog computing approach,” Future Generation Computer Systems, vol. 78, pp. 641–658.
27. L. Gu, D. Zeng, S. Guo, A. Barnawi and Y. Xiang. (2017). “Cost efficient resource management in fog computing. supported medical cyber-physical system,” IEEE Transactions on Emerging Topics in Computing, vol. 5, no. 1, pp. 108–119.
28. S. Shukla, M. F. Hassan, L. T. Jung, A. Awang and M. K. Khan. (2019). “A 3-tier architecture for network latency. reduction in healthcare internet-of-things using fog computing and machine learning,” in The 2019 8th Int. Conf., Beijing, China, pp. 522–528.
29. E. G. Petrakis, S. Sotiriadis, T. Soultanopoulos, P. T. Renta, R. Buyya et al.. (2018). , “Internet of Things as a. service (iTaaSChallenges and solutions for management of sensor data on the cloud and the fog,” Internet of Things, vol. 3–4, pp. 156–174.
30. M. Asif-Ur-Rahman, F. Afsana, M. Mahmud, M. S. Kaiser, M. R. Ahmed et al.. (2019). , “Toward a heterogeneous mist, fog, and cloud-based framework for the internet of healthcare things,” IEEE Internet of Things Journal, vol. 6, no. 3, pp. 4049–4062.
31. Y. Wei, Z. Wang, D. Guo and F. R. Yu. (2019). “Deep Q-learning based computation offloading strategy for mobile edge computing,” Computers, Materials & Continua, vol. 59, no. 1, pp. 89–104.
32. M. A. Shah, Y. Li and A. H. Sodhro. (2016). “Energy-efficient adaptive transmission power control for wireless body area networks,” IET Communications, vol. 10, no. 1, pp. 81–90.
33. Z. G. Qu, Y. L. Wang, D D. Peng, L. Sun and Z. Li. (2020). “Study QoS optimization and energy saving techniques in cloud, fog, edge, and IoT,” Complexity, vol. 2020, pp. 16.
34. A. H. Sodhro, Y. Li and M. A. Shah. (2017). “Green and friendly media transmission algorithms for wireless body sensor networks,” Multimedia Tools and Applications, vol. 76, no. 19, pp. 20001–20025.
35. A. H. Sodhro, S. Pirbhulal, M. Qaraqe, S. Lohano G. H. Sodhro et al.. (2018). , “Power control algorithms for media transmission in remote healthcare systems,” IEEE Access, vol. 6, pp. 42384–42393.
36. D. Borthakur, H. Dubey, N. Constant, L. Mahler and K. Mankodiya. (2017). “Smart fog: Fog computing framework for. unsupervised clustering analytics in wearable Internet of Things,” in 2017 IEEE Global Conf. on Signal and Information Processing, Montreal, Canada, pp. 472–476.
37. T. N. Gia, M. Jiang, V. K. Sarker, A. M. Rahmani, T.Westerlund et al.. (2017). , “Low-cost fog-assisted health-care IoT system with energy-efficient sensor nodes,” in 2017 13th Int. Wireless Communications and Mobile Computing Conf., Valencia, Spain, pp. 1765–1770.
38. J. Yoon, A. M. Alaa, S. Hu and M. V. D. Schaar. (2016). “Forecasticu: A prognostic decision support system for timely prediction of intensive care unit admission,” in Proc. of the 33rd Int. Conf. on Int. Conf. on Machine Learning, New York, USA, vol. 48, pp. 1680–1689.
39. A. Tashkandi, I. Wiese and L. Wiese. (2018). “Efficient in-database patient similarity analysis for personalized medical decision support systems,” Big Data Research, vol. 13, pp. 52–64.
40. D. M. Sow, J. Sun, A. Biem, J. Hu, M. L. Blount et al.. (2012). , “Real-time analysis for short-term prognosis in intensive care,” IBM Journal of Research and Development, vol. 56, no. 5, pp. 3:1–3:10.
41. J. Wang, Y. Q. Yang, T. Wang, R. S. Sherratt and J. Y. Zhang. (2020). “Big data service architecture: A survey,” Journal of Internet Technology, vol. 21, no. 2, pp. 393–405.
42. C. Y. Yin, H. Y. Wang, X. Yin, R. X. Sun and J. Wang. (2019). “Improved deep packet inspection in data stream detection,” Journal of Supercomputing, vol. 75, no. 8, pp. 4295–4308.
 | This work is licensed under a Creative Commons Attribution 4.0 International License, which permits unrestricted use, distribution, and reproduction in any medium, provided the original work is properly cited. |