DOI:10.32604/cmc.2020.012542
| Computers, Materials & Continua DOI:10.32604/cmc.2020.012542 | |
| Article |
Analysis of the Smart Player’s Impact on the Success of a Team Empowered with Machine Learning
1Lahore Garrison University, Lahore, 54792, Pakistan
2Computer Science Department, Umm Al-Qura University, Makkah City, 715, Saudi Arabia
*Corresponding Author: Muhammad Adnan Khan. Email: madnankhan@lgu.edu.pk
Received: 03 July 2020; Accepted: 03 August 2020
Abstract: The innovation and development in data science have an impact in all trades of life. The commercialization of sport has encouraged players, coaches, and other concerns to use technology to be in better position than r their opponents. In the past, the focus was on improved training techniques for better physical performance. These days, sports analytics identify the patterns in the performance and highlight strengths and weaknesses of potential players. Sports analytics not only predict the performance of players in the near future but it also performs predictive modeling for a particular behavior of a player in the past. The impact of a smart player on the success of a team is always a big question mark before the start of a match. The fans always want to know performance analysis of these superstar players and they always are interested to get to know more about their favorite player and they always have high hopes from their favorite player. Machine learning (ML) based techniques help in predicting the performance of an individual player as well as for the whole team. The statistics are very vital and useful for management, fans, and expert analysis. In our proposed framework, the adaptive back propagation neural network (ABPNN) model is used for the prediction of a player’s performance. The data is collected from football websites, and the results are stored in the cloud for fast fetching of data. They can be retrieved anywhere in the world through cloud storage. The results are computed with 94% accuracy and the performance of the smart player is formulated for the success of a team.
Keywords: Machine learning; adaptive feed forwarded neural network; adaptive back propagation neural network; cloud computing; fetching
Sports are a vital part of life. Health and other fitness-related activities are directly related to sports. Predictive modeling helps to do legacy analysis for the sports world. Although Machine learning has taken all walks of life by storm, it is yet to make an impact in sports.
Data analytics is focused on players’ performance both during the training and on the game day. Its end goal is to help players with the better performance and the match winning strategy. The data assists coaches to identify weaker or stronger players. A smart player is a blessing in a team. Smart players have leadership qualities that provide an edge to the team in winning matches. Smart players have a vast experience that also helps in setting plans for the success of the team. Smart players also have confidence and motivation that helps other young and emerging players to play a positive role. Emerging and young less experienced players also learn experience from smart and experienced players while playing with them. So smart players are truly a blessing to a sports franchise. In Sports, many smart players are known for their skills and experience. Michel Jordan, Leonel Messi, Cristiano Ronaldo, Luka Modric, Marcus Reus, Neymar Jr, Roger Federer, and many other players that are playing in their specific sports and fans are loving their existence in the sport. To discover how much a smart player has an impact on the progress of a team, we have performed a research plan that will predict how much the success of a team is dependent on a smart player’s involvement in a game.
For this purpose, we had collected a dataset of Leonel Messi who is playing football since 2005 and has successfully won 6 Ballon d’Or in his career and it is worth to mention that no player has won this award six times. He is a living legend of this game. We used his statistics since 2005 after his debut in Barcelona football club. We have implemented the Adaptive feed forwarding neural network (AFFNN) on the stats and computed results.
Although there are great players especially in football but there are only a few players whose results and statistics can be used for the solution of this problem. The special thing about Leonel Messi is that from his debut and till now he is the person who has not changed his club and all of his performances are from the Barcelona football club, hence Leonel Messi’s data is used for the model training instead of Cristiano Ronaldo, Harry Kane, Wayne Rooney, Neymar Jr, Mohammed Salah, etc.
Neural networks are a set of algorithms, modeled loosely after the human brain that is designed to recognize patterns. They interpret sensory data through a kind of machine perception, labeling, or clustering raw input [1]. Machine learning (ML) is a method of data analysis that automates analytical model building. It is a branch of artificial intelligence using the notion that systems can learn from data, identify patterns, and make decisions with minimal human intervention [2].Supervised learning (SL) is the machine learning task of learning a function that maps an input to an output based on example input-output pairs. It infers a function from labeled training data consisting of a set of training examples [3].
Unsupervised learning (UL) is a type of machine algorithm used to draw inferences from datasets consisting of input data without labeled responses. The most common unsupervised learning method is cluster analysis, which is used for exploratory data analysis to find hidden patterns or groupings in data [4].
Artificial neural networks (ANNs) are perhaps the most commonly applied approach among machine learning mechanisms to predict the sports’ result. Thus, for this review, we focus on studies that have applied ANNs. An ANN usually contains interconnected components (neurons) that transform a set of inputs into the desired output [5]. Machine learning is a mechanism that is used to predict unknown values. In sports, Machine learning can be used to predict the win, loss, and other situations that a team management can use for the following outcomes.
•Prediction of the outcome of a game.
•Prediction of the League favorites.
•Prediction of the performances of teams or individual players in a complete league.
•Building new strategies for upcoming competitions.
•Evaluating opponent weaknesses and strong areas in the game.
•Deciding the price of a player if a club was to be rented/sold/bought.
The above-mentioned facts are a few very important parameters that the management of a team must be aware as huge finance is involved in sports nowadays and to fulfill the expectations of fans, ML based analysis has become the need of a team.
Using a player’s previous records, the performance of the player in future, can be predicted and he/she can improve after getting those predictions. The management can also train the player while considering his age factor in mind as well. As the age goes up the stamina, agility, shooting (long shoots, shot power), pace, and physical condition of that player goes down so the player needs good rest and his training sessions are reduced and he is allowed more rest to adapt the game with his new physical conditions. These precautions also lead the player to play the game for a long time. As long as the player is playing, the chances of scoring and assisting goals are also increased. The player who has more experience and about to retire, continues to play, the morale of young players is increased they display better gameplay and their performance is enhanced. The experience of a smart player on the field also opens the doors for new ideas and styles of gameplay to the team e.g., attacking or defending. Hence, to keep that player on the field is also very important for the success of the team, as well as the fan following of old payers is very large in numbers. This will attract a huge audience on the field increasing the revenue and bring money to the club in the form of tickets, channels, and brand sponsors.
After the prediction, the results are stored in the cloud system so that they can be accessible for everyone. Cloud is used for storing data on the public servers of companies and we pay companies to get storage and resources are allocated as per our requirement. The company charges us as per the policy agreement. The fact to use cloud services for data storage is that the data loss ratio is very low as the companies continuously work to make the system better and continuously checks for errors. So, it is economical and beneficial to use cloud services for storage.
The remainder of this paper is organized as follows. Section 2 briefly describes the related work. Section 3 presents the method to carry out a comprehensive evaluation for the prediction of team success and the impact of the smart player on it. Section 4 discusses the simulation and results of the ML approach. In Section 5, conclusions from the study are drawn. Section 6 discusses future work from the study.
Artificial intelligence (AI) is a rapidly growing technology, made possible by the growth of the Internet that will have a significant impact on our everyday lives. AI traditionally refers to an artificial creation of human-like intelligence that can learn, reason, plan, perceive, or process natural language [6].
Machine learning systems automatically learn programs from data. This is often a very attractive alternative to manually building them. In the last decade, the use of machine learning has spread rapidly in computer science and beyond. Machine Learning is used in web search, spam filters, recommender systems, ad placement, credit scoring, fraud detection, stock trading, drug design, and many other applications [7].
The early movement in machine learning was also characterized by an emphasis on ‘symbolic’ representations of learned knowledge, such as production rules, decision trees, and logical formulae [8].
The next step in solving the classification problems starts with the establishment of induction methods. Some of the most popular of this kind are recursive, ID3, C4.5, CN2, C5.0, K nearest neighbors (KNN) algorithm, and structural equation modeling, which compares theoretical models to datasets [9]. Pfeiffer and Hohmann [10] have shown that training science views itself as an integrated and applied science, developing practical measures based on scientific methods. The interrelations between different variables or variable sets are mostly nonlinear. In these cases, methods like neural networks, e.g., the pattern recognizing methods of self-organizing Kohonen feature maps or similar instruments to identify interactions are successfully applied to analyze data. Memmert [11] has outlined a framework for analyzing types of individual development of creative performance using neural networks. Consequently, two kinds of sport-specific training programs for learning the game creativity in real field contexts have been investigated. Using neural networks, it is now possible to distinguish between five types of learning behaviors in the development of performance, the most striking ones being “up-down” and “down-up”.
AI methods for the machine-aided appraisement of weight training exercises are used in [12]. The implementation involved the use of sensors in the training equipment, allowing an effective acquisition and collection of sport-specific data. The gathered parameter values were applied for the automated analysis of the performed exercises. The modeling of the data was based on supervised learning procedures integrating ANNs. The pre-processed sensor input was used for the classification and autonomous appraisal of the executions. The developed techniques showed good results and performance outcome, raising promise for their practical application in integrated feedback systems.
AI methods in team sports is used in a number of published studies. The current state of development in the area proposes a promising future with regard to AI use in team sports. Further evaluation research based on prospective methods is warranted to establish the predictive performance of specific AI techniques and methods [13].
Dataset for this problem was created using the results of football matches of Football club barcelona (FCB), from season 2005 to 2020 April before the coronavirus pandemic. All the results are collected from https://www.worldfootball.net/. The website contains results of matches from 2005 all the results are authenticated and verified.
The player performance and its impact on a team’s success is a model that may predict the result of a match in a certain format. The graphical model has two layers (training layer and validation layer). Both layers are simulated in the first phase of the process after training the model through an ANN and ML. The trained model then goes into a layer where the data is input to the system and the system predicts values and stores results on the cloud server for further correspondence.
The training phase consists of 3 sub-layers.
1.Data acquisition layer
2.Preprocessing layer
3.Application training layer
The neural network model and mathematical equations of the model are also described below in the proposed model.
The data has six input columns that consists of Messi played (MP), Messi goals (MG), Team player goals (TPG), Barcelona goals (BG), Opponent goals (OG), and Match result (MR).
MP has two possible outcomes played or rest. MG has values starting from 0 to ∞, TPG has values starting from 0 to ∞, BG has values starting from 0 to ∞, OG has values starting from 0 to ∞, and MR has three possible outcomes win, lose or draw.
Similarly, these six inputs have some values defined specifically for the trained model. MP (0, 1) 0 for rest and 1 for playing, MG ( 0  ), TPG ( 0
  ), BG ( 0
 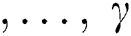 ), OG ( 0
  ), and MR (0, 1, 2) 0 for loose, 1 for a draw, 2 for a win, where
  could be any positive integer.
Talking about the output it has three possible predictions Messi dependent (MD), Team dependent (TD), and Opponent dependent (OD), these classes defined as 2, 1, 0 respectively.
The Stats of Messi in all time representation at Barcelona shows that he has played 717 matches till now and Barcelona has played 927 matches after his debut, which means that Leo Messi has played 77% matches of total Barcelona matches. Out of those 717 matches, he was the man of the match for 196 matches and in 202 matches his performance was outstanding. Barcelona won, 28% of matches due to the appearance and outstanding performance of Leo Messi.
The letters and alphabets (words) are converted in to numeric so that the model can be tested and experiments can be performed.
3.2.3 Application Training Layer
Fig. 1 shows that the proposed model consists of two sub phases: one is the training layer and the second is the validation layer. In the training layer, the results of the match are collected in the Data acquisition layer e.g., Match results, Messi statistics, Opponent statistics, Polls and other trending results, and Previous statistics regarding the teams. Then these are stored in one place and the data is called raw data. In the third stage that is called the pre-processing stage, data is simplified using normalization, moving average, and mean. After the pre-processing, the refined form of data is ready for training and prediction and it is sent for training. After training, the results are evaluated through performance evaluation layer and in this layer the Mean squared error (MSE), Accuracy, and Miss rate of the results are generated. If the generated results are valid then they are forwarded to the cloud server and saved for the validation phase. If the results are not accurate and up to the scale, the training phase is re-activated and re-training is performed.
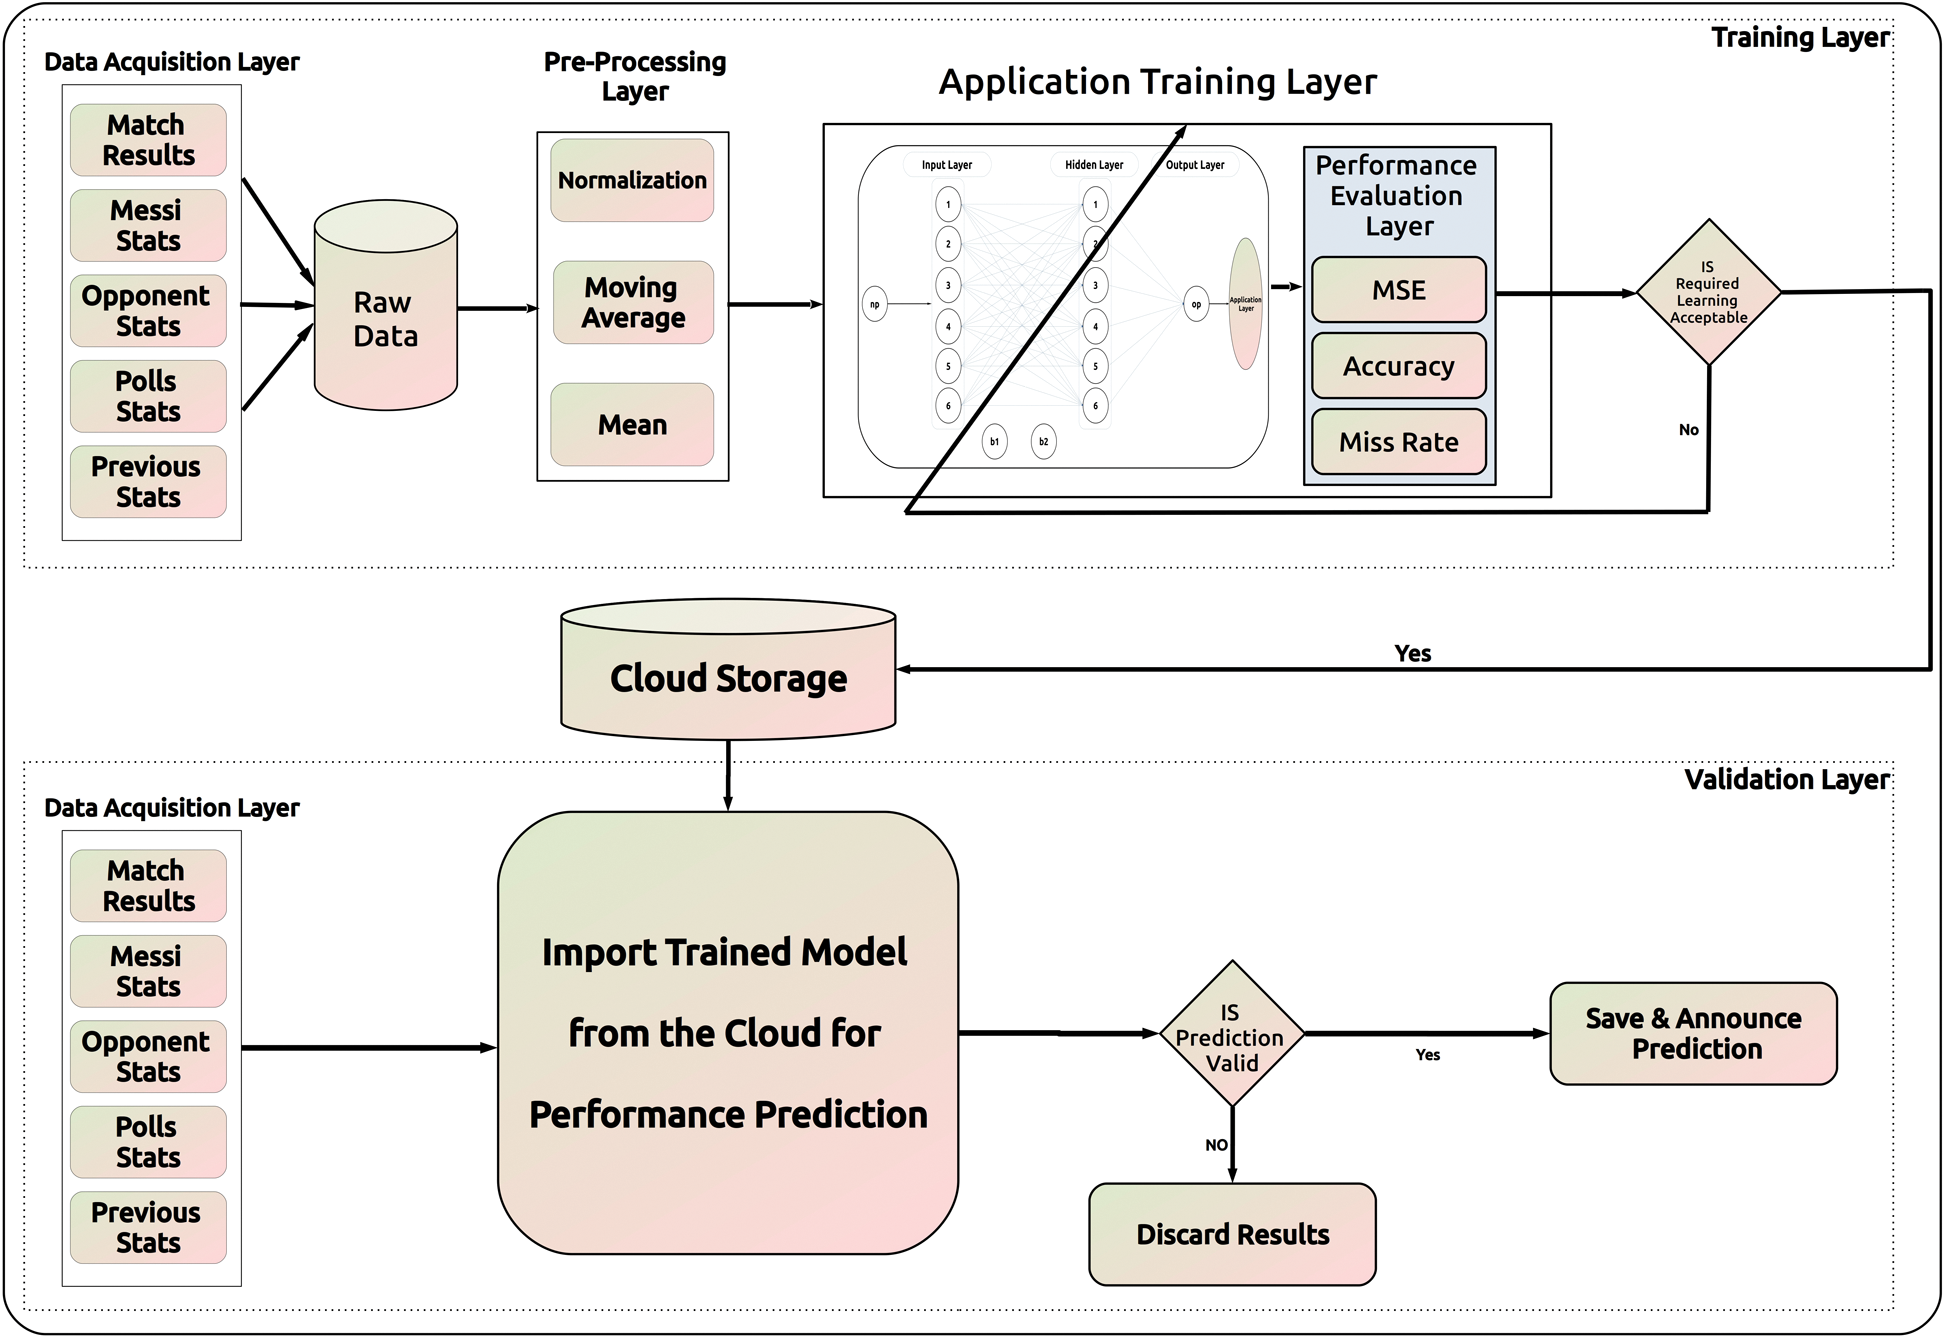
Figure 1: Proposed model for team success and impacts of player presence
In the validation phase, the data is gathered from the data acquisition layer and the trained model is imported from the cloud and the results are generated using the trained model. If the predictions are valid then the results are saved otherwise, they are discarded.
To predict the overall performance of the team and individual player the inputs are defined below in Tab. 1.
Table 1: Input/output variables of the proposed model
The number of neurons in the input layer is six, similarly, hidden layer neurons are the same, output has one neuron and one possible class to predict out of three classes.
After saving the data on the cloud, validation phase is activated which is further divided into two layers i.e., data acquisition layer and the prediction layer. In data acquisition layer input data is the same as mentioned before.
3.4 Neural Network Proposed Model
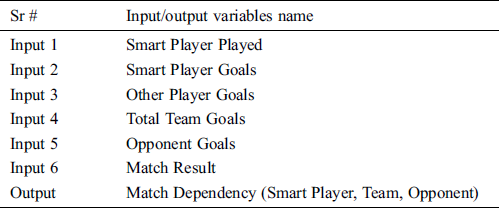
Predictive modeling is the general concept of designing a model that is capable of making predictions. Typically, such a model includes a machine learning algorithm that learns certain properties from a training dataset to make those predictions [14]. Fig. 2 shows the neural network model that has three layers: the input layer, hidden layer, and output layer. There are many algorithms that are used in ML and a user is expected to just know the application of a particular algorithm and how it fits in that application [15].
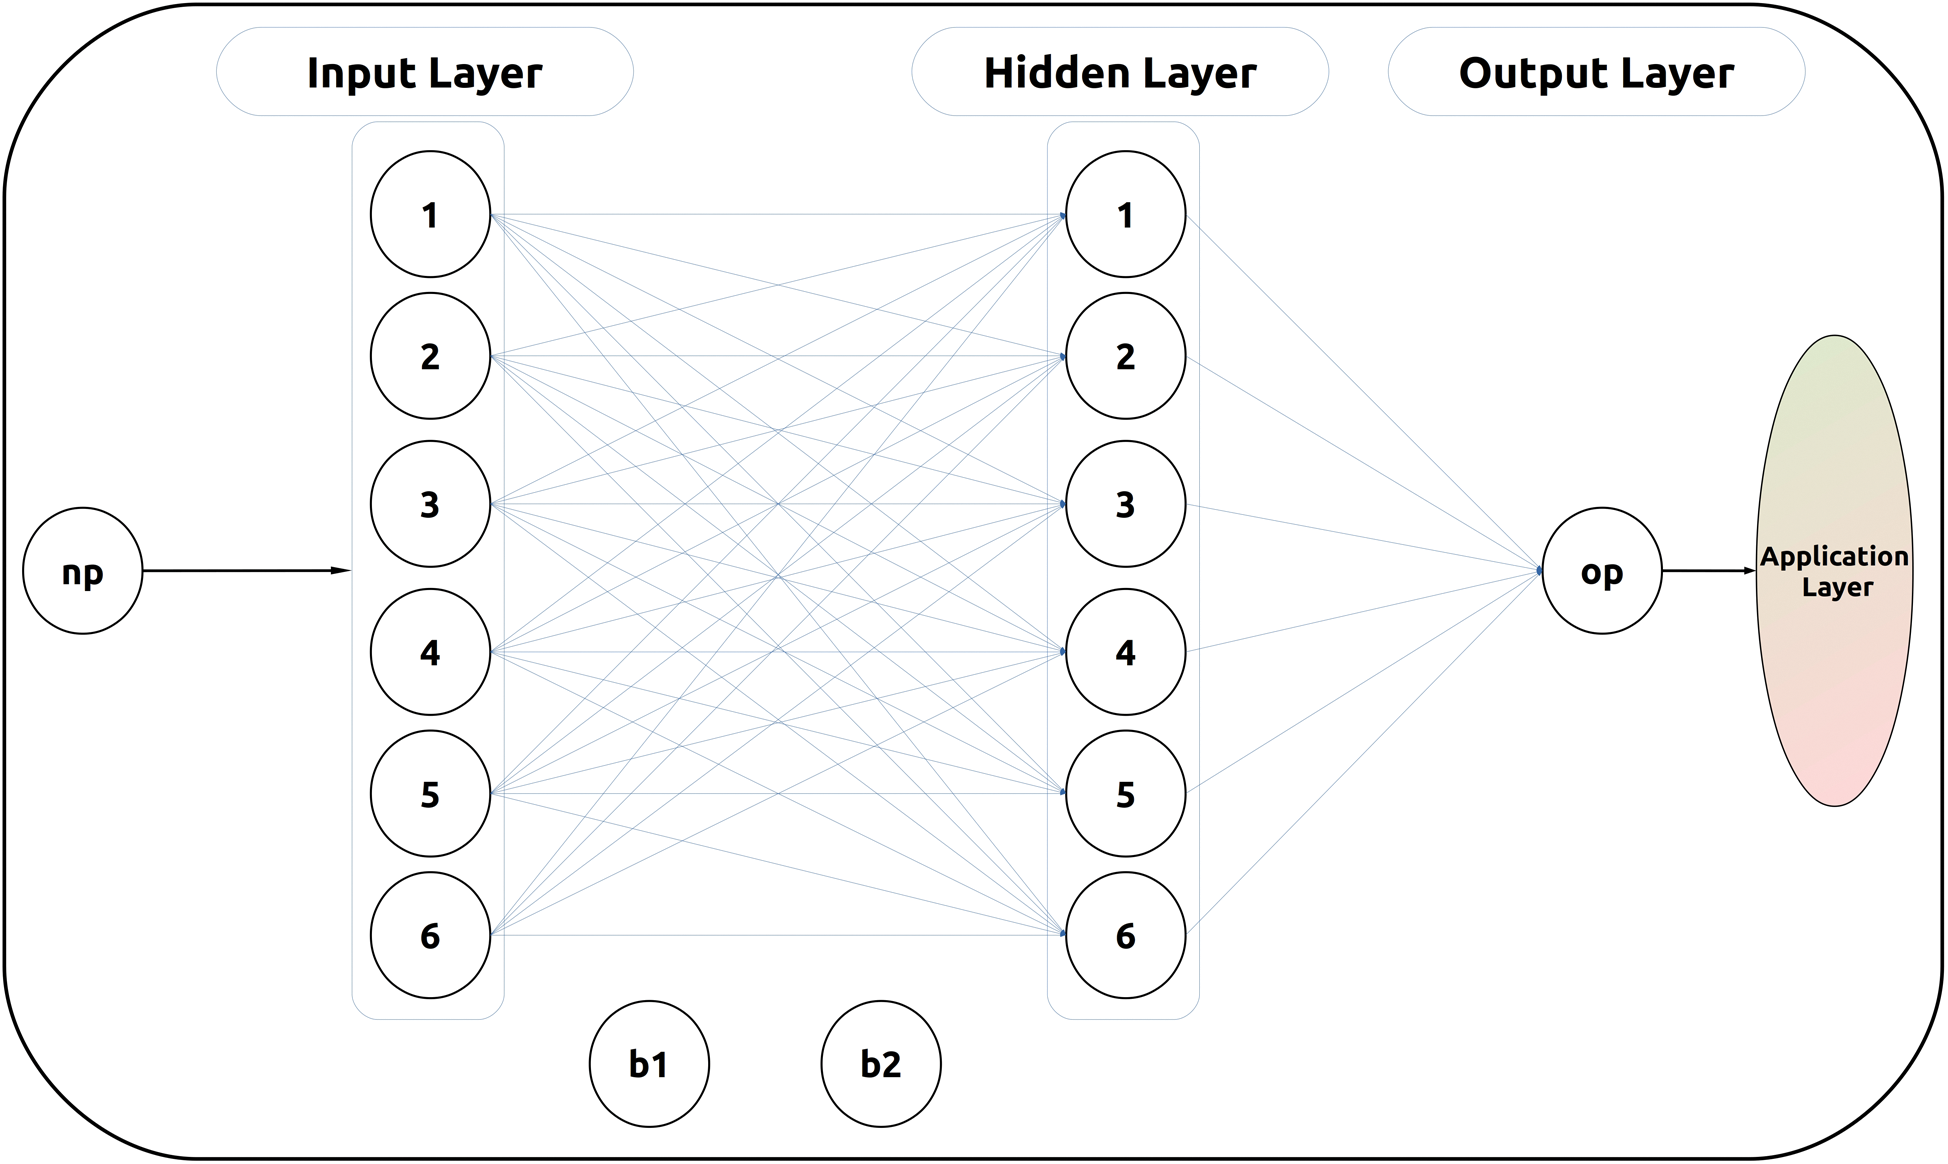
Figure 2: Structural diagram of the proposed machine learning (ML) model
In the first layer (input layer) there are six neurons represented as  respectively as shown in Fig. 2. Similarly, in the second layer (hidden layer) there are also six neurons represented as
  as well are shown in Fig. 2. Similarly, output “op” from Fig. 2 is represented as: “
 ” in the mathematical equations.
Fig. 2 shows b1 and b2 are biases of the model which is represented as:  respectively in the mathematical equations.
The edges between input and hidden layers are not labeled in the diagram but all the edges carry values that transfer from input to the hidden layer. These are represented as  , where “m” is the number of neurons of the input layer (
 ), and “n” is the number of neurons in the hidden layer (
 ) in the mathematical equations.
The edges between the hidden and output layer are represented as:  , where n is defined above and k is the number of outputs (
 ) which is one in our model.
3.5 Mathematical Proposed Model
The proposed Adaptive back propagation neural network-based mathematical model consists of six neurons that are used in the sensor layer while six neurons are used at the hidden layer and only one neuron is used in the output layer to show the predicted value of the model. The  ,
,  ,
,  , and
, and  is calculated using the following equations.


The total error can be calculated through the following formula.

We want to adjust the weights of the network with respect to overall error. It can be written as:

Updating weights between the hidden layer and output layer can be written as:


where,

Weight change rule for input to the hidden layer


where,

Then weight updating equation can be written as:

Similarly, weights updating equation and hidden layer can be written as:

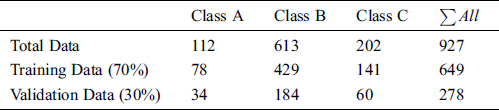
In this study, we have used MATLAB 2019 for the simulation purpose. The total samples used for training were 649 which was 70% of the complete dataset containing 927 samples [16]. Out of these 927 samples, 112 samples were from class A, 613 samples were from class B, and 202 samples were from class C. The remaining 278 samples were used for the validation purpose to check the performance of the trained model in the real scenario. There are three possible classes of the output, and data was distributed equally on the training purpose and validation purpose. 78 samples of class A were used in r training which is exactly 70% of class A samples, 429 samples from class B were used in training which is exactly 70% of total class B samples while, 141 samples from class C are used for training which is exactly 70% of total class C samples. 34 samples of class A, 184 samples of class B and 61 samples of class C are used for validation, that makes 30% of each class. The data is presented in Tab. 2.
The results of the data show that Barcelona has played 927 matches after the arrival of Messi and Messi has appeared in 717 matches. Messi has scored 624 goals till now. Barcelona has won more than 90% of their matches and in those matches, 202 matches were fully dependent on the performance of Messi which is a marvelous performance by a single player and through his leadership skills, Barcelona has won 3 UCL Championships and 9 Laliga titles in the last 15 years and no other team has achieved such accomplishment. The performance of Barcelona after the debut of Messi is incredible. The results prove the data and show that the success of Barcelona is dependent on the performance of Messi.
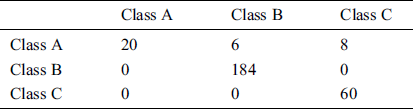
Tab. 3 represents the percentage of each class instances which are used during simulation. The confusion matrix for the model has three classes A, B, and C. Total 34 samples of class A are given as input and the results show that 20 samples are predicted as class A, 6 are predicted as class B and 8 samples are predicted as class C. Similarly, 184 samples of class B are given and all of them are predicted as class B. 60 samples of class C were used as input and all of them were predicted as class C. The confusion matrix is defined below in the Tab. 4.
Table 3: Classwise participation of data
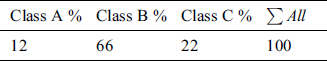
Table 4: Confusion matrix of the proposed model


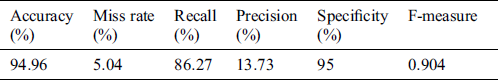
Tab. 5 shows the proposed system model performance in terms of different statistical measures. The results of overall data show that the error is 0.0502 (5.04%), and overall accuracy is 0.9498 (94.96%), out of 278 samples, 14 predictions were wrong and 264 predictions were correct that means approx. 94% of the results were accurate. Recall is 86.37% (0.86), Precision is 13.73% (0.13), Specificity is 95% (0.95).
Table 5: Performance analysis of the proposed model in terms of different statistical measures
Class wise accuracy of the validation data is also calculated and the formulas and mathematical expressions using those values are calculated are described below:


where “ ” is the total number of predicted class A members and “
 ” is the total number of class A participants in the validation dataset, “
 ” is the total number of predicted class B members and “
  ” is the total number of class B participants in the validation dataset, and “
 ” is the total number of predicted class C members where “
  ” is the total number of class C participants in the validation dataset. The values derived from these equations are described in Tab. 6.
Table 6: Class wise accuracy of the validation dataset
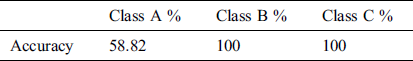
The results show that the Class B & C are trained perfectly and their results are awesome, on the other side the Class A was not trained perfectly and the error and miss rate is high (41%) and accuracy (59%) is low. The foremost reason behind the poor results of class A prediction is that the samples that belong to Class A are very few, only 112 of the total datasets (927). This is only 12% of the whole data set. That’s why Class A is not well trained and its results are not satisfying. In general, we cannot expect good results from a class which is just 12% of the whole dataset. Class A represents the Losses of Barcelona football club and in the last 15 years after the arrival Messi, the team has performed exceptionally. The results also justify that the Barcelona team depends a lot on the performance of Leo Messi.
All-time Barcelona statistics since 2005 when Leonel Messi made his debut in the team are also very interesting. The results show the greatness of the Messi and his appearance in the team has huge impact on the team’s performance.
The results shown in the Tab. 7 demonstrate that Messi’s goal-scoring capability has gradually increased after his debut. In the first three seasons he was not much tested and did not play too many matches, only 71 matches he has played in first three years and his highest goal scoring in one season is 73 while his maximum appearances in one season was 60, and maximum matches played by Barcelona are 64 matches in one calendar year.
Table 7: Football club barcelona statistics from 2005 to April 2020
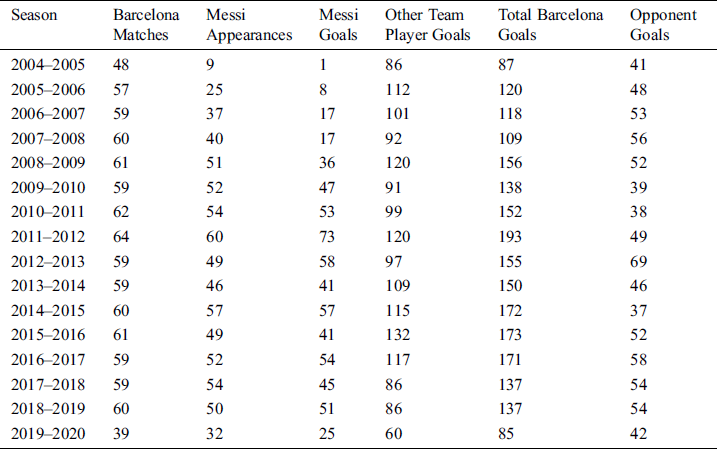
If we look at the statistics of Barcelona team’s lowest goal-scoring in one season 87 and maximum goal-scored by Barcelona is 193 and, in the Barcelona’s, worst season of 87 goals, Messi has played only 9 matches and scored only one goal. Similarly, in the Barcelona’s best year of 193 goals, Messi’s appearances are maximum so we can easily state that the impact of Leonel Messi on the Barcelona is very positive.
The comparison of our results is performed with the previous models designed by Prediction of smart players (PSP) in the game of Cricket [17]. The author has used the Support vector machine (SVM) Algorithm for the batsman, team, and the opposite team. He analyzed his results with the CART algorithm, BN algorithm, and NB algorithm. We have compared our results with all his previous results.
He has compared F-measure with different algorithms. The SVM, CART, BN, and NB algorithms were used previously by researchers for modeling the impact of the performance of a player on the team’s success, and we have also used Machine Learning to develop a model that predicts the performance of the players and predicts its impact on the overall team progress. Tab. 8 compares the results of our model and previous models.
Table 8: Comparison of F-measure of the proposed model with the previous model [17]
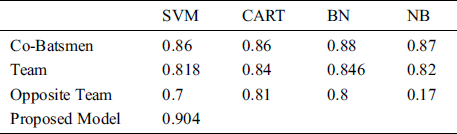
As we can see from Tab. 8 the results are created using three different data sets, Co-Batsmen, Team, and Opposite team, and four different algorithms SVM, CART, BN, and NB.
Fig. 3 shows that the results of our proposed model are significantly better (9.04) as compared to previous published approached like SVM, CART, NB & BN (0.86, 0.86, 0.87, 0.88) respectively and the results were created on the Co-Batsmen data.
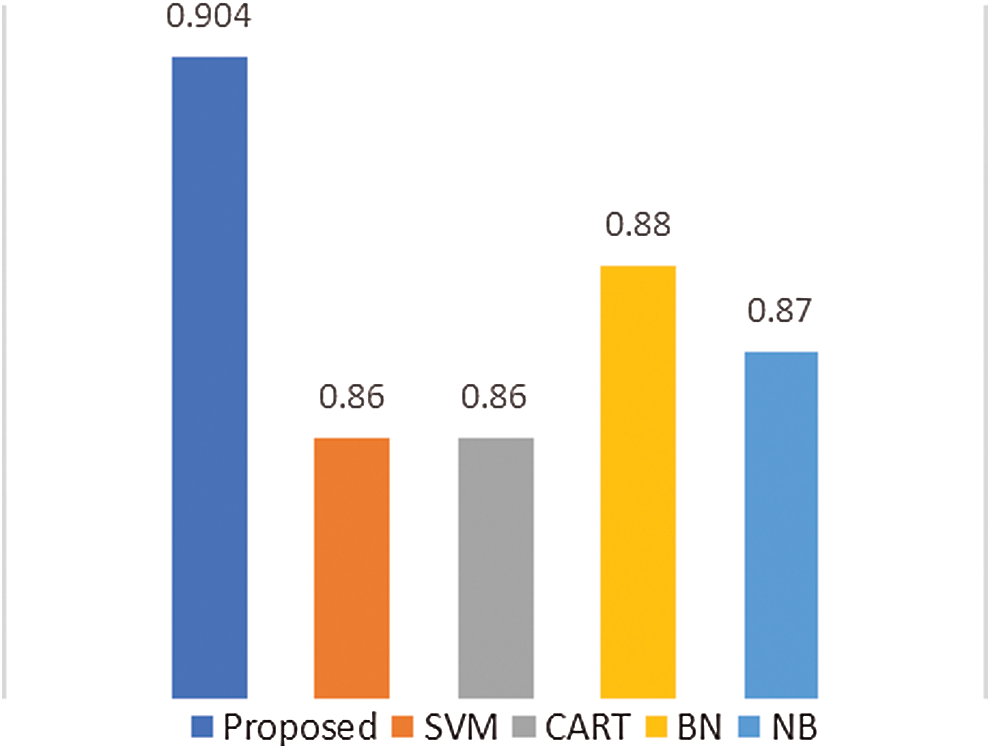
Figure 3: Proposed model comparison with co-batsmen results [17]
Fig. 4 shows the comparison of different models with team results. It is also observed that the result of our proposed model is 0.904 which is significantly improved better than any of the previous published models [17] like SVM, CART, BN, NB gives 0.818, 0.82, 0.84, 0.86 respectively and the results were created on the Team’s data.
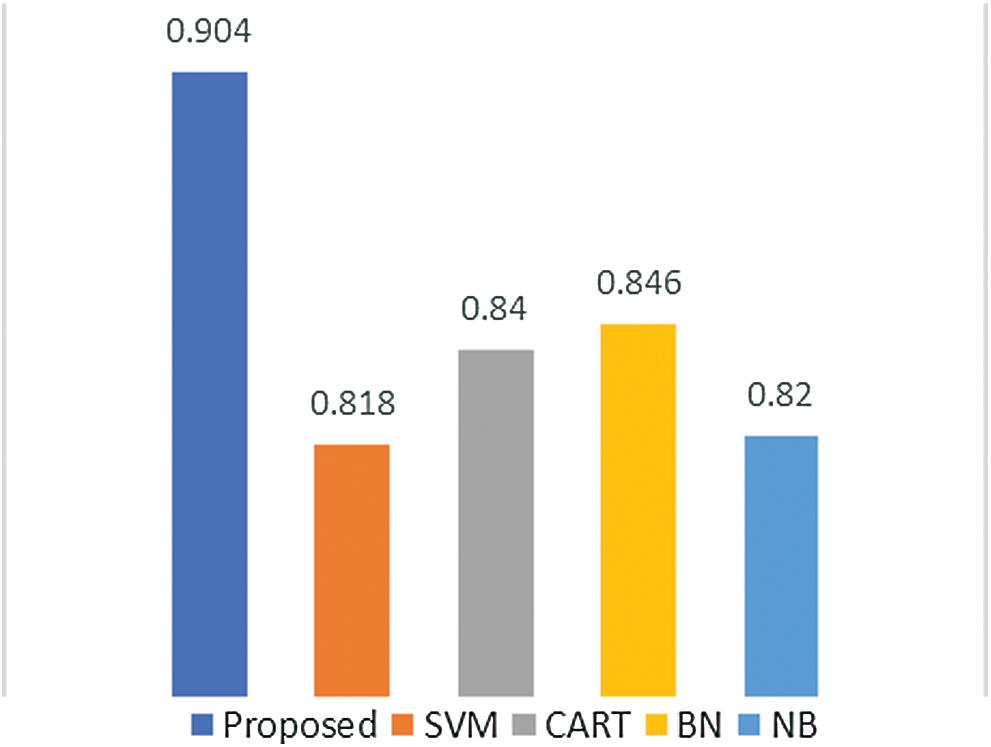
Figure 4: Proposed model comparison with team results [17]
Fig. 5 shows the comparison of proposed model with previous published approaches [17] with respect to opposite team results. It is observed that the proposed model achieves 0.904 accuracy that is significantly better than the performance of previous published models such as e NB, SVM, BN & CART that yield 0.17, 0.7, 0.8, 0.81 accuracies respectively.
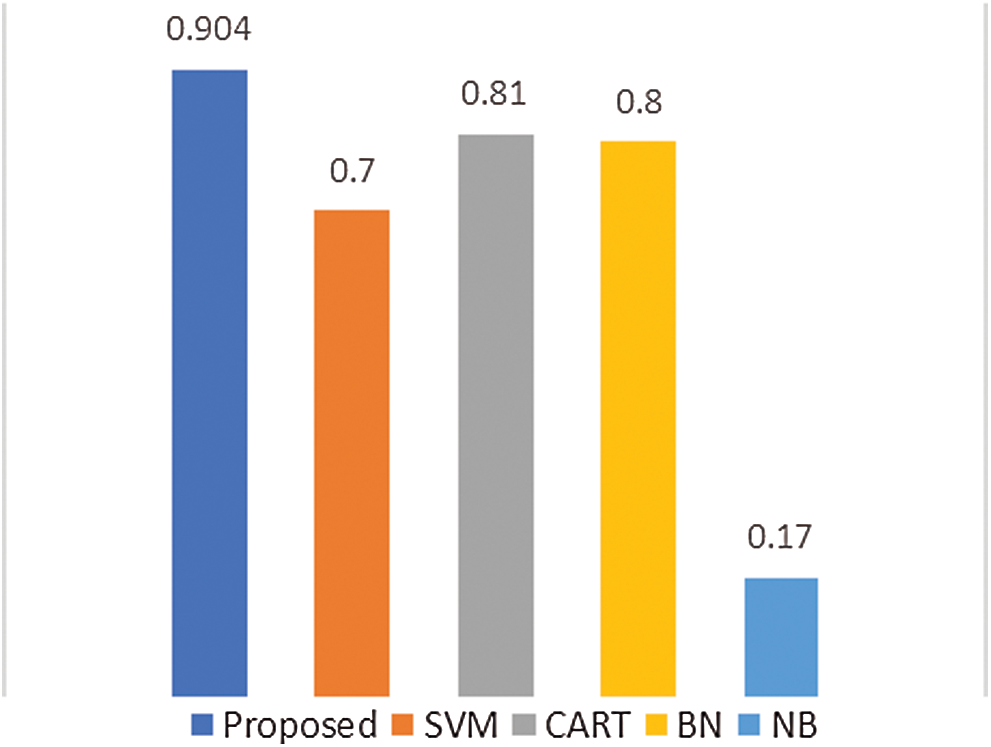
Figure 5: Proposed model comparison with opposite team results [17]
The objective of our study is to design a model that predicts a player’s performance and determines its impact on a team’s success. The idea here is that the team should distinguish among good, average and bad players. The team will be able to skip bad players and train average players to enhance their skills. Using the model, the team will mark its strong areas and identify its week areas. The team management and coaches will work to improve the overall performance. The team can also prepare plans and set different strategies for different teams. The team may also evaluate the opponent team’s strong and weak areas. If the opponent’s weak areas are identified, there is a possibility that the team will also fall apart in its good areas as well, and this could also improve the overall performance of the team. While attacking the opponent’s team weak areas, the possibility of winning will impressively increase and the team will earn fame, money, and sponsorships.
The fame and fan following also attracts the finance, investments, and sponsors. The team owners have a great opportunity to groom their business and with this amount the team owners can also buy great players from other teams as well and they can invest the money on the team’s training programs. These training programs will keep a player’s fitness level at its peak and good players will be polished more while average players will be improved to become good payers that will increase chances of a team’s success. With more investment, team owners can also increase the remuneration/contract fee of team players, coaches and management so these persons will work with more passion and their morale will be boosted.
The Statistics of Messi’s all-time representation at Barcelona has shown that he has played 717 matches till now and Barcelona has played 927 matches after his debut, so Leo Messi has played 77% matches of total Barcelona matches. Out of those 717 matches, he was the man of the match for 196 matches and in 202 matches his performance was outstanding that shows that 28% matches was won by Barcelona due to the appearance and outstanding performance of Leo Messi as shown in Fig. 6.
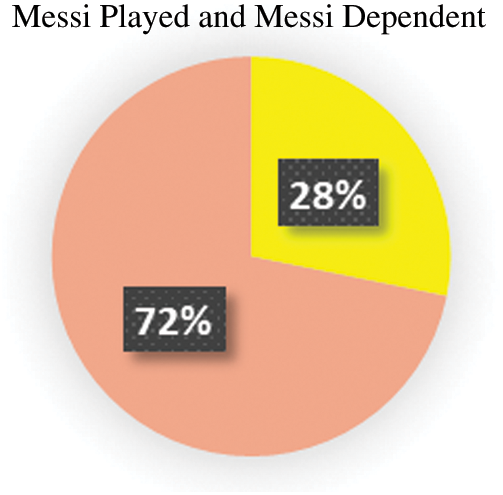
Figure 6: Messi stats on Barcelona winnings
Leonel Messi’s statistics are also improved substantially over time and it is observed that with more of his appearances in Barcelona’s side over time, per season goal-scoring ability of Messi has increased as well and the total number of Barcelona’s wins have also increased. It is inferred that Barcelona’s progress and Messi’s goal scoring ability is directly proportional. On the other side in the first three seasons where Messi did not make many appearances due to less experience or coaches’ less trust in Messi’s abilities, the overall goal scoring of Barcelona in the season is very low. In one season Barcelona’s scored goal was only 87 and, in that season, Messi scored only one goal in 7 appearances.
There is no doubt about Messi’s performance and its impact on the team’s success is huge. As a leader, he has also a very positive impact. Barcelona has won the Laliga cup in his first captaincy and he is still leading the side from the front.
The model can be tested in other sports as well like, basketball, handball, athletics, hockey, cricket, swimming, weightlifting, etc. In the data set, only goals of Messi are counted, as we know that Messi is a great player and he has almost equal numbers of assists as compared to his goals. So, we can rebuild the model and do modelling on the assists and goals. Assists give us the midfield quality so the ability of Messi to be a good midfielder will also be evaluated. The data of Cristiano Ronaldo can also be used in the same pattern and the comparison of both players will also be very trending for the fans of Messi, Ronaldo, and Football in general. The comparison of these living legends is generally performed in the field but their comparison using AI and ML will open many doors of research and results can also be applied on other sports as well where many great players exist with a vast fan following.
Acknowledgement: Thanks to our families & colleagues who supported us morally.
Funding Statement: This work is supported by Data and Artificial Intelligence Scientific Chair at Umm AlQura University.
Conflicts of Interest: The authors declare that they have no conflicts of interest to report regarding the present study.
References
1. M. Islam, G. Chen and S. Jin. (2019). “An overview of neural network,” American Journal of Neural Networks and Applications, vol. 5, no. 1, pp. 7–11.
2. R. C. Deo. (2015). “Machine learning in medicine,” Circulation, vol. 132, no. 20, pp. 1920–1930.
3. M. I. Jordan and T. M. Mitchell. (2015). “Machine learning: Trends, perspectives and prospects,” Science, vol. 349, no. 6245, pp. 255–260.
4. A. K. Jain. (2010). “Data clustering: 50 years beyond k-means,” Pattern Recognition Letters, vol. 31, no. 8, pp. 651–666.
5. R. P. Bunker and F. Thabtah. (2019). “A machine learning framework for sports results prediction,” Applied Computing and Informatics, vol. 15, no. 1, pp. 27–33.
6. A. Adadi and M. Berrada. (2018). “Peeking inside the black-box: A survey on explainable artificial intelligence,” IEEE Access, vol. 6, pp. 52138–52160.
7. P. Domingos. (2012). “A few useful things to know about machine learning,” Communications of the ACM, vol. 55, no. 10, pp. 78–87.
8. S. N. Tran and A. S. D. A. Garcez. (2016). “Deep logic networks: Inserting and extracting knowledge from deep belief networks,” IEEE Transactions on Neural Networks and Learning Systems, vol. 29, no. 2, pp. 246–258.
9. I. Namatēvs, L. Aleksejeva and I. Poļaka. (2016). “Neural network modelling for sports performance classification as a complex cocio-technical system,” Information Technology and Management Science, vol. 19, no. 1, pp. 45–52.
10. M. Pfeiffer and A. Hohmann. (2012). “Applications of neural networks in training science,” Human Movement Science, vol. 31, no. 2, pp. 344–359.
11. D. Memmert. (2011). “Sports and creativity,” Encyclopedia of Creativity, vol. 2, pp. 373–378.
12. H. Novatchkov and A. Baca. (2013). “Artificial intelligence in sports on the example of weight training,” Journal of Sports Science & Medicine, vol. 12, no. 1, pp. 27.
13. J. G. Claudino, Dde O. Capanema, T. V. de Souza, J. C. Serrão, A. C. Machado Pereira et al.. (2019). , “Current approaches to the use of artificial intelligence for injury risk assessment and performance prediction in team sports: A systematic review,” Sports Medicine-Open, vol. 5, no. 1, pp. 28.
14. L. Ward, A. Agrawal, A. Choudhary and C. Wolverton. (2016). “A general-purpose machine learning framework for predicting the properties of inorganic materials,” Computational Materials, vol. 2, no. 1, pp. 1–7.
15. L. Edwards and M. Veale. (2017). “Slave to the algorithm: Why a right to an explanation is probably not the remedy you are looking for,” Duke Law and Technical Review, vol. 16, pp. 18.
16. Historical results of football club Barcelona, 2020. [Online]. Available: https://www.worldfootball.net/teams/fc-barcelona/21/.
17. H. Ahmad, A. Daud, L. Wang, H. Hong, H. Dawood et al.. (2017). , “Prediction of rising stars in the game of cricket,” IEEE Access, vol. 5, pp. 4104–4124.
 | This work is licensed under a Creative Commons Attribution 4.0 International License, which permits unrestricted use, distribution, and reproduction in any medium, provided the original work is properly cited. |