DOI:10.32604/cmc.2020.012008
| Computers, Materials & Continua DOI:10.32604/cmc.2020.012008 | |
| Article |
A Convolutional Neural Network Classifier VGG-19 Architecture for Lesion Detection and Grading in Diabetic Retinopathy Based on Deep Learning
1Department of Electronics and Communication Engineering, Pavai College of Technology, Namakkal, 637018, India
2Department of Electronics and Communication Engineering, Muthayammal Engineering College, Rasipuram, 637408, India
*Corresponding Author: V. Sudha. Email: vsudhaece@gmail.com
Received: 10 June 2020; Accepted: 16 July 2020
Abstract: Diabetic Retinopathy (DR) is a type of disease in eyes as a result of a diabetic condition that ends up damaging the retina, leading to blindness or loss of vision. Morphological and physiological retinal variations involving slowdown of blood flow in the retina, elevation of leukocyte cohesion, basement membrane dystrophy, and decline of pericyte cells, develop. As DR in its initial stage has no symptoms, early detection and automated diagnosis can prevent further visual damage. In this research, using a Deep Neural Network (DNN), segmentation methods are proposed to detect the retinal defects such as exudates, hemorrhages, microaneurysms from digital fundus images and then the conditions are classified accurately to identify the grades as mild, moderate, severe, no PDR, PDR in DR. Initially, saliency detection is applied on color images to detect maximum salient foreground objects from the background. Next, structure tensor is applied powerfully to enhance the local patterns of edge elements and intensity changes that occur on edges of the object. Finally, active contours approximation is performed using gradient descent to segment the lesions from the images. Afterwards, the output images from the proposed segmentation process are subjected to evaluate the ratio between the total contour area and the total true contour arc length to label the classes as mild, moderate, severe, No PDR and PDR. Based on the computed ratio obtained from segmented images, the severity levels were identified. Meanwhile, statistical parameters like the mean and the standard deviation of pixel intensities, mean of hue, saturation and deviation clustering, are estimated through K-means, which are computed as features from the output images of the proposed segmentation process. Using these derived feature sets as input to the classifier, the classification of DR was performed. Finally, a VGG-19 deep neural network was trained and tested using the derived feature sets from the KAGGLE fundus image dataset containing 35,126 images in total. The VGG-19 is trained with features extracted from 20,000 images and tested with features extracted from 5,000 images to achieve a sensitivity of 82% and an accuracy of 96%. The proposed system was able to label and classify DR grades automatically.
Keywords: Diabetic retinopathy; saliency map; structure tensor; gradient descent method; exudates; haemorrhages; microaneurysms; VGG-19
Diabetic Retinopathy (DR) is a disease that occur in eyes that can ultimately damage the retina resulting in loss of vision. IDF (International Diabetes Federation) statistics had indicated that, the diabetic population worldwide was recorded as 500 million in 2018 which shall increase by 9.9% approximately in the next 5 years. India has a diabetic population of 38 million in 2018 which is expected to be 79 million by the year 2030. Type 2 diabetes largely affected the city community residents of India, but current researches evidently indicated its growth predominance in villages. Though several diabetic diagnosed patients may not have symptoms, there occurred morphological and physiological retinal variations. The initial clinical symptom was a mild diabetic retinopathy characterized by microaneurysms formation. When not properly diagnosed, it may lead to moderate diabetic retinopathy where variations in dimensions across veins and retinal blood vessels occur. The rigor and degree of such lacerations are indicated as severe diabetic retinopathy of non-proliferative type where the blood flow in retina gets rapidly increased. The restricted blood flow regions across the retina will provoke fresh growth in the microvascular region, which results in Proliferative Diabetic Retinopathy (PDR). Macular Edema (ME), appeared as retinal enlargement due to fluid leakage inside the macula. The setback is that, image interpretation was difficult due to the presence of image artifacts leading to poor image quality. Also, fundus photography cannot compute membrane thickness and detect the presence of edema. Left out anomalies related to diabetic retinopathy include neovascularization, venous beading, and intra-retinal microvascular growth. Moreover, detection of hard exudates near the optic disk was difficult that had the same intensity values. Extraction of optic disk from fundus image was quite challenging one. To enhance automatic diagnosis and classification of DR, the research approaches are
•To propose an novel image preprocessing technique for detecting Region of Interest (ROI) of the anomalies.
•To find the ratio of total contour length to true arc length of irregular blobs (white regions) as ROI in images, for automatic prediction of DR conditions.
•Finally, classify the DR severity using extracted feature sets from segmented images using VGG-19.
Gargeya [1], developed a data-driven deep learning algorithm for automatic DR detection. The fundus images were tested using MESSIDOR 2, E-Ophtha databases and proposed model attained AUC (area under the receiver operating characteristic curve) value of 0.94 and 0.95 respectively. Mateen et al. [2], have surveyed in detail with various computer aided diagnosis methods to identify the exudates. Also, significance has been given to various datasets used to identify diabetic retinopathy and was found that deep learning techniques yielded better results for exudates detection. Various performance metrics were described to measure the accuracy of segmentation techniques used to detect the types of lesions. Pratt et al. [3], detected various degrees of DR levels for classification based on intensity variations. The CNN (Convolutional Neural Network) architecture trained using GPU processor unit with Kaggle dataset, yielded sensitivity, accuracy results of 95% and 75% respectively when validated on nearly 5,000 images. Somasundaram et al. [4], used a deep learning technique to classify the DR conditions at its initial phase using an ensemble approach. In its first stage, salient features were extracted from fundus image of retina. The second phase involved use of machine learning ensemble classifier that used derived features of the fundus images to reduce the error. Aiki et al. [5], proposed a Graph Neural Network (GNN) based DR severity classification to improve accuracy. Their approach was based on two features. Initially, Region of Interest (ROI) sub-images were obtained, to reduce unnecessary information required for classification. Next, GNN was applied for fundus image classification. Mansour [6], proposed a DR model that used a multi-level optimization that integrates regional segmentation using gaussian mixture model based on adaptive learning, ROI localization using connected component analysis, high dimensional feature extraction using AlexNet DNN (Deep Neural Network). Feature selection was performed using principle component analysis (PCA) and linear discriminant analysis (LDA) followed by a five class DR classification using support vector machine. Khojasteh et al. [7], used Resnet imagenet along with support vector machine technique to locate the exudates automatically. Focus on Resnet yield better results in terms of sensitivity which required small dataset to measure its performance. Orlando et al. [8], has focused on identification of red lesions using the concept of deep learning along with identification of true lesions using random forest classifier. Most of the literature on haemorrhages detection has showed classification using certain handcrafted features and true, positive detections. Chowdhury et al. [9], has performed detection of retinal abnormalities using clustering based on K-means followed by classification based on random forest algorithm. Significant results were yielded and also comparison was made with naive bayes classifier to prove the accuracy of classifiers used in research. Grzeszczuk [10], proposed a new method to classify datasets with sparse high localized features by applying saliency map for enhancement of features. This method did not apply any pre-information feature localization. Quellec et al. [11], used softmax layer to classify DR grades. This has used ConvNet trained using back propagation technique for accurate classification of lesions. Better results were yielded using ConvNet architecture. Liu et al. [12], presented a location-to-segmentation method for automated exudate segmentation from color retinal fundus images, which consists of three operations of removing anatomical structure, locating and segmenting the exudates. In addition to this, blood vessel segmentation and a optic disk segmentation based on saliency methods were proposed. They applied a random forest classifier to separate the patches as exudate and exudate-free patches. The histograms of local binary patterns were obtained to characterize the texture of the patches. To segment the exudate regions out from patches, local variance, sizes of exudate and the local contrast were applied. Santhosh Krishna et al. [13], has proposed a new supervised model based feature extraction technique that performed better than unsupervised models for extracting retinal blood vessels using adapted adaboost filter. To address the above issues unique, preprocessing methods were used with deep neural network architecture, which is a sub-category of artificial intelligence. The proposed technique firmly evolved to classify the DR conditions from fundus images and precisely identified severity levels based on major appearances of pathology in fundus.
For classification of DR conditions, the model used sequence of operations as its fundamental blocks
a)Image augmentation
b)Image preprocessing
c)Deep convolutional neural network classification
Data augmentation is a key to collect the image data for experiments. As a part of analysis, a familiar KAGGLE competition dataset is utilized for the experiments, whose sample fundus image is shown in Fig. 1. The regular dataset of KAGGLE from EyePACS contains total of 88,700 photographs of retina. In this, 35,126 images were tagged as right and left eyes for training. Tab. 1, describes the number of the fundus images of every class present in the KAGGLE DR Dataset. For training and testing, the distribution of images from KAGGLE DR Dataset are used as given in Tab. 2.
Table 1: Distribution of images in KAGGLE DR dataset
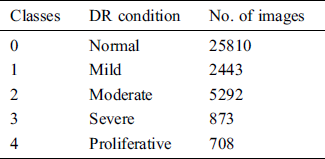
Table 2: Number of images used for training and testing from KAGGLE DR dataset
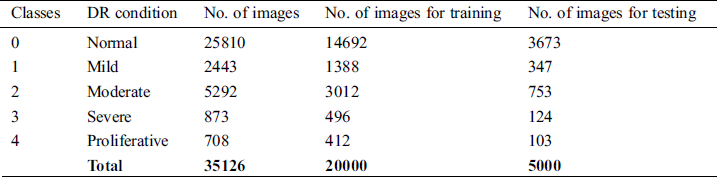
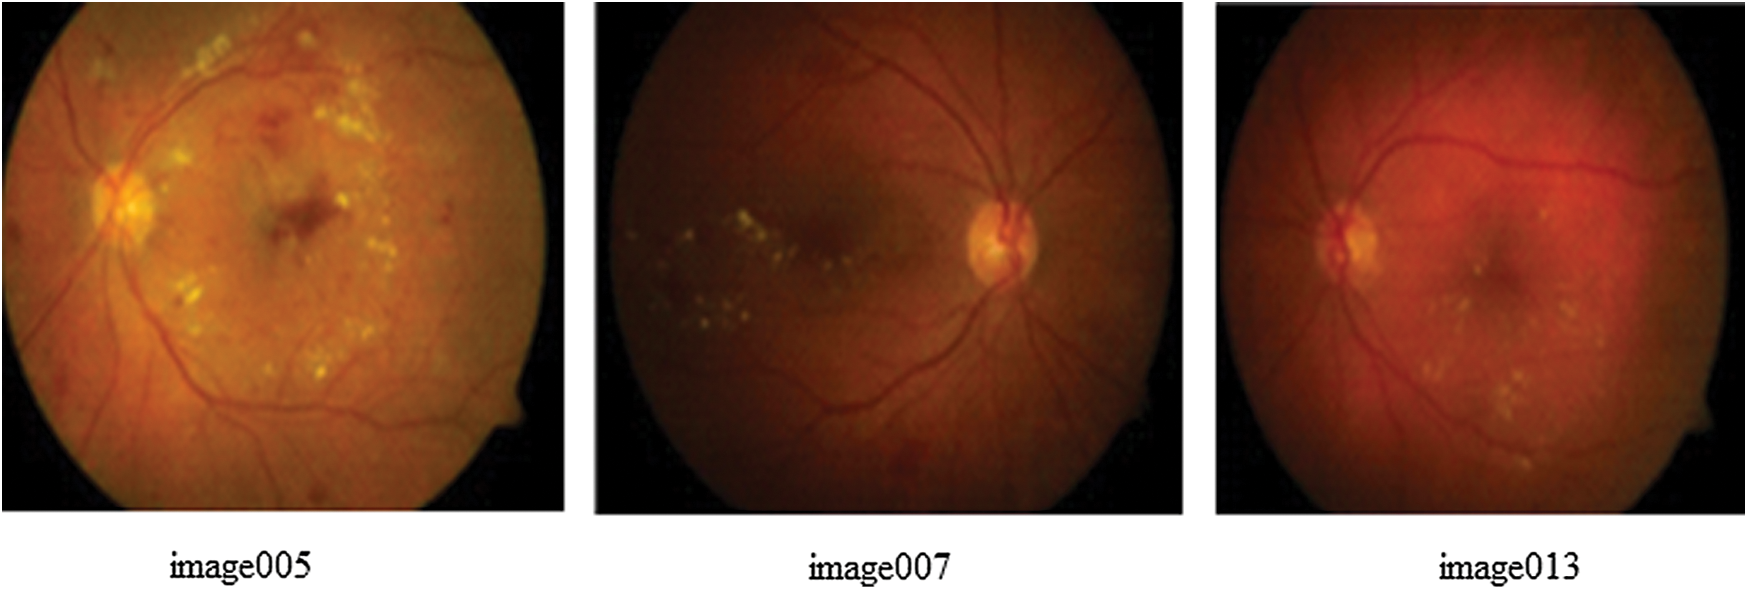
Figure 1: Sample input fundus images
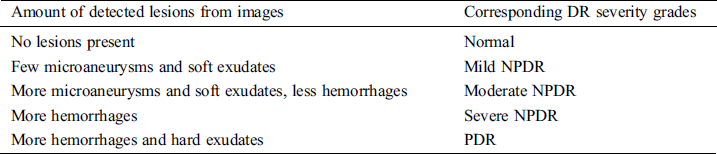
The KAGGLE dataset consists of substantial quantity of indefinable images because of the presence of artifacts and incorrect labeling. Therefore, image segmentation methods are used to detect the type and lesions present in order to annotate the labels, for detecting the DR severity levels in fundus images. Tab. 3, describes the scheme based on type and severity levels from the detected lesions.
Table 3: Commonly adopted annotation scheme to represent DR severity level from detected lesions
Now, the main aim of image segmentation is to detect hard and soft exudates, hemorrhages and microaneurysms as white regions for the convenience of annotating the class. Fig. 2, depicts proposed image segmentation process to detect DR regions obtained as output from original fundus image. For segmentation, the RGB split and contrast limited adaptive histogram adjustment [14], are initially applied to enhance the contrast. Then, background subtraction was performed to extract region of interest that was segmented using mask image.
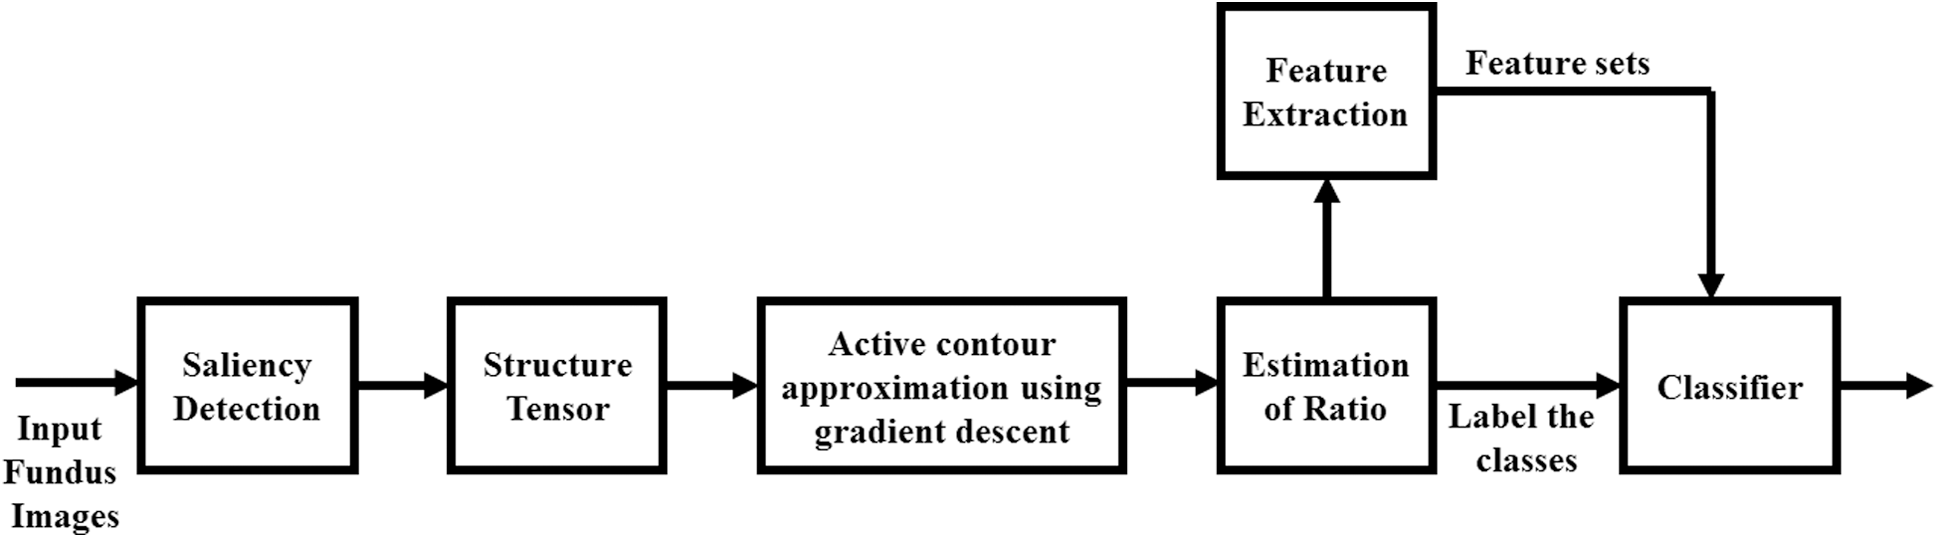
Figure 2: Proposed idea of image segmentation to extract feature sets, estimate ratio for labeling DR grades and finally classification
During the process of image segmentation, saliency detection usually extracts visually salient regions from an image and generates the saliency map that is used as a beneficial tool for identification of visual details of low-level luminance from color images. This method was commonly preferred for automatic evaluation of objects and image regions without any prior knowledge. Thus, described as variations between pixels and its neighboring locality [15,16].
The image is comprised of color and brightness features. In order, to extract efficient color and brightness details, the saliency map is applied to the region of interest (ROI). Saliency map will be depicted as an image which displays distinct quality of every pixel. The purpose of saliency map [17], was to facilitate and modify the image description that is significant and simpler for study. If a pixel contains unique gray or color quality, such characteristics will be represented in saliency map. Concisely, the saliency mapping is a type of image segmenting process. For any image I, M × N × 3 are RGB color dimension, in which M and N are the number of rows and columns correspondingly. The features of colors, red, green and blue are described as follows


Consider mr, mg and mb are the values of mean for red, green and blue color features, correspondingly. The pixel saliencies are evaluated, by squaring the difference between its feature and mean value. The saliency maps for r, g and b colors are denoted by Sr, Sg and Sb correspondingly and their sizes by M × N.


The final saliency color map for an image is obtained by summing Sr, Sg and Sb. Fig. 3 shows the output after applying saliency map for input sample images.
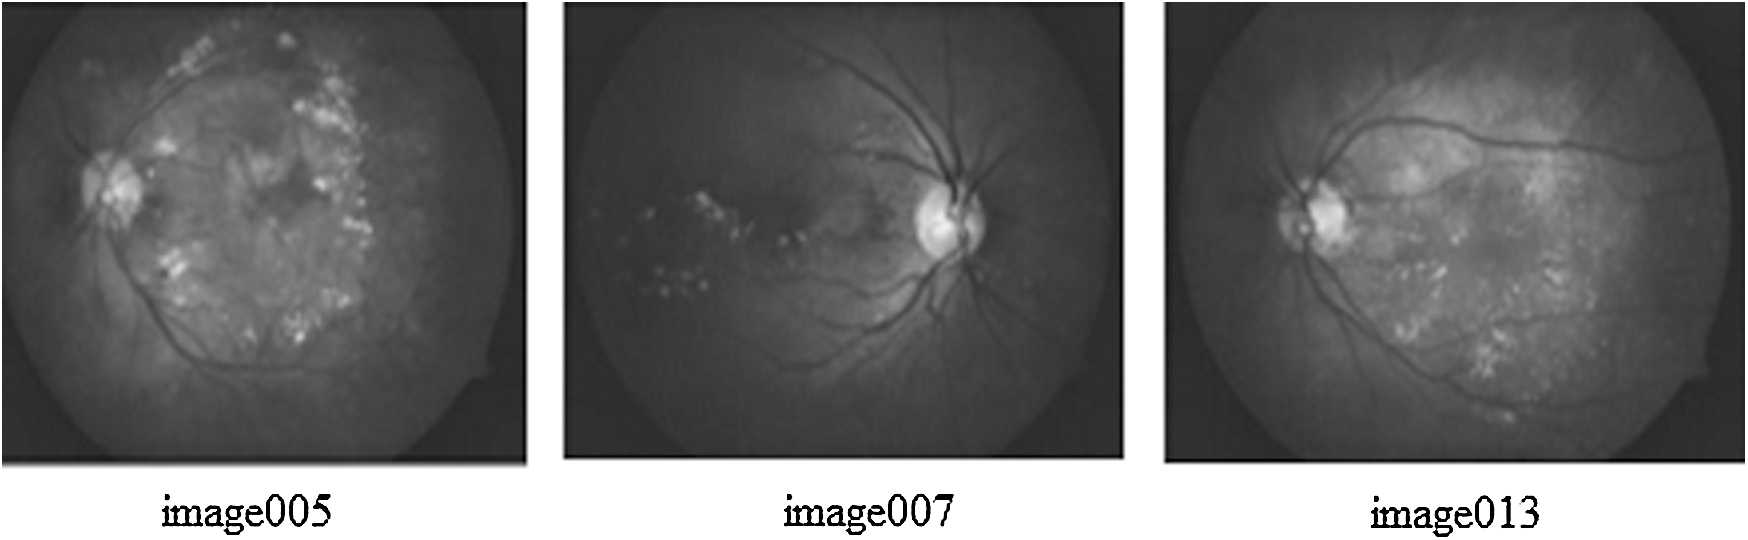
Figure 3: Output after applying saliency map
Next, gradient based structure tensors are used to improve the intensity changes on object edges and derive those edge elements by performing series of opening and closing, thresholding and erosion operations. The structure tensor was used to depict the edge or gradient details. It can powerfully describe the local patterns rather than directional derivatives along with its coherence estimation. Structure tensor can connect the shape and structure of objects in an image and determine the features of ROI for classification. This method the edge based active contours of smaller sizes were detected. In the regions near edges, the tensors will have higher values of magnitude and coherence, i.e., only one eigenvalue was larger compared with the rest, whereas corner areas has higher values of magnitude with less coherence.
Structure tensors have the ability to incorporate and retrieve magnitude information along two directions without canceling the gradients. Anatomical features like tissue boundaries or blood vessels appear as a collection of speckles that are correlated along a specific direction. These methods describe the local vicinity of a pixel better than traditional derivative approaches. Structure tensor [18] are depicted by M × M symmetric matrices which comprises of structural details about pixel intensity and orientation. Initially, the matrix was evaluated from the gradients of grayscale image I using the gradient tensors

In which,  are spatial derivatives along the direction of x and y of image, I. But
 , the gradient tensor will have only one non-zero eigen value, and respective eigen vector
 will have same direction as the gradient
  . This depicts that, one dimension features of gradient tensor possesses the benefit that it can be flattened with no removal in the regions where the gradients possess contrary signed values, that is
  . In order to derive more structural details and prevent noises, the smoothing function was used in gradient tensor to generate the structure tensor.

Here, I is a grayscale image with scalar values  , a gaussian kernel with standard deviation σ. For M-dimensional image, the structure tensor was generated by adding up the direction of M dimension.

Moreover, orientation and structure magnitude details exist before the gradients, the structure tensor comprises of certain additional details. These details can be obtained using smoothing operation and estimates the orientation homogeneity within adjacent regions. Using structure tensor as a transformation about its principal axis , in which
  contains eigen vectors of
 , and respective eigenvalues are
 such that
 , forming A as
  . The
. The  describes the variation along
  directions correspondingly, and the eigen vector with minimum eigen value decides the principal orientation of structures.
  , represents the trace of the magnitude structure tensor where,
 coherence is decided by the metric
  . The structure tensor magnitude and coherence are utilized for structure computation. Homogeneity in image produces lesser magnitude and coherence values. In regions near edges, tensors possess high values of magnitude and coherence, only one eigenvalue is larger compared with the rest, whereas corner areas results in higher magnitude however with lesser coherence values, in this case two eigen values will be of large value. Thus, a new scaled vector
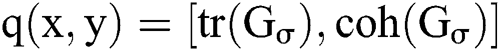 is used to exchange the gradient values. Fig. 4 shows the output of structure tensor of segmented morphology. After the detection of active contours, the contour approximation is performed using level set gradient descent method to locate optimal boundary around detected objects by minimizing the energy function. In active contour, two dimensional objects are extracted surrounded by minimum area of contour. To delineate the contour objects, iteration is performed in the algorithm. This algorithm is used to construct a flexible curve that varies dynamically according to the surrounding edges in the image.
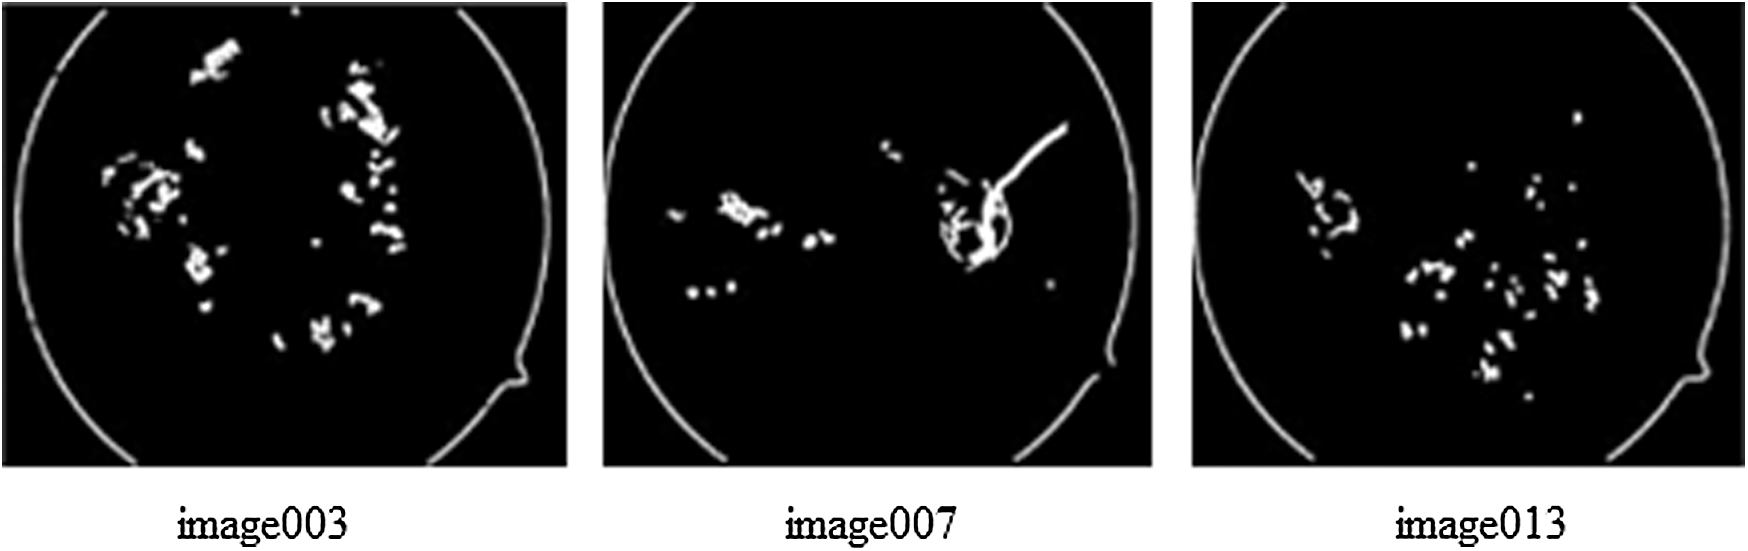
Figure 4: Applying structure tensor to segment the morphology over saliency output
3.3 Optimization of Active Contour Using Gradient Descent Method
An original level contours have to be defined by inserting curves enclosing objects that needs to be identified. The gradient operator [19], over discrete image x can be represented using first order finite differences.

For continuous vector field v, the divergence operator can be defined using first order finite differences.

And its discrete form is represented by,

Optimized image is got by minimizing the cost function

In which,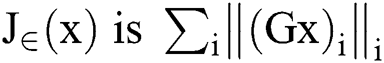 is the smoothed complete variation and
  is an image gradient approximate over pixel i. λ > 0, is a Lagrange multiplier parameter where the weights were used to control the term of data fit
  and
and  , is a regularization term. Smoothing by
  norm in
  was used to calculate u with
  by
by

 is a small regularization parameter and
  . The gradient of any function f was defined as

The smoothed total variation gradient norm was described by

Concisely, in the proposed image segmentation process, saliency map was applied to the input fundus image after limiting its boundary. Structure tensor evaluates second order moment that was applied to both CLAHE enhanced green channel and gray scale image to evaluate the morphology gradient. The output is then subjected to optimize the contour area and perimeter by applying level set segmentation using gradient descent method for optimization. Fig. 5, shows the output of active contour based on segmentation.

Figure 5: Output of active contour based on segmentation
4.1 Connected Components Analysis (CCA) Using K-means Clustering
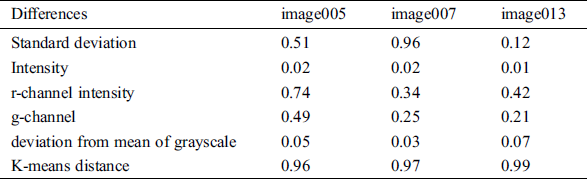
From the output images obtained from proposed segmentation process, the statistical parameters like mean and the standard deviation of pixel intensities, mean of hue and saturation, deviation clustering from mean are found through K-means which are computed as features. In order to identify the size, location and region of DR involving hard and soft exudates, hemorrhages and microaneurysms, K-means CCA is applied. K-means clustering is applied to determine the feature sets in classification of the images according to severity of DR disease. It is observed that, this technique is quite beneficial to detect and differentiate the blob or object sizes, shapes and affected regions from segmented retinal images. Tab. 4, shows the minimum difference of hemorrhage features in terms of gray scale pixel intensity standard deviation, color channel intensities and deviation mean and cluster distance.
Table 4: Minimum difference of hemorrhage features obtained from segmented image
5 Classifications of DR Grades using CNN Classifier
CNN [20] is widely used neural network architecture and has proved its significance in task of detection and classification. Several researches applied CNN to recognize objects, face signs, and had shown its performance was superior to humans. CNN used supervisory learning technique and hence it was trained using labeled data along with the classes. CNN basically learns the relation between objects and their labeled class. It contains two elements, where the hidden layers derived the features and Fully Connected Layers (FCN) performed the classification process. In traditional neural network, every layer is constructed using neurons and was linked to previous neuron layer. But in CNN, the hidden layer neurons are linked to just few neurons. The VGG is abbreviation for Visual Geometry Group Net was used in CNN that has approximately 143 million parameters, these parameters are learnt using ImageNet dataset comprising of 1. 2 million images which contains thousands of classes for training. It is very good architecture used for benchmarking. The VGG-19 Neural Network consists of 19 layers of deep neural network and has more weight. The size of “VGG-19” network in terms of fully connected nodes is 574 MB. As the number of layer increases, accuracy of DNN is improved. The VGG-19 model comprised of 19 deep trainable layers performing convolution, which is fully connected with max pooling and dropout layers. In this paper, convolutional layer is trained to perform customized classification role that involved densely connected classifier and to regularize a dropout layer was used. The VGG-19 architecture was presented in Fig. 6.
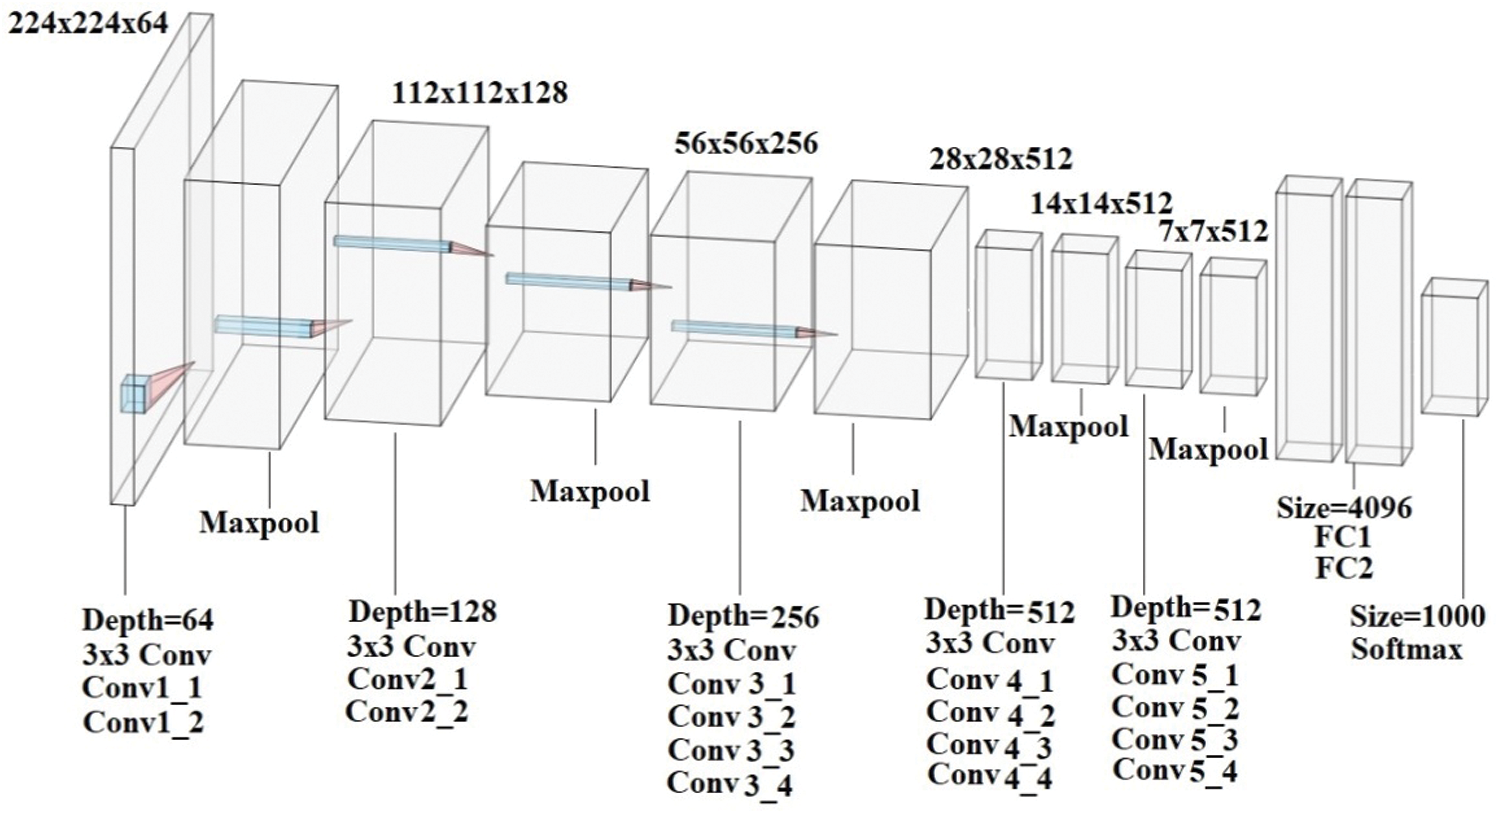
Figure 6: VGG-19 architecture
VGG-19 is so beneficial and it simply uses 3 × 3 convnet arranged as above to extend the depth. In order to decrease the size, max-pooling layers are applied as a handler. FCN layers are two in number to which have 4096 neurons applied. VGG is trained based on individual lesions and for testing all types of lesions were considered to reduce the number of false positives. Convolution layers perform convolution process over images at every pixel, allowing outcome to pass through the subsequent layer. Filters are used in convolution layer is of 3 × 3 dimension which are trained for feature extraction. Every stacked convolution layer is subsequently added with Rectified Linear Unit (ReLU) layer and max-pooling layer. ReLU is presently the best known non-linear activation function which allows only the positive portion of the input.

While, comparing the ReLU function with sigmoid function, ReLU is quite effective in computing to indicate the best convergence behavior that vanish the gradient issue. A down-sampling max-pooling layer is used after ReLU activation function. Generally, the filter of 2 × 2 dimension is considered of same step size. The output will be of maximal value in every sub-region. For dense layer, the activation function must be designed. The dropout layer was abandoned while random activation in the layer to make it zero value. The neurons are eliminated in random process during the training stage to reduce over-fitting issue. This dropout is applied during training.
This section discussed the experimental results obtained from classifier using proposed image preprocessing technique. For extraction and classification using features, 71% of images were used from KAGGLE dataset. In order to assess the performance of DR classifier through training and testing, the 80:20 ratio was applied on the dataset. KAGGLE, being the standard dataset it contains fundus images of five different DR classes namely, non-proliferative DR, mild DR, moderate DR, severe DR and proliferative DR with distribution as depicted in Tab. 2. The lesion features extracted from KAGGLE dataset images was annotated with the labels based on detection features described in Tab. 1. Firstly, for effective computation of features, fundus images are re-sized to 800 × 615 pixels. Secondly, for better performance during classification, the proposed image segmentation preprocessing techniques as stated in Fig. 2. are applied to prepare the images for effective feature detection of soft exudates, hemorrhages, microaneurysms [21] and hard exudates. Fig. 7 shows the intermediate image outputs obtained from this experiment. To make the realization effective with VGG-19, CPU is utilized to acquire the desired outcomes. For the optimal feature detection, saliency map, structure tensor and gradient descent methods are considered as proposed techniques.
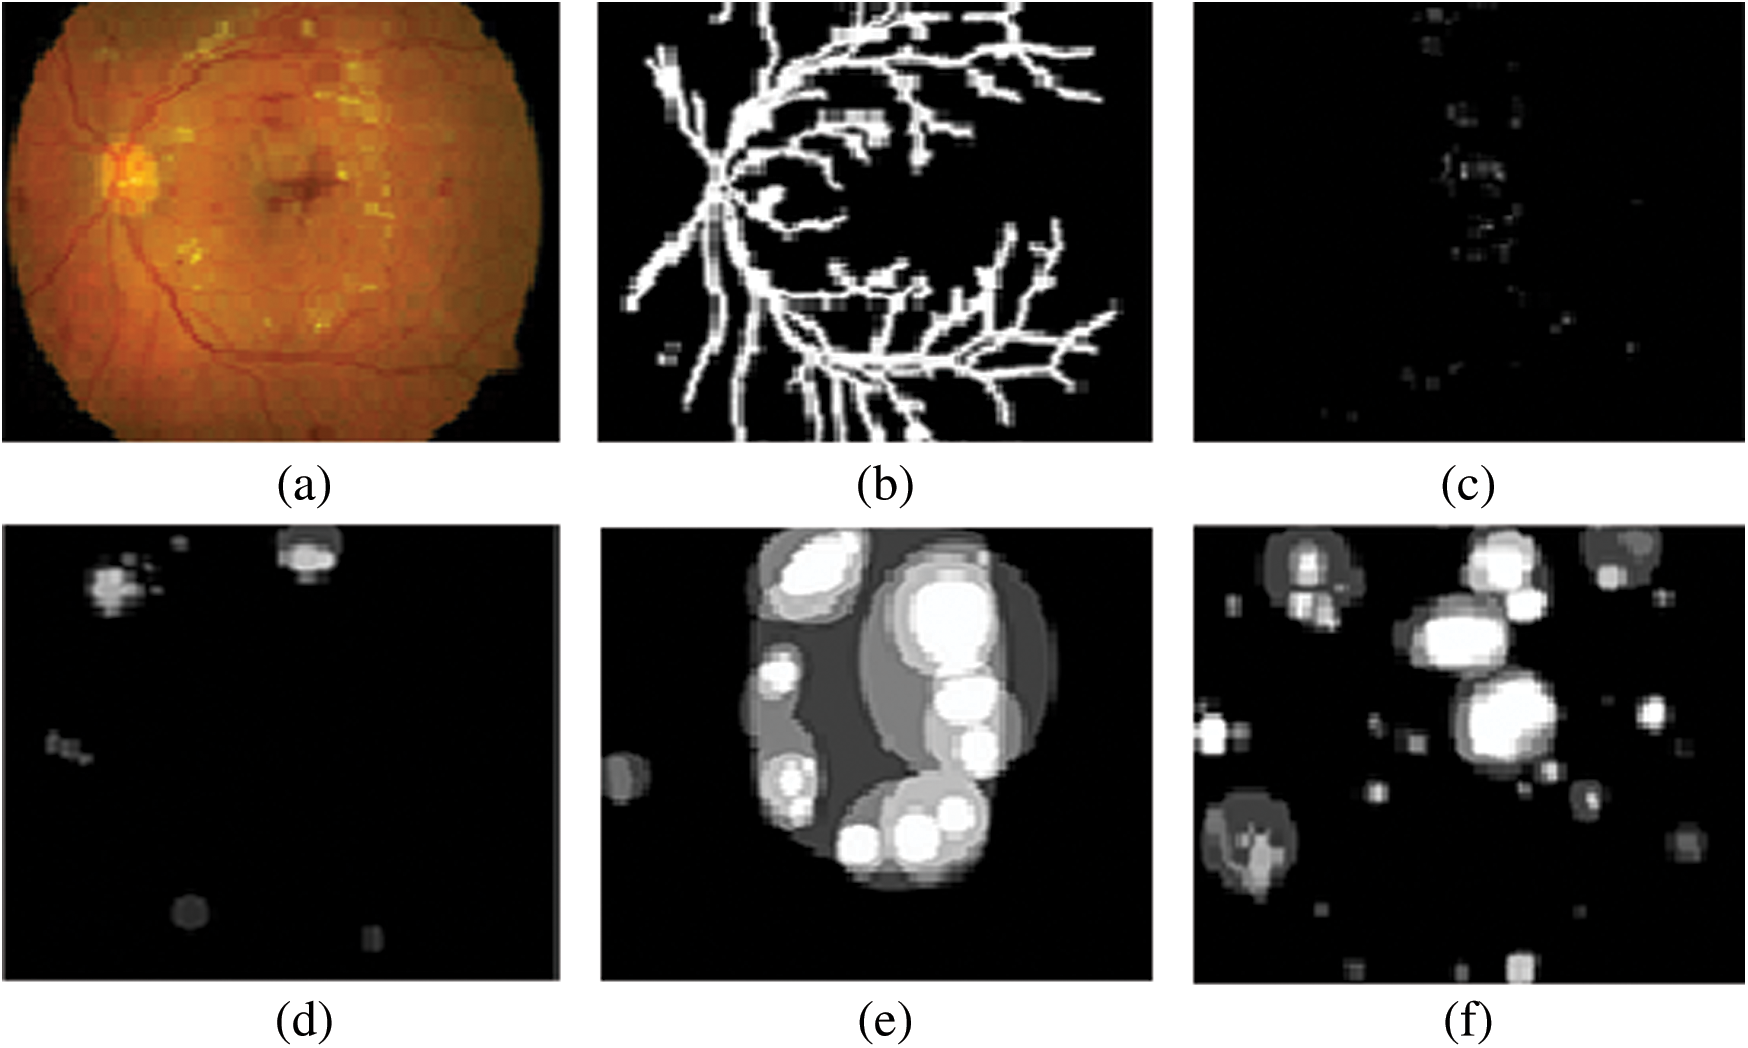
Figure 7: Fundus images comprising of various retinal defects related to DR (a) Input fundus image (b) Segmented blood vessel for removal (c) Microaneurysms (d) Soft Exudates (e) Hard exudates (f) Hemorrhages
As 71% of KAGGLE dataset images were used for training, their labeling method is crucial. The experts were asked to mark the areas related to the microaneurysms, hemorrhages, hard and soft exudates. The ground truth confidence levels mostly represented the decision certainty to mark if the findings were correct. The experts failed manually to investigate and assess the stage from symptomatic fundus images as reported in Krause et al. [22]. So, the novel proposed method for automatic labeling the images with the classes of DR severity will be the basis for detection of lesions over the image that was obtained from the proposed segmentation process. Automatic labeling is performed to detect lesions like microaneurysms, hemorrhages, hard and soft exudates, followed by their measurements in terms of contour area and arc length. The ratio value of contour area to contour arc length is a deciding parameter for DR severity. The ratio will be larger when identical lesions are present in the images and will be quite lesser when different types of lesions are widely present. Tab. 5, depicts the ratio estimation based on total contour area and total true arc length obtained from gradient descent images as depicted in Fig. 8. Based on the ratio of A/B they are differentiated as no PDR, mild, severe, moderate and PDR. Lower the value of A/B, higher is the severity of DR condition. Tab. 6, shows the labeling of the images with DR conditions based on the ratio. When the upper limit is greater than 10, the class is identified as no PDR. Likewise, when the upper limit is less than 2, the class is identified as PDR.
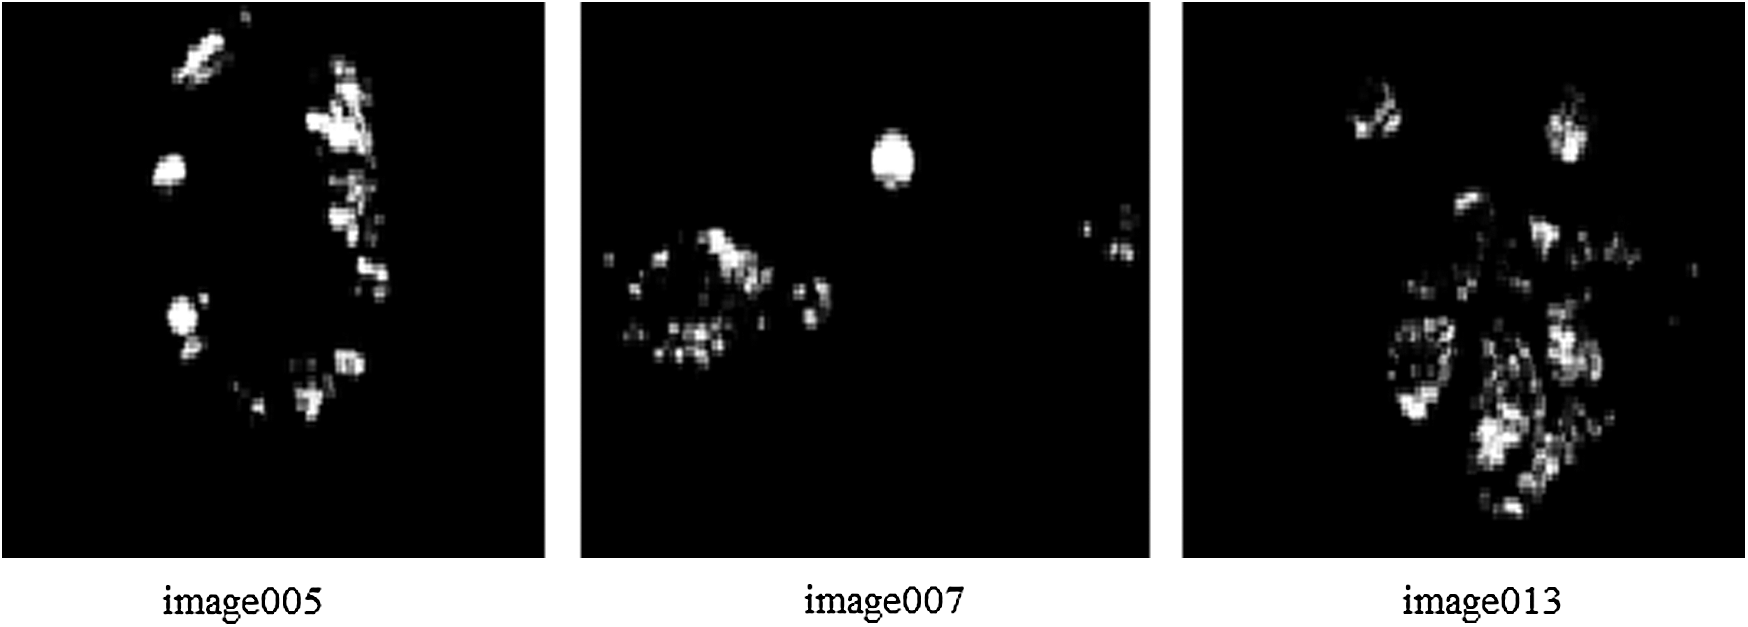
Figure 8: The images used for estimating the ratio for labeling the classes
Table 5: Estimation of ratio obtained from gradient descent images
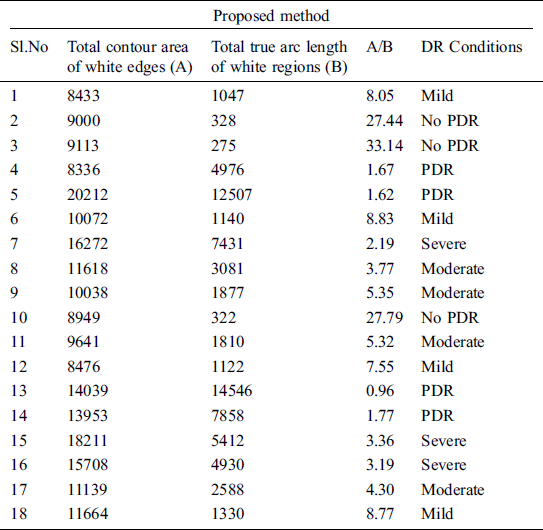
Table 6: Labeling the DR conditions based on A/B values

Tab. 7 shows confusion matrix statistics of the classifier of VGG-19 type and Fig. 9 depicts the confusion matrix of the classifier while performing classification for DR severity.
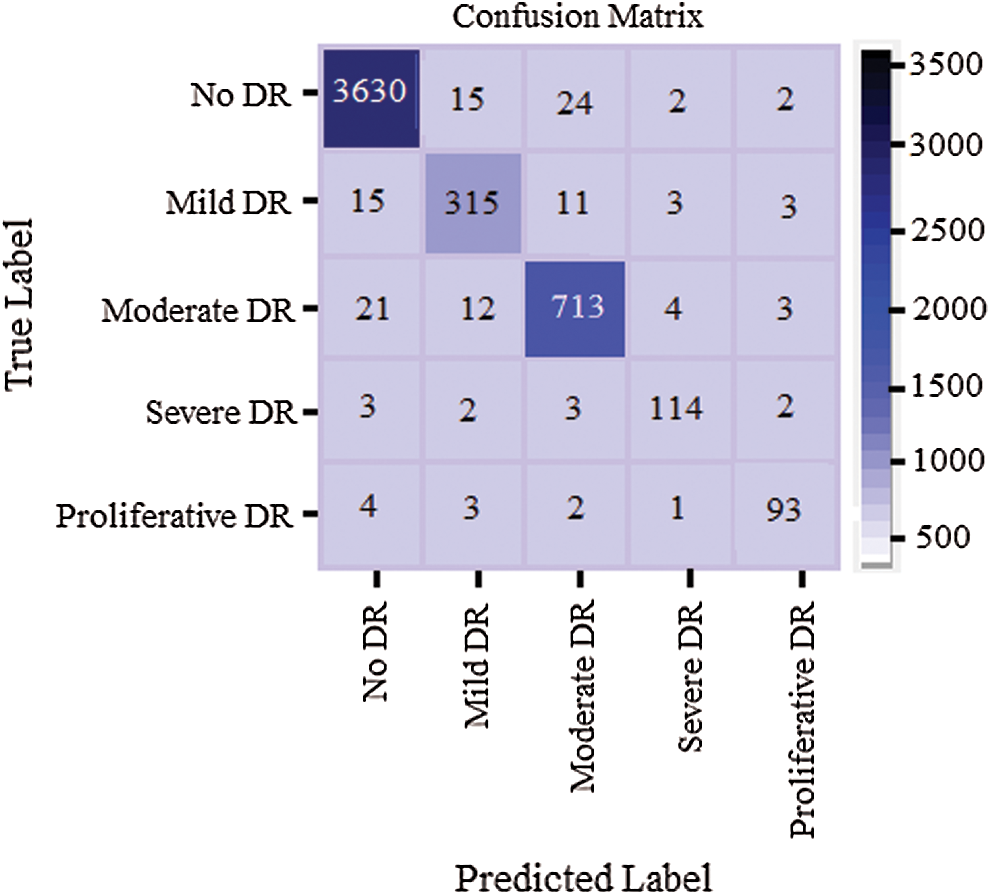
Figure 9: Confusion matrix of the classifier when classifying the DR severity
Table 7: Confusion matrix statistics of the classifier
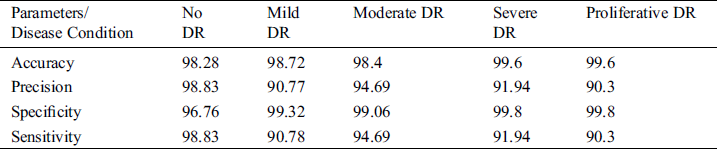
The experiment for testing is carried out using 5000 images from KAGGLE datasets. Various DR severity images are taken as per Tab. 2.
The performance parameters like specificity, accuracy of evaluation was based on inference from confusion matrix. Here, diagonal values of confusion matrix depicts true values for analysis.
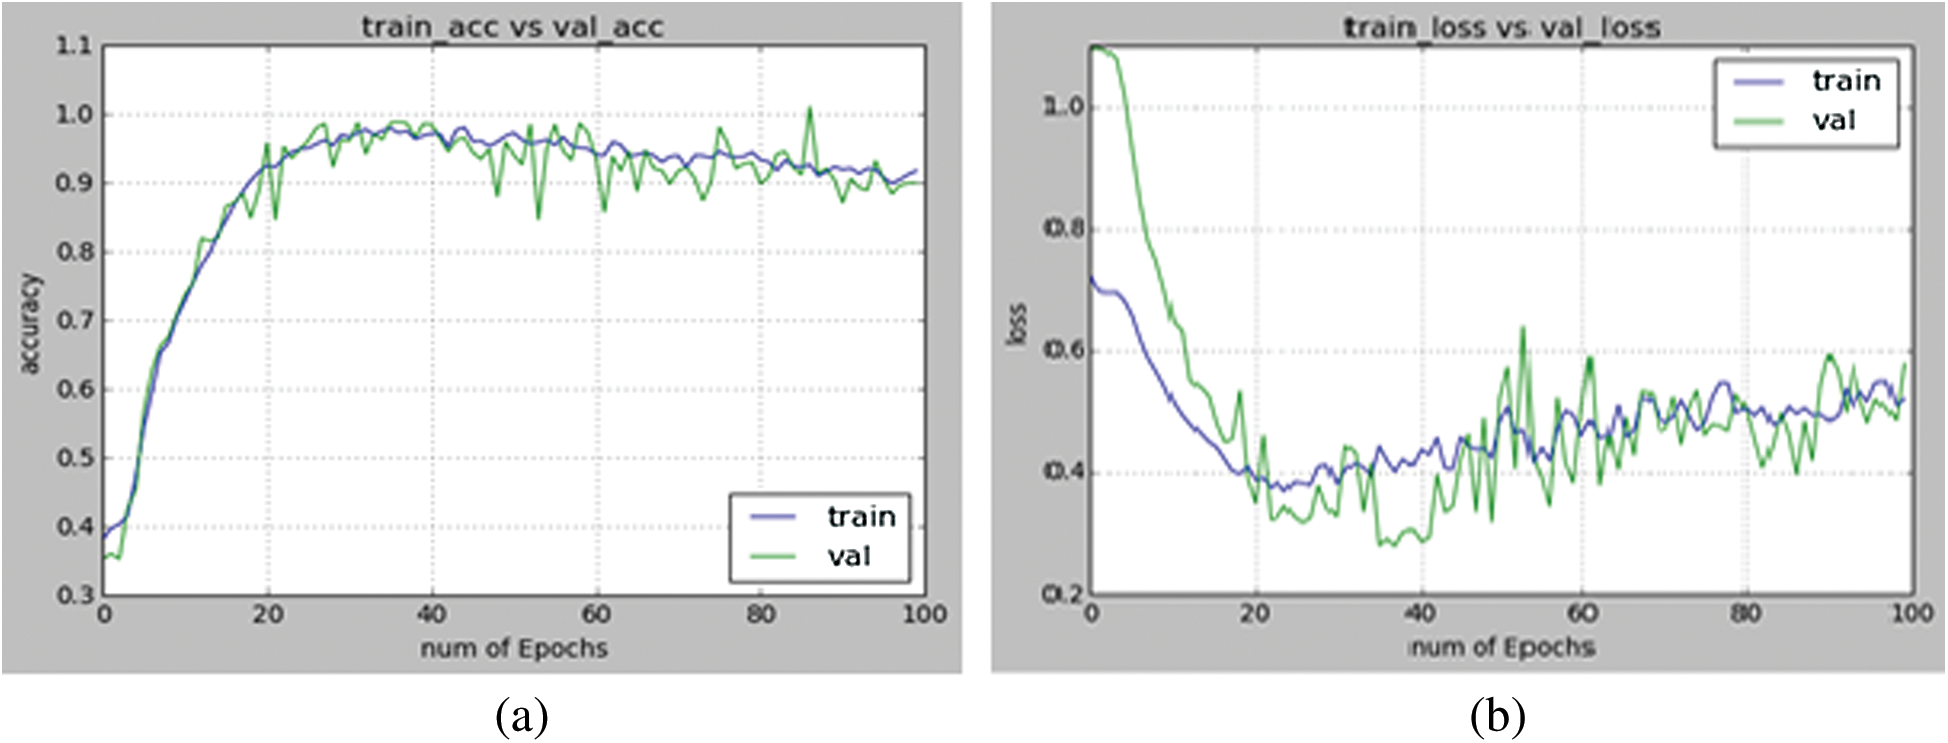
Figure 10: (a) Depicts the accuracy of training and validation plotted between number of epochs and accuracy (b) Depicts the loss during training and validation plotted between number of epochs and loss
Here number of epochs is taken as 100. Here the network fits regularly on test data and provides maximum accuracy. The accuracy of training and validation is depicted in Fig. 10.
Fig. 11 shows the output images where the DR levels are labeled based on A/B values. From the above results we identify DR levels more precisely.

Figure 11: Identification of DR levels (a) No PDR (b) Mild (c) Moderate (d) Severe (e) PDR
The remarkable advantage of KAGGLE fundus image database for feature extraction and training the classifier is in that, it allows classifier to directly learn more lesion features than exploring on its own image features. The fundus image dataset labeled by experts, may lead to conflict among the diagnostics while labeling the disease. So, the ratio of total contour area and total true arc length was used to grade DR over segmented images. For training and testing the classifier performance, KAGGLE fundus image dataset was used. Practically, the images that are supplied to deep neural network for grading DR severity cannot precisely predict the grades without proper preprocessing. The DNN has no problem in identifying the healthy eye images, because quite large healthy eye images are available in the dataset. To classify the images of extreme cases, the need for extensive training required is substantially low. Our proposed segmentation method using VGG-19 architecture effectively identifies abnormality with accuracy of 96% on 5000 validation images. VGG-19 efficiently distinguishes various DR levels labeled based on contour area to true contour arc length ratio. Future research work will be focused to detect neovascularization abnormality using concept of transfer learning.
Funding Statement: The author(s) received no specific funding for this study.
Conflicts of Interest: The authors declare that they have no conflicts of interest to report regarding the present study.
References
1R. Gargeya and T. Leng. (2017), “Automated identification of diabetic retinopathy using deep learning. ,” Ophthalmology, vol. 124, no. (7), pp, 962–969, .
2M. Mateen, J. Wen, M. Hassan, N. Nasrullah, S. Sun et al. (2020). , “Automatic detection of diabetic retinopathy: A review on datasets, methods and evaluation metrics. ,” IEEE Access, vol. 8, pp. 48784–48811, . [Google Scholar]
3H. Pratt, F. Coenen, D. M. Broadbent, S. P. Harding and Y. Zheng. (2016), “Convolutional neural networks for diabetic retinopathy. ,” Procedia Computer Science, vol. 90, pp, 200–205, . [Google Scholar]
4S. Somasundaram and P. Alli. (2017), “A machine learning ensemble classifier for early prediction of diabetic retinopathy. ,” Journal of Medical Systems, vol. 41, no. (12), pp, 201–213, . [Google Scholar]
5S. Aiki, W. Renjie and K. Seiichiro. (2019), “Fundus image classification for diabetic retinopathy using disease severity grading. ,” in Association for Computing Machinery, Tokyo, Japan, pp, 190–196, . [Google Scholar]
6R. F. Mansour. (2016), “Deep learning based automatic computer aided diagnosis system for diabetic retinopathy. ,” Biomedical Engineering Letters, vol. 8, no. (1), pp, 41–57, . [Google Scholar]
7P. Khojasteh, L. A. Passos Junior, T. Carvalho, E. Rezende, B. Aliahmad et al. (2019). , “Exudate detection in fundus images using deeply learnable features. ,” Computers in Biology and Medicine, vol. 104, pp, 62–69, . [Google Scholar]
8J. I. Orlando, E. Prokofyeva, M. del Fresno and M. B. Blaschko. (2018), “An ensemble deep learning based approach for red lesion detection in fundus images. ,” Computer Methods and Programs in Biomedicine, vol. 153, pp, 115–127, . [Google Scholar]
9A. R. Chowdhury, T. Chatterjee and S. Banerjee. (2019), “A random forest classifier-based approach in the detection of abnormalities in the retina. ,” Medical & Biological Engineering & Computing, vol. 57, no. (1), pp, 193–203, . [Google Scholar]
10R. Grzeszczuk. (2019), “Approach to classifying data with highly localized unmarked features using neural networks. ,” Computer Science, vol. 20, no. (3), pp, 329–342, . [Google Scholar]
11G. Quellec, K. Charrière, Y. Boudi, B. Cochener and M. Lamard. (2017), “Deep image mining for diabetic retinopathy screening. ,” Medical Image Analysis, vol. 39, pp, 178–193, . [Google Scholar]
12Q. Liu, B. Zoua, J. Chenc, W. Kec, K. Yued et al. (2016). , “Location to segmentation strategy for automatic exudate segmentation in color retinal fundus images. ,” Science Direct, Computerized Medical Imaging and Graphics, vol. 55, pp, 78–86, . [Google Scholar]
13B. V. Santhosh Krishna and T. Gnanasekaran. (2019), “Retinal vessel extraction framework using modified adaboost extreme learning machine. ,” Computers, Materials & Continua, vol. 60, no. (3), pp, 855–869, . [Google Scholar]
14T. Walter, J. C. Klein, P. Massin and A. Erginay. (2002), “A contribution of image processing to the diagnosis of diabetic retinopathy detection of exudates in color fundus images of the human retina. ,” IEEE Transactions on Medical Imaging, vol. 21, no. (10), pp, 1236–1243, . [Google Scholar]
15A. Borji. (2015), “What is a salient object? A dataset and a baseline model for salient object detection. ,” IEEE Transactions on Image Processing, vol. 24, no. (2), pp, 742–756, . [Google Scholar]
16A. Borji and L. Itti. (2013), “State-of-the-art in visual attention modeling. ,” IEEE Transactions on Pattern Analysis and Machine Intelligence, vol. 35, no. (1), pp, 185–207, . [Google Scholar]
17D. Mahapatra. (2016), “Retinal image quality classification using saliency maps and CNNs. ,” in Proc. Int. Workshop on Machine Learning Medical Imaging, Shenzhen, China, pp, 172–179, . [Google Scholar]
18V. Cristian and S. Nedevschi. (2015), “Detecting curvilinear features using structure tensors. ,” IEEE Tansactions on Image Processing, vol. 24, no. (11), pp, 498–511, . [Google Scholar]
19A. Ahmed, S. Malviya and Y. Pandey. (2014), “Angiographic image segmentation using gradient descent method. ,” International Journal of Engineering Research & Technology, vol. 3, no. (3), pp, 1957–1961, . [Google Scholar]
20L. Nanni, S. Ghidoni and S. Brahnam. (2018), “Ensemble of convolutional neural networks for bio-image classification. ,” Applied Computing and Informatics, vol. 15, no. 1, pp. 1–9, . [Google Scholar]
21S. S. Rahim, C. Jayne, V. Palade and J. Shuttleworth. (2016), “Automatic detection of microaneurysms in color fundus images for diabetic retinopathy screening. ,” Neural Computing Applications, vol. 27, no. (5), pp, 1149–1164, . [Google Scholar]
22J. Krause, V. Gulshan, E. Rahimy, P. Karth, K. Widner et al. (2018). , “Grader variability and the importance of reference standards for evaluating machine learning models for diabetic retinopathy. ,” Ophthalmology, vol. 125, no. (8), pp, 1264–1272, . [Google Scholar]
 | This work is licensed under a Creative Commons Attribution 4.0 International License, which permits unrestricted use, distribution, and reproduction in any medium, provided the original work is properly cited. |