DOI:10.32604/cmc.2020.012060
| Computers, Materials & Continua DOI:10.32604/cmc.2020.012060 | |
| Article |
Qualitative Analysis of a Fractional Pandemic Spread Model of the Novel Coronavirus (COVID-19)
1Department of Mathematics, Kuwait College of Science and Technology, 27235, Kuwait
2Department of Mathematics, Erciyes University, Kayseri, 38039, Turkey
3Department of Mathematics and General Sciences, Prince Sultan University, Riyadh, 11586, Saudi Arabia
4Department of Medical Research, China Medical University, Taichung, 40402, Taiwan
5Department of Computer Science and Information Engineering, Asia University, Taichung, Taiwan
*Corresponding Author: Ali Yousef. Email: a.yousef@kcst.edu.kw
Received: 12 June 2020; Accepted: 03 September 2020
Abstract: In this study, we classify the genera of COVID-19 and provide brief information about the root of the spread and the transmission from animal (natural host) to humans. We establish a model of fractional-order differential equations to discuss the spread of the infection from the natural host to the intermediate one, and from the intermediate one to the human host. At the same time, we focus on the potential spillover of bat-borne coronaviruses. We consider the local stability of the co-existing critical point of the model by using the Routh–Hurwitz Criteria. Moreover, we analyze the existence and uniqueness of the constructed initial value problem. We focus on the control parameters to decrease the outbreak from pandemic form to the epidemic by using both strong and weak Allee Effect at time t. Furthermore, the discretization process shows that the system undergoes Neimark–Sacker Bifurcation under specific conditions. Finally, we conduct a series of numerical simulations to enhance the theoretical findings.
Keywords: Allee Effect; coronavirus; fractional-order differential equations; local stability; Neimark–Sacker bifurcation
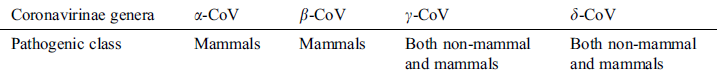
In the last few months, nature has showed its laws in establishing the environment of the 21st century. It is out of our primary objective whether the coronavirus (COVID-19) is used as a biological weapon or not. The main point is now that humans are fighting against something to survive that has a genome size of 27 to 34 kilobases. Coronaviruses are members of the sub-family coronavirinae in the family coronaviridae and the order Nidovirales [1,2]. They show four genera, which are given in Tab. 1.
Table 1: Genera of COVID-19 and the pathogenic class
The natural host of SARS-CoV, MERS-CoV, HCoV-NL63, and HCoV-229e are bats, while HCoV-OC43 and HKU1 have originated from rodents [3,4]. In the spread of transmission, domestic animals have only intermediate host role from the natural host to the human one. Covid-19 was not considered as highly pathogenic, until the outbreak of SARS-CoV in 2002 and MERS-CoV in 2012. The spread of SARS-CoV in China (Guangdong) showed a COVID-19 that was transmitted from bats to an intermediate host, like market civets from which the transmission spreads to the human host. At the same time, the outbreak of MERS-CoV in the Middle East Countries also came from bats to dromedary camels as an intermediate host, and from the dromedary camels to humans [5–8]. These viruses cause respiratory and intestinal infections, with symptoms including fever, dizziness, and cough. In December 2019, a novel Coronaviridae was reported in China (Wuhan). The outbreak was associated again with intermediate hosts like reptilians, while the natural host was assumed as bats. This virus was designated later as Covid-19 by the WHO.
Covid-19 was characterized by two members of β-coronavirus; the human-origin coronavirus (SARS-CoV Tor2) and bat-origin coronavirus (bat-SL-CoVZC45). Intensive studies show that it was most closely related to the bat-origin coronavirus [9]. Thus, the primary assumption formed was that the natural host of Covid-19 spreads by infected bats of genus Rhinolophus that are mainly in the area of Shatan River Valley.
Domestic animals, like snakes in that area, were hunted for the food market in Wuhan, which played an intermediate host role in the transmission. Finally, this virus spillover from the intermediate hosts to cause several diseases in human. A virus that started with an endemic pathogenic behavior in China (Wuhan) reaches somehow to a pandemic point worldwide with the infection from human-to-human.
It has been realized that the dynamics of many biological and medical phenomena can be characterized via mathematical models. Over the years, many models are formulated mathematically to analyze events in biological and medicine such as infections, treatments, or environmental phenomena [10–13]. The study of these phenomena has been restricted to models of integer-order differential equations (IDEs). However, it is seen that many problems in biology, as well as in other fields like engineering, finance, and economics, can be successfully formulated by the so-called fractional-order differential equations (FDEs); see, for instance, the papers [14–20]. The nonlocal property of models of FDEs is not only depending on the current state but also provides an adequate description for the historical ones. It is evidenced that FDEs can model certain phenomena that cannot be modeled by IDEs. Thus, FDEs are mainly used on biological models since they are relevant to systems with memory and hereditary [21–27].
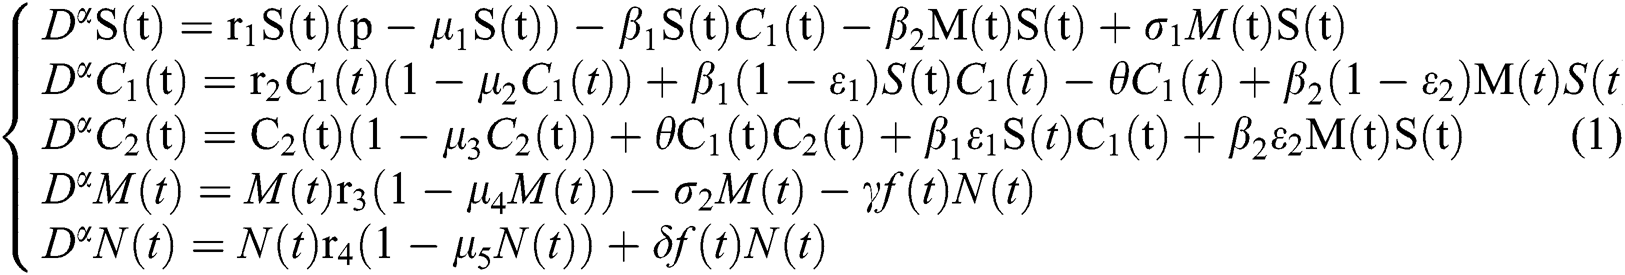
In this paper, we establish a model that describes the pandemic infection, which occurs when the virus is transmitted from the human body to the intermediate host and continues to spread from human-to-human. The model consists of five fractional differential equations. The first three equations show an SI (susceptible-infected) model to explain the transmission from human-to-human, where  is the susceptible class,
  is the infected type that does not know they are infected because of the late occurred symptoms of COVID-19 and
  shows the infected class that knows they are infected. The spillover from the intermediate infected class
  to the human host
  denotes a predator-prey mathematical model, while for the transmission from the natural host
  , which is the bat population, to intermediate host
  is a host-parasite model of Holling Type II.
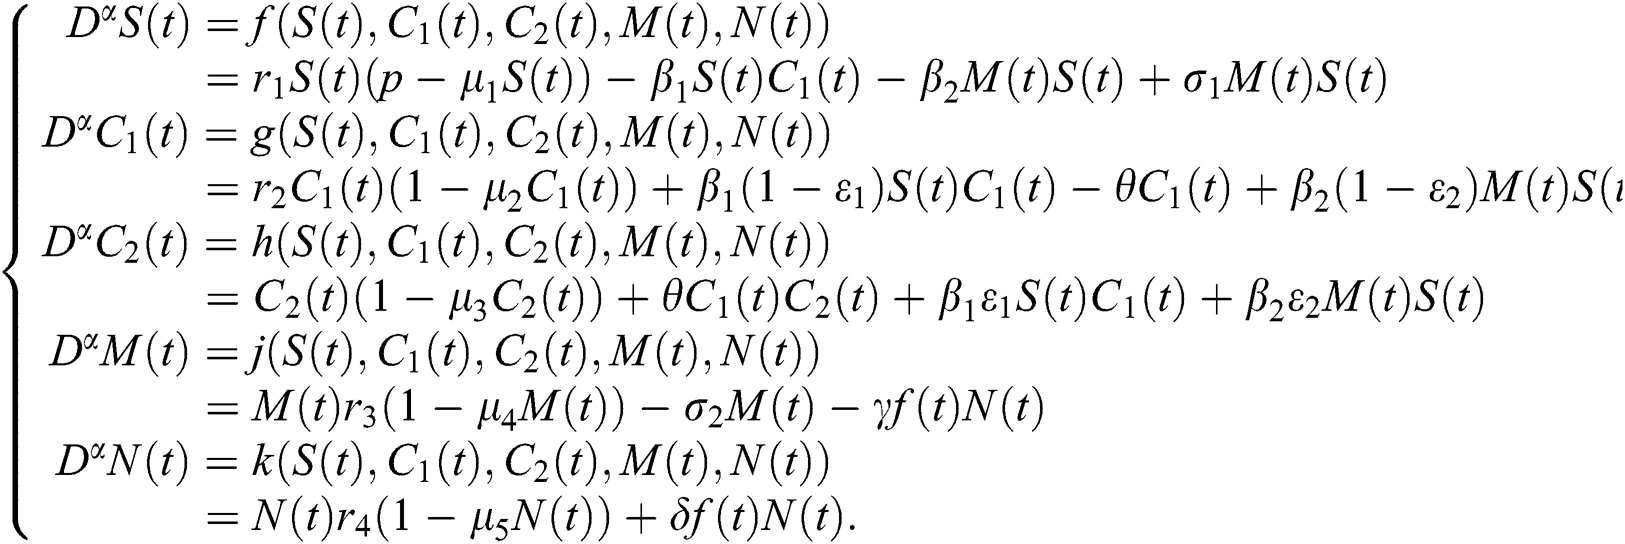
Indeed, the mathematical model of this biological phenomena has the form:
where

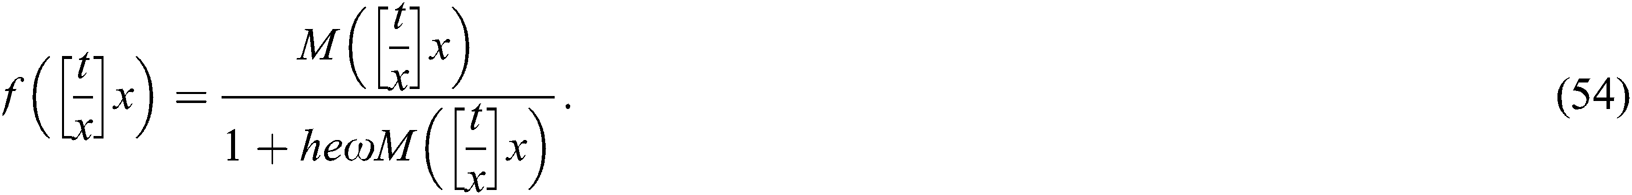
represents the Holling type II function and all the parameters of the model (1) belong to  and
and  .
.
The susceptible  is composed of individuals that have not contacted the infection but can get infected through contacts from the human that does not know they are infected and from the intermediate hosts. The parameter
  is the population growth rate of the susceptible population and
  denotes the logistic rate.
 is a rate of the susceptible population per year. The susceptible lost their class following contacts with infectives
  and the intermediate host
  at a rate
  and
and  , respectively.
  links the parameter of the interaction between the hunted
  class and the predator
  population.
The  class does not know that they have COVID-19. In this equation,
  is the population growth rate of the class, while
  is the logistic rate. The population of this class decreases after screening at a rate
  and be aware of the infection. Another possibility is that after the S-
 contact, the symptoms occur in early stages so that both classes noticed that they are infected, which is given with the rate
  . The intermediate host infected group could also show early symptoms to be aware of the infection, which is provided by a rate of
  The logistic rate of
  is denoted as
  .
.
 is the domestic animal as an intermediate class in the corona transmission spread.
  is the intrinsic growth rate of the population, while
  is the logistic rate.
  shows the effect on the hunted
  during the interaction between the intermediate host and susceptible class.
  denotes the predation rate in the host-parasite scheme.
 represents the natural host (bat population) of COVID-19 in this dynamic system.
  is the intrinsic growth rate and
  is the logistic rate of the population.
  shows the conversion factor of the natural host.
  is the attack rate of the bat population to infect the
  , while
  represents the fraction of the potential infectivity of the natural host.
  is the rate of average time spend on infecting the domestic intermediate class, which is also known as the handling time.
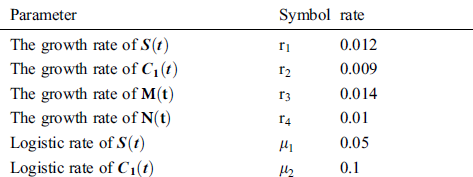
Tab. 2 shows description of the parameters that are given in system (1).
Table 2: Description of the parameters
Definition 2.1 Podlubny [25] The fractional integral of order  of a function
  is given by

defined on 
Definition 2.2. Podlubny [25] Let  be a continuous function. The Caputo fractional derivative of order
  is given by

Definition 2.3. Podlubny [25] The function

with  being the set of complex numbers is called the Mittag–Leffler function of one parameter.
3 Stability Analysis of the Co-Existing Critical Point
Consider the model
To analyze the stability of model (6), we perturb the equilibrium point by adding  that is,

Thus, we have
and
Thus, we obtain a linearized system about the equilibrium point of the form

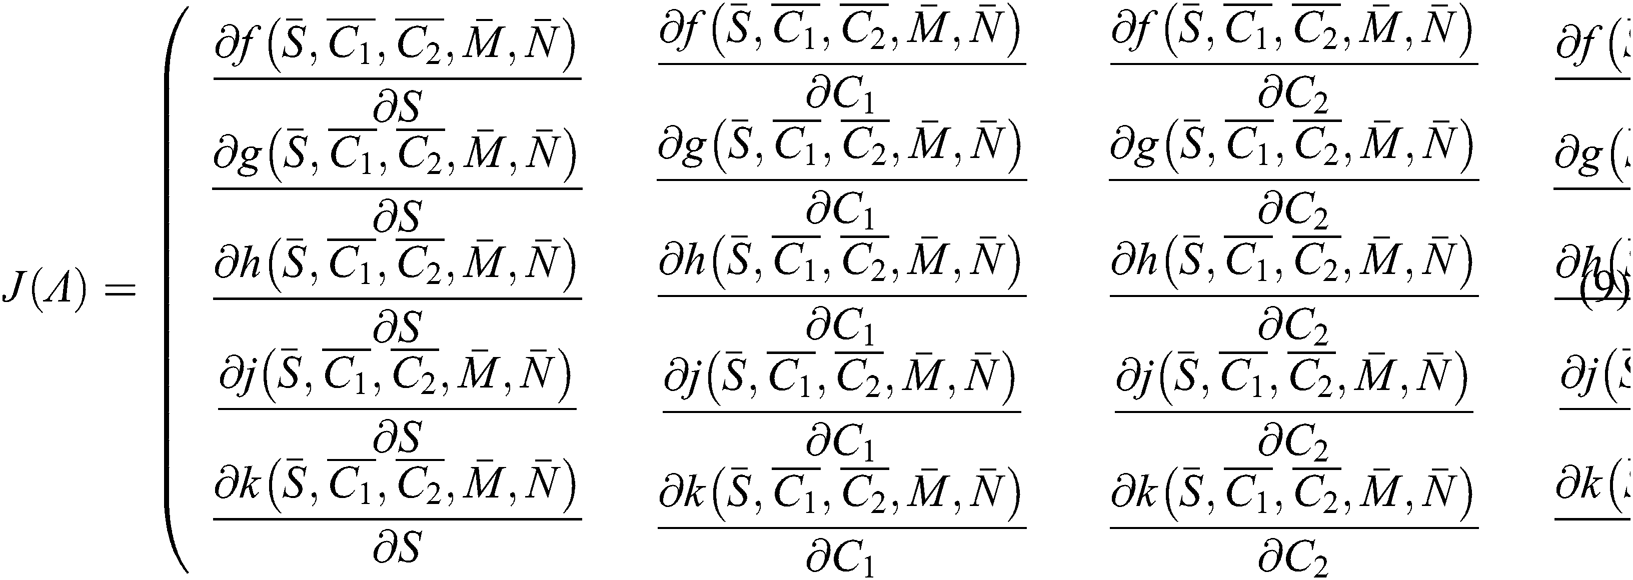
where  . Moreover, J is the Jacobian matrix at the equilibrium:
where the co-existing equilibrium point is  . Then, we have
  , where C is given by
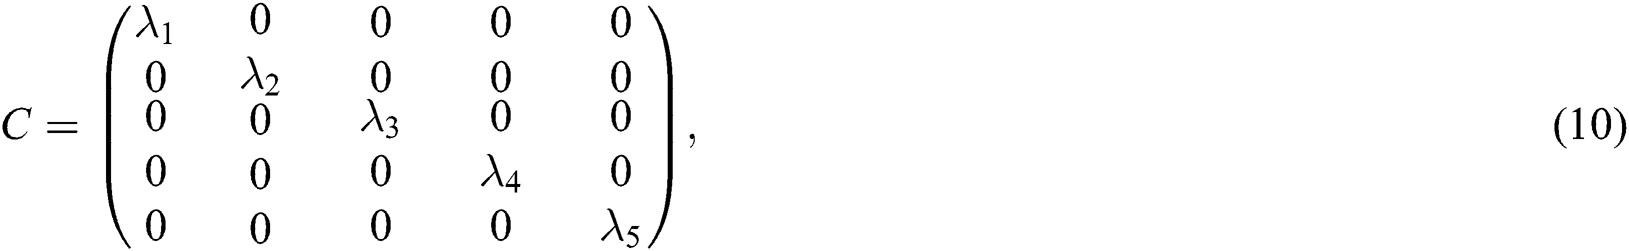
and  are the eigenvalues and B the eigenvectors of J. Therefore, we get
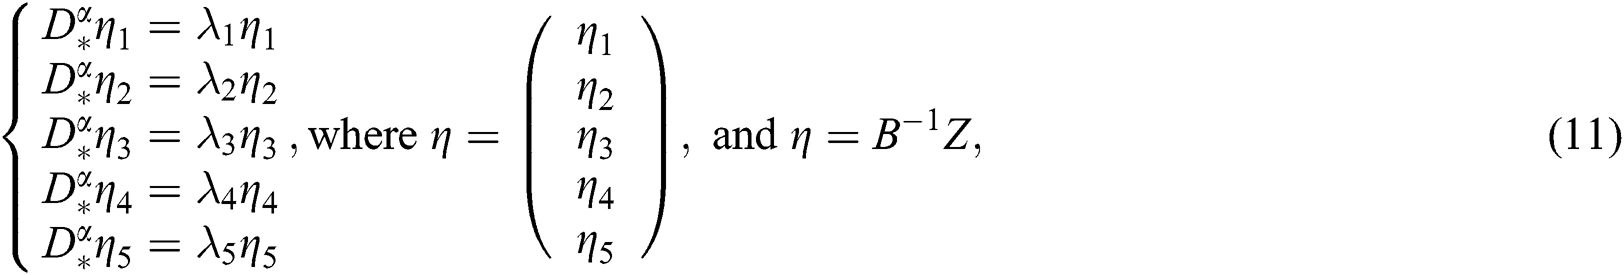
whose solutions are given by Mittag–Leffler functions


and

By using the result of [28], if  then
then  are decreasing and therefore we conclude that
  are decreasing. Let
  be the solution of Eq. (8). If the solution of Eq. (8) is increasing, then
  is unstable and if
  is decreasing, then
  is locally asymptotically stable.
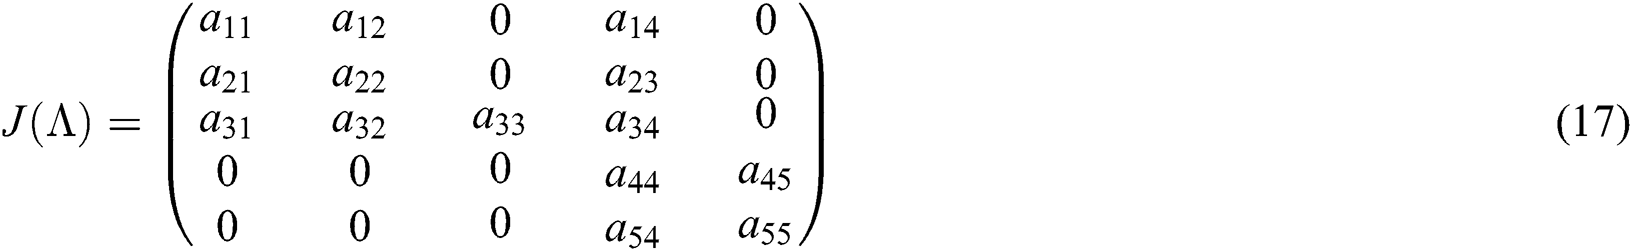
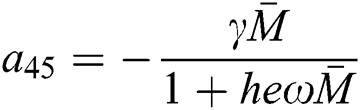
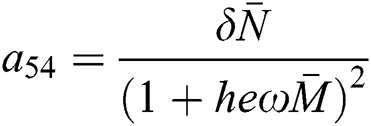
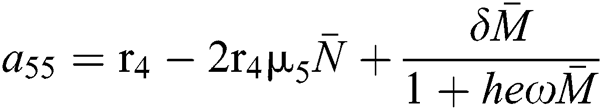
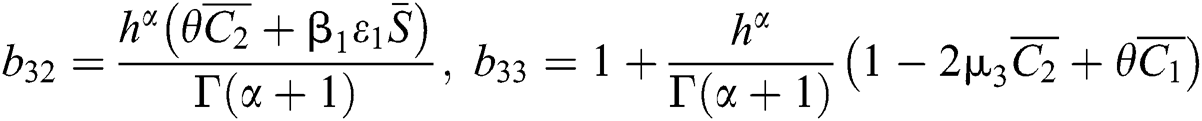
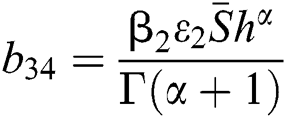
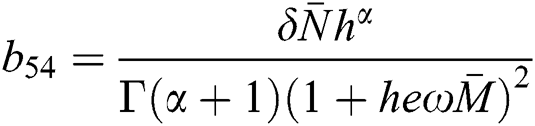
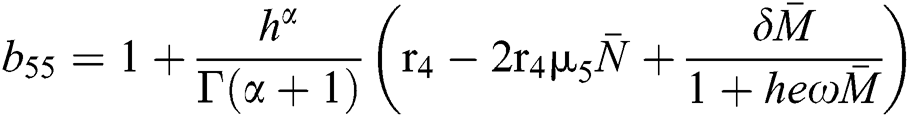
Evaluating the Jacobian matrix (9) for the co-existing equilibrium point  we obtain
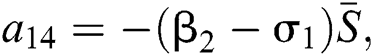
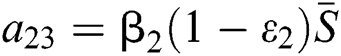
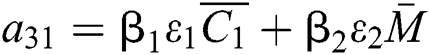
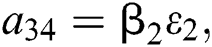
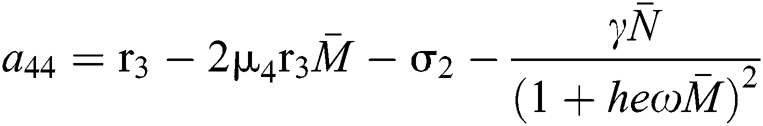
where
 ,
, 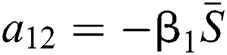 ,
, 
 ,
,
 ,
,  ,
,
 ,
,  ,
, 
 ,
,  ,
,
and
 ,
,  .
.
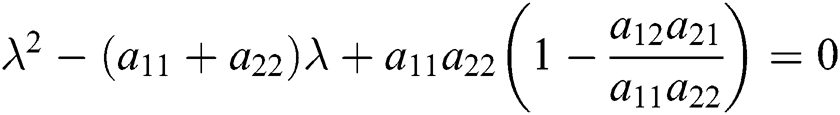
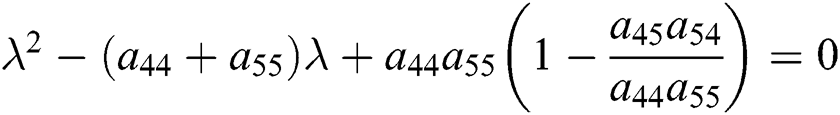
The characteristic equation of the matrix (17) is given as

and

if

From Eq. (18), we have two quadratic equations, which are
 or
or

and
 or
or

where 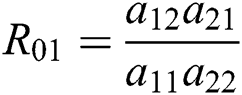 and
and 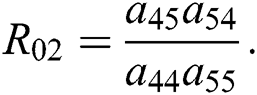
 is the basic reproduction number, which represents the transmission potential of
  class, while
  shows the transmission potential of the intermediate-natural host classes
  For the following theorems in this section, we consider the case, where both
  and
and 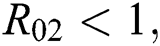 which hold for the following statements:
(i) 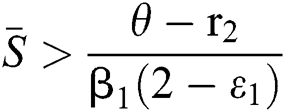 ,
,
(ii) 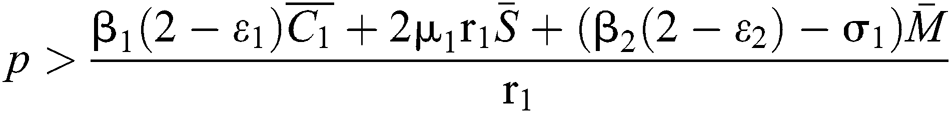 ,
,
(iii) 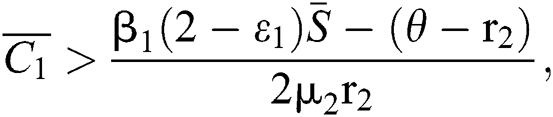
(iv)  and
and 
(v)  and
and  .
.
Theorem 3.1. Let  be the co-existing critical point of system (6) and assume that (i)–(iv) hold such that
  and
and  Moreover, let
  and
and  . If
. If
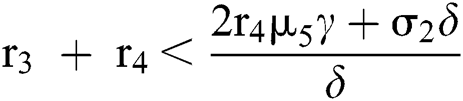
 and
and  ,
,
where
 ,
,
then all roots of Eq. (18) are real or complex conjugates with negative real parts and 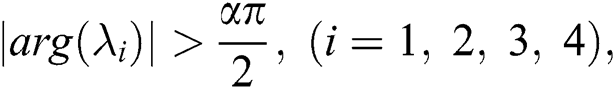 is equivalent to the Routh–Hurwitz criteria. This implies that
  is locally asymptotically stable.
Proof. Let us consider the case for  to have eigenvalues with negative real parts. Thus, we have

and

From (ii) and Eq. (24), we obtain

if

where 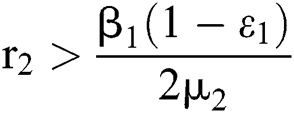 .
.
In considering both (iii) and Eq. (26), we get

where  Moreover, the discriminant of Eq. (21) is, in this case, positive.
Let us consider now the case for  to have eigenvalues with negative real parts. Thus, from

we obtain

and

From (v) and Eqs. (28)–(29), we obtain
 for
for 
and
 for
for 
Since the discriminant of Eq. (22) is positive, the proof is complete.
Remark 3.1. Theorem 3.1. shows that among the human hosts, those who do not know they are infected, are the control class in the spread. In contrast, between the animal hosts, the intermediate class plays a dominant role, since that one has the essential role in transmitting from animal to human. The transmission potential for both  and
and  are
are  and
and  . Moreover, the susceptible class and the
  class is stable based on two parameters, which are the awareness of the symptoms and the screening rate.
Theorem 3.2. Let  be the co-existing critical point of system (6) and assume that (i)–(iv) hold such that
  and
and  Furthermore, let
  and
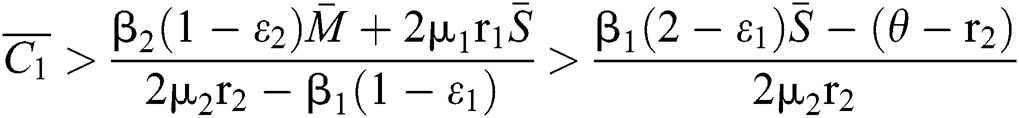
and  If
If
 and
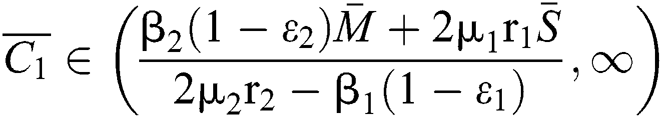
and 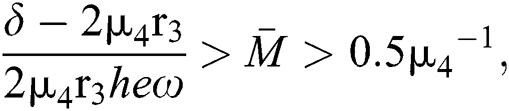 and the ratio between the susceptible and intermediate host is given by
  , where
and
Then all roots of Eq. (18) are complex conjugates with positive real parts, which implies that  is locally asymptotically stable.
Proof. Let us consider the case for  to have eigenvalues with positive real parts. This holds if

and

From (ii) and Eq. (32) we obtain

if

where  . In considering both (iii) and Eq. (34), we obtain
 ,
,
where

Additionally, we get 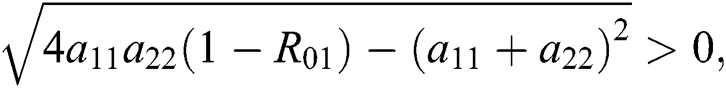 since
since  where
where
Similarly, let us consider the case for  to have eigenvalues with positive real parts. From

we obtain

and

From (v) and Eqs. (37)–(38) we have
 for
for 
and
 for
for 
Moreover, we get  since
since  where
where
This completes the proof.
Remark 3.2. In Theorem 3.2., we emphasize that class  should be more aware of the symptoms that might become from the susceptible class as well as from the intermediate class, than the
  class to stop the outbreak. For the susceptible class, it is more important to keep the population rate per year non-infected. The transmission of the virus to the offspring would reach an uncontrollable phenomenon worldwide.
Theorem 3.3. Let  be the co-existing critical point of system (6) and assume that (i)–(iv) hold such that
  and
and  (i) Let
  ,
,  ,
,  and
and
 .
.
If
 and
and 
where
then the  class represents real or complex conjugates with negative real parts, while the
  class shows complex conjugates with positive real parts.
(ii) Let  ,
,  and
and
 .
.
If
 ,
,  and the ratio between the susceptible and intermediate host is given by
  where
where
then the  class represents complex conjugates with positive real parts, while the
  class shows real or complex conjugates with negative real parts.
Example. In this part, we present numerical simulations that are in good agreement with our theoretical results. We assume the initial conditions of the system (1) as  and
and  .
.
In Fig. 1 the blue graph denotes the susceptible class  and the red graph shows
  who does not know they are infected. Fig. 1 represents the transmission of the infection that occurs as an epidemic case in some areas, but it spreads intensively to a pandemic case and covers almost the susceptible class. Here we want to emphasize the point of screening, where we assume that about
  do testing in the hospitals before the symptoms appear. Additionally, we consider that the symptoms appear late, and thus the awareness of the infection is also at
  . This changes the endemic spread from epidemic to an uncontrolled pandemic form.
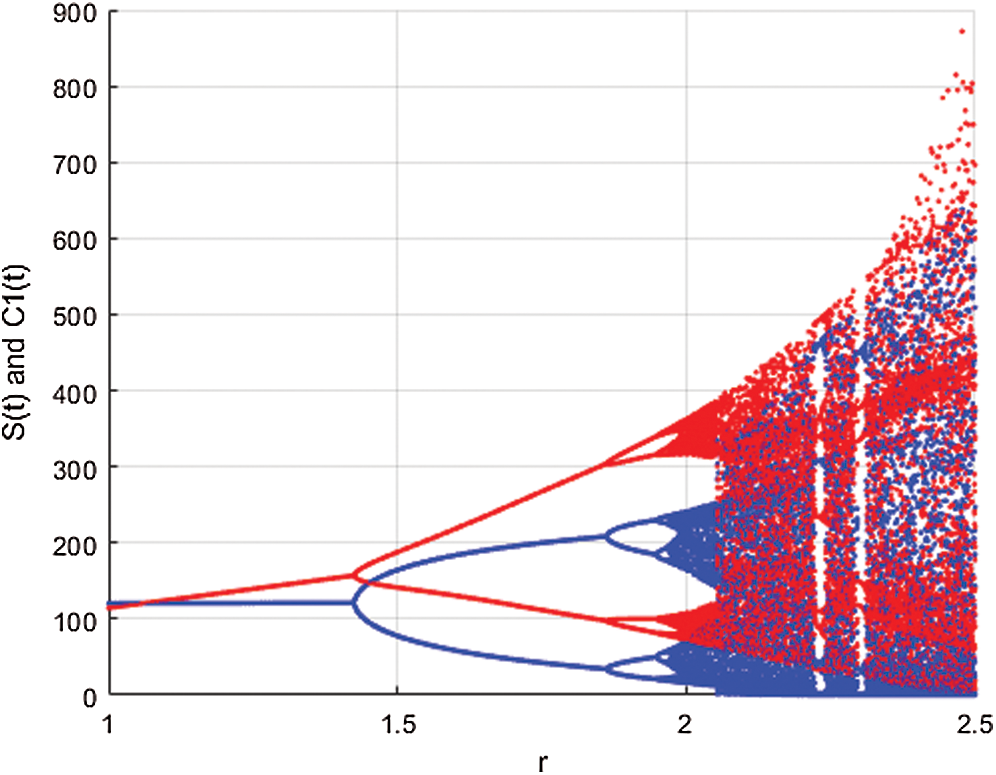
Figure 1: Spread of the  class and effect on the susceptible
  class, where
  and
and  =
= 
In Fig. 2, we keep the screening parameter as  , while we consider the case that the people become aware of the virus and the symptoms of it through media and health organizations. An organized and constant information flood from media might increase the awareness up to
  =
=  .
.
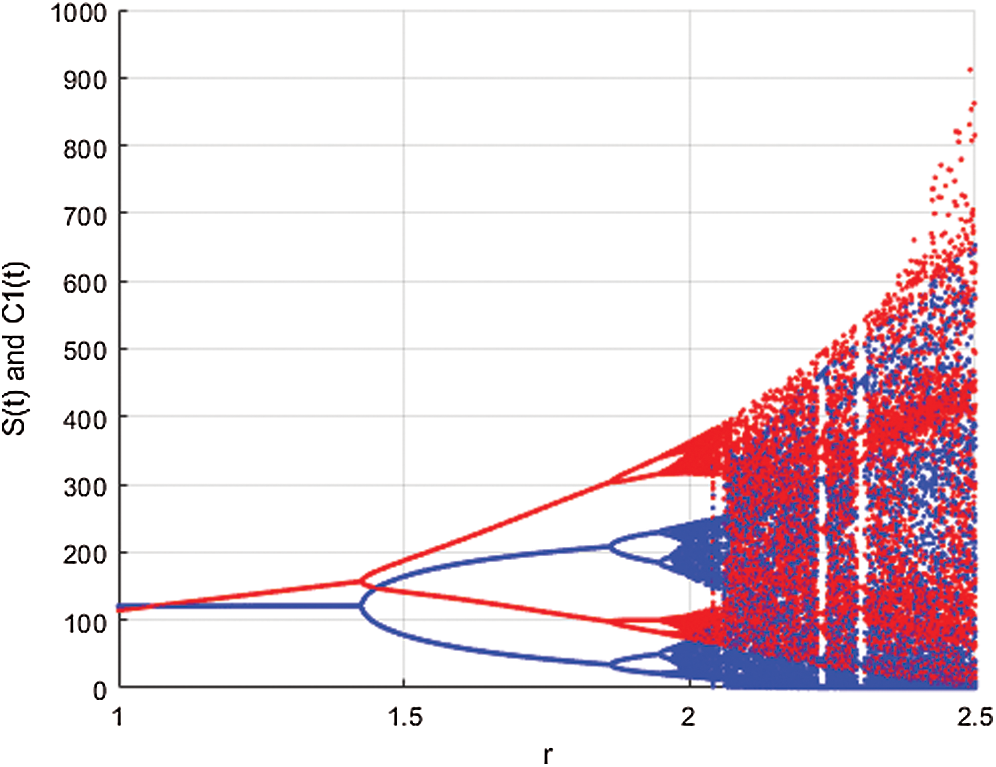
Figure 2: Spread of the  class and effect on the susceptible
  class, where
  and
and  =
= 
This awareness of the people through media and health organizations let them go to hospitals for screening so that the class who does not know they are infected decreases. Fig. 3 shows the effect of the testing when it reaches to %5. The spread is under control and returns to an epidemic form.
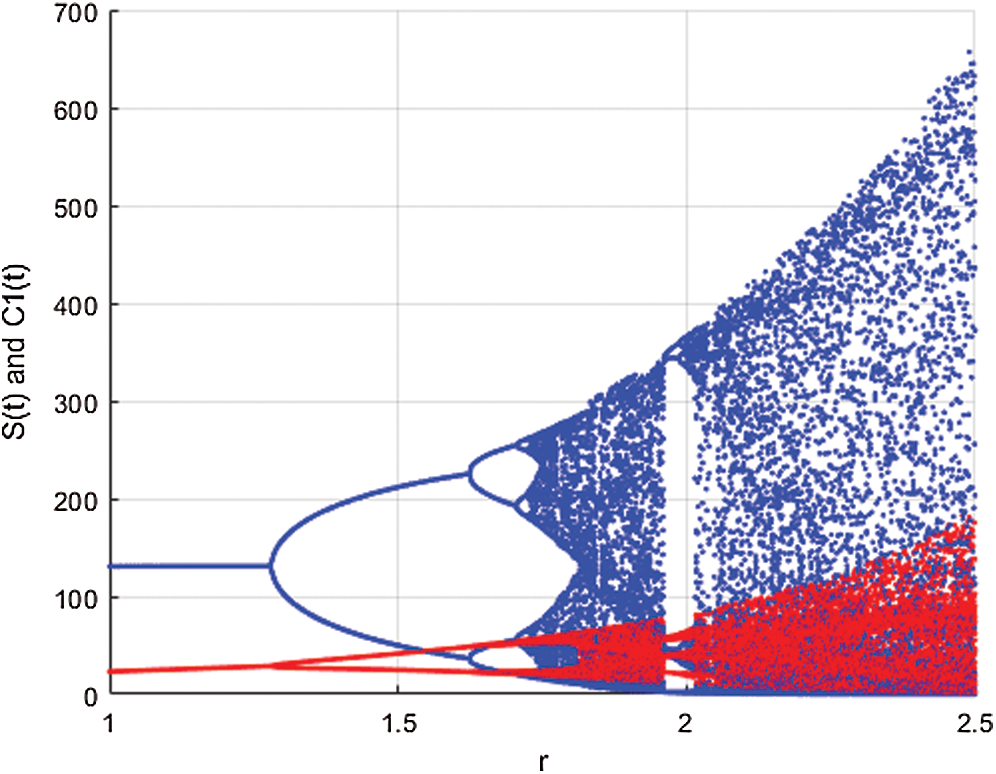
Figure 3: Spread of the  class and effect on the susceptible
  class, where
  and
and  =
= 
We considered in these examples the infection from human-to-human since the pandemic case reaches from the human transmission. We want to emphasize the strong coordination between health organizations and the media which is an essential tool for two critical parameters, which are  and
and  (
( )
)
The design of nature keeps the natural host and intermediate host in a stable dynamical system in the habitat. The intermediate host had only a transmission role from animal to human, while the main spread happens through human to human from the  class who does not know they are infected.
4 Existence and Uniqueness of the Initial Value Fractional-Order Problem
Considering system (6) with the initial conditions  and
and  , the initial value problem can be written in matrix form as

for  where
where  and
and  .
.
Let us assume that  and
and  ,
,  ,
,
when  In this case, the following definitions can be adopted to the main theorems in this section.
Definition 4.1. Let  be the class of continuous column vector
  whose components
  are the class of continuous functions on the interval
  The norm of
  is given by

when  we write
  and
and  .
.
Definition 4.2. Let the initial value problem Eq. (39) has a solution given by  . If
. If
(i)  where
where  and
and

(ii) satisfies Eq. (39).
Theorem 4.1. The initial value problem Eq. (39) has a unique solution 
Proof. Because of Eq. (39), we have

Operating  on Eq. (40), we obtain

Define the operator  by
by

It follows that


This implies that  If we choose W such that
  then we obtain
  . Therefore, using the Banach fixed point theorem, we conclude that the operator
  given by Eq. (42) has a unique fixed point. Consequently, Eq. (41) has a unique solution
  From Eq. (41), we have
and
which implies
from which we can deduce that 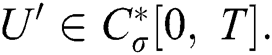 Thus, we have
It follows that

which implies

and thus
Therefore, this IVP is equivalent to Eq. (39), which completes the proof.
5 The Case of Extinction via Strong Allee Effect
In 1838, Pierre Verhulst [29] considered the logistic growth function to explain mono-species growth. Later on, it is demonstrated that the logistic equation needs modifications to explain the growth of the population in low density-size, which is known as the Allee effect.
The Allee effect can be divided into two main types:
(i) strong Allee effect and
(ii) weak Allee effect.
A population with a strong Allee effect will have a critical population size, which is the threshold of the population, and any size that is less than the threshold will go to extinction without any further aid. However, a population with a weak Allee effect will reduce the per capita growth rate at lower population density or size [30–34].
Let us incorporate an Allee function to the  class at time t such as
where

is a function of Holling Type II and  is an Allee function at time
Let

where we obtain  , if
, if
and
where
Remark 5.1 The susceptible class and the classes who do not know they are infected are the main populations that affect the Allee function in stabilizing the spread of transmission. While it is essential to keep human non-infected, the other essential aim is to detect the infected class before the symptoms occur.
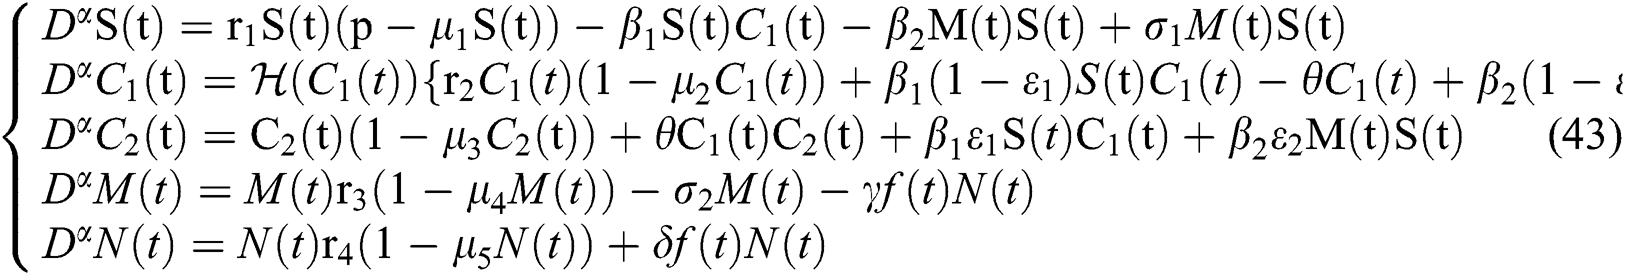
The characteristic equation of system (43) is given by

and

where
 ,
, 
From Eq. (48), we have two quadratic equations, which are

and

where  and
and  is the basic reproduction number, which represents the transmission potential of the
  class in the case of early detection, while
  shows the transmission potential of the intermediate-natural host classes. This indicates that the reproduction numbers are not dependent on the Allee function.
For a strong Allee effect, let us assume that the Allee function is given by

where  represents the Allee threshold of the infected class, that do not know they are infected.
The following Theorem is given without proof since it is similar to the stability analysis of Section 3.
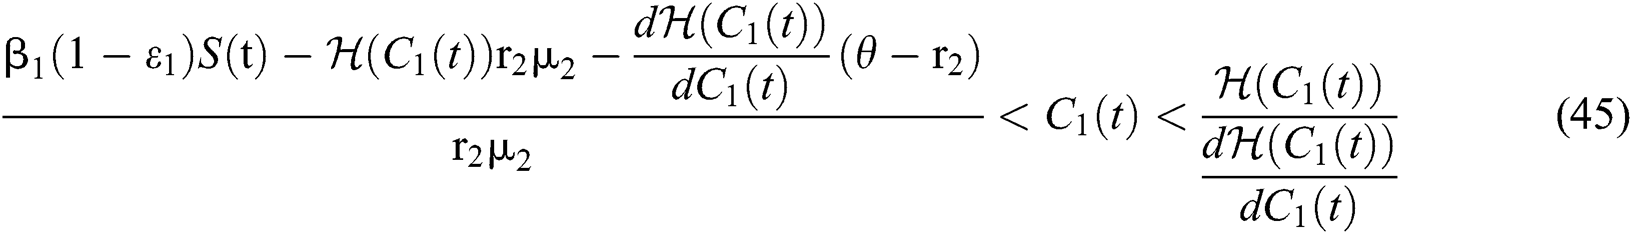
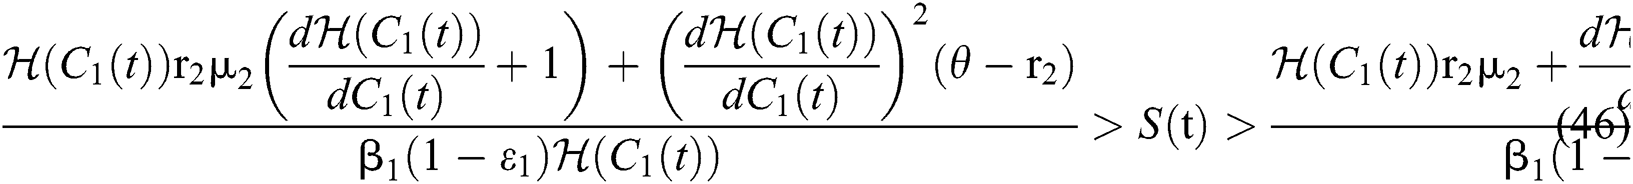
Theorem 5.1. Let  be the co-existing critical point of system (43) and assume that (i)–(iv) hold with Eqs. (45)–(47) such that
  and
and 
(i) Let  ,
,  and
and  If
If
 and
and  ,
,
where
 ,
,
then all the roots of the system are real or complex conjugates with negative real parts.
(ii) Let  ,
,  and
and
If
 and
and 
and the ratio between the susceptible and intermediate host is given by  , where
and
Thus, all roots of the system are complex conjugates with positive real parts.
(iii) Let  ,
,  ,
,
 and
and
 .
.
If
 and
and 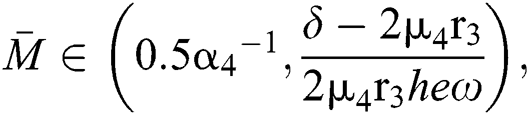
where
then the  class represents real or complex conjugates with negative real parts, while the
  class shows complex conjugates with positive real parts.
(iv) Let 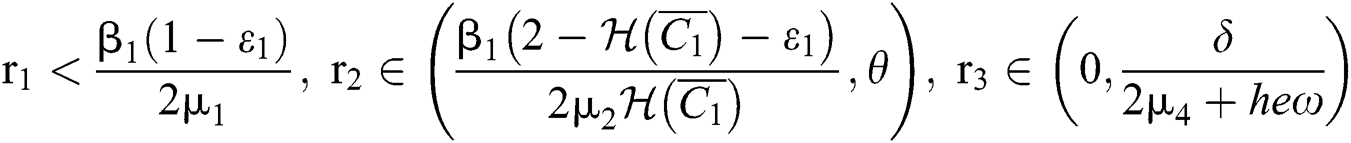 ,
,  ,
,  and
and
 .
.
If
 ,
,  and the ratio between the susceptible and intermediate host is given by
 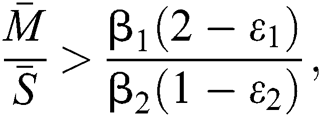 where
where
then the  class represents complex conjugates with positive real parts, while the
  class shows real or complex conjugates with negative real parts.□
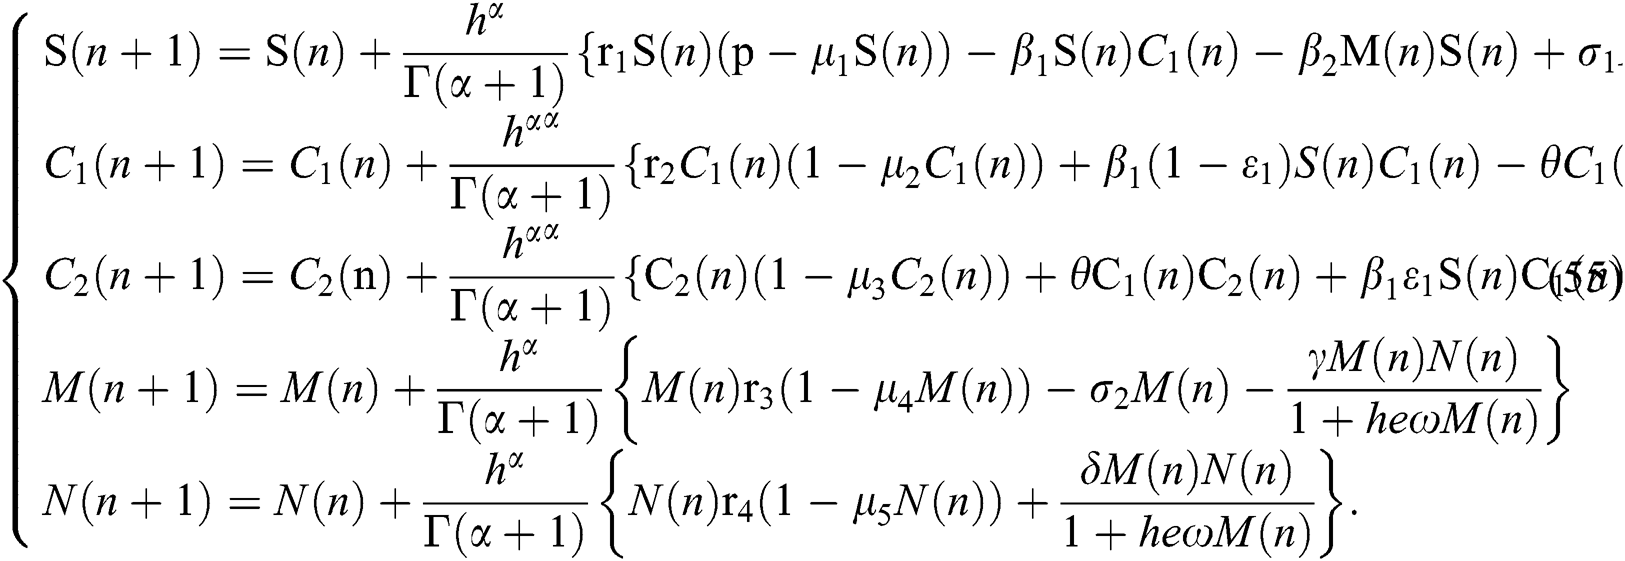
6 Neimark–Sacker Bifurcation of the Dynamical Behavior with Discretization
In this section, we consider the discretization process to analyze Neimark–Sacker bifurcation. We will modify our system in (1) in considering the discrete-time effect on the model. The discretization of system (1) is as follows:
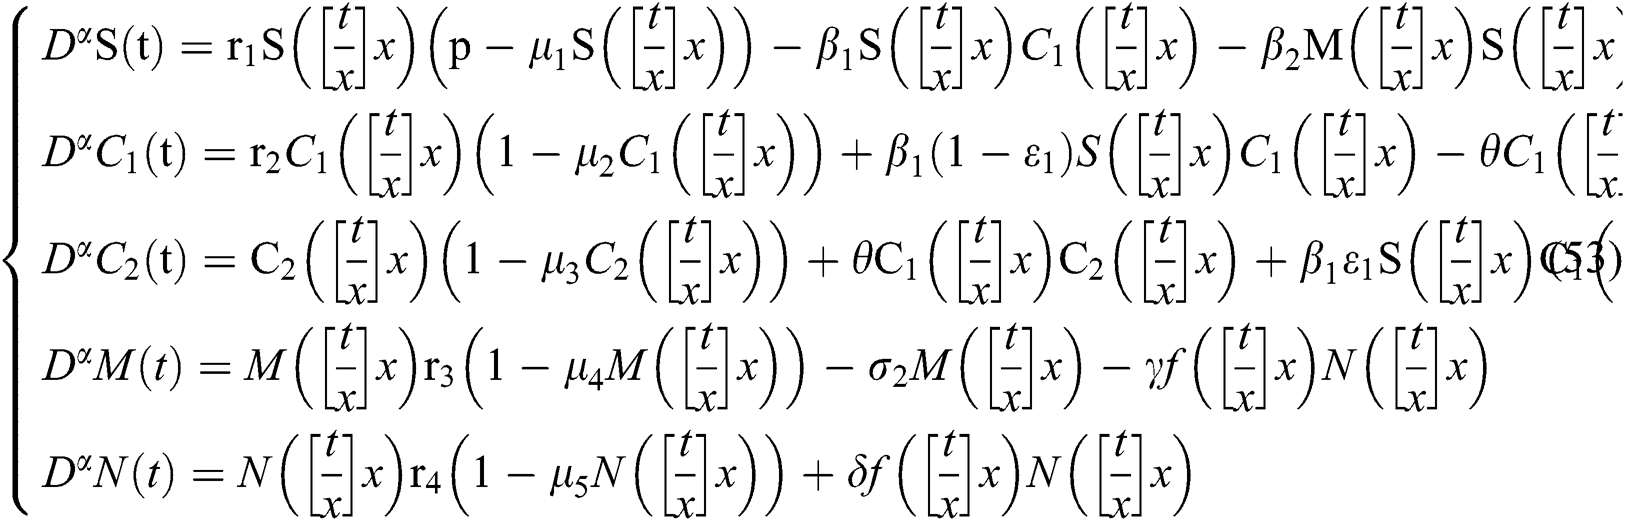
where
The solution of system (53) for  is given by
If we repeat the discretization process n times, we get
For  and
and  , while
  , we have
The Jacobian matrix of (55) around the co-existing equilibrium point  is
is
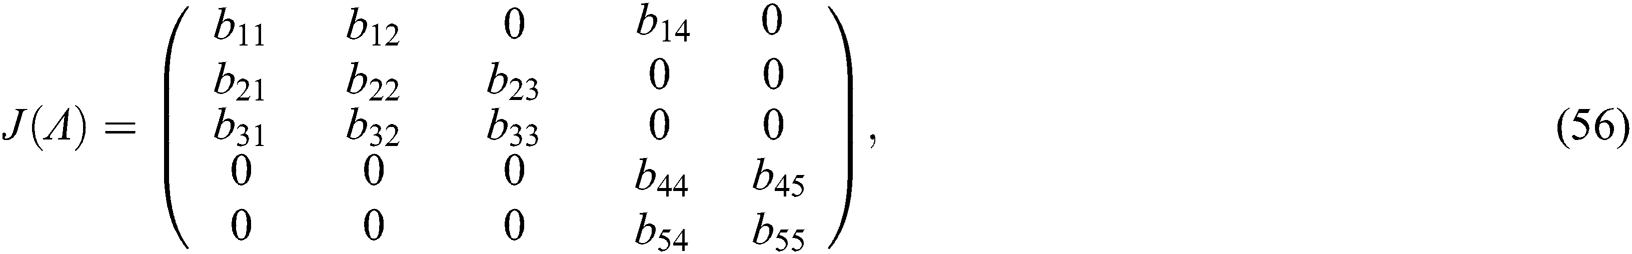
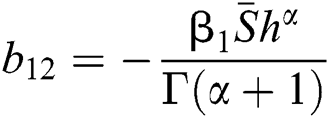
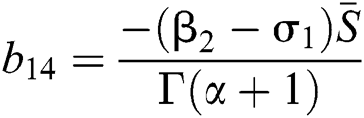
where
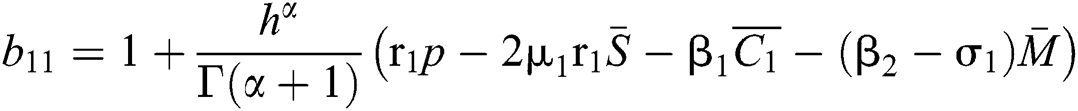 ,
,  ,
, 
 ,
,  ,
, 
 ,
,  ,
, 
 ,
,
 ,
, 
We obtain the characteristic equation of the matrix such as

and

where (i)-(v) hold and

To analyze the conditions for Neimark-Sacker Bifurcation, we use the following Theorem.
Theorem 6.1. [35] For a quadratic polynomial  such as

a pair of complex conjugate roots of (1) lie on the unit circle if and only if
(a) 
(b) 
(c) 
(d) 
Theorem 6.2. Let  be the co-existing critical point of system (55) and assume that (i)–(v) hold. If
where  , then the
  class undergoes a Neimark-Sacker bifurcation. Additionally, if
where  and
and  72for
72for  and
and  then the
  classes shows also a dynamical behavior of Neimark–Sacker bifurcation.
Proof. Let us first consider the statements in Theorem 6.1 for Eq. (57). Thus, from (a)-(c) together with (i) we have
which holds for

where  .
.
Finally, from (d) we obtain
which gives

where
In considering both Eqs. (61) and (62), we get
which completes the proof of the  class.
The characteristic equation Eq. (58) holds for Theorem 5.1./(a)–(c), if
then


and
Finally, from (d) we get
which holds for
where


This completes the proof.
In this paper, we classified the coronaviruses and their spread from the natural host to the human host. We proposed a model of the novel coronavirus, which is known as COVID-19, as a system of fractional-order differential equations. We divided the system into five sub-classes:
the susceptible class  the infected class
  , that does not know they are infected since specific symptoms did not appear,
the infected class  that knows they are infected because of some symptoms such as respiratory and intestinal infections, including fever, dizziness, and cough, appeared.
the intermediate domestic host  that has a transmission role from the natural host to the human host
the natural host  that are bats of genus Rhinolophus.
We consider the pandemic infection case; animal to human and human to human. Therefore, the first three equations in the constructed model show human to human transmission. The spillover from the intermediate infected class to the human host denotes a predator-prey mathematical model, and the transmission from the natural host to intermediate host  is a host-parasite model of Holling Type II.
In Sections 3 and 4, we analyzed the local stability of the co-existing equilibrium point by using the Routh–Hurwitz Criteria. We proved the existence and the uniqueness of the initial value problem.
Theorem 3.1., shows that among the human hosts, those who do not know they are infected are the control class in the spread. While between the animal hosts, the intermediate class plays a dominant role in the spread since that class has an essential role in transmitting the virus from animal to human. The transmission potential for both  and
and  is
is  and
and  respectively. Also, the susceptible class and the
  class is stable based on two parameters, which is the awareness of the symptoms and the screening rate.
In Theorem 3.2., we emphasized that  class should be more aware of the symptoms that might become from the susceptible class as well as from the intermediate class, than the
  class to stop the outbreak. For the susceptible class, it is more important to keep the population rate per year non-infected. The transmission of the virus to the offspring would reach an uncontrollable phenomenon worldwide.
In Section 5, we incorporate the Allee function at time  . The strong Allee effect is analyzed so that the screening for possible inflectional cases is an essential control parameter to support the Allee function in stabilizing the effect of the spread.
In Section 6, we deduced that the system demonstrates a Neimark–Sacker bifurcation under specific conditions.
Availability of Data and Material: All data generated or analyzed during this study are included in this published article.
Authors’ Contributions: Yousef and Bozkurt conceived the study and was in charge of overall direction and planning. Bozkurt and Yousef designed the mathematical model and set up the main parts of the study. They proved the theorems. Bozkurt, Yousef, and Abdeljawad collected the data and analyzed them. All authors interpreted the data and carried out this implementation. Bozkurt and Yousef conducted the simulation results using MATLAB 2019. All the authors are involved in writing and editing the manuscript. There is no Ghost-writing.
Acknowledgement: F. B. acknowledges the support of Erciyes University for the research study.
Funding Statement: The author(s) received no specific funding for this study.
Conflict of Interest: The authors declare that they have no conflicts of interest to report regarding the present study.
References
1P. C. Woo, S. K. Lau, C. S. Lam, C. C. Lau, A. K. Tsang et al. (2012). , “Discovery of seven novels mammalian and avian coronaviruses in the genus delta coronavirus supports bat coronaviruses as the gene source of alphacoronavirus and beta coronavirus and avian coronavirus and delta coronavirus. ,” Journal of Viorolgy, vol. 86, no. (7), pp, 3995–4008, .
2P. C. Woo, S. K. Lau, Y. Huang and K. Y. Yuen. (2009), “Coronavirus diversity, phylogeny, and interspecies jumping. ,” Experimental Biology and Medicine, vol. 234, no. (10), pp, 1117–1127, . [Google Scholar]
3S. Su, G. Wang, W. Shi, J. Li, A. C. K. Lai et al. (2016). , “Epidemiology, genetic recombination, and pathogenesis of coronaviruses. ,” Trends in Microbiology, vol. 24, no. (6), pp, 490–502, . [Google Scholar]
4D. Forni, R. Cagliari, M. Clerici and M. Sironi. (2017), “Molecular evolution of human coronavirus genomes. ,” Trends in Microbiology, vol. 25, no. (1), pp, 35–48, . [Google Scholar]
5P. C. Masters and S. Perlman. (2013), “Fields of Virology,” in Lippincott Willimas & Wilkins. vol. 2, pp, 825–858, . [Google Scholar]
6N. S. Zhong, B. J. Zheng, Y. M. Li, Z. H. Xie, K. H. Chan et al. (2003). , “Epidemiology and cause of severe acute respiratory syndrome (SARS) in Guangdong, People’s Republic of China. ,” Lancet, vol. 362, no. (9393), pp, 1353–1358, .
7L. L. Ren, Y. Wang, Z. Q. Wu and Z. C. Xiang. (2020), “Identification of a novel coronavirus causing severe pneumonia in human: A descriptive study. ,” Chinese Medical Journal, vol. 133, no. (9), pp, 1015–1024, .
8A. M. Zaki, S. Van Boheemen, T. M. Bestebroer, A. D. Osterhaus and R. A. Fouchier. (2012), “Isolation of a novel coronavirus from a man with pneumonia in Saudi Arabia. ,” New England Journal of Medicine, vol. 367, no. (19), pp, 1814–1820, . [Google Scholar]
9F. Wu, S. Zhao, B. Yu, Y. M. Chen, W.Wang et al. (2020). , “A new coronavirus associated with human respiratory disease in China. ,” Nature, vol. 579, pp, 1–10, . [Google Scholar]
10M. A. M. Abdelaziz, A. I. Ismail, F. A. Abdullah and M. H. Mohd. (2018), “Bifurcation and chaos in a discrete SI epidemic model with fractional order. ,” Advances in Difference Equations, vol. 44, no. (2018), pp, 1–19, . [Google Scholar]
11P. R. S. Rao and M. N. Kumar. (2015), “A dynamical model for infectious diseases: The role of vaccination and treatment. ,” Chaos Soliton and Fractals, vol. 75, no. (2015), pp, 34–49, .
12N. Sene. (2020), “SIR epidemic model with Mittag–Leffler fractional derivative. ,” Chaos Soliton and Fractals, vol. 137, no. (109833), pp, 1–9, .
13X. Liu and D. Xiao. (2007), “Complex dynamic behaviors of a discrete-time predator-prey system. ,” Chaos Solutions, and Fractals, vol. 32, no. (1), pp, 80–94, . [Google Scholar]
14F. Bozkurt, T. Abdeljawad and M. A. Hajji. (2015), “Stability analysis of a fractional-order differential equation model of a brain tumor growth depending on the density. ,” Applied and Computational Mathematics, vol. 14, no. (1), pp, 50–62, . [Google Scholar]
15A. Yousef and F. Bozkurt. (2019), “Bifurcation and stability analysis of a system of fractional-order differential equations for a plant-herbivore model with Allee Effect. ,” Mathematics, vol. 7, no. (5), pp, 1–18, .
16B. Acay, E. Bas and T. Abdeljawad. (2020), “Fractional economic models based on market equilibrium in the frame of different type kernels. ,” Chaos Soliton and Fractals, vol. 130, no. (109438), pp, 1–9, .
17F. Peng, D. L. Zhou, M. Long and X. M. Sun. (2017), “Discrimination of natural images and computer generated graphics based on multi-fractal and regression analysis. ,” AEU-International Journal of Electronics and Communications, vol. 71, pp, 72–81, .
18X. Jiang, M. Coffee, A. Bari, J. Wang and X. Jiang. (2020), “Towards an artificial intelligence framework for data-driven prediction of Coronavirus clinical severity. ,” Computers, Materials & Continua, vol. 63, no. (1), pp, 537–551, .
19S. A. Ebad and M. Ahmed. (2019), “Investigating the effect of software packaging on modular structure stability. ,” Computer Systems Science and Engineering, vol. 34, no. (5), pp, 283–296, .
20A. Atanga. (2020), “Modeling the spread of COVID-19 with new fractal-fractional operators: Can the lockdown save mankind before vaccination?. ,” Chaos Soliton and Fractals, vol. 136, no. (109860), pp, 1–38, . [Google Scholar]
21M. Yavuz and E. Bonyah. (2019), “New approaches to fractional dynamics of schistosomiasis disease model. ,” Physica A: Statistical Mechanics and Its Applications, vol. 525, no. (C), pp, 373–393, . [Google Scholar]
22Y. Wang and T. Li. (2014), “Stability analysis of fractional-order nonlinear systems with delay. ,” Mathematical Problems in Engineering, vol. 2014, no. (301235), pp, 1–8, .
23X. Zang. (2017), “Dynamics of a class of fractional-order non autonomous Lorenz-type systems. ,” Chaos AIP, vol. 27, (041104), pp, 1–7, .
24M. A. Khan, Z. Hammock and D. Baleanu. (2019), “Modeling the dynamics of hepatitis via the Caputo–Fabrizio derivative. ,” Mathematical Modelling of Natural Phenomena, vol. 14, no. (3), pp, 1–19, .
25I. Podlubny. (1999), Fractional Differential Equations. New York: Academic Press, . [Google Scholar]
26A. Khan, T. Abdeljawad, J. F. Gomez-Aguilar and H. Khan. (2020), “Dynamical study of fractional-order mutualism parasitism food web module. ,” Chaos Soliton and Fractals, vol. 134, no. (109685), pp. 1–15, .
27J. Singh, D. Kumar, Z. Hammock and A. Atangana. (2018), “A fractional epidemiological model for computer viruses pertaining to a new fractional derivative. ,” Applied Mathematics, and Computation, vol. 316, pp, 504–515, . [Google Scholar]
28D. Matignon. (1996), “Stability results for fractional differential equations with applications to control processing. ,” Computational Engineering in Systems Applications, vol. 2, (14017755), pp, 1–6, . [Google Scholar]
29P. F. Verhulst. (1838), “Notice Sur la loi que la population pousuit das son accroissement. ,” Correspondance Mathematique Et Physique, vol. 10, no. (1838), pp, 113–121, . [Google Scholar]
30F. Courchamp, L. Berec and J. Gascoigne. (2008), Allee Effects in Ecology and Conservation. Oxford: Oxford University Press, . [Google Scholar]
31A. R. Kanarek and C. T. Webb. (2010), “Allee effects, adaptive evolution, and invasion success. ,” Evolutionary Applications, vol. 3, no. (2), pp, 122–135, .
32W. C. Allee. (1931), Animal Aggregations: A Study in General Sociology. Chicago, IL: University of Chicago Press, .
33M. Sen, M. Banerjee and Y. Takeuchi. (2018), “Influence of Allee effect in prey populations on the dynamics of two prey one predator model. ,” Mathematical Bioscience and Engineering, vol. 15, no. (4), pp, 883–904, .
34G. Q. Sun. (2016), “Mathematical modeling of population dynamics with Allee effect. ,” Nonlinear Dynamics, vol. 85, no. (1), pp, 1–12, . [Google Scholar]
35X. Li, C. Mou, W. Niu and D. Wang. (2011), “Stability analysis for discrete biological models using algebraic methods. ,” Mathematics in Computer Sciences, vol. 5, no. (2011), pp, 247–262, . [Google Scholar]
 | This work is licensed under a Creative Commons Attribution 4.0 International License, which permits unrestricted use, distribution, and reproduction in any medium, provided the original work is properly cited. |