DOI:10.32604/cmc.2020.012261
| Computers, Materials & Continua DOI:10.32604/cmc.2020.012261 | |
| Article |
A New Logarithmic Family of Distributions: Properties and Applications
1Central South University Business School, Changsha, China
2Hunan International Business Vocational College, Changsha, China
3Department of Statistics, Yazd University, Yazd, Iran
*Corresponding Author: Almaspoor Zahra. Email: z.almaspoor@stu.yazd.ac.ir
Received: 22 June 2020; Accepted: 19 September 2020
Abstract: In recent years, there has been an increased interest among the researchers to propose new families of distributions to provide the best fit to lifetime data with monotonic (increasing, decreasing, constant) and non-monotonic (unimodal, modified unimodal, bathtub) hazard functions. We further carry this area of research and propose a new family of lifetime distributions called a new logarithmic family via the T-X family approach. For the proposed family, explicit expressions for some mathematical properties along with the estimation of parameters through Maximum likelihood method are discussed. A sub-model, called a new logarithmic Weibull distribution is taken up. The proposed model is very flexible and can be used to model data with increasing, decreasing, modified unimodal or bathtub shaped hazard rates. The maximum likelihood estimators of the model parameters are obtained. To assess the behavior of the maximum likelihood estimators, a comprehensive Monte Carlo simulation study has been carried out. Finally, the potentiality of the new model is shown via analyzing two real data sets taken from reliability engineering and biomedical fields. The comparison of the proposed model is made with the other well-known competitors such as (i) the three parameters exponentiated Weibull and Marshall–Olkin Weibull distributions and (ii) a four-parameter beta Weibull distribution. The practical applications show that the proposed model performs much better than the competitive models and can be used as a good candidate model to analyze data in engineering, medical sciences and other related fields.
Keywords: Weibull distribution; moments; order statistic; residual life function; maximum likelihood estimation
Speaking broadly, statistical distributions are frequently used for modeling real phenomena in many applied areas including engineering, medical sciences, actuarial, environmental studies, economics, finance, and insurance. Among these distributions, the exponential, Rayleigh and Weibull are some of the most useful models used quite effectively in real-life data modeling. Unfortunately, these distributions have a limited range of capability and thus cannot be applied in all situations to get a better description of the phenomena under consideration. For example, the exponential model is often used for real-life data modeling, but its hazard function is only constant. Whereas, the Rayleigh model is another promising model, but it has an increasing hazard function only. However, the Weibull is a more flexible model offering the features of both the exponential and Rayleigh distributions and additionally offering data modeling with decreasing hazard function. But, the problem with the Weibull model is that it is not capable of modeling data with non-monotonic hazard function.
To provide an adequate fit to data having non-monotonic hazard function, there is a clear need for the generalized versions of these distributions. This fact motivated the researchers to propose new extended distributions. This has been done either introducing the modified versions of the existing models or introducing new families of distributions to obtain flexible model capable of modeling data with non-monotonic hazard function.
In the recent advances in distribution theory, researchers have shown a deep interest in proposing new methods to expand the family of lifetime distributions. This has been done through many different approaches by introducing new generators. Some of the well-known generators include a new generalized class of distributions [1], McDonald-G (Mc-G) family [2], beta Marshal-Olkin family of distributions [3], Kumaraswamy Marshal-Olkin family [4], log-gamma-G family [5], Weibull-G family of distributions [6], the exponentiated half-logistic family [7], Lomax Generator [8], A New Lifetime Exponential-X Family [9], New Extended-F Family [10], A Flexible Reduced Logarithmic-X Family [11], a new extended-family of distributions [12], odd generalized exponential-G family [13], Logistic-X family [14], for further detail; see [15].
In this article, a new family of lifetime distributions called a new logarithmic (NL) family of distributions is introduced by adopting the T-X family approach; see [16]. The new family is defined by the following cumulative distribution function (cdf)

where,  is the cdf of the baseline random variable depending on the vector parameter
  and
and  ,
,  are the additional parameters. The proposed class of distributions can also be obtained by re-parameterizing the complementary exponentiated Kumaraswamy-G-logarithmic class; see [17]. The probability density function (pdf) corresponding to Eq. (1) is given by

The survival function (sf), hazard rate function (hrf) and cumulative hazard rate function (chrf) of the NL family are given, respectively, by


and

The new pdf is most tractable when  and
and  have simple analytical expressions. Henceforth, a random variable X with pdf given by Eq. (2) is denoted by
  . Furthermore, for the sake of simplicity, the dependence on the vector of the parameters is omitted and simply
  will be used. Some key motivations for using the NL family in practice are the following:
•A very simple and convenient method of adding additional parameters to modify the existing distributions.
•To improve the characteristics and flexibility of the existing distributions.
•To introduce the extended version of the baseline distribution having a closed form for cdf, sf as well as hrf.
•To provide better fits than the other modified models.
The rest of this article is organized as follows: In Section 2, a special sub-model of the proposed family is discussed. Some mathematical properties are obtained in Section 3. The maximum likelihood estimates of the model parameters are obtained in Section 4. A Monte Carlo simulation study is conducted in Section 5. Section 6 is devoted to analyzing two real-life applications. Finally, concluding remarks are provided in Section 7.
In this section, we define a special sub-model of the proposed family, called a new logarithmic Weibull (NLW) distribution. Let  be the cdf of the two-parameter Weibull distribution given by
  , where
  . Then, the cdf of the NLW distribution has the following expression

The pdf corresponding to Eq. (3)

The sf and hrf of the NLW distribution are given, respectively, by

and

For  and different values of
  and
and  , plots of the pdf of the NLW distribution are sketched in Fig. 1. For the selected values of the parameters, some possible shapes for the hrf of the NLW model are shown in Fig. 2.
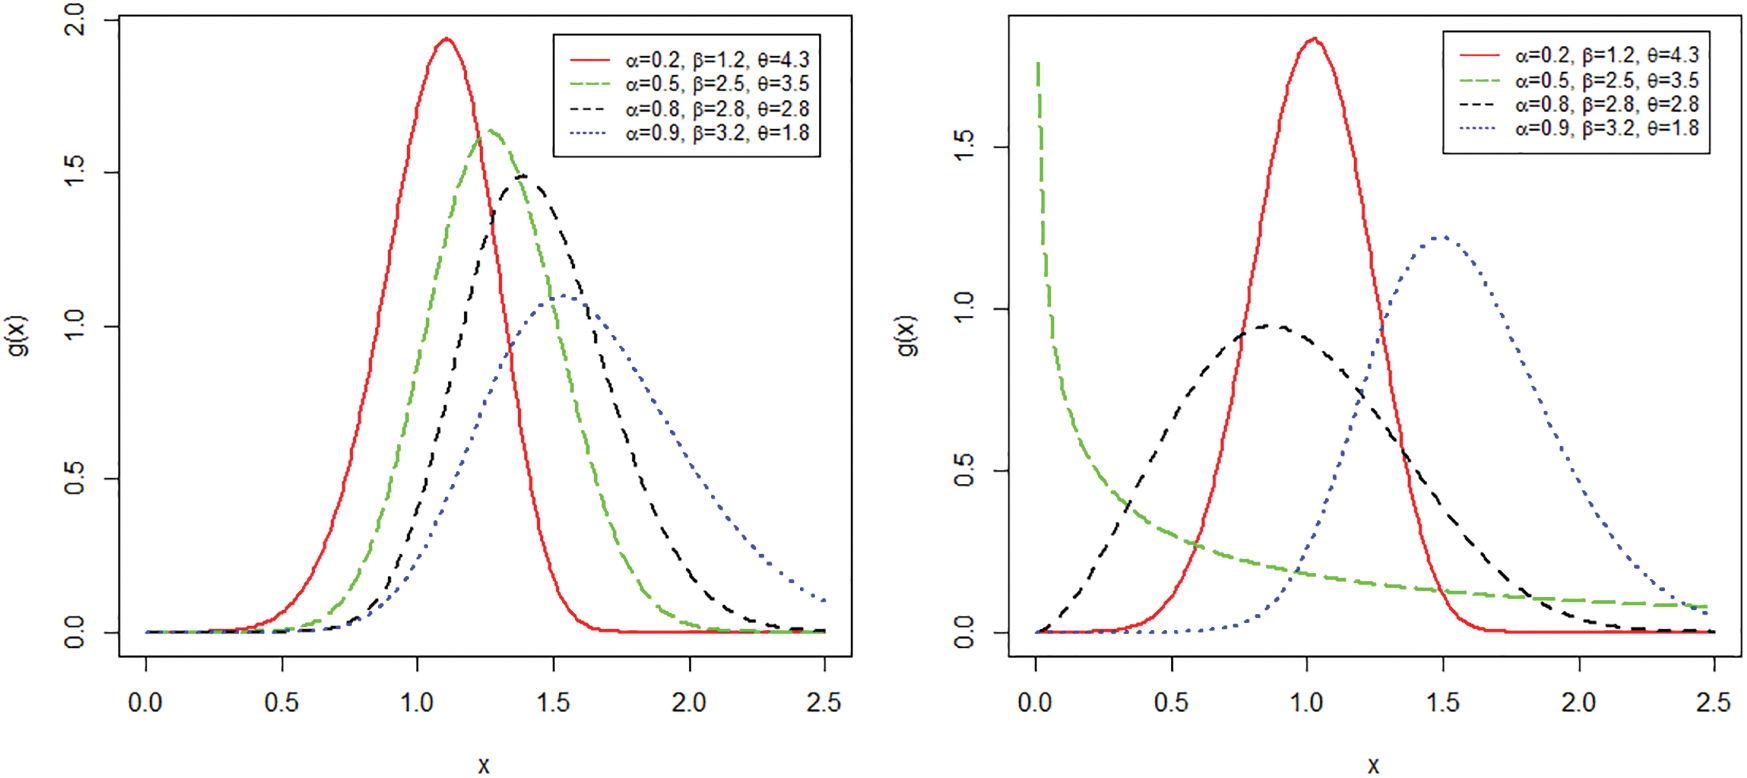
Figure 1: Different plots for the pdf of the NLW distribution
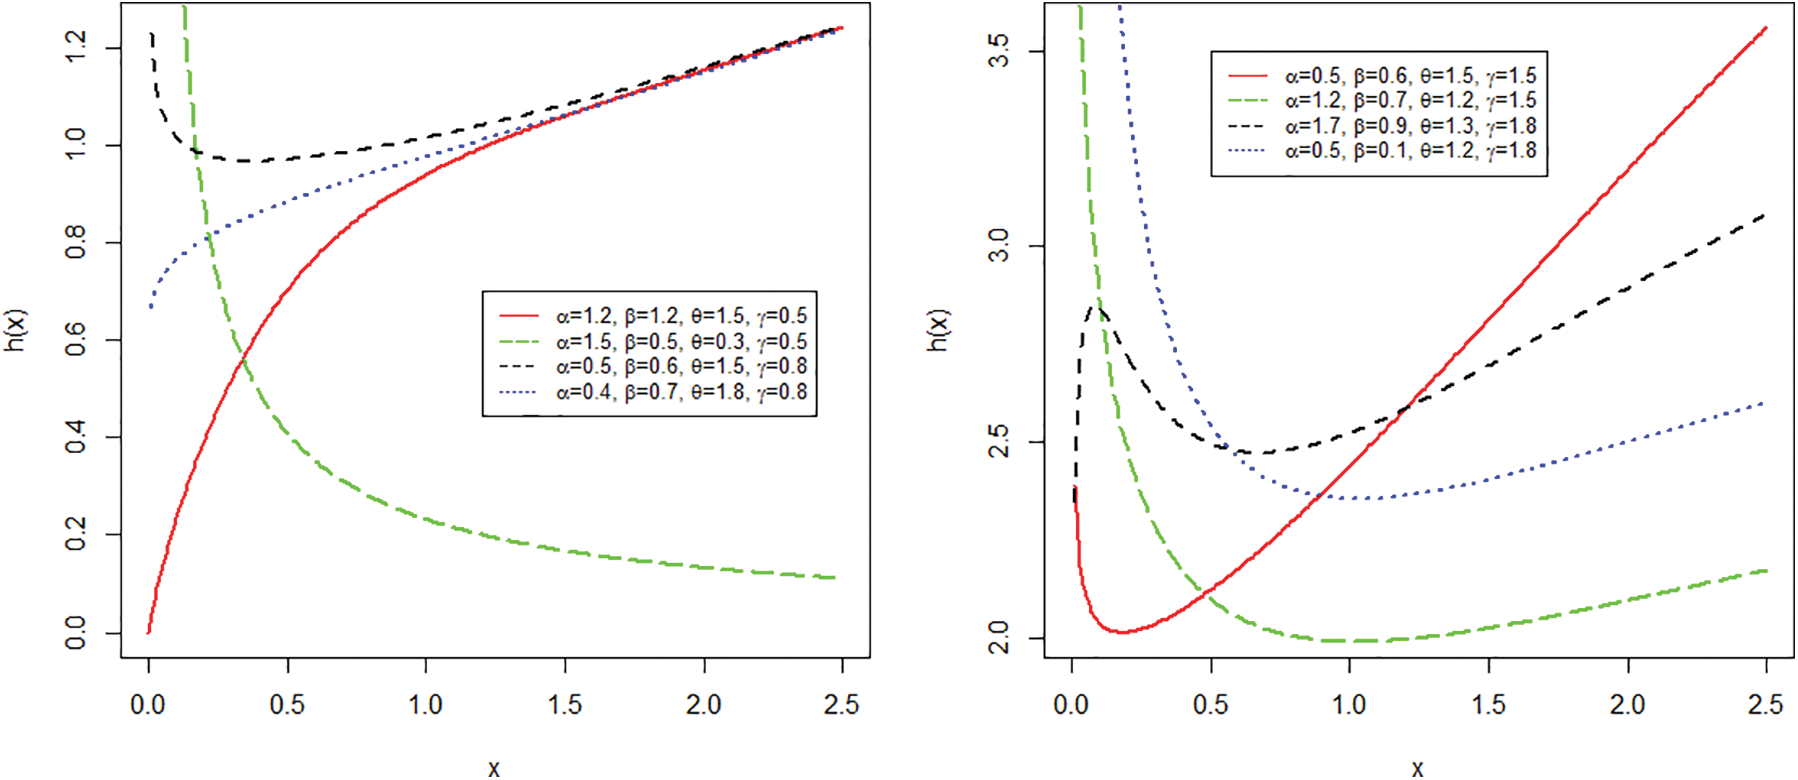
Figure 2: Different plots for the hrf of the NLW distribution
3 Basic Mathematical Properties
In this section, some statistical properties of the proposed family are derived.
Let X be the NL random variable with pdf given by the Eq. (2), the quantile function of X, say Q(u) is given by

where, u has the uniform distribution on the interval (0,1) and G−1(.) is the inverse function of G(.). From Eq. (5), it is clear that the proposed family has a closed form solution of its quantile function which makes it easier to generate random numbers.
Moments are very important and play an essential role in statistical analysis, especially in the applications. It helps to capture the important features and characteristics of the distribution (e.g., central tendency, dispersion, skewness and kurtosis). The rth moment of the NL family of distributions is given by

where,

Furthermore, a general expression for moment generating function (mgf) of the NL random variable X is

3.3 Residual and Reverse Residual Life
The residual life offers wider applications in reliability theory and risk management. The residual lifetime of X denoted by  is derived as


Additionally, the reverse residual life of the NL random variable denoted by  is
is


Order statistics are among the essential tools in inferential and non-parametric statistics. The applications of these statistics appear in the study of reliability and life testing. Let  be a random sample of size k taken independently from the NL distribution with parameters
  and
and  . Let
. Let  be the corresponding order statistics. Then, the density of
  for (r = 1, 2, , k) is given by

4 Maximum Likelihood Estimation
In this section, the estimation of the unknown parameters of the NL family via the method of maximum likelihood is discussed. Let  be a random sample from NL family with parameters
  . The log-likelihood function of this sample is

Obtaining the partial derivatives of Eq. (11), one may get


Setting  and
and  equal to zero and solving numerically these expressions simultaneously, yields the maximum likelihood estimates of
5 Monte Carlo Simulation Study
In order to assess the performances of the maximum likelihood parameters of the proposed distribution, a small simulation study is carried out. The process is carried out as follows: The number of Monte Carlo replications was made 1000 times each with sample size n = 30, 50 and 100. The initial values for the parameters are selected as given in Tabs. 1 and 2. Formulas used for calculating Bias and MSE are given by  and
and  , respectively. Step (iii) is also repeated for the other parameters
Table 1: The parameter estimation from the NLW distribution using MLE

Table 2: The parameter estimation from the NLW distribution using MLE
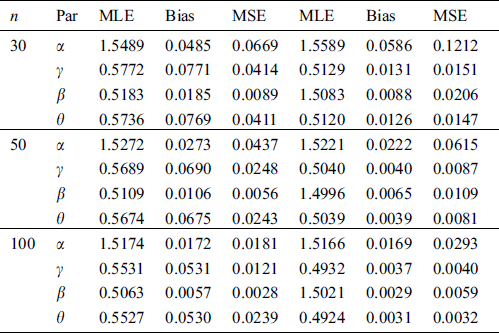
The empirical results are given in Tabs. 1 and 2.
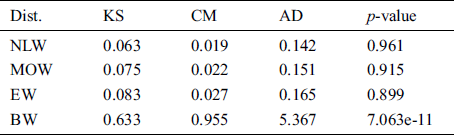
In this section, we provide two applications of the proposed model to the real data sets. We compare the fits of the proposed distribution to those of the three-parameter exponentiated Weibull (EW) Marshall-Olkin Weibull (MOW) and beta Weibull (BW) distributions. The goodness-of-fit measures such as Anderson-Darling (AD), Cramer–von Mises (CM), Kolmogorov-Smirnov (KS) statistic and the corresponding p-value are considered to compare the proposed method with the fitted models. In general, a model with smaller values of these analytical measures and high p-value indicates better fit to the data. All the required computations have been carried out in the R-language using “BFGS” algorithm.
Data 1: The first data set representing the remission times (in months) of a random sample of 128 bladder cancer patients. Corresponding to data 1, the maximum likelihood estimates of the fitted models are provided in Tab. 3. While, the goodness of fit measures is given in Tab. 4.
Table 3: Maximum likelihood estimates of the fitted distributions using data 1
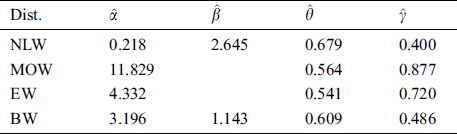
Table 4: The statistics of the fitted models using data 1
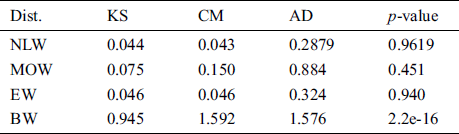
From the results given in Tab. 4, it is clear that the proposed model provides the best fit to the data. Furthermore, for data 1, the estimated pdf and cdf are sketched in Fig. 3, while the Kaplan-Meier survival and pp-plots are provided in Fig. 4. These figures show that the proposed model fit the data very closely.
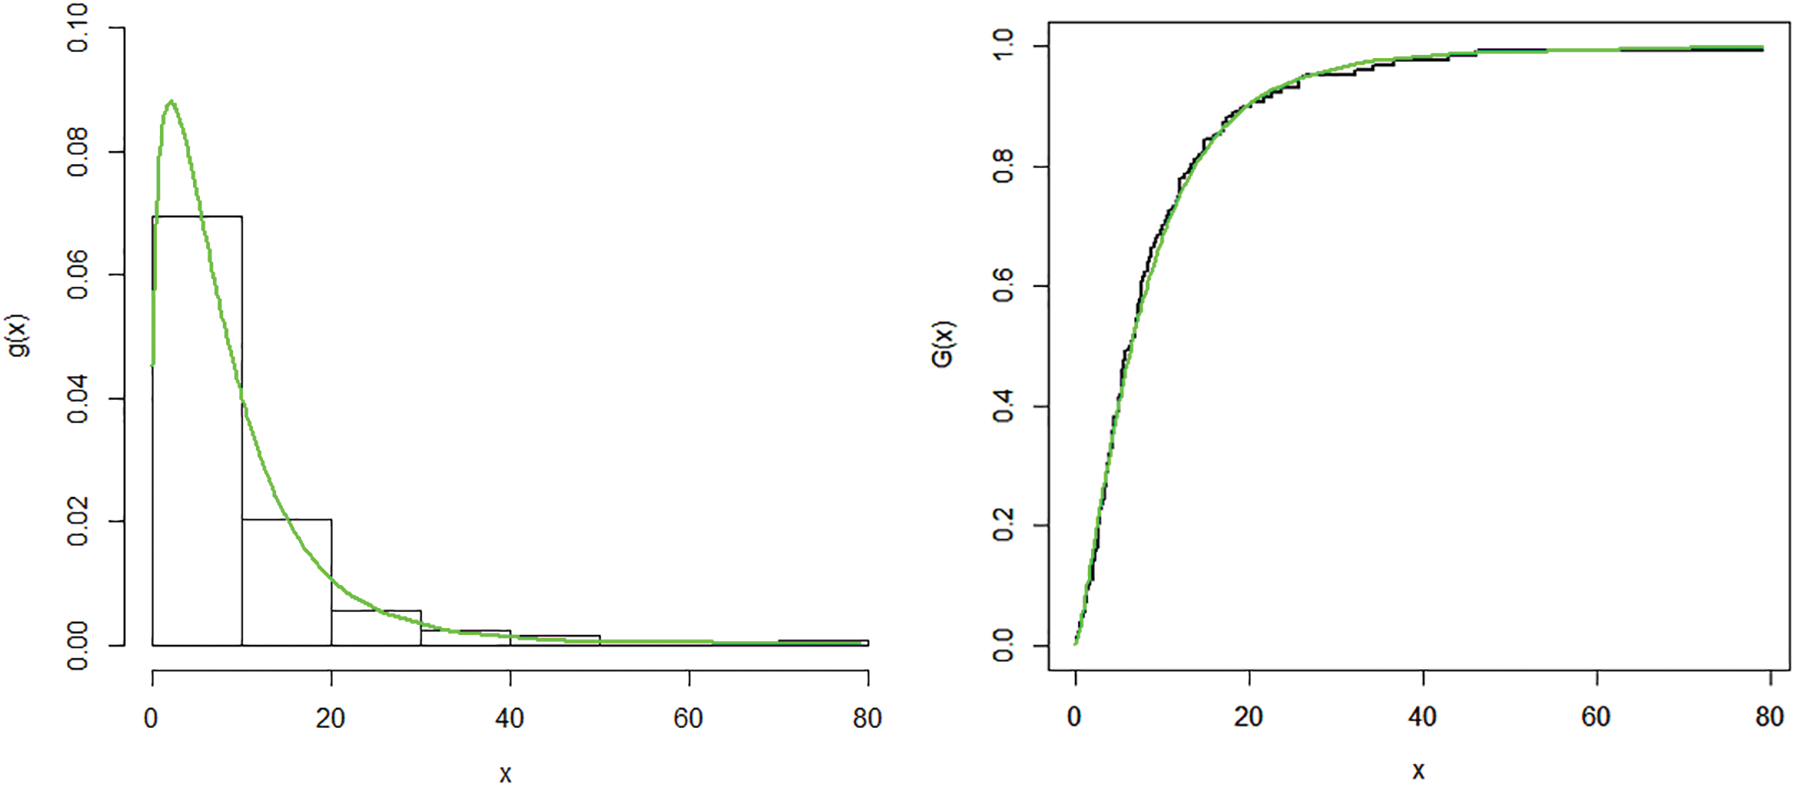
Figure 3: Plots of the estimated pdf and cdf of the NLW distribution for data 1
Figure 4: PP and Kaplan-Meir survival plots of the NLW distribution for data 1
Data 2: The second data set representing the time between failures for 30 repairable items. The maximum likelihood estimates and the considered statistics are provided in Tabs. 5 and 6, respectively. Corresponding to data 2, the estimated pdf and cdf of the proposed model are plotted in Fig. 5, while, the Kaplan-Meier survival and pp-plots are presented in Fig. 6. These figures show how the proposed model fit the data closely.
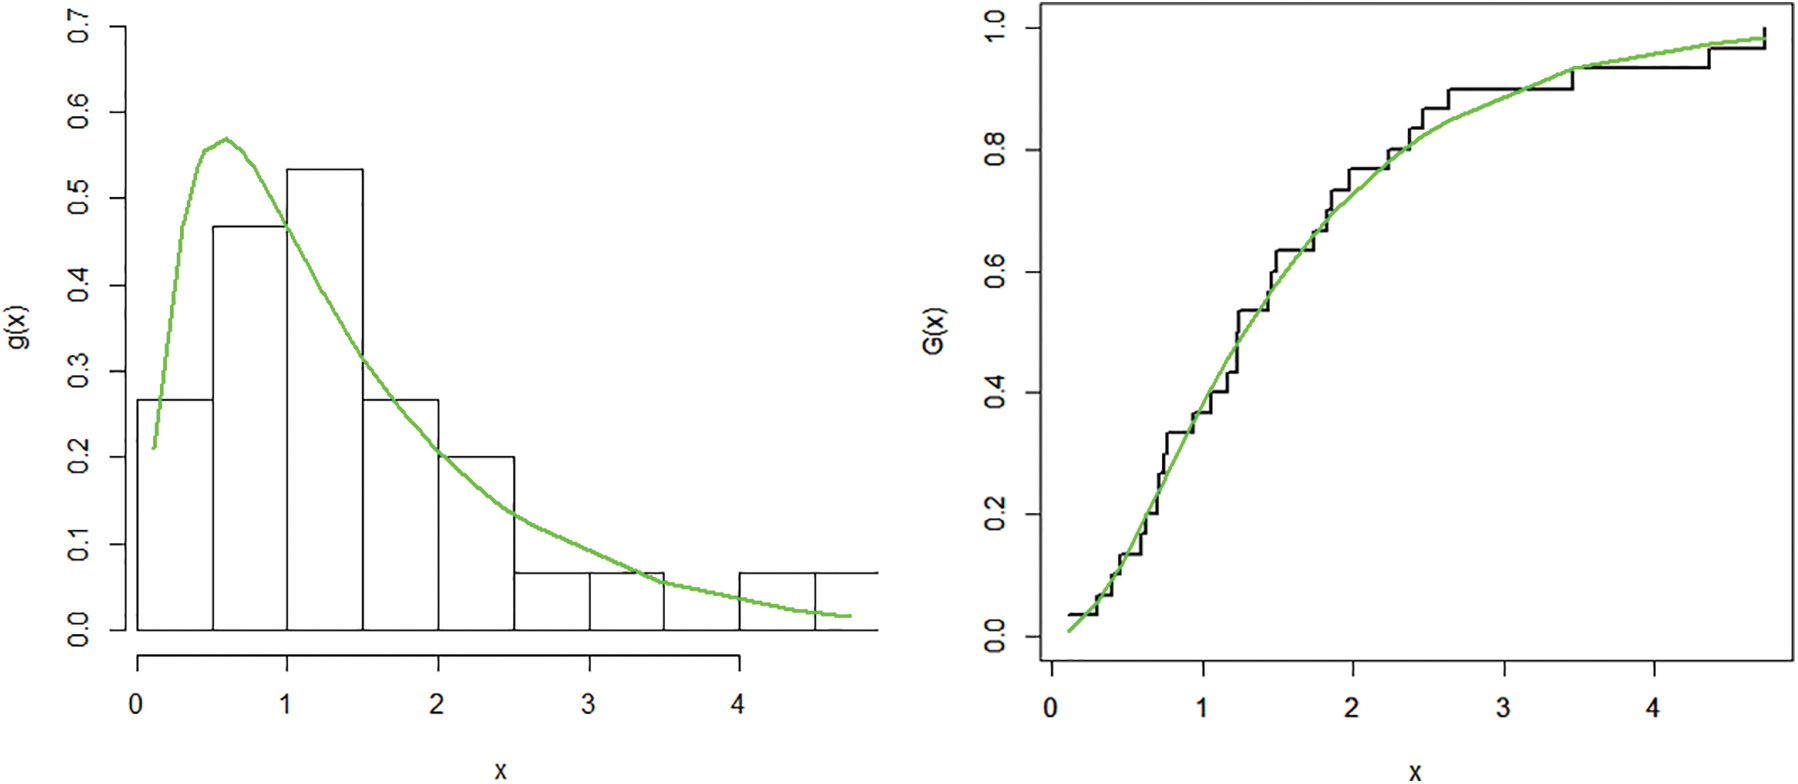
Figure 5: Plots of the estimated pdf and cdf of the NLW distribution corresponding to data 2
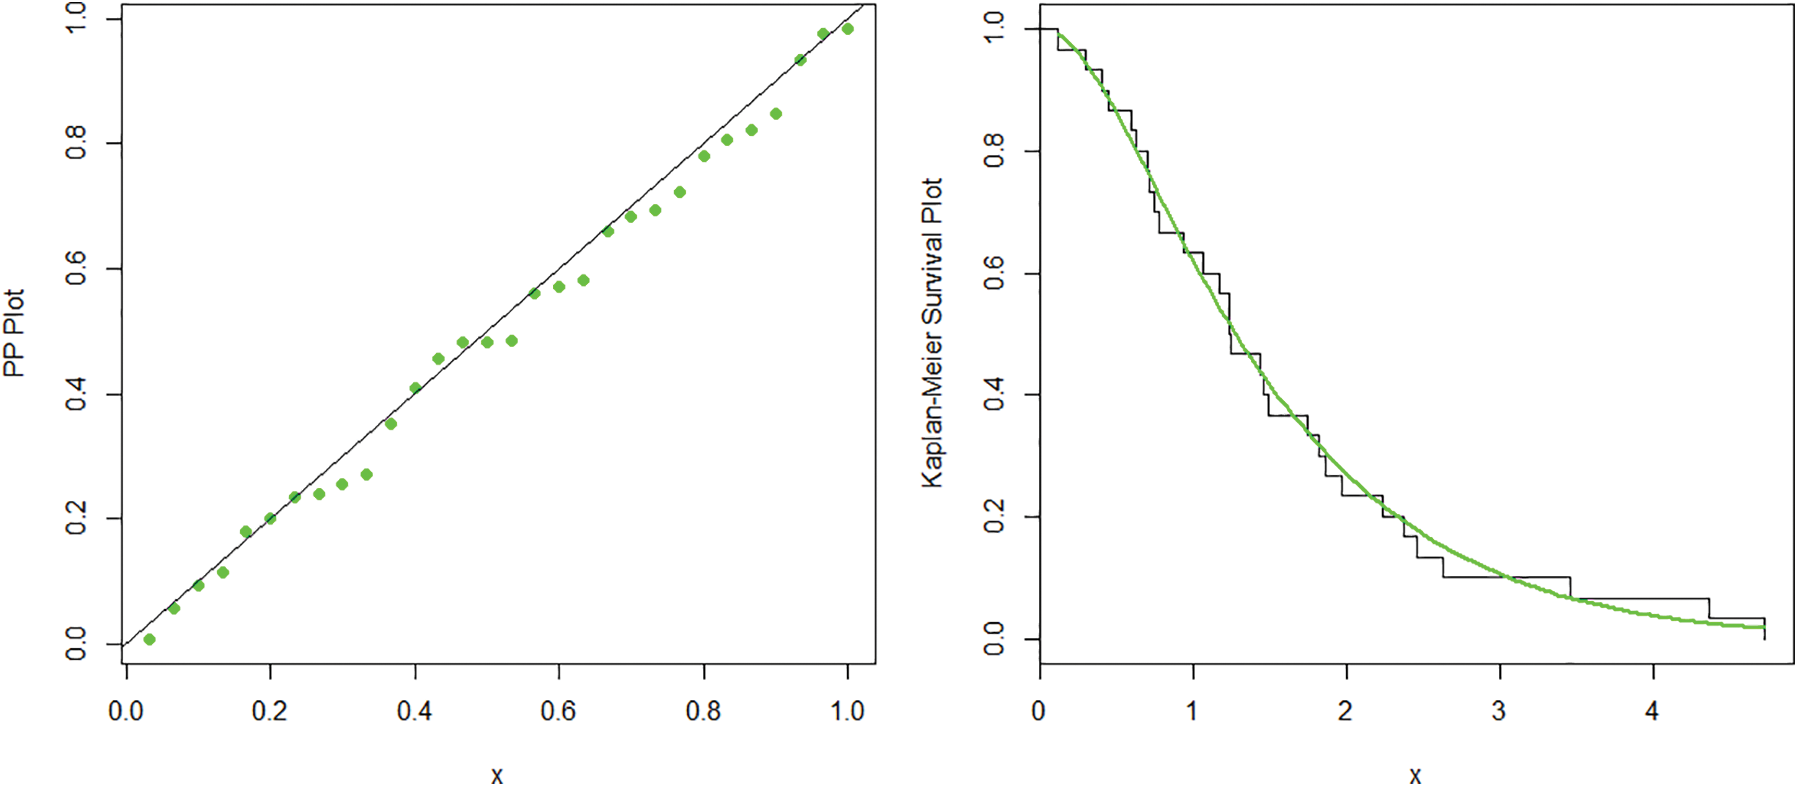
Figure 6: PP and Kaplan-Meir survival plots of the NLW distribution corresponding to data 2
Table 5: The maximum likelihood estimates of the fitted distributions using data 2
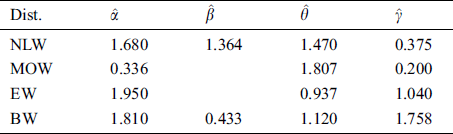
Table 6: The statistical measures of the fitted models using data 2
In this article, a new method is adopted to extend the existing distributions. This effort leads to a new family of lifetime distributions, called a new logarithmic family of distributions. General expressions for some of the mathematical properties of the new family are investigated. Maximum likelihood estimates are also obtained. There are certain advantages of using the proposed method like its cdf has a closed form solution and facilitating data modeling with monotonic and non-monotonic failure rates. A special sub-model of the new family, called a new logarithmic Weibull distribution is considered and two real applications are analyzed. In simulation study, the consistency and proficiency of the maximum likelihood estimators of the proposed model are also illustrated. The practical applications of the proposed model reveal better fits to real-life data than the other well-known competitors. It is hoped that the proposed method will attract wider applications in reliability engineering and biomedical sciences.
Funding Statement: The first and second authors acknowledge the Research on the Demand Side and Supply Side Demand Mechanism of Overcapacity Capacity of China's Machinery Manufacturing Industry in the “One Belt and One Road” Strategy, 16BJY079.
Conflicts of Interest: The authors declare that they have no conflicts of interest to report regarding the present study.
References
1. Z. Ahmad. (2020). “A new generalized class of distributions: Properties and estimation based on type-I censored samples,” Annals of Data Science, vol. 7, no. 2, pp. 243–256.
2. C. Alexander, G. M. Cordeiro, E. M. M. Ortega and J. M. Sarabia. (2012). “Generalized beta generated distributions,” Computational Statistics and Data Analysis, vol. 56, no. 6, pp. 1880–1897.
3. M. Alizadeh, G. M. Cordeiro, E. de Brito and C. G. B. Demétrio. (2015). “The beta Marshall-Olkin family of distributions,” Journal of Statistical Distributions and Applications, vol. 2, no. 1, pp. 1880.
4. M. Alizadeh, M. H. Tahir, G. M. Cordeiro, M. Mansoor, M. Zubair et al. (2015). , “The Kumaraswamy Marshal-Olkin family of distributions,” Journal of the Egyptian Mathematical Society, vol. 23, no. 3, pp. 546–557.
5. M. Amini, S. M. T. K. MirMostafaee and J. Ahmadi. (2013). “Log-gamma-generated families of distributions,” Statistics, vol. 48, no. 4, pp. 913–932.
6. M. Bourguignon, R. B. Silva and G. M. Cordeiro. (2014). “The Weibull-G family of probability distributions,” Journal of Data Science, vol. 12, no. 1, pp. 53–68.
7. G. M. Cordeiro, E. M. Ortega and D. C. da Cunha. (2013). “The exponentiated generalized class of distributions,” Journal of Data Science, vol. 11, no. 1, pp. 1–27.
8. G. M. Cordeiro, E. M. Ortega, B. V. Popović and R. R. Pescim. (2014). “The Lomax generator of distributions: Properties, minification process and regression model,” Applied Mathematics and Computation, vol. 247, pp. 465–486.
9. X. Huo, S. K. Khosa, Z. Ahmad, Z. Almaspoor, M. Ilyas et al. (2020). , “A new lifetime exponential-X family of distributions with applications to reliability data,” Mathematical Problems in Engineering, vol. 2020, pp. 1–16.
10. S. K. Khosa, Z. Afify, Z. Ahmad, M. Zichuan, S. Hussain et al. (2020). , “A new extended-F family: Properties and applications to lifetime data,” Journal of Mathematics, vol. 2020, pp. 1–9.
11. Y. Liu, M. Ilyas, S. K. Khosa, E. Mahmoudi, Z. Ahmad et al. (2020). , “A flexible reduced logarithmic-X family of distributions with biomedical analysis,” Computational and Mathematical Methods in Medicine, vol. 2020, no. 3, pp. 1–15.
12. M. Zichuan, S. Hussain, A. Iftikhar, M. Ilyas, Z. Ahmad et al. (2020). , “A new extended-X family of distributions: Properties and applications,” Computational and Mathematical Methods in Medicine, vol. 2020, pp. 1–13.
13. M. H. Tahir, G. M. Cordeiro, M. Alizadeh, M. Mansoor, M. Zubair et al. (2015). , “The odd generalized exponential family of distributions with applications,” Journal of Statistical Distributions and Applications, vol. 2, no. 1, pp. 1880.
14. M. H. Tahir, G. M. Cordeiro, M. Alizadeh, M. Mansoor and M. Zubair. (2016). “The logistic-X family of distributions and its applications,” Communications in Statistics—Theory and Methods, vol. 45, no. 24, pp. 7326–7349.
15. Z. Ahmad, G. G. Hamedani and N. S. Butt. (2019). “Recent developments in distribution theory: A brief survey and some new generalized classes of distributions,” Pakistan Journal of Statistics and Operation Research, vol. 15, no. 1, pp. 87–110.
16. A. Alzaatreh, C. Lee and F. Famoye. (2013). “A new method for generating families of continuous distributions,” METRON, vol. 71, no. 1, pp. 63–79.
17. M. H. Tahir and G. M. Cordeiro. (2016). “Compounding of distributions: A survey and new generalized classes,” Journal of Statistical Distributions and Applications, vol. 3, no. 1, pp. 37.
 | This work is licensed under a Creative Commons Attribution 4.0 International License, which permits unrestricted use, distribution, and reproduction in any medium, provided the original work is properly cited. |