DOI:10.32604/cmc.2020.011829
| Computers, Materials & Continua DOI:10.32604/cmc.2020.011829 | |
| Article |
A New Mixed Clustering-Based Method to Analyze the Gait of Children with Cerebral Palsy
1Department of Rehabilitation Medicine, Children’s Hospital of Nanjing Medical University, Nanjing, 210008, China
2Liaoning Children’s Hospital, Shenyang, 110085, China
3Shenyang Jing’an Mental Health Hospital, Shenyang, 110163, China
4Department of Physics and Astronomy, University College London, London, 0044, UK
*Corresponding Author: Jie Li. Email: Lijieetyyhlxk@163.com
Received: 31 May 2020; Accepted: 15 September 2020
Abstract: Cerebral palsy is a group of persistent central movement and postural developmental disorders, and restricted activity syndromes. This syndrome is caused by non-progressive brain damage to the developing fetus or infants. Cerebral palsy assessment can determine whether the brain is behind or abnormal. If it exists, early intervention and rehabilitation can be carried out as soon as possible to restore brain function to the greatest extent. The direct external manifestation of cerebral palsy is abnormal gait. Accurately determining the muscle strength-related reasons that cause this abnormal gait is the primary problem for treatment. In this paper, clustering methods were used to compare and analyze the differences between the abnormal and normal gait parameters of children with and without cerebral palsy. Since the collected data contains overlapping data that may be mutated, while the centroids are also different, the expected result is stratified. To solve this problem, a mixed clustering method is proposed that combines the advantages of K-means and hierarchical clustering, meaning that each set of data shows a similar trend to specific parameters. Experiment results show that this method can detect cerebral palsy through the difference between the abnormal gait of children with cerebral palsy and that of normal children.
Keywords: Cerebral palys; gait analysis; children; mixed clustering
Cerebral palsy refers to a syndrome caused by non-progressive brain damage and developmental defects from the beginning of conception to infancy, which manifests primarily in the form of dyskinesia and abnormal posture. Seventy per cent of those with the syndrome are children with spastic cerebral palsy, which brings a heavy burden to their families and society. Accordingly, the question of how to improve these children’s symptoms, enhance their quality of life, and reduce the burden on families and society is an important research topic [1,2].
Due to the abnormal muscle strength and muscle tension, the appearance of pathological reflexes, the persistence of primitive reflexes and the presence of secondary contractures and deformities, children with cerebral palsy often exhibit a specific pathological gait (“scissors gait” and “dance gait”) while walking, leading to walking dysfunction, which has an adverse impact on their walking during their lifetime. Gait analysis plays a highly important role in the clinical diagnosis and rehabilitation treatment of children with cerebral palsy [3,4]. Through gait analysis, the key joints and muscles involved in dyskinesia can be determined, the relationship between walking disorders and the movement of the trunk and upper limbs can be understood, and the potential influence of walking aids on gait can also be determined. Such analysis thus provides a theoretical basis for clinical diagnosis, treatment, and the production of orthopedic rehabilitation braces [5–7].
Different gait performance in children with cerebral palsy is caused by differences in muscle strength and compensatory effects after disease. Under the premise of not considering the compensatory effect in a short time after disease, accurately determining the cause of the muscle strength differences that lead to abnormal gait is the premise of solving the problem. While preoperative experimentation would be a better solution, many experiments in medicine cannot be conducted directly on the human body. This has led to the study of corresponding mechanical model simulation experiments: That is, establishing a model similar to the research object or process, then indirectly studying the object or process through model simulation [8–10]. The dynamic simulation analysis of walking movement, with the help of an optical capture system, is conducted through inverse analysis of the kinematics data of each part in order to calculate the muscle group contraction mode, after which the forward dynamics analysis method is used to calculate the abnormal muscle strength [11]. This method can not only analyze the relationship between gait characteristics and muscle strength changes, but can also be used to explore the effect of muscle strength changes on gait changes, as well as analyze the influence of muscle strength adjustment and elevation on gait performance; thus, it represents a good preoperative virtual experiment program [12–14].
Compared with traditional gait analysis, dynamic simulation analysis has a number of advantages in the field of biomechanics [15–17]. Firstly, high data utilization not only pays attention to gait data and joint movement, but also enables the movement of each part to be analyzed through the model. Secondly, the simulation calculations of the model can be used to accurately calculate parameters such as joint force and muscle strength during walking. Thirdly, this form of gait research enables the reasons for gait abnormality to be identified, and also facilitates analysis of gait improvement after adjustment of muscle strength to determine the reasons behind it. Moreover, the analysis method is efficient and its overall credibility is high.
Accordingly, this paper will use the clustering method to study the causes of abnormal muscle strength leading to hemiplegic gait and analyze the influence of abnormal muscle strength adjustment on the gait characteristics of children with cerebral palsy. Moreover, this paper comprehensively analyzes the differences between the parameters of abnormal gait and normal gait of children with cerebral palsy, studies the abnormal gait movement and dynamic performance, and explores the relationship between abnormal gait muscle strength and gait characteristics.
Clustering methods have been gradually developed alongside developments in the fields of statistics, computer science and artificial intelligence. One of the key advantages of clustering methods compared to other machine learning methods is their ability to group processes simply and quickly [18–20]. Generally speaking, clustering algorithms can be classified into partition-based, density-based, grid-based and constraint-based methods. In the current era of big data, the increasing amount of data and the growing diversity of data forms has led to the clustering algorithm being more widely used. At the same time, these developments have resulted in higher requirements for the clustering algorithm itself [21].
Using the threshold value of 1012 bytes of effective data, clustering algorithms can be divided into two categories: namely, small data clustering and big data clustering. Small data clustering mainly embodies the basic concept behind the clustering algorithm, while big data clustering embodies the concept along with the architecture and other aspects. Moreover, in terms of the specific implementation algorithm of the bottom layer of clustering, there is no essential difference between the two; in other words, the specific algorithm used to implement big data clustering still uses small data clustering technology.
The traditional algorithms based on partition, density and grid can be classified as partition-based clustering methods. According to the differences in data objects and their clustering forms, the small data clustering algorithms can be divided into traditional and intelligent clustering methods. Traditional clustering methods can in turn be sub-divided into two categories: partition clustering and hierarchical clustering [22]. For their part, intelligent clustering methods can be sub-divided into five categories: artificial neural network clustering, kernel-based clustering, sequential data clustering, complex network clustering and intelligent search clustering. Finally, big data clustering methods can be divided into three categories: parallel clustering, distributed clustering and high-dimensional clustering.
The K-means algorithm is a kind of unsupervised learning method, as well as a clustering algorithm based on division. Generally speaking, Euclidean distance is used as an index to measure the similarity between data objects, where this distance and similarity are inversely proportional [23,24]. The core idea behind the K-means algorithm involves randomly selecting k initial clustering centers  (1 ≤ i ≤ k) from the dataset. The Euclidean distance between the remaining data objects and the cluster center
  is then calculated and the cluster center nearest to the target data object is identified, after which the data object is assigned to the cluster corresponding to the cluster center [25,26]. In the next step, the average value of the data objects in each cluster is calculated as the new cluster center. This process is repeated iteratively until the cluster center no longer changes or the maximum number of iterations is reached. For its part, hierarchical clustering is a kind of clustering algorithm with a tree structure; as the name suggests, it decomposes the clustering data hierarchically. Depending on the decomposition method used, these algorithms can be divided into two categories, i.e., agglomerative hierarchical clustering algorithms and split hierarchical clustering algorithms [27].
Following the introduction of the support vector machine, kernel-based methods have become increasingly important in the machine learning and pattern recognition fields [28,29]. The kernel clustering method maps sample points from input space to high-dimensional space through kernel function. This type of non-linear mapping can make the non-linear separable data set become linearly separable in the high-dimensional feature space. Accordingly, the linear method is used to conduct clustering in the high-dimensional space, which greatly improves both the performance and scalability of non-linear clustering [30,31]. As the complexity of this kernel clustering method is very high, it is necessary to use Mecer theory to transform the kernel.
Deep learning is also a kind of artificial neural network. As the field of deep learning has rapidly developed, research into artificial neural networks has also reached a higher level. There are three basic conditions that must be met for an artificial neural network clustering method to be implemented [32–34]. Firstly, in order to ensure that each input sample has different outputs in the network to the greatest extent possible, each unit must be the same except for some randomly distributed parameters. Secondly, each element must have limited strength. Thirdly, there must be some competitive mechanisms among elements. After the network model has been built, the artificial neural network learns the knowledge from the input data, then uses this to adjust the weight vector and the threshold value of the neuron until the output error of the network reaches the expected end of the training [35].
2.2 Gait Analysis of Children with Cerebral Palsy
At present, there is a large body of research focusing on the gait analysis of adults with hemiplegia after stroke, and comparatively less focusing on children with cerebral palsy. In China, a three-dimensional gait analysis system is used to quantitatively analyze the three-dimensional kinematics of hemiplegia gait. Gait performance is evaluated by analyzing differences in lower limb joint mobility and gait time parameters. The researchers of reference 20 analyzed the difference between hemiplegic and normal gaits with reference to the front and rear tilt of the pelvis, lateral movement of the body’s center of gravity and vertical movement range. The authors of reference 21 evaluated the changes in lower limb joint motion among hemiplegic patients by comparing the differences between hemiplegic gait and normal gait in the sagittal, horizontal and coronal planes [36].
In terms of the muscle strength diagnosis of hemiplegic gait, taking advantage of the introduction of clinical electromyography (EMG), the authors of reference 22 used surface electromyography (SEMG) to investigate changes in the tibialis anterior and posterior muscle groups during free walking for hemiplegic and normal gaits. These authors determined that the main causes of hemiplegic gait were abnormal muscle tone and motor control caused by central lesions. In the experiment, the gastrocnemius and tibialis anterior muscles on the side affected by hemiplegia exhibited a synchronous contraction mode. The gastrocnemius on the affected side was overactive, while the electromyographic activity of the tibialis anterior muscle was decreased. This study laid the foundation for the use of SEMG in clinical gait muscle force diagnosis. Furthermore, the authors of reference 23 collected gait data by using the three-dimensional capture system to establish a gait model of hemiplegia for simulation analysis, then compared and analyzed the changes in joint angle and muscle strength before and during electrical stimulation [37–40].
The effectiveness of a multi-channel electrical stimulator for hemiplegia gait rehabilitation was verified by the improvements in joint mobility and muscle strength observed during electrical stimulation. These results also qualitatively proved the correlation between the improvement of muscle strength and gait improvement.
In hemiplegic gait rehabilitation research, the researchers in reference 24 investigated the strength of muscle spasm after stroke, on the basis of normal gait. The method used involved adjusting the muscle length and speed of feedback, with the forward dynamics simulation showing a strength increase after the change of the gait characteristics. The results reveal that when the gastrocnemius, soleus muscle, and rectus femoris muscle are overexcited, the muscle length and feedback speed increase, leading to a hemiplegic gait. The researchers in reference 25 further studied the rehabilitation training of hemiplegic gait patients and determined that the ankle joint flexor muscle plays a vital role in hemiplegic rehabilitation training. By means of treadmill fast walking and fast functional electrical stimulation training for patients with mild paralysis, the activation degree of the metatarsal flexors was changed or the muscle strength of metatarsal flexors increased in order to verify the correlation between the parameters of clinical gait movement and the muscle strength simulation results [41–44].
When conducting a comparative analysis of the gait of children with cerebral palsy, a method that can analyze the difference mutation is needed, as this will allow doctors to adjust the treatment measures more quickly. In this section, we propose a new mixed clustering method to analyze the abnormal gait of children with cerebral palsy; this approach combines multiple clustering methods, specifically K-means and hierarchical clustering.
Firstly, the partition clustering algorithm is utilized to create an initial partition for a particular dataset. An iterative relocation algorithm is then used to improve the clustering by moving the samples between categories. Finally, the clustering criterion is applied to end the movement and determine the quality of the results. In general, the criterion applied is the following square error criterion:
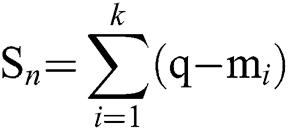
where  represents the square error,
  denotes the sample points, and
  refers to the average value of each cluster. We cluster the collected data based on the above model, then find the similarity value of each sequence relative to the abnormal gait of children with cerebral palsy. The present study focuses on the differences in gait between normal children and those with cerebral palsy. Moreover, when analyzing the abnormal gait of children with cerebral palsy, time is also an important feature; therefore, time is used as the basis of the x-axis in the present paper. The value of the x-axis is the distance between the two.
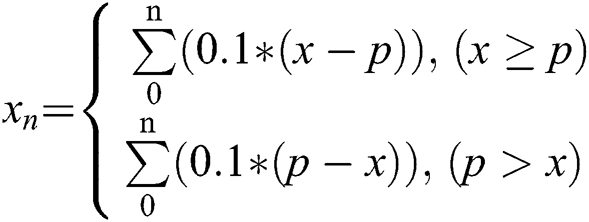
In Eqs. (1) and (2),  is the value of the time distance. By calculating
  minus
minus  and then multiplying it by 0.1,
  can be obtained (all values are multiplied by 0.1 to normalize the data, which makes the clustering results more accurate). We edit the distance using a similar function and subsequently obtain the shortest distance. The similarity method is utilized in Eq. (3).
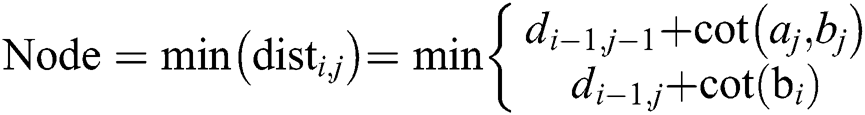
when  , the distance between
  and
and  is 0. If
  , we utilize the equation in the second line; i.e., we insert, delete, and replace them as needed, then compare the results. Thus, each change adds a distance unit between
  and
and  .
.
The data series collected from the children with cerebral palsy were compared with the gait of normal children to calculate the approximate value. The data analysis process used to find the similarity values is of an unstructured type. During the data analysis, sequence cutting is not based on a single circle of spirals but is instead based on the length of time. Therefore, the loop process used is also based on the size of the indeterminate loop in the unstructured pattern.
The clustering process is as follows. First, the data sequence is separated from the database and then clustered by the clustering method. The input data is divided into two types, namely the cerebral palsy  data and isolated normal children
  data. Once the data is entered, the system will determine that the data sequence is considered to be the minimum
 value.
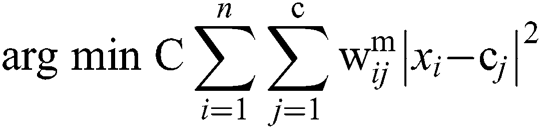
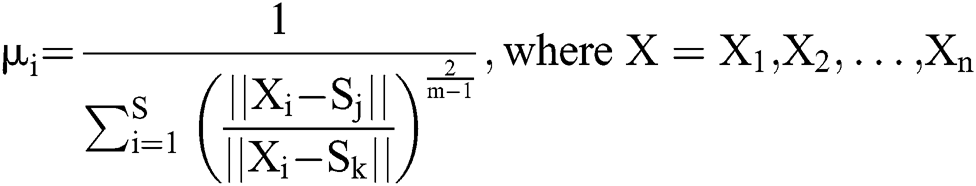
The K-means method and fuzzy clustering method are combined, as in Eqs. (4–6). Here,  represents the x value of all nodes
  ,
,  denotes the number of clusters, and
  is the number of nodes
  . Each
  is a constant variable. Moreover,
  is used to find the degree of difference, while
  is used to maximize the square of the deviation. The functions of these variables are similar; therefore, the
  can be combined with the
  variable.

A common method used to select the initial class center can be described as follows. The clustering algorithm is used many times. Each time it is used, a group of different random initial cluster centers is selected, after which the optimal cluster results are selected from the cluster result set. The initial cluster center corresponding to the cluster results is considered to be the optimal initial cluster center.
In this paper, however, clustering centers are initialized based on the peak clustering method. The basic idea is to find the points with higher sample density and identify them as the clustering center by constructing a density function, then realize the clustering of samples by calculating the distance between the samples and the clustering center. The first step of the algorithm involves constructing a grid in data space. The grid density is closely related to the accuracy and speed of clustering: Specifically, the more finely the grid is divided, the larger the candidate set of the cluster center is, the more computation is needed, and the slower the clustering process. The second step is to construct the peak function, which is the core of the peak clustering algorithm. Through the peak function, the denser points in the data space can be calculated. In general, the Gauss density function is used as a peak function:
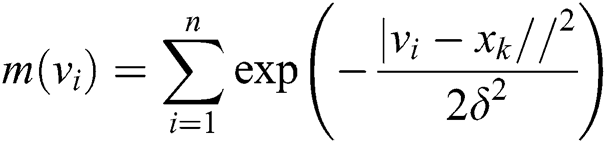
in which  is a constant. When the data around the candidate center
  increases, the peak height of the point is higher, while the probability of the point being selected as the cluster center is also higher. By calculating the peak function, the distribution map of the peak function can be obtained. The cluster center will be selected in the third step. Firstly, the point with the largest peak function is selected as the first cluster center from the candidate set of cluster centers, after which the next cluster center is found by successively removing the points with the largest peak function and the points around these points. Moreover, it can be seen from the process of peak clustering that the clustering centers of the peak clustering results are distributed in the areas with the highest sample density, while the number of clusters does not need to be specified in advance.
4 Mixed Clustering for Analyzing Abnormal Gait in Children with Cerebral Palsy
Reasonable gait division is especially important to gait analysis. Regarding gait division, when considered broadly, the whole gait cycle can be divided into two parts—namely, the support phase and the swing phase—the support of the research side. From a more fine-grained perspective, reference can be made to Wang Jinsong and the California RLA gait division method, which performs gait cycle division using gait joint position and contact time. In conjunction with the need for a phased analysis of walking exercises, reference is also made to the RLA partitioning method.
The function of the supporting phase is to maintain posture stability and generate forward propulsion. This phase includes four stages:
1. Initial Contact: The heel or other parts of the foot contact the ground on the opposite side to the toe that is off the ground;
2. Mid Stance: The opposite side of the toe is adjacent to the foot (the trunk is directly above the support leg);
3. Terminal Stance: The first landing of the foot on the opposite side of the heel;
4. Pre-Swing: The opposite side of the heel is first landed to the support leg toe off the ground.
The function of the oscillating phase is to allow the body to continue to move forward and prepare for repositioning the limb. This phase includes three stages:
1. Initial Swing: Support the leg toe off the ground to the adjacent position of the opposite foot;
2. Mid Swing: The adjacent position of the contralateral foot to the vertical surface of the tibia;
3. Terminal Swing: The vertical ground position of the tibia reaches the foot again to touch the ground.
4.2 Semantic Similarity Measurement
The clustering process has been described in detail in the previous section. As the collected gait data is discrete, the similarity measurement method of discrete variables is adopted. In this paper, the similarity measure method of the binary variable is used. All binary variables among samples take the total number of different numerical values; the corresponding similarity measurement formula is as follows:
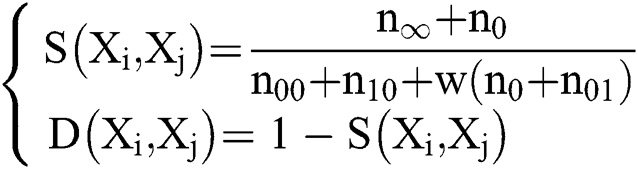
Here,  is the matching coefficient, indicating the degree of difference when the variable takes different values. Generally speaking, the value of the parameter is either 1, 2 or 1/2. In particular, when w is 1, the distance is called the Hamming Distance.
4.3 Differences in Gait between Children with Cerebral Palsy and Normal Children
The abnormality of gait in children with cerebral palsy is most intuitively reflected in the gait movement parameters. Based on the analysis of pace, step width, gait cycle, and other indicators, the typical gait of children with cerebral palsy can be obtained. Due to the dyskinesia of the affected side, the patient will actively use bias or contralateral compensation to compensate for or eliminate the damage while walking. Although these measures can allow the patient to walk independently, the wrong gait characteristics will lead to further deterioration of muscle activity, and ultimately, loss of walking ability.
In the gait data, indicators such as pace, step size, gait cycle and support phase ratio are used to analyze the main manifestations of abnormal gait in children with cerebral palsy, as well as to judge the asymmetry, while the body center of gravity displacement reflects the performance of the upper body swaying state and the lap gait in the gait walking.
The comparison of gait parameters can provide the most intuitive understanding of abnormal gait performance. Tab. 1 compares the abnormal and normal gaits of children with and without cerebral palsy after analysis and comparison by the previous method.
Table 1: Gait comparison of children with cerebral palsy and normal children
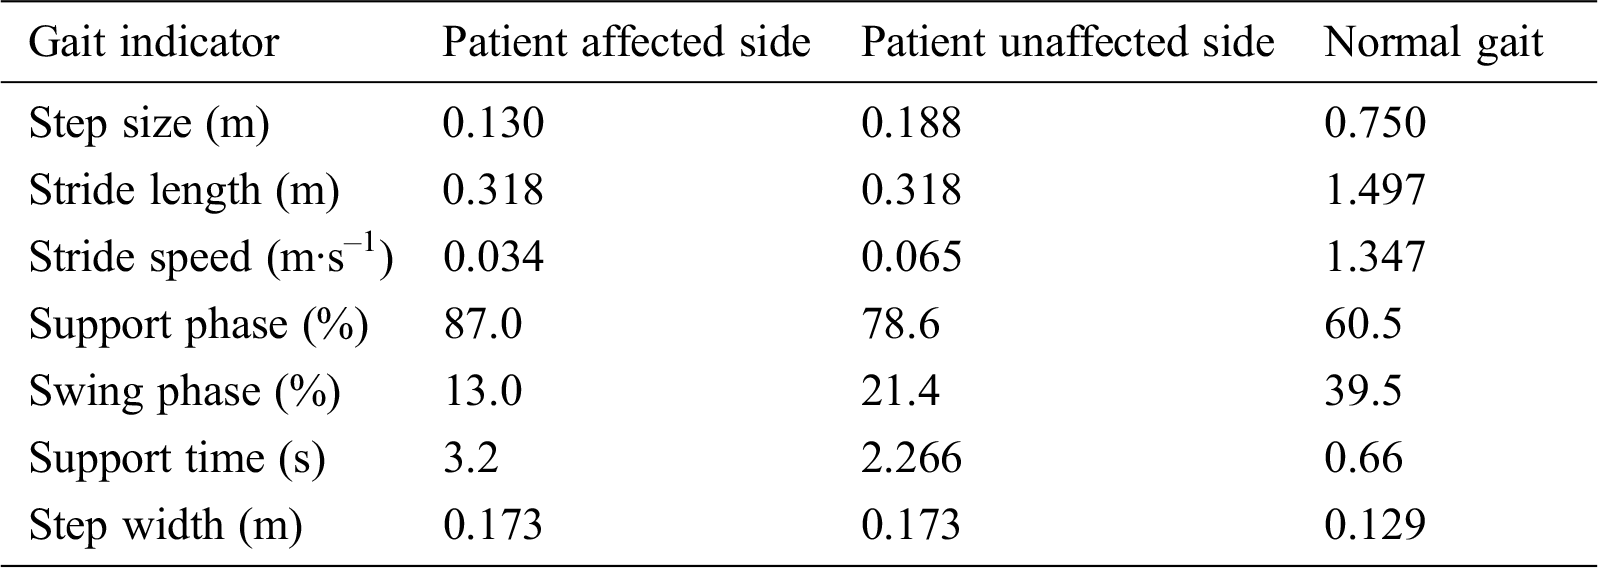
From the comparison of abnormal and normal gait data, it is clear that the differences between the step size, stride length, stride speed, support time, and step width of the affected leg and normal standard value are significant. It can be seen from this data that the step size and pace of the gait in children with cerebral palsy are much smaller than is the case for normal gait: the step size is only 1/5th of the normal gait, the pace is less than 1/10th of the normal gait, and the gait cycle time is greater overall than the normal gait. Moreover, combined with the support phase and the swing comparison case, the total support phase ratio of the affected limb is greater than the normal gait, the double support phase is longer, and the single support is significantly smaller than is the case for normal gait.
The contrast of the step width reflects the large lateral displacement of the gait in children with cerebral palsy. The step width of the children with cerebral palsy is about 1.5 times that of the normal gait, which is a significant outer lap gait. The cerebral palsy patient uses an enlarged step width to increase the support area of the body in order to stabilize the trunk, while the difference in the bearing capacity of the two limbs and the shift of the center of gravity combine to make the patient's trunk sway when the support side changes. Combined with the step size, affected by the movement of the joint during walking, the pace is related to the balance stability of the lower limbs and muscle strength; when compared with normal gait data, these can reflect the problem of limited joint angle and related muscle weakness. On the whole, the abnormal gait of the children with cerebral palsy was characterized by smaller step speed and length, as well as a longer step width and gait cycle, which reduced the length of limb support.
4.4 Center of Gravity Difference
Through three-dimensional kinematic analysis of children with cerebral palsy, along with quantitative analysis of the displacement motion characteristics of the center of gravity of the hemiplegic gait and normal gait in the vertical and lateral directions, the figure below presents a comparison of the eccentric gait obtained from the analysis method outlined in the previous section and the normal gait center shift displacement curve in Fig. 1.
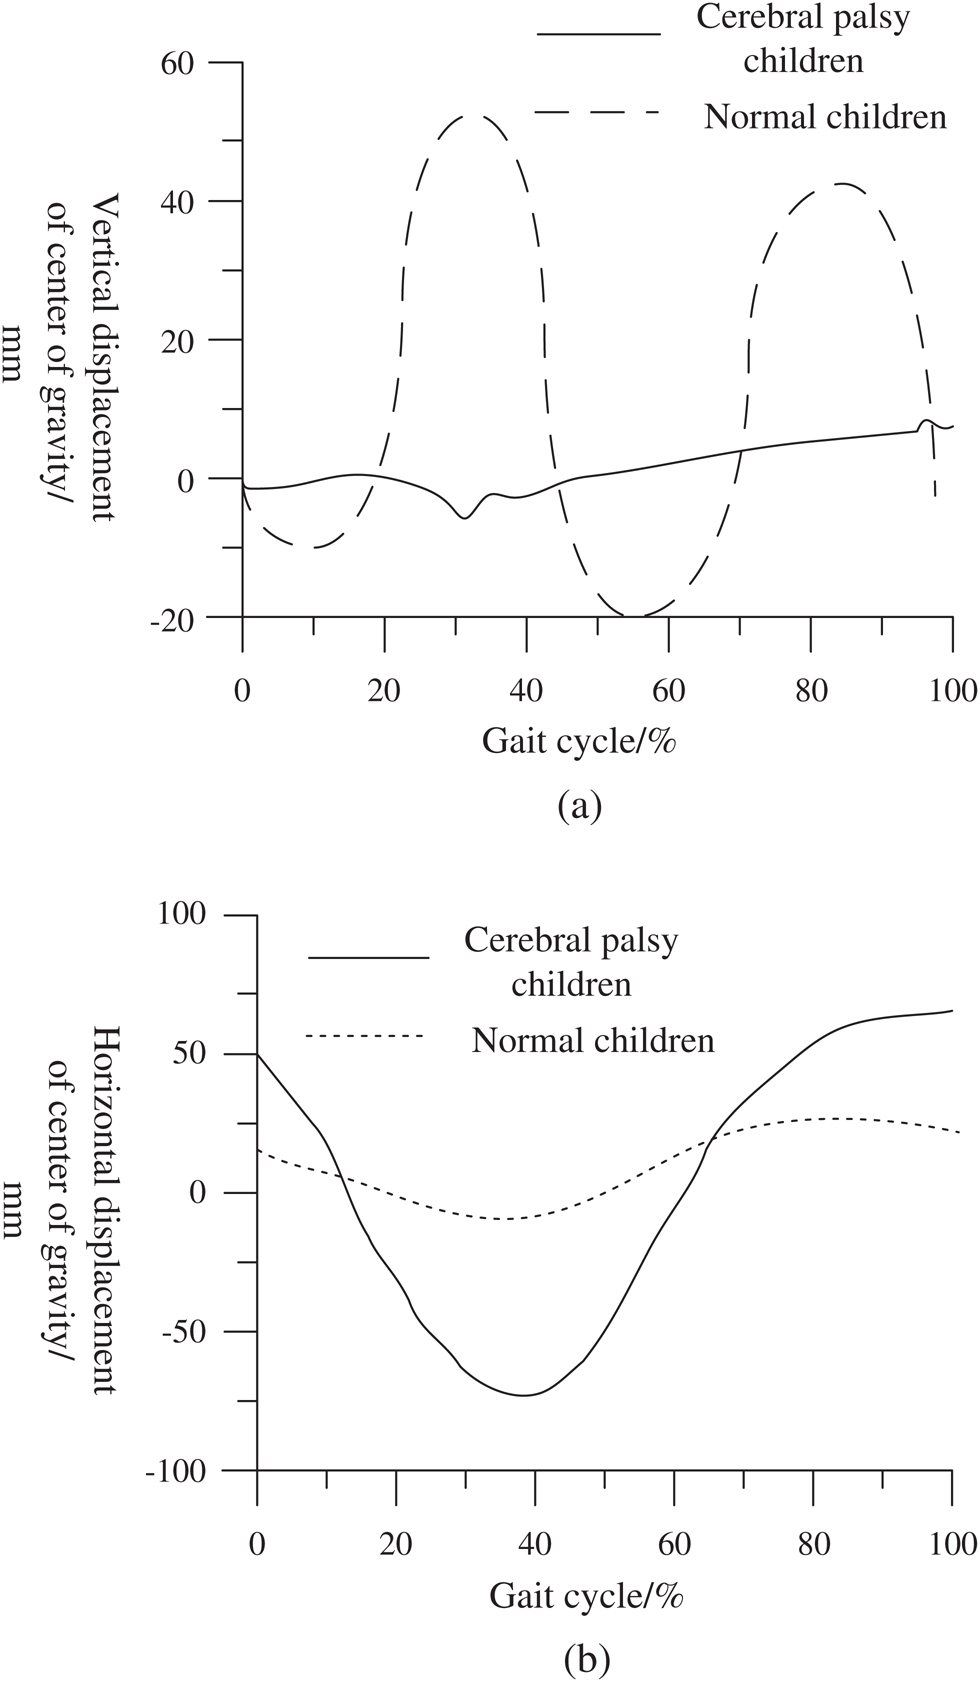
Figure 1: Center of gravity displacement curve of children with cerebral palsy and children with normal gait (a) Vertical direction (b) Lateral direction
In the walking exercise, the center of gravity of the human body is kept in front of the humerus in the pelvis for a long time, while the change of the center of gravity in the anteroposterior direction can reflect the motion velocity characteristics of the subject. Because the pace of children with cerebral palsy is also much smaller than that of normal children, the contrast between the anteroposterior direction and the pace is the same, while the change in the center of gravity in the vertical and lateral directions reflects the overall characteristics of the gait movement. Usually, the center of gravity shift for a normal walking child involves a vertical displacement of 3–4 cm; by contrast, the center of gravity shift for a child with cerebral palsy is only 1–2 cm, and the overall movement of the patient in the vertical direction is small.
Moreover, the lateral displacement of the center of gravity of the child with cerebral palsy is about 11 cm, more than twice the normal range. The child presents a swinging motion of the upper body. The lateral movement determines the degree of the center of gravity shift. The child increases the support area by increasing the step width to in turn increase the stability of the support phase, while the lateral displacement of the center of gravity increases the exercise energy required.
This paper proposes a simple and effective clustering method, which combines K-means and hierarchical clustering and thus contains the advantages of these two methods. Moreover, the proposed method is utilized to find the differences between the abnormal gait of children with cerebral palsy and the gait of normal children. Similar to the K-means method, the abnormal trend of the abnormal gait can be found by using the proposed mixed clustering method to analyze the abnormal direction of the movement. Accordingly, using an approach similar to hierarchical clustering, we can determine the phase difference of the child’s movement.
Funding Statement: J. Li gratefully acknowledge the financial support by the NSFC (61772280), http://www.nsfc.gov.cn.
Conflicts of Interest: The authors declare that they have no conflicts of interest to report regarding the present study.
1. M. Hao, D. Sun, Z. Zhang and S. Li. (2015). “Application research of plantar pressure measurement on cerebral palsy children with talopes valgus,” Guangzhou Medicine, vol. 46, no. 2, pp. 53–55. [Google Scholar]
2. Y. Ren, Y. Leng, F. Zhu, J. Wang and H. J. Kim. (2019). “Data storage mechanism based on blockchain with privacy protection in wireless body area network,” Sensors, vol. 19, no. 10, pp. 2395. [Google Scholar]
3. H. Fan and H. Zhu. (2019). “Motion vector detection based on local autocorrelation coefficient,” Cluster Computing, vol. 22, no. S5, pp. 11633–11639. [Google Scholar]
4. Y. Wen, M. Liu, J. Si and H. H. Huang. (2016). “Adaptive control of powered transfemoral prostheses based on adaptive dynamic programming,” in Proc. of the 38th IEEE Annual Int. Conf. of the Engineering in Medicine and Biology Society, pp. 1613–1624. [Google Scholar]
5. W. Sun, X. Zhang, X. Zhang, X. He and G. Zhang. (2019). “Driving behaviour recognition based on orientation and position deviations,” International Journal of Sensor Networks, vol. 30, no. 3, pp. 161–171. [Google Scholar]
6. C. Wang, X. Shao, Z. Gao, C. Zhao and J. Gao. (2019). “Common network coding condition and traffic matching supported network coding aware routing for wireless multihop network,” International Journal of Distributed Sensor Networks, vol. 15, no. 6, pp. 1–20.
7. J. Xu, Y. Zhang, K. Fu and S. Peng. (2019). “SGX-based secure indexing system,” IEEE Access, vol. 7, pp. 77923–77931. [Google Scholar]
8. X. Zhang, J. Duan, W. Sun and S. Jha. (2019). “A tumour perception system based on a multi-layer mass-spring model,” International Journal of Sensor Networks, vol. 31, no. 1, pp. 24–32. [Google Scholar]
9. D. V. Medhane, A. K. Sangaiah, M. S. Hossain, G. Muhammad and J. Wang. (2020). “Blockchain-enabled distributed security framework for next generation IoT: an edge-cloud and software defined network integrated approach,” IEEE Internet of Things Journal, vol. 7, no. 7, pp. 6143–6149.
10. Y. Ren, F. Zhu, P. K. Sharma, T. Wang and J. Wang. (2020). “Data query mechanism based on hash computing power of blockchain in Internet of Things,” Sensors, vol. 20, no. 1, pp. 207. [Google Scholar]
11. D. Gabor, M. Baritz, L. Cristea and A. Repanovici. (2015). “The analysis of biomechanics and ocular motilities through dynamic image processing methods,” Procedia Technology, vol. 19, pp. 927–933. [Google Scholar]
12. L. Fang, C. Yin, X. Yun, Z. Wen and S. Ji. (2019). “THP: A novel authentication scheme to prevent multiple attacks in SDN-based IoT network,” IEEE Internet of Things Journal, vol. 7, no. 7, pp. 5745–5759. [Google Scholar]
13. J. Wang, W. B. Wu, Z. F. Liao, R. S. Sherratt, G. J. Kim et al., “A probability preferred priori offloading mechanism in mobile edge computing,” IEEE Access, vol. 8, no. 1, pp. 39758–39767, 2020.
14. B. Hu, F. Xiang, F. Wu, J. Liu and Z. Sun. (2019). “Research on time synchronization method under arbitrary network delay in wireless sensor networks,” Computers, Materials & Continua, vol. 61, no. 3, pp. 1323–1344. [Google Scholar]
15. Y. Lu and T. Feng. (2018). “Research on trusted DNP3-BAE protocol based on hash chain,” EURASIP Journal on Wireless Communications and Networking, vol. 2018, no. 1, pp. 893. [Google Scholar]
16. L. Gong, B. Yang, T. Xue, J. Chen and W. Wang. (2018). “Secure rational numbers equivalence test based on threshold cryptosystem with rational numbers,” Information Sciences, vol. 466, pp. 44–54.
17. G. Li, J. Yan, L. Chen, J. Wu and Q. Lin. (2019). “Energy consumption optimization with a delay threshold in cloud-fog cooperation computing,” IEEE Access, vol. 7, no. 1, pp. 159688–159697. [Google Scholar]
18. Y. Ren, J. Wang, X. Feng, G. Younn and J. U. Kim. (2019). “A hierarchical clustering-based method to evaluate reuse of rare earth tailings under cloud computing environment,” Cluster Computing, vol. 22, no. S1, pp. 1805–1814. [Google Scholar]
19. J. Wang, Y. Gao, K. Wang, A. K. Sangaiah and S. J. Lim. (2019). “An affinity propagation-based self-adaptive clustering method for wireless sensor networks,” Sensors, vol. 19, no. 11, pp. 2579.
20. W. Zhang, F. Y. Shih, S. Hu and M. Jian. (2018). “A visual secret sharing scheme based on improved local binary pattern,” International Journal of Pattern Recognition and Artificial Intelligence, vol. 32, no. 6, pp. 1–19. [Google Scholar]
21. D. Francisco, B. Guillermo, L. Ricardo, R. Antonio and H. Michael. (2014). “DNA clustering and genome complexity,” Computational Biology and Chemistry, vol. 53, pp. 71–78. [Google Scholar]
22. W. Wan, J. Chen and S. Zhang. (2019). “A cluster correlation power analysis against double blinding exponentiation,” Journal of Information Security and Applications, vol. 48, no. 10, pp. 102357. [Google Scholar]
23. X. Klimentova, J. P. Pedroso and A. Viana. (2016). “Maximising expectation of the number of transplants in kidney exchange programmes,” Computers & Operations Research, vol. 73, pp. 1–11. [Google Scholar]
24. Z. Xu and W. Liu. (2017). “A priori-based prediction of the multi seat elections,” in 2nd IEEE Int. Conf. on Computational Intelligence and Applications, pp. 214–218, , 2017 [Google Scholar]
25. T. P. Binh, P. Indra and T. B. Dieu. (2018). “Spatial prediction of landslides using a hybrid machine learning approach based on random subspace and classification and regression trees,” Geomorphology, vol. 303, pp. 256–270. [Google Scholar]
26. J. Liu, C. Sui, D. Deng, J. Wang and F. Bin. (2016). “Representing conditional preference by boosted regression trees for recommendation,” Information Sciences, vol. 327, pp. 1–20. [Google Scholar]
27. D. Jörg, F. Ulrich and P. Christian. (2017). “Predicting recessions with boosted regression trees,” International Journal of Forecasting, vol. 33, no. 4, pp. 745–759. [Google Scholar]
28. Y. Benjamin and G. Delvin. (2018). “Predicting service industry performance using decision tree analysis,” International Journal of Information Management, vol. 38, no. 1, pp. 288–300. [Google Scholar]
29. Y. C. Mao, J. H. Zhang, H. Qi and L. B. Wang. (2019). “DNN-MVL: DNN-multi-view-learning-based recover block missing data in a dam safety monitoring system,” Sensors, vol. 19, no. 13, pp. 2895. [Google Scholar]
30. B. Dimitris, M. Dimitris and K. Dimitris. (2010). “Unsupervised SVM-based gridding for DNA microarray images,” Computerized Medical Imaging and Graphics, vol. 34, no. 6, pp. 418–425. [Google Scholar]
31. Z. Yang, M. Jin, Z. Zhang, J. Lu and K. Hao. (2017). “Classification based on feature extraction for hepatocellular carcinoma diagnosis using high-throughput DNA methylation sequencing data,” Procedia Computer Science, vol. 107, pp. 412–417. [Google Scholar]
32. Y. Ren, Y. Leng, Y. Cheng and J. Wang. (2019). “Secure data storage based on blockchain and coding in edge computing,” Mathematical Biosciences and Engineering, vol. 16, no. 4, pp. 1874–1892. [Google Scholar]
33. A. Saettler, E. Laber, F. de A. Mello Pereira. (2017). “Decision tree classification with bounded number of errors,” Information Processing Letters, vol. 127, pp. 27–31.
34. J. Wang, W. B. Wu, Z. F. Liao, R. S. Sherratt and G. J. Kim. (2020). “A probability preferred priori offloading mechanism in mobile edge computing,” IEEE Access, vol. 8, no. 1, pp. 39758–39767. [Google Scholar]
35. B. Park, J. Im, N. Tuvshinjargal, W. Lee and K. Han. (2014). “Sequence-based prediction of protein-binding sites in DNA: Comparative study of two SVM models,” Computer Methods and Programs in Biomedicine, vol. 117, no. 2, pp. 158–167. [Google Scholar]
36. K. Jansen, F. D. Groote, W. Aerts, J. D. Schutter and J. Duysens. (2014). “Altering length and velocity feedback during a neuro-musculoskeletal simulation of normal gait contributes to hemiparetic gait characteristics,” Journal of NeuroEngineering and Rehabilitation, vol. 11, no. 1, pp. 78–15. [Google Scholar]
37. J. G. Qian, R. Ke, Z. Qian, C. Wen and S. Zhang. (2015). “Effects of a multichannel dynamic functional electrical stimulation system on hemiplegic gait and muscle forces,” Journal of Physical Therapy Science, vol. 27, no. 11, pp. 3541–3544. [Google Scholar]
38. B. R. Umberger. (2010). “Stance and swing phase costs in human walking,” Journal of The Royal Society Interface, vol. 7, no. 50, pp. 1329–1340.
39. J. Wang, Y. Q. Yang, T. Wang, R. S. Sherratt and J. Y. Zhang. (2020). “Big data service architecture: a survey,” Journal of Internet Technology, vol. 21, no. 2, pp. 393–405.
40. W. Zhao, J. Liu and H. Guo. (2018). “Etc-iot: Edge-node-assisted transmitting for the cloud-centric internet of things,” IEEE Network, vol. 32, no. 3, pp. 101–107. [Google Scholar]
41. S. R. Hamner, A. Seth and S. L. Delp. (2010). “Muscle contributions to propulsion and support during running,” Journal of Biomechanics, vol. 43, no. 14, pp. 2709–2716. [Google Scholar]
42. W. J. Li, Z. Y. Chen, X. Y. Gao, W. Liu and J. Wang. (2019). “Multimodel framework for indoor localization under mobile edge computing environment,” IEEE Internet of Things Journal, vol. 6, no. 3, pp. 4844–4853.
43. Y. Liu, Y. Ren, C. Ge, J. Xia and Q. Wang. (2019). “A CCA-secure multi-conditional proxy broadcast re-encryption scheme for cloud storage system,” Journal of Information Security and Applications, vol. 47, pp. 125–131.
44. J. Xia and Y. Wang. (2012). “Secure key distribution for the smart grid,” IEEE Transactions on Smart Grid, vol. 3, no. 3, pp. 1437–1443. [Google Scholar]
 | This work is licensed under a Creative Commons Attribution 4.0 International License, which permits unrestricted use, distribution, and reproduction in any medium, provided the original work is properly cited. |