DOI:10.32604/cmc.2020.012096
| Computers, Materials & Continua DOI:10.32604/cmc.2020.012096 | |
| Article |
Is Social Distancing, and Quarantine Effective in Restricting COVID-19 Outbreak? Statistical Evidences from Wuhan, China
1School of Mathematical and Physical Sciences, University of Newcastle, Newcastle, Australia
2Department of Statistics, Quaid-i-Azam University Islamabad, Islamabad, Pakistan
3Department of Mathematics and Social Sciences, Sukkur IBA University, Sukkur, 65200, Pakistan
4Department of Mathematical Sciences, Federal Urdu University of Arts, Science & Technology, Gulshan-e-Iqbal, Karachi, Pakistan
5Faculty of Mathematics and Statistics, Ton Duc Thang University, Ho Chi Minh City, Vietnam
6Department of Mathematics, College of Arts and Sciences, Wadi Aldawaser, Prince Sattam Bin Abdulaziz University, Al-Kharj, Saudi Arabia
*Corresponding Author: Ilyas Khan. Email: ilyaskhan@tdtu.edu.vn
Received: 14 June 2020; Accepted: 07 July 2020
Abstract: The flow of novel coronavirus (COVID-19) has affected almost every aspect of human life around the globe. Being the emerging ground and early sufferer of the virus, Wuhan city-data remains a case of multifold significance. Further, it is of notable importance to explore the impact of unique and unprecedented public health response of Chinese authorities—the extreme lockdown of the city. In this research, we investigate the statistical nature of the viral transmission concerning social distancing, extreme quarantine, and robust lockdown interventions. We observed highly convincing and statistically significant evidences in favor of quarantine and social distancing approaches. These findings might help countries, now facing, or likely to face the wave of the virus. We analyzed Wuhan-based data of “number of deaths” and “confirmed cases,” extracted from China CDC weekly database, dated from February 13, 2020, to March 24, 2020. To estimate the underlying group structure, the assembled data is further sub-divided into three blocks, each consists of two weeks. Thus, the complete data set is studied in three phases, such as, phase 1 (Ph 1) = February 13, 2020, to February 26, 2020; phase 2 (Ph 2) = February 27, 2020 to March 11, 2020; and phase 3 (Ph 3) = March 12, 2020 to March 24, 2020. We observed the overall median proportion of deaths in those six weeks remained 0.0127. This estimate is highly influenced by Ph1, when the early flaws of weak health response were still prevalent. Over the time, we witnessed a median decline of 92.12% in the death proportions. Moreover, a non-parametric version of the variability analysis of death data, estimated that the average rank of reported proportions in Ph 3 remained 7, which was 20.5 in Ph 2, and stayed 34.5 in the first phase. Similar patterns were observed, when studying the confirmed cases data. We estimated the overall median of the proportion of confirmed cases in Wuhan as 0.0041, which again, is highly inclined towards Ph 1 and Ph 2. We also witnessed minimum average rank proportions for Ph 3, such as 7, which was noticeably lower than Ph 2, 21.71, and Ph 1, 32.29. Moreover, the varying degree of clustering indicates that the effectiveness of quarantine based policies is time-dependent. In general, the decline in coronavirus transmission in Wuhan significantly coincides with the lockdown.
Keywords: COVID-19; k-mean clustering; statistical methods; variability analysis
Since its onset in December 2019, as a pneumonia case of unknown origin in Wuhan city, the COVID-19 is evolving rapidly across the globe [1]. Till date, the pandemic’s outbreaks have influenced every aspect of human life, such as social [2,3], economic [4,5], environmental [6,7] and political [8,9], in varying degree. The global death count has surpassed 490,000, with the number of confirmed carriers of the virus exceeding 6.29 million. Epidemiologists and academics, from every corner, are responding to the wake of coronavirus. The scale of research activities is mammoth. Within the first two months of the viral outbreak, there have been 900 articles, reports, and preprints focusing pandemic [10]. Along with the efforts to explore clinical nature of the virus [11–13], a considerable amount of time and energy is being dedicated to understanding the mathematical nature of the transmission [14,15]. Moreover, the Chinese led lockdown scheme is also in the debates [16,17]. Therefore, the statistical analysis of China’s lead of extreme lockdown to break the transmission chain of the virus is worth conducting. However, there is a dearth of independent statistical studies, focusing on the compilation of statistical evidences, highlighting the utility of the control measures initiated in Wuhan city. One explanation to this, might be the simple nature of the publically accessible data, containing minimal information and shy to statistical operations. A separate study focusing the statistical aspects, with limited extent of information available in public domains, thus remains a challenging task. Recognizing the limitations, we, however, believe that statistical investigation, screening the effectiveness of social distancing and recommended quarantine, is worth conducting. We believe that, a study compiling the statistical evidences, will help authorities in launching cautionary campaigns with clearer arguments.
Motivated by the need for such efforts, this research aims to study Wuhan-based data, dated from February 13, 2020, to March 23, 2020. In the next Section 2, we provide various arguments backed by statistical evidences, highlighting the need for more operational and robust quarantine to prevent large-scale crises. The statistical analysis, combined with suitable graphical displays, provides a thoughtful insight into the interventions driven group structure of the coronavirus outbreak in Wuhan, China. Lastly, Section 3 offers a brief discussion about the general findings of the research.
2.1 Data and Theoretical Framework
Data, for this study, were extracted from China’s CDC weekly database, updating daily counts of confirmed cases and the number of deaths, dated from February 13, 2020, to March 24, 2020. To estimate the un-confounded effects of lockdown, we focused on Wuhan-based data. Moreover, the time-dependent nature of the quarantine based interventions is respected by further sub-dividing complete data set into three blocks, each consists of fourteen days. The analysis of these sub-groups, along with the complete data set, allows us to explore the prevalence behaviors of the disease with respect to the varying extent of quarantine policies. In order to explain the theoretical framework of the study, it is important to summarize the situation of the viral explosion in the adjacent past. The identification of the first confirmed case, in December 2019, coincided with the Chinese festival [15]. The dynamics of the virus and its infectious intensity, were not fully known. Therefore, no effective damage control interventions were put into place. The lockdown was implemented in mid-January 2020. Till then, viral transmission remained unrestricted [15,17]. It is reasonable to anticipate that phase 1 seems to be highly vulnerable to the unobstructed flow of the epidemic. This phase can be considered as the baseline impact evaluation source to assess the quarantine’s time-related gain. The framework is comprehended in below given flow chart.
Tab. 1 summarizes the exploratory outcomes of the study. The estimates of Ph 1, for both data sets, vividly highlight the impact of the unaccounted early explosion of the disease. The quartile values are outstanding in Ph 1, relative to the other two phases, as well as, complete data analysis. One needs to be cautious when studying the impact of lockdown on the viral flow—an analysis without effective blocking is highly likely to produce biased estimates.
Table 1: Summary statistics for both data sets, where, RMD = percentage median decline with respect to Ph 1
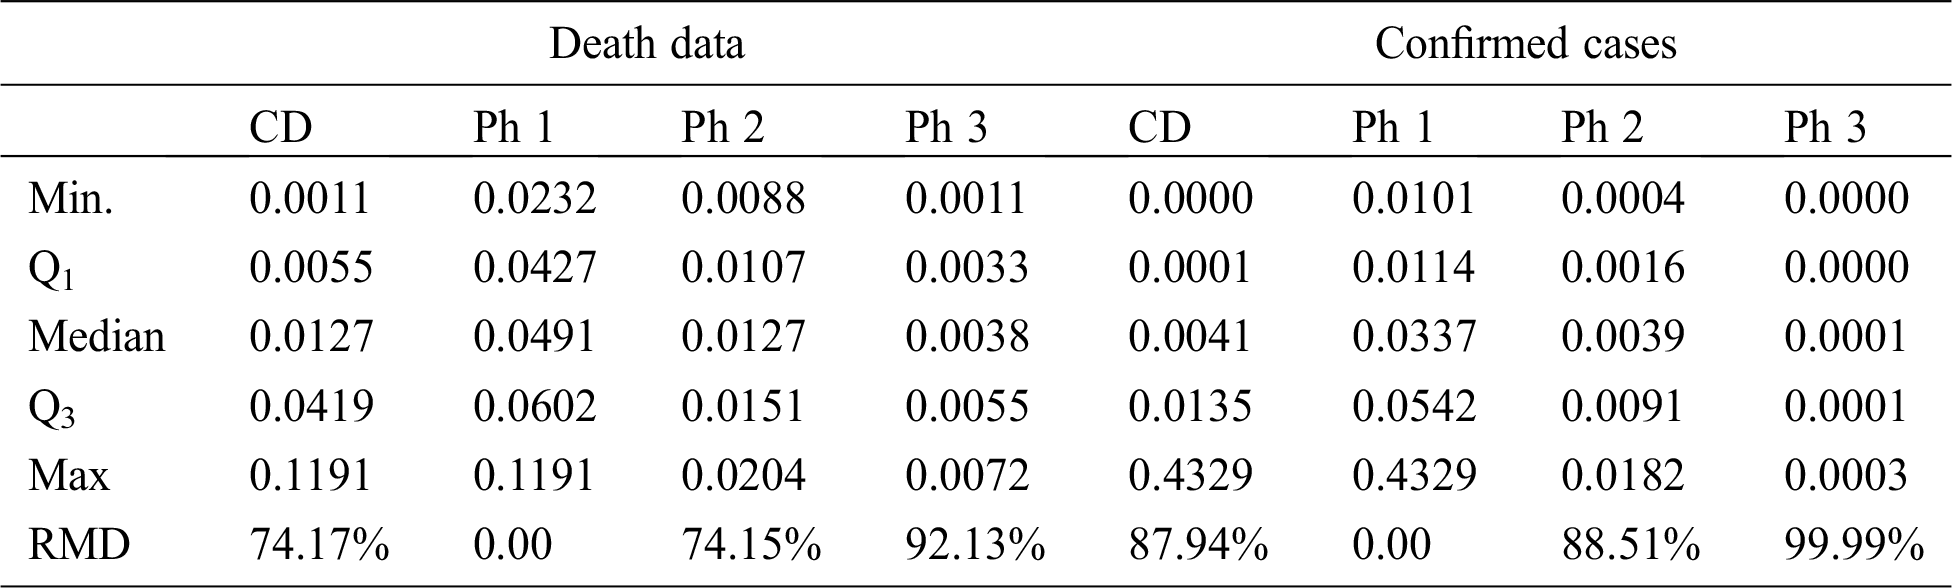
In the case of the analysis of death-related data, we observe a decline of 74.15% in median death proportion in Ph 2 relative to Ph 1. The extent of decline becomes more noticeable in Ph 3, where it reaches to 92.13%. More inspiringly, the maximum daily proportion of deaths in Ph 3, is even less than the minimum value of the Ph 1. This fact significantly seals the effectiveness of lockdown, and quarantine interventions in Wuhan to slow the flow of transmissible coronavirus. Similarly, even more, convincing estimates are observable in the analysis of confirmed cases data. The relative decrease in confirmed cases in Ph 2 with respect to Ph 1, is estimated as 88.51%, which reaches to 99.99% in Ph 3. The pictorial display of the situation is presented in Fig. 1, using side-by-side box plots.
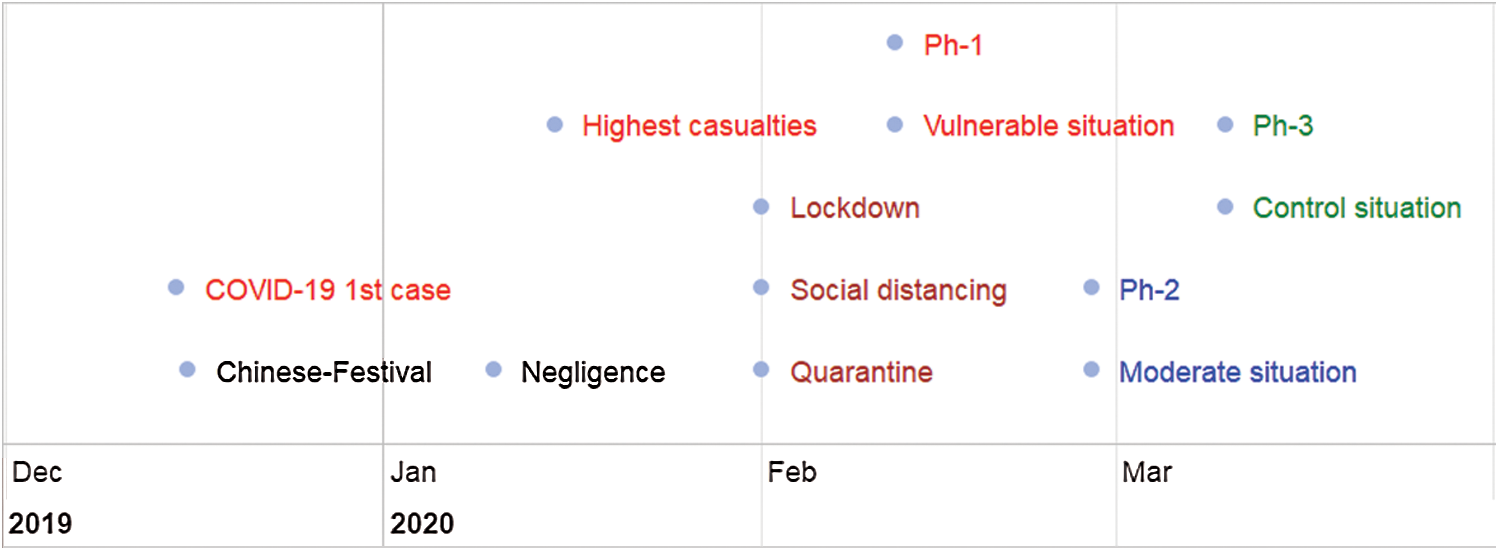
Figure 1: Flow chart comprehending the theoretical framework and adjacent past event
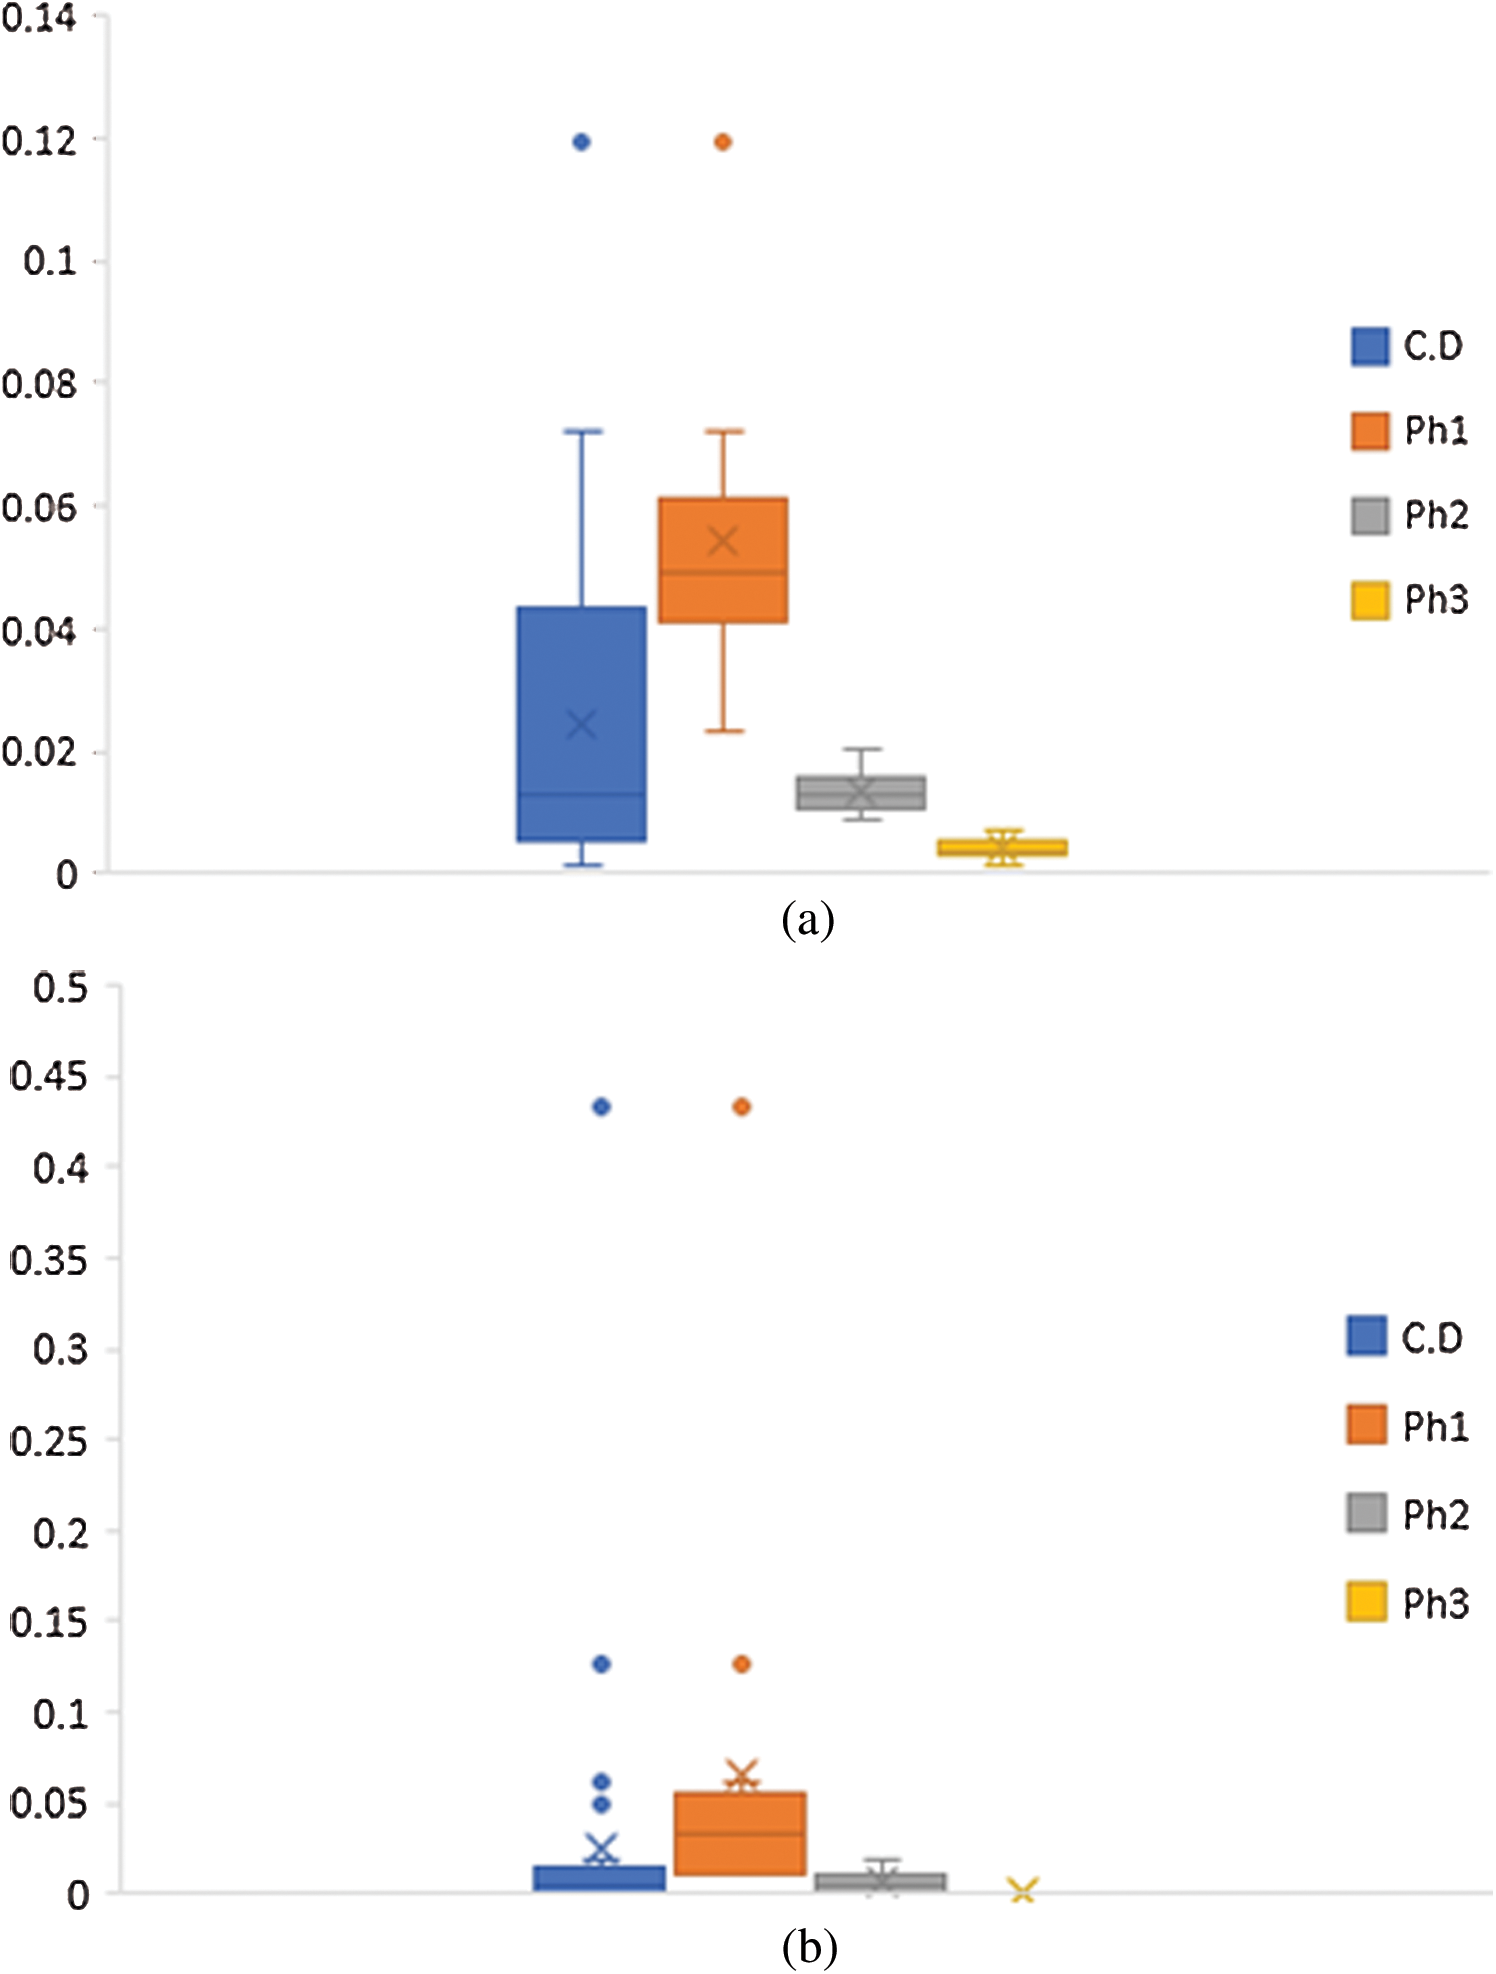
Figure 2: Side-by-side box plots depicting the pictorial summary of the lockdown. (a) Death data cases. (b) Confirmed cases
Based on the above findings, we further investigate the scenario, if lockdown of Wuhan was in effect a two weeks earlier time. The objective is obtained by, first, excluding Ph 1 data values from the complete data set and, then by estimating the confidence limits using Ph 2 and Ph 3 data. Fig. 3 provides the display of the scenario for death data and confirmed cases. First, let us read the case of death data. Panel (a) reveals that majority of Ph 1 values fall outside the upper 95% confidence limit constructed by using Ph 2 and Ph 3 of lockdown data. These findings implicate that, two weeks earlier and operational implementation of lockdown, could have accumulatively avoided at least 57% of the deaths, reported till March 24, 2020. Moreover, all the recorded values in Ph 3, stay below the mean line, indicating the gains of quarantine, and lockdown to maximum degree. Similarly, the above mentioned intervention was likely to reduce the extent of infected persons by almost 80%. These outcomes signify the utility of control measures such as social distancing, quarantine, and lockdown in the wake of the corona disease.
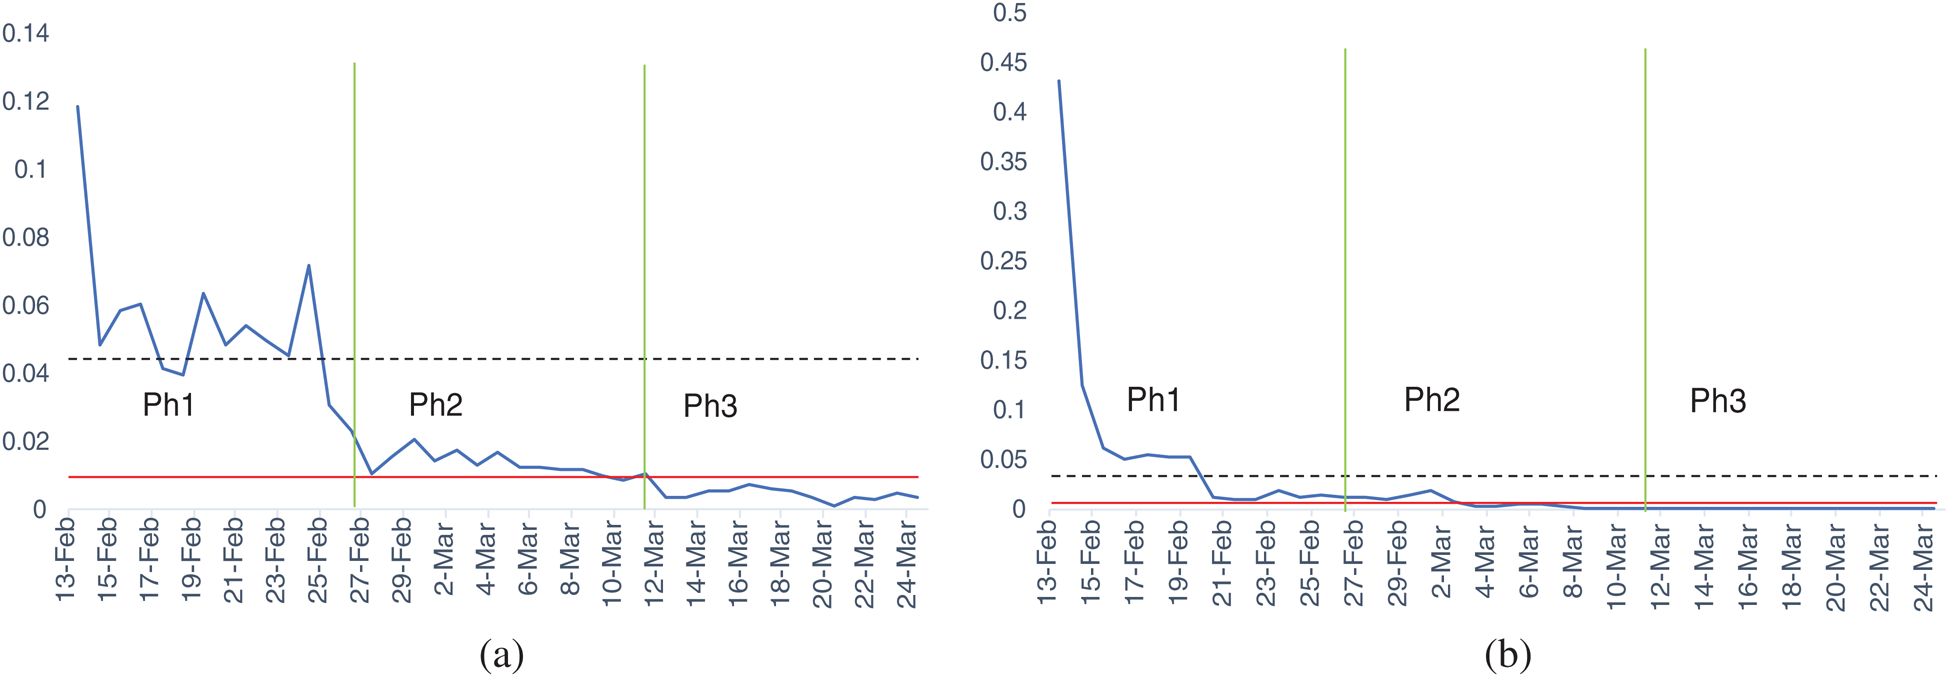
Figure 3: Display of corona virus effects over the time. (a) Death data cases. (b) Confirmed cases. Mean line is highlighted in red color, dotted line shows upper 95% confidence limit, and green lines separate the pre-considered phases
The underlying trends and group structures, existent in the data, are further explored by employing more formal and appropriate model-based and graphical statistical strategies. The objectives are achieved through the Kruskal–Wallis test, the Jonckheere trend test, and k-means clustering. Firstly, the Kruskal–Wallis test—a non-parametric alternative of ANOVA—for death data, produces a statistically significant value of 36.601 with an associated p-value of less than 0.0001. The findings reveal that all three considered phases of Wuhan lockdown, generate a significantly varying degree of effectiveness against corona breakout. Similarly, in the matter of confirmed cases, we witnessed a statistically significant value of the test as 32.611. Again, the associated p-value remains less than 0.0001, highlighting the fact that the degree of reported confirmed personal is significantly different in all three phases. Further, the direction and extent of differences among the phases are persuaded by employing the pairwise comparison approach—the Jonckheere trend test. Tab. 2 below compiles the results of pairwise follow-up, whereas Fig. 4 depicts the outcomes’ pictorial display.
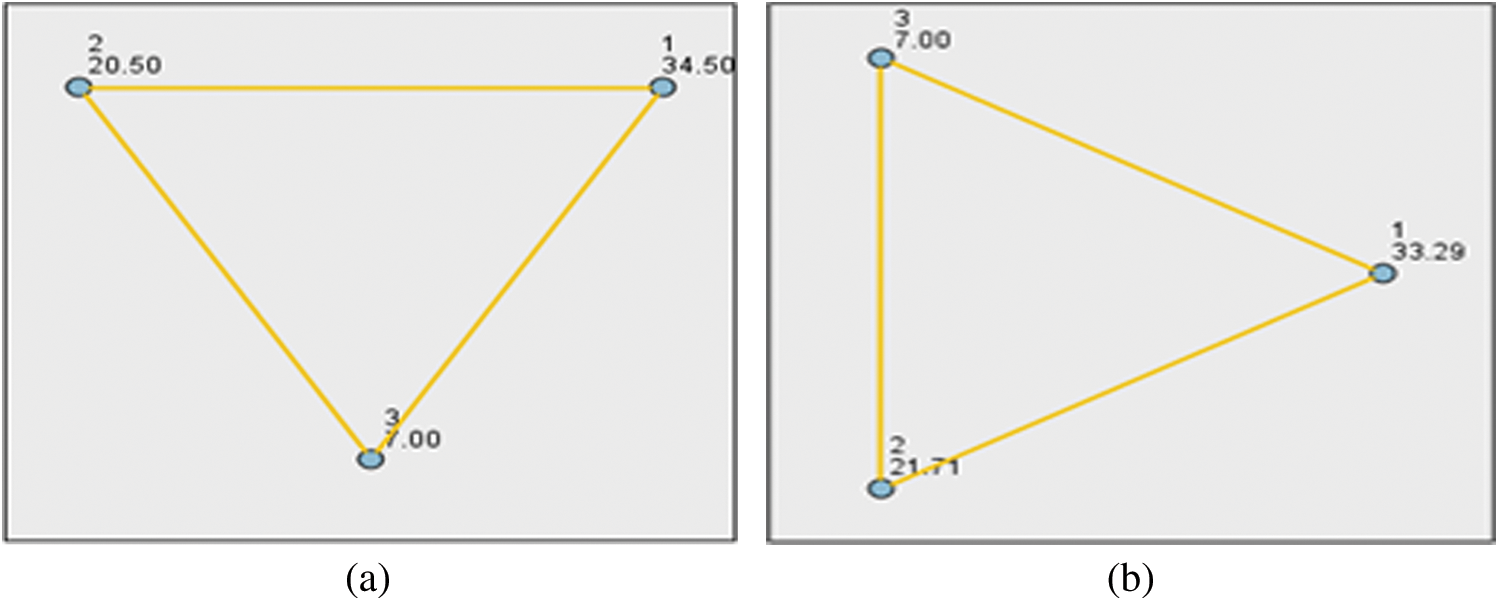
Figure 4: Pairwise comparison of phases, where each nod shows average rank of the phase (a) Death data. (b) Confirmed cases
Table 2: Results of Jonckheere trend test-pairwise differences among phases, each hypothesis tests, if phases are generated under identical distributional phenomenon
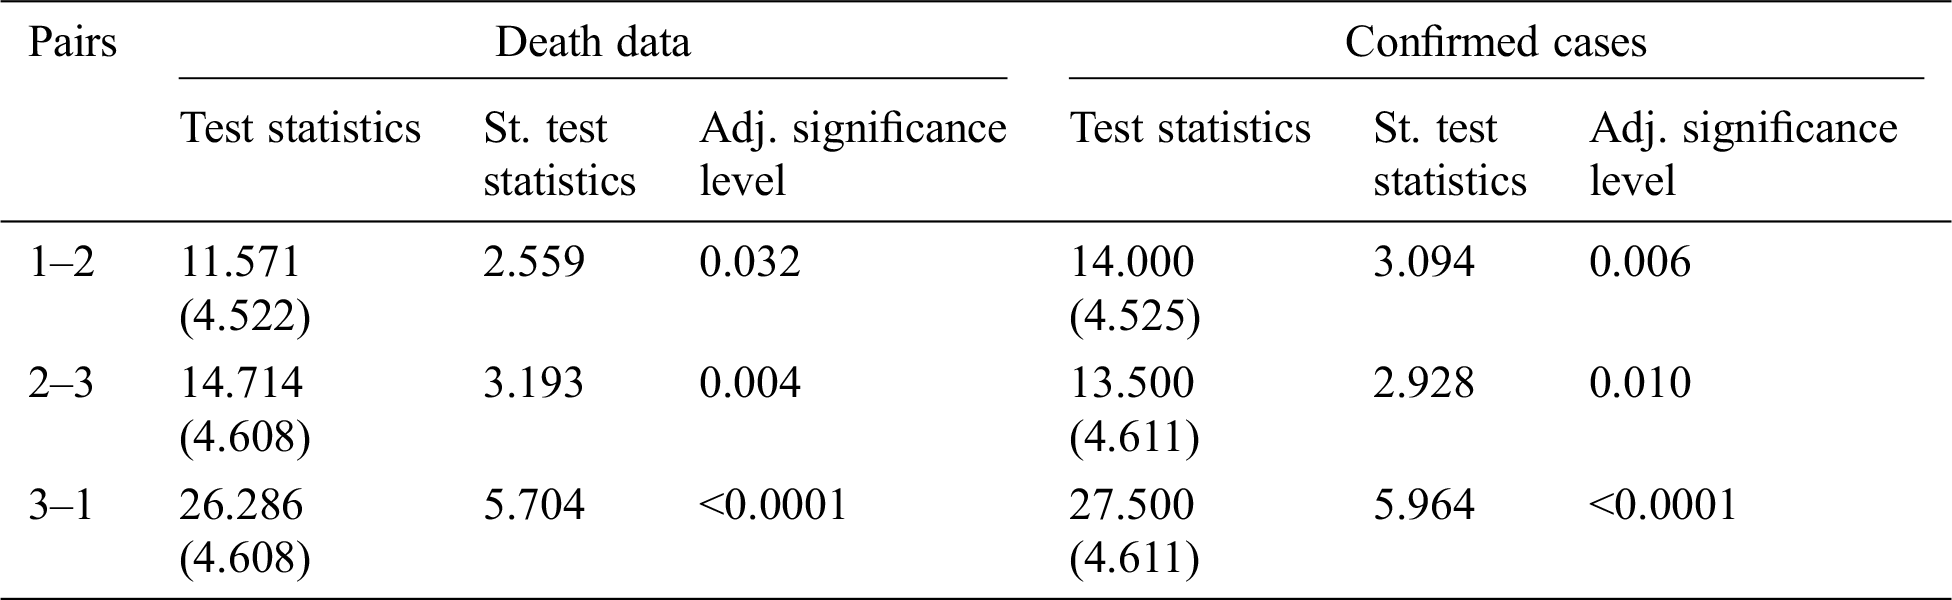
For both data sets, phase 3, not only stands out as the most unlike of other two phases, but also as a highly convincing candidate in terms of minimum atrocities reported. From Tab. 2, one may notice that the highest values of test statistics, quantifying the differences among phases in pairs, are observed when phase 3 is involved. Moreover, Fig. 4 reveals that the average ranks of phase 3, for both data sets, remain the lowest among all three phases. This, collectively, is a very strong case in favor of highly recommended social distancing and quarantine interventions, in restricting the coronavirus flow.
Lastly, k-mean clustering is depicted in Fig. 5, with varying numbers of k’s. A detailed account of the applications of k-mean clustering technique can be seen in diverse fields of inquiry, for example, in optimization literature [18,19], in variability analysis [20,21], in artificial intelligent networking [22], and more recently in infectious disease prediction [23]. All panels of Fig. 5, highlight the fact that the utility of quarantine driven interventions, is time-dependent. This realization remains consistent for both data sets. In all cases, we observed the maximum utility was gleaned in the last 20 days.
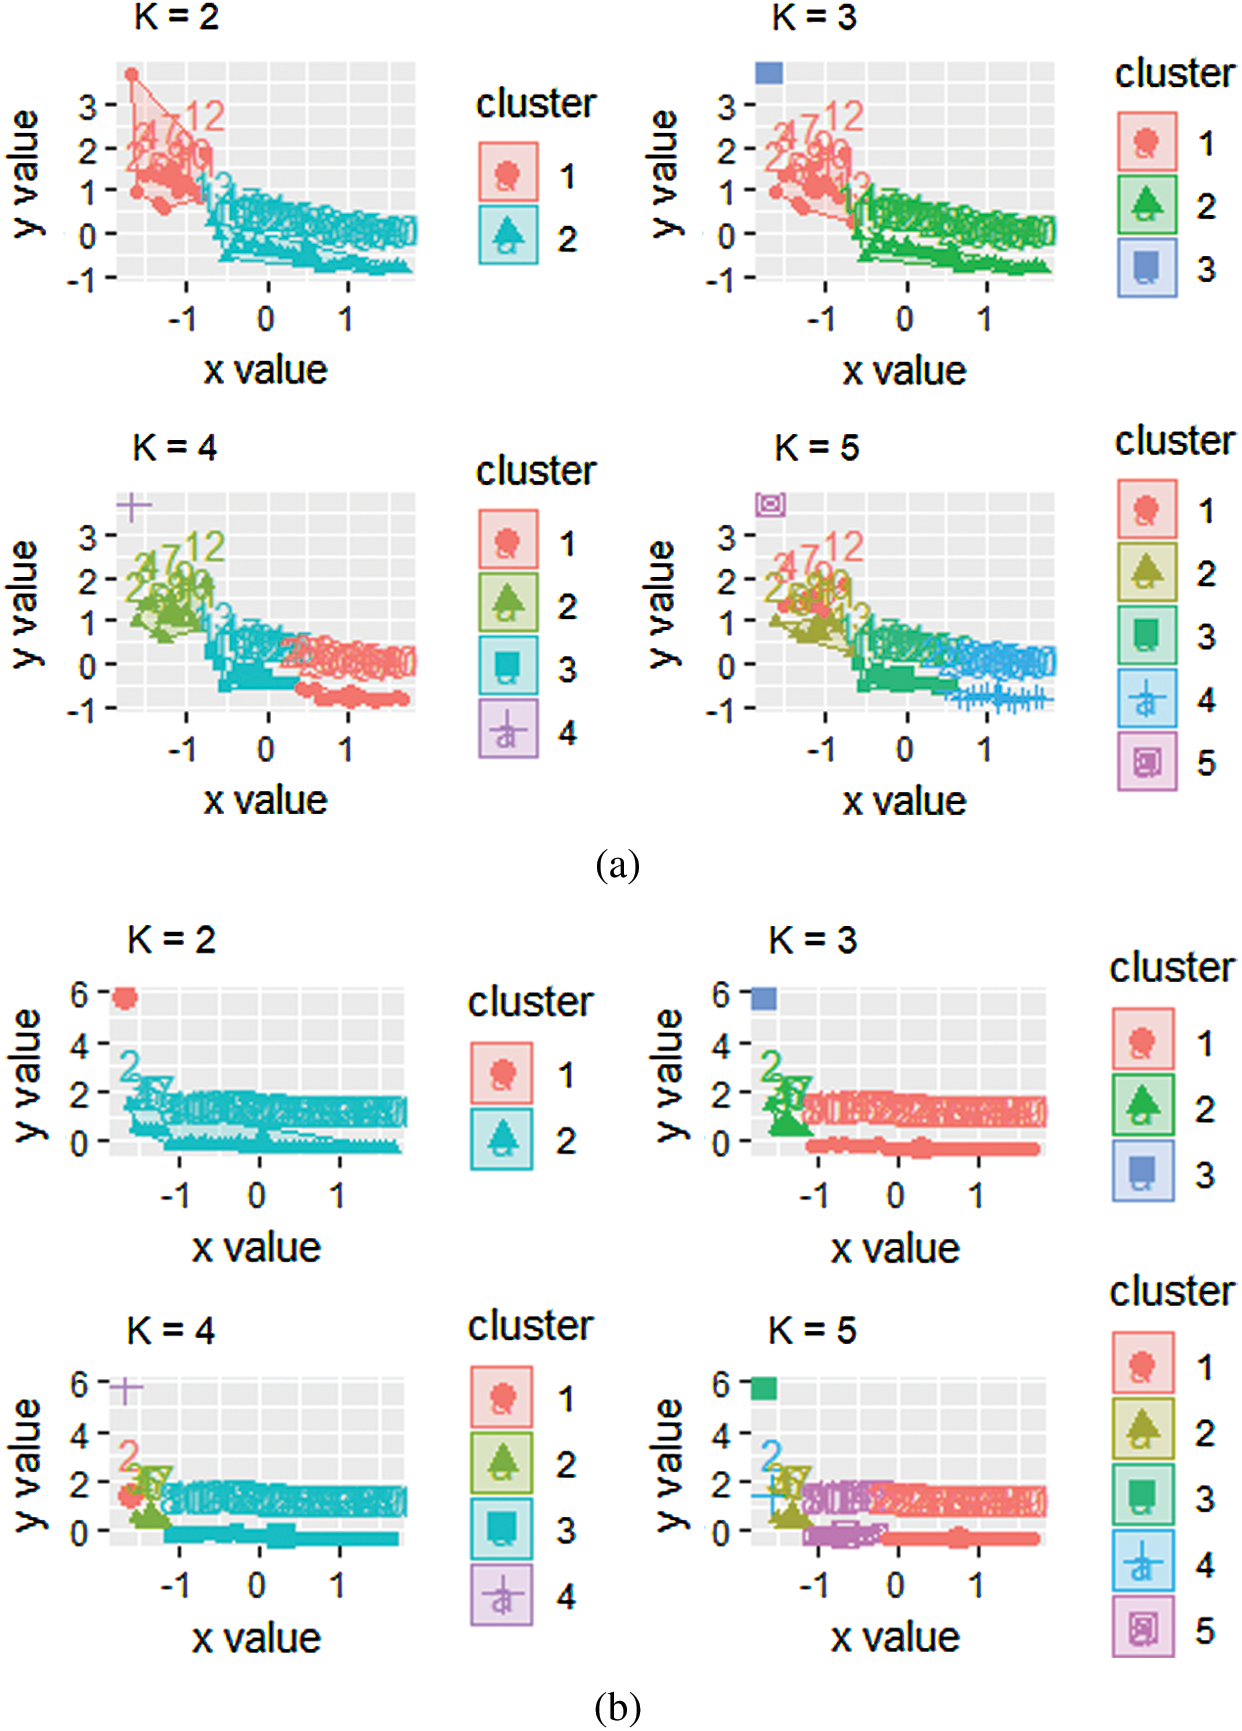
Figure 5: Clustering of days highlighting the prevalent group structure, k represents the number of clusters. (a) Death data. (b) Confirmed cases
The term quarantine refers to the separation of the person(s) who has been exposed to infectious disease [16]. China exercised this intervention at an escalating scale by employing an extremely robust lockdown of the Wuhan city to break the transmission chain of novel coronavirus flow. It was reported that 31.3% of the patients in mainland China, traveled to Wuhan and 72.3% were exposed to the disease by contacting people from Wuhan [11]. Our research aims at gathering statistical evidences delineating the outcomes of Chinese public health interventions in Wuhan city to restrict the person-to-person contact. The objectives are achieved by extracting and analyzing Wuhan-based data of reported deaths and confirmed cases, from February 13, 2020, to March 24, 2020. By keeping, the incubation period, into view and to estimate the un-confounded effects of lockdown, the assembled data is also studied in sub-groups, calling them phases. Such that, each phase consists of fourteen days. Our research, based on various statistical tools, reveals compelling evidences in the favor of quarantine based public health response. Our results show that the decline of COVID-19 transmission, strongly coincides with strict quarantine and lockdown policies in Wuhan city. Based on the findings, we argue that China’s lead of limiting movement, propagating social distancing, and quarantining the infected persons, is worth replicating. We observed a decline of 92.13% in the median of the daily reported proportion of deaths from the first phase to the third phase. Similarly, the analysis of confirming cases data shows a decrease of 99.99% in phase 3. The average ranks of atrocities remain consistently and noticeably lower in phase 3 as compared to the initial phases. Moreover, the varying degree of clustering indicates that quarantine-driven policies have become effective over time. We observed that if the interventions were initiated, somehow, two weeks earlier, it could have saved almost 57% of the total deaths in Wuhan.
Although, social distancing, quarantine, and travel bans have emerged as promising strategies in restricting the extent of crises. It is to be noted that social distancing and mandatory quarantine alone cannot end this outbreak. But such measures have noticeable efficacy to slow down the transmissible COVID-19 spread. Finally, authorities also need to recognize that quarantine-based interventions are of very limited utility if posed haphazardly.
Funding Statement: The author(s) received no specific funding for this study.
Conflicts of Interest: The authors declare that they have no conflicts of interest to report regarding the present study.
1. W. J. Guan, Z. Y. Ni, Y. Hu, W. Liang, C. Ou, et al.. (2020). , “Clinical characteristics of coronavirus disease 2019 in China,” New England Journal of Medicine, vol. 382, no. 18, pp. 1708–1720. [Google Scholar]
2. A. Remuzzi and G. Remuzzi. (2020). “COVID-19 and Italy: What next?,” Lancet, vol. 395, no. 10231, pp. 1225–1228. [Google Scholar]
3. N. Pitas and C. Ehmer. (2020). “Social capital in the response to COVID-19,” American Journal of Health Promotion. [Google Scholar]
4. D. Guan, D. Wang, S. Hallegatte, S. J. Davis, J. Huo et al.. (2020). , “Global supply-chain effects of COVID-19 control measures,” Nature Human Behavior. [Google Scholar]
5. W. Kawohl and C. Nordt. (2020). “COVID-19, unemployment, and suicide,” Lancet Psychiatry, vol. 7, no. 5, pp. 389–390. [Google Scholar]
6. K. Chen, M. Wang, C. Huang, P. L. Kinny and P. T. Anastas. (2020). “Air pollution reduction and mortality benefit during the COVID-19 outbreak in China,” Lancet Planetary Health, vol. 4, no. 6, pp. e210–e212. [Google Scholar]
7. L. C. Quéré, R. B. Jackson, M. W. Jones, A. J. P. Smith, S. Abernethy et al.. (2020). , “Temporary reduction in daily global CO2 emissions during the COVID-19 forced confinement,” Nature Climate Change, vol. 10, no. 7, pp. 647–653. [Google Scholar]
8. J. P. Daniels. (2020). “Venezuelan migrants ‘struggling to survive’ amid COVID-19,” Lancet, vol. 395, no. 10229, pp. 1023. [Google Scholar]
9. M. Flinders. (2020). “Gotcha! Coronavirus, crises and the politics of blame games,” Political Insight, vol. 11, no. 2, pp. 22–25. [Google Scholar]
10. E. Callaway, D. Cyranoski, S. Mallapaty, E. Stoye and J. Tollefson. (2020). “The coronavirus pandemic in five powerful charts,” Nature, vol. 579, no. 7800, pp. 482–483. [Google Scholar]
11. Y. R. Guo, Q. D. Cao, Z. S. Hong, Y. Y. Tan, S. D. Chen et al.. (2020). , “The origin, transmission and clinical therapies on coronavirus disease 2019 (COVID-19) outbreak—an update on the status,” Military Medical Research, vol. 7, no. 1, pp. 1–10. [Google Scholar]
12. C. Huang, Y. Wang, X. Li, L. Ren, J. Zhao et al.. (2020). , “Clinical features of patients infected with 2019 novel coronavirus in Wuhan,” Lancet, vol. 395, pp. 497–506.
13. M. Rodriguez-Cola, I. Jiménez-Velasco, F. Gutierrez-Henares, E. Lòpez-Dolado, C. Gambarrutta-Malfatti et al.. (2020). , “Clinical features of coronavirus disease 2019 (COVID-19) in a cohort of patients with disability due to spinal cord injury,” Spinal Cord Series and Cases, vol. 6, no. 39. [Google Scholar]
14. A. J. Kucharski, T. W. Russell, C. Diamond, Y. Liu, J. Edmunds et al.. (2020). , “Early dynamics of transmission and control of COVID-19: A mathematical modelling study,” Lancet Infectious Diseases, vol. 20, no. 5, pp. 553–558. [Google Scholar]
15. R. Zheng, Y. Xu, W. Wang, G. Ning and Y. Bi. (2020). “Spatial transmission of COVID 19 via public and private transportation in China,” Travel Medicine and Infectious Disease, vol. 34, 101626. [Google Scholar]
16. W. E. Parmet and M. S. Sinha. (2020). “COVID-19—The law and limits of quarantine,” New England Journal of Medicine, vol. 382, no. 15, e28. [Google Scholar]
17. D. Cyranoski. (2020). “What China’s coronavirus response can teach the rest of the world?,” Nature, vol. 579, no. 7800, pp. 479–480. [Google Scholar]
18. Z. Tang, K. Liu, J. Xiao, L. Yang and Z. Xiao. (2017). “A parallel k-means clustering algorithm based on redundance elimination and extreme points optimization employing MapReduce,” Concurrency and Computation: Practice and Experience, vol. 29, no. 20. [Google Scholar]
19. L. L. Zhou, F. Tan, F. Yu and W. Liu. (2019). “Cluster synchronization of two-layer nonlinearly coupled multiplex networks with multi-links and time-delays,” Neurocomputing, vol. 359, pp. 264–275. [Google Scholar]
20. X. Yin, K. Zhang, B. Li, A. K. Sangaiah and J. Wang. (2018). “A task allocation strategy for complex applications in heterogeneous cluster-based wireless sensor networks,” International Journal of Distributed Sensor Networks, vol. 14, no. 8. [Google Scholar]
21. S. S. Li, T. J. Cui and J. Liu. (2018). “Research on the clustering analysis and similarity in factor space,” Computer Systems Science and Engineering, vol. 33, no. 5, pp. 397–404. [Google Scholar]
22. U. Kanimozhi and D. Manjula. (2018). “An intelligent incremental filtering feature selection and clustering algorithm for effective classification,” Intelligent Automation and Soft Computing, vol. 24, no. 4, pp. 701–709. [Google Scholar]
23. X. Jiang, M. Coffee, A. Bari, J. Wang, X. Jiang et al.. (2020). , “Towards an artificial intelligence framework for data-driven prediction of coronavirus clinical severity,” Computers, Materials & Continua, vol. 63, no. 1, pp. 537–551. [Google Scholar]
 | This work is licensed under a Creative Commons Attribution 4.0 International License, which permits unrestricted use, distribution, and reproduction in any medium, provided the original work is properly cited. |