DOI:10.32604/cmc.2020.012151
| Computers, Materials & Continua DOI:10.32604/cmc.2020.012151 | |
| Article |
Performance Estimation of Machine Learning Algorithms in the Factor Analysis of COVID-19 Dataset
1Chitkara University Institute of Engineering and Technology, Chitkara University, Punjab, India
2Workday Integration Architect Huntington, Columbus, OH, USA
3Department of Computer Science, University of Oviedo, Oviedo, Spain
*Corresponding Author: Ashutosh Kumar Dubey. Email: ashutosh.dubey@chitkara.edu.in
Received: 16 June 2020; Accepted: 25 July 2020
Abstract: Novel Coronavirus Disease (COVID-19) is a communicable disease that originated during December 2019, when China officially informed the World Health Organization (WHO) regarding the constellation of cases of the disease in the city of Wuhan. Subsequently, the disease started spreading to the rest of the world. Until this point in time, no specific vaccine or medicine is available for the prevention and cure of the disease. Several research works are being carried out in the fields of medicinal and pharmaceutical sciences aided by data analytics and machine learning in the direction of treatment and early detection of this viral disease. The present report describes the use of machine learning algorithms [Linear and Logistic Regression, Decision Tree (DT), K-Nearest Neighbor (KNN), Support Vector Machine (SVM), and SVM with Grid Search] for the prediction and classification in relation to COVID-19. The data used for experimentation was the COVID-19 dataset acquired from the Center for Systems Science and Engineering (CSSE), Johns Hopkins University (JHU). The assimilated results indicated that the risk period for the patients is 12–14 days, beyond which the probability of survival of the patient may increase. In addition, it was also indicated that the probability of death in COVID cases increases with age. The death probability was found to be higher in males as compared to females. SVM with Grid search methods demonstrated the highest accuracy of approximately 95%, followed by the decision tree algorithm with an accuracy of approximately 94%. The present study and analysis pave a way in the direction of attribute correlation, estimation of survival days, and the prediction of death probability. The findings of the present study clearly indicate that machine learning algorithms have strong capabilities of prediction and classification in relation to COVID-19 as well.
Keywords: COVID-19; linear and logistic regression; DT; KNN; SVM; SVM with grid search
The World Health Organization (WHO) acknowledged novel Coronavirus Disease (COVID-19) as a pandemic on March 11, 2020, and recommended instant action predominantly for the early detection and treatment of this disease. The name, COVID-19, was suggested by WHO for the novel coronavirus that was reported to affect the lower respiratory system in the individuals in Wuhan, China [1–5]. The current name reference reported is Severe Acute Respiratory Syndrome Coronavirus 2 (SARS-CoV-2) [1]. According to the report by WHO, a total of 3,247,117 COVID-19-positive cases and 229,312 COVID-19-related deaths were reported until April 30, 2020, while in India, the numbers were 33,610 cases with 1,075 deaths for the same period. The foremost symptoms of this disease are fever, tightness in the chest, unproductive cough, fatigue, breathing difficulty, lung infection, and in severe cases, pneumonia [1,2,6]. In 2020, Qiang et al. [7] reported a prediction model proposed for the detection of coronavirus infection for early alert. The data for the experimentation, which comprised protein sequences from a total of 2,666 corona virus cases, were collected from the National Genomics Data Center, China. Random forest algorithm was applied to this data, achieving an accuracy of 98.18% and Matthews Correlation Coefficient (MCC) of 0.9638. In the same year, Adhikari et al. [1] discussed the statistics of the spreading of COVID-19 throughout the world. In addition, he discussed the causes, prevention, and control mechanism for COVID-19. The major symptoms as reported for COVID-19 were fever, cough, headache, fatigue, pneumonia, diarrhea, hemoptysis, and dyspnea. Fong et al. [8] reported a critical analysis on the rapid spread of COVID-19 and its impacts. They also provided suggestions regarding the accurate forecasting mechanism. The major problems identified were limited knowledge regarding COVID-19, the uncertainty of the influencing factors, and an insufficient amount of data that is currently available. The results demonstrated that better forecasting outcomes could be achieved through the usage of polynomial neural network with corrective feedback. In 2019, Habib et al. [9] reported an analysis regarding the mortality rate and the other factors associated with the Middle East Respiratory Syndrome Coronavirus (MERS-CoV) infection. The authors discussed and reviewed the confirmed cases documented in hospital records. In the same year, Schoeman et al. [10] studied different coronaviruses along with their envelope proteins and suggested that the envelope protein is basically an integral membrane protein and is involved in the life cycle of the coronaviruses. The authors reviewed the recent progress and the current knowledge in comparison to the previous studies regarding the same. In 2020, Xu et al. [11] discussed the application of Reverse Transcription-Polymerase Chain Reaction (RT-PCR) for the early-stage detection of COVID-19. The authors also implied considering Computed Tomography (CT) imaging of the patients for the diagnosis of the disease. The segmentation was performed using a 3-dimensional (3D) deep learning model, and for experimentation, 618 CT images were selected. The overall accuracy of 86.7% was reported to be achieved. In 2020, Hassanien et al. [12] suggested a novel methodology for early-stage detection of COVID-19. The results indicated that the SVM approach followed by the authors, exhibited high accuracy in the classification of COVID-19-infected lungs. Naudé [13] discussed the role of artificial intelligence in the fight against the COVID-19 pandemic and suggested that artificial intelligence could be useful in providing early warnings, alerts, tracking, prediction, diagnosis, prognosis, treatment, and control of social contact, etc. Ma et al. [14], in their study reported in 2020, discussed the meteorological parameters in relation to COVID-19 and suggested that these were important factors as they studied the correlation between the weather parameters and the COVID-19-related deaths. The data for the meteorological parameters and air pollutants were collected from Wuhan, China, from January 20, 2020, to February 29, 2020. The authors suggested that temperature variation and humidity could affect COVID-19-related mortality. In 2020, Santosh [15] studied the role of artificial intelligence and machine learning in the decision-making process in relation to COVID-19 cases and suggested that there was a requirement of active learning-based cross-population train/test models. Hu et al. [16] discussed COVID-19 along with the causes, influencing parameters, incidence, and prevalence of other diseases. The authors also discussed the impact of other diseases for the prognosis of COVID-19 in a patient. Roy et al. [17] conducted an online survey in order to reveal awareness, attitude, anxiety, and perceived mental health care in the context of the current pandemic situation in the Indian population. The survey received a total of 662 responses. It was inferred that there was an ardent need of spreading awareness regarding mental health issues emerging due to the pandemic. In 2020, Bullock et al. [18] discussed and reviewed the role of artificial intelligence and machine learning methodologies in relation to COVID-19. The authors also reviewed different datasets related to the same. Since machine learning appears to be an important tool in the study of the current pandemic situation, it was decided to consider it for analysis and prediction in the present study as well.
The main objectives of the present study were as follows:
• Study and analysis of the role of machine learning algorithms in relation to the COVID-19 dataset.
• Analysis and prediction of the impact of attributes and their correlation.
• Prediction of the survival status and the probability of death rates.
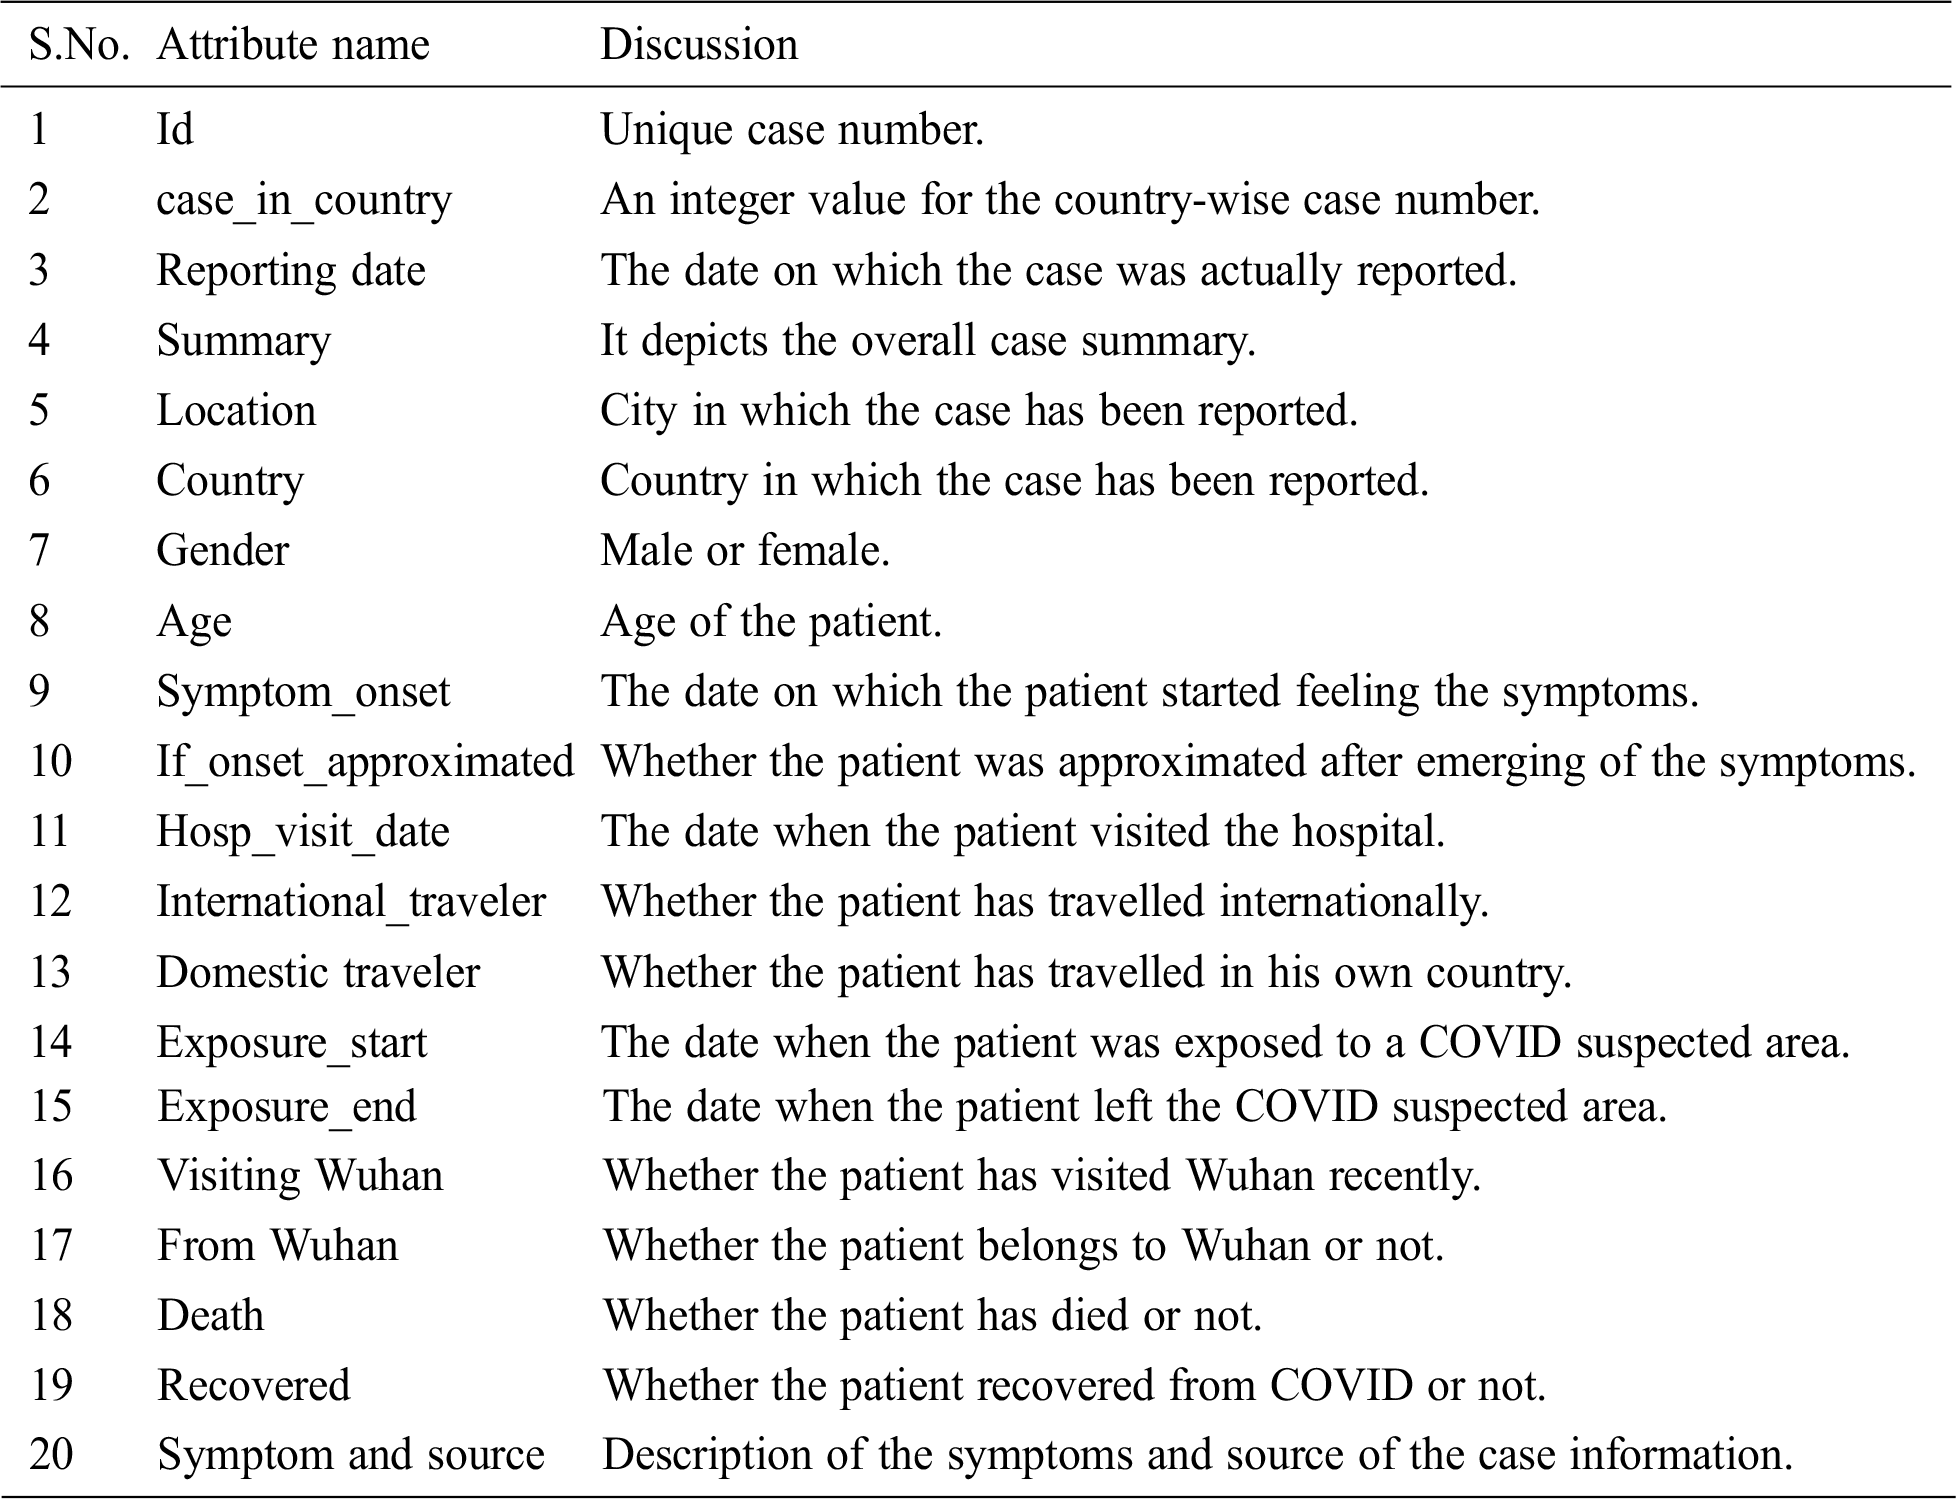
The dataset for experimentation was obtained from the data repository for the COVID-19 visual dashboard operated by the Center for Systems Science and Engineering (CSSE), Johns Hopkins University (JHU) [19]. The dataset comprised data from different countries, with attributes listed in Tab. 1. As of April 20, 2020, there were 3,397 records in the dataset. The dataset contains information regarding individual COVID-19 patients, who, after the onset of the symptoms, were admitted to a hospital and either succumbed to death or somehow recovered from this dreadful disease. In the present study, the dataset was explored to identify the presence of certain patterns among the patients. Using the dataset, the number of days the patients could survive prior to meeting their fate was determined.
Table 1: Dataset attributes discussion
The following algorithms were utilized for developing a machine learning model for accurate prediction and classification from the COVID-19 dataset. Correlation analysis was performed in order to determine the dependent and independent attributes along with their strength of relationships.
2.1 Linear and Non-Linear Regression
Linear regression is nothing more than a representation of a linear model [20,21]. It demonstrates a linear relationship between x and y, where x is the input variable and y is the output variable. Therefore, it is possible to calculate y by substituting the value for x in the linear combination. The linear regression model may be presented as in Eq. (1) provided ahead:

Y: The predicted value
θ0: The intercept
θ1,…,θn: Model parameters
x1, x2,…,xn: Feature values(independent variables)
The simplified model may also be presented as in Eq. (2) provided ahead:

When there is only one independent variable, the representation of Y prediction may be presented as the following (Eq. (3)).
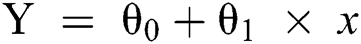
Here, the values for θ0 and θ1 are selected such that the error is minimized.
In the case of only one predictor, the intercept may be calculated as presented in Eq. (4) ahead.
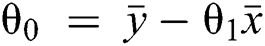
This implies the following:
1. If θ1 > 0, then x and y have a positive relationship, i.e., y will increase with an increase in x.
2. If θ1 < 0, then x and y have a negative relationship, i.e., y will decrease with an increase in x.
3. If x = 0 (not included), the Eq. (5) becomes meaningless and represents beyond-the-scope value.
4. If x = 0 (included), it implies that a0 produced the average of the predicted values.
5. If θ0 (not included), it implies that the prediction and the regression coefficient may be biased.
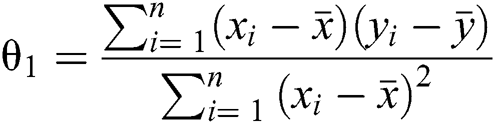
Our goal remains to find out optimal values of all model parameters (θ0,…,θn) in order to fit the model among all data values. When there is a single independent variable or feature, the model will always shape a straight line whereas in presence of more than one feature value, the model is called a hyper plane. Many a times, the dataset shows a curvature plane instead of a straight line (when x in the Eq. (1) either has powers of more than one or in the form of any mathematical function e.g., logarithmic, exponential etc.) then a linear model may not be able to fit properly and instead a non-linear model is chosen to fit using curve fitting.
Logistic regression is used when the target variable is categorical. Therefore, logistic regression is the machine learning algorithm for classification, while linear regression is the regression algorithm for prediction.
The logistic regression model data are based on the logistic or sigmoid function:
If it is considered in terms of Y, as in Eq. (1), as an input to the function g(x), it returns a squashed value h which ranges between 0 and 1.
A threshold value is predicted for mapping it to a discrete class. The threshold stated below may be considered for the mapping.
p ≥ 0.5, class = 1; p < 0.5, class = 0
This implies that the observation is positive if it is greater than or equal to 0.5. On the basis of the above-stated decision delimiters and logistic function, a predefined function could be generated and is presented in Eq. (8) provided ahead.
A Decision Tree (DT) is a tree-like structure constructed for decision modeling and consequences. In a DT, the test of an attribute is denoted by the internal nodes, while the branch denotes the outcome [22,23]. The class labels are denoted by the leaf nodes. DT may be useful in various scenarios as it does not require any domain-specific knowledge for its construction. DTs are also referred to as Classification and Regression Trees (CART).
K-nearest neighbor (KNN) is a classification algorithm that is based on neighbors’ majority [24]. The object assignment in a class is performed on the basis of the nearest neighbor.
Steps in the KNN algorithm:
Step 1: Data loading and initialization of K. K denotes the number of neighbors.
Step 2: Calculation and addition of the distance in ascending order.
Step 3: Selection of the first K entries from the collection sorted, as suggested in Step 2.
Step 4: Among the selected K entries, select the first K entries.
Step 5: In the case of regression, the mean of the K labels is returned, while K labels are returned in the case of classification.
Support Vector Machine (SVM) is a classification and regression algorithm which is basically a supervised machine-learning model. SVM has been used for two-group classification problems [25]; these are hypothesis and the loss function. The main aim of SVM is to identify a hyperplane from the number of features or the N-dimension space. The purpose is to classify the data points distinctly. Therefore, for an input x, it is required to maximize the width w. This is presented in Eq. (9) provided ahead.
w.x + b ≥ 1, for all x of class 1
w.x + b ≤ −1 for all x of class 2
In terms of reproducing kernel Hilbert space [26], this may be expressed as presented in Eq. (10) and (11).
where ||f||_k^2 represents the reproducing kernel Hilbert space, the kernel is denoted by k, and A is a constant.
There are other hyper-parameters, for example, gamma values, which could be fine-tuned to improve the performance of the model by identifying the best combination of parameters. However, the process of identifying optimal hyper-parameter is complex. One way to approach this is to create a grid of hyper-parameters and just attempt all the possible combinations of these hyper-parameters. This method is referred to as the grid search method. This method may be useful in the over-fitting problem [27]. Both SVM and SVM with grid search were employed in the present study for classification. The complete flowchart of the proposed framework is presented in Fig. 1.
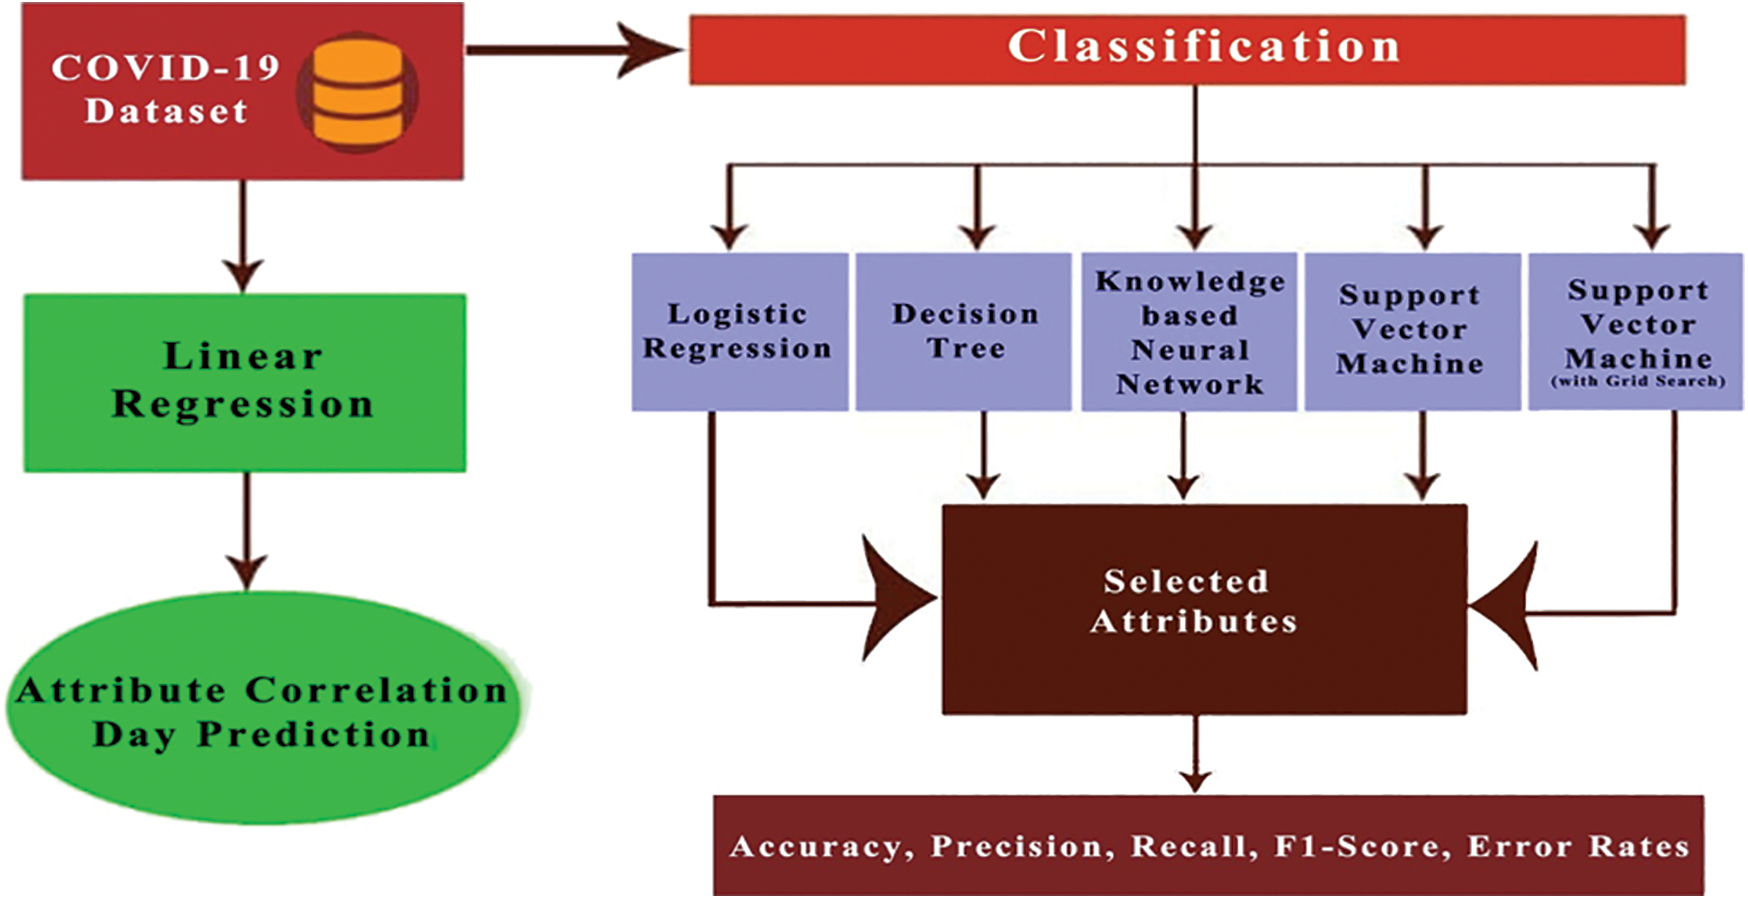
Figure 1: Flowchart of the proposed work
The following steps were performed in the above-discussed approaches.
Step 1: Data cleaning: The dataset included a few null values in certain columns, which were managed by dropping the rows corresponding to those columns, as these values could not be replaced with any other significant values.
Step 2: Feature selection: Since the dataset contained multiple columns, this step comprised the selection of those significant columns which would later be used for classification and regression analysis.
Step 3: Train–test split: The dataset was randomly divided into train data and test data. The test data considered for analysis and verification in the present study ranged between 15% and 40%.
Step 4: Fitting/Train the model: A particular classification algorithm was selected with its optimal parameters, and was used to train the model.
Step 5: Testing the model: The model was applied to the test data, and the accuracy of the model was determined by analyzing the produced confusion matrix.
Step 6: Model evaluation: The model was evaluated by calculating the error metrics.
Step 7: Model prediction: The model was applied to sample data, and the predicted value was verified.
This section discusses the results of linear and logistic regression, DT, KNN, SVM, and SVM with Grid search applied to the above-stated dataset.
3.1 Result Based on Linear Regression
Fig. 2 depicts a grid of axes such that each of the numeric variables in the data along the y-axis is across a single row, and that along the x-axis is across a single column. The grid demonstrates the correlation among the selected independent variables. The diagonal axes present the univariate distribution of the data for the variable in that column, and fits a kernel density estimate encoding of the observations along one axis and height along the other axis. With the exception of days and age columns, all the other columns are categorical columns; therefore, the pair plot between age and days is significant in the whole pair plot. The correlation between age and death demonstrated that the maximum number of patients who died belonged to the age group of 45 and above. As the patient age increases, the number of days of survival reduces for most of the patients. It was observed that, on average, the risk period for the patients was 12–14 days, beyond which the chances of survival of the patient might increase.
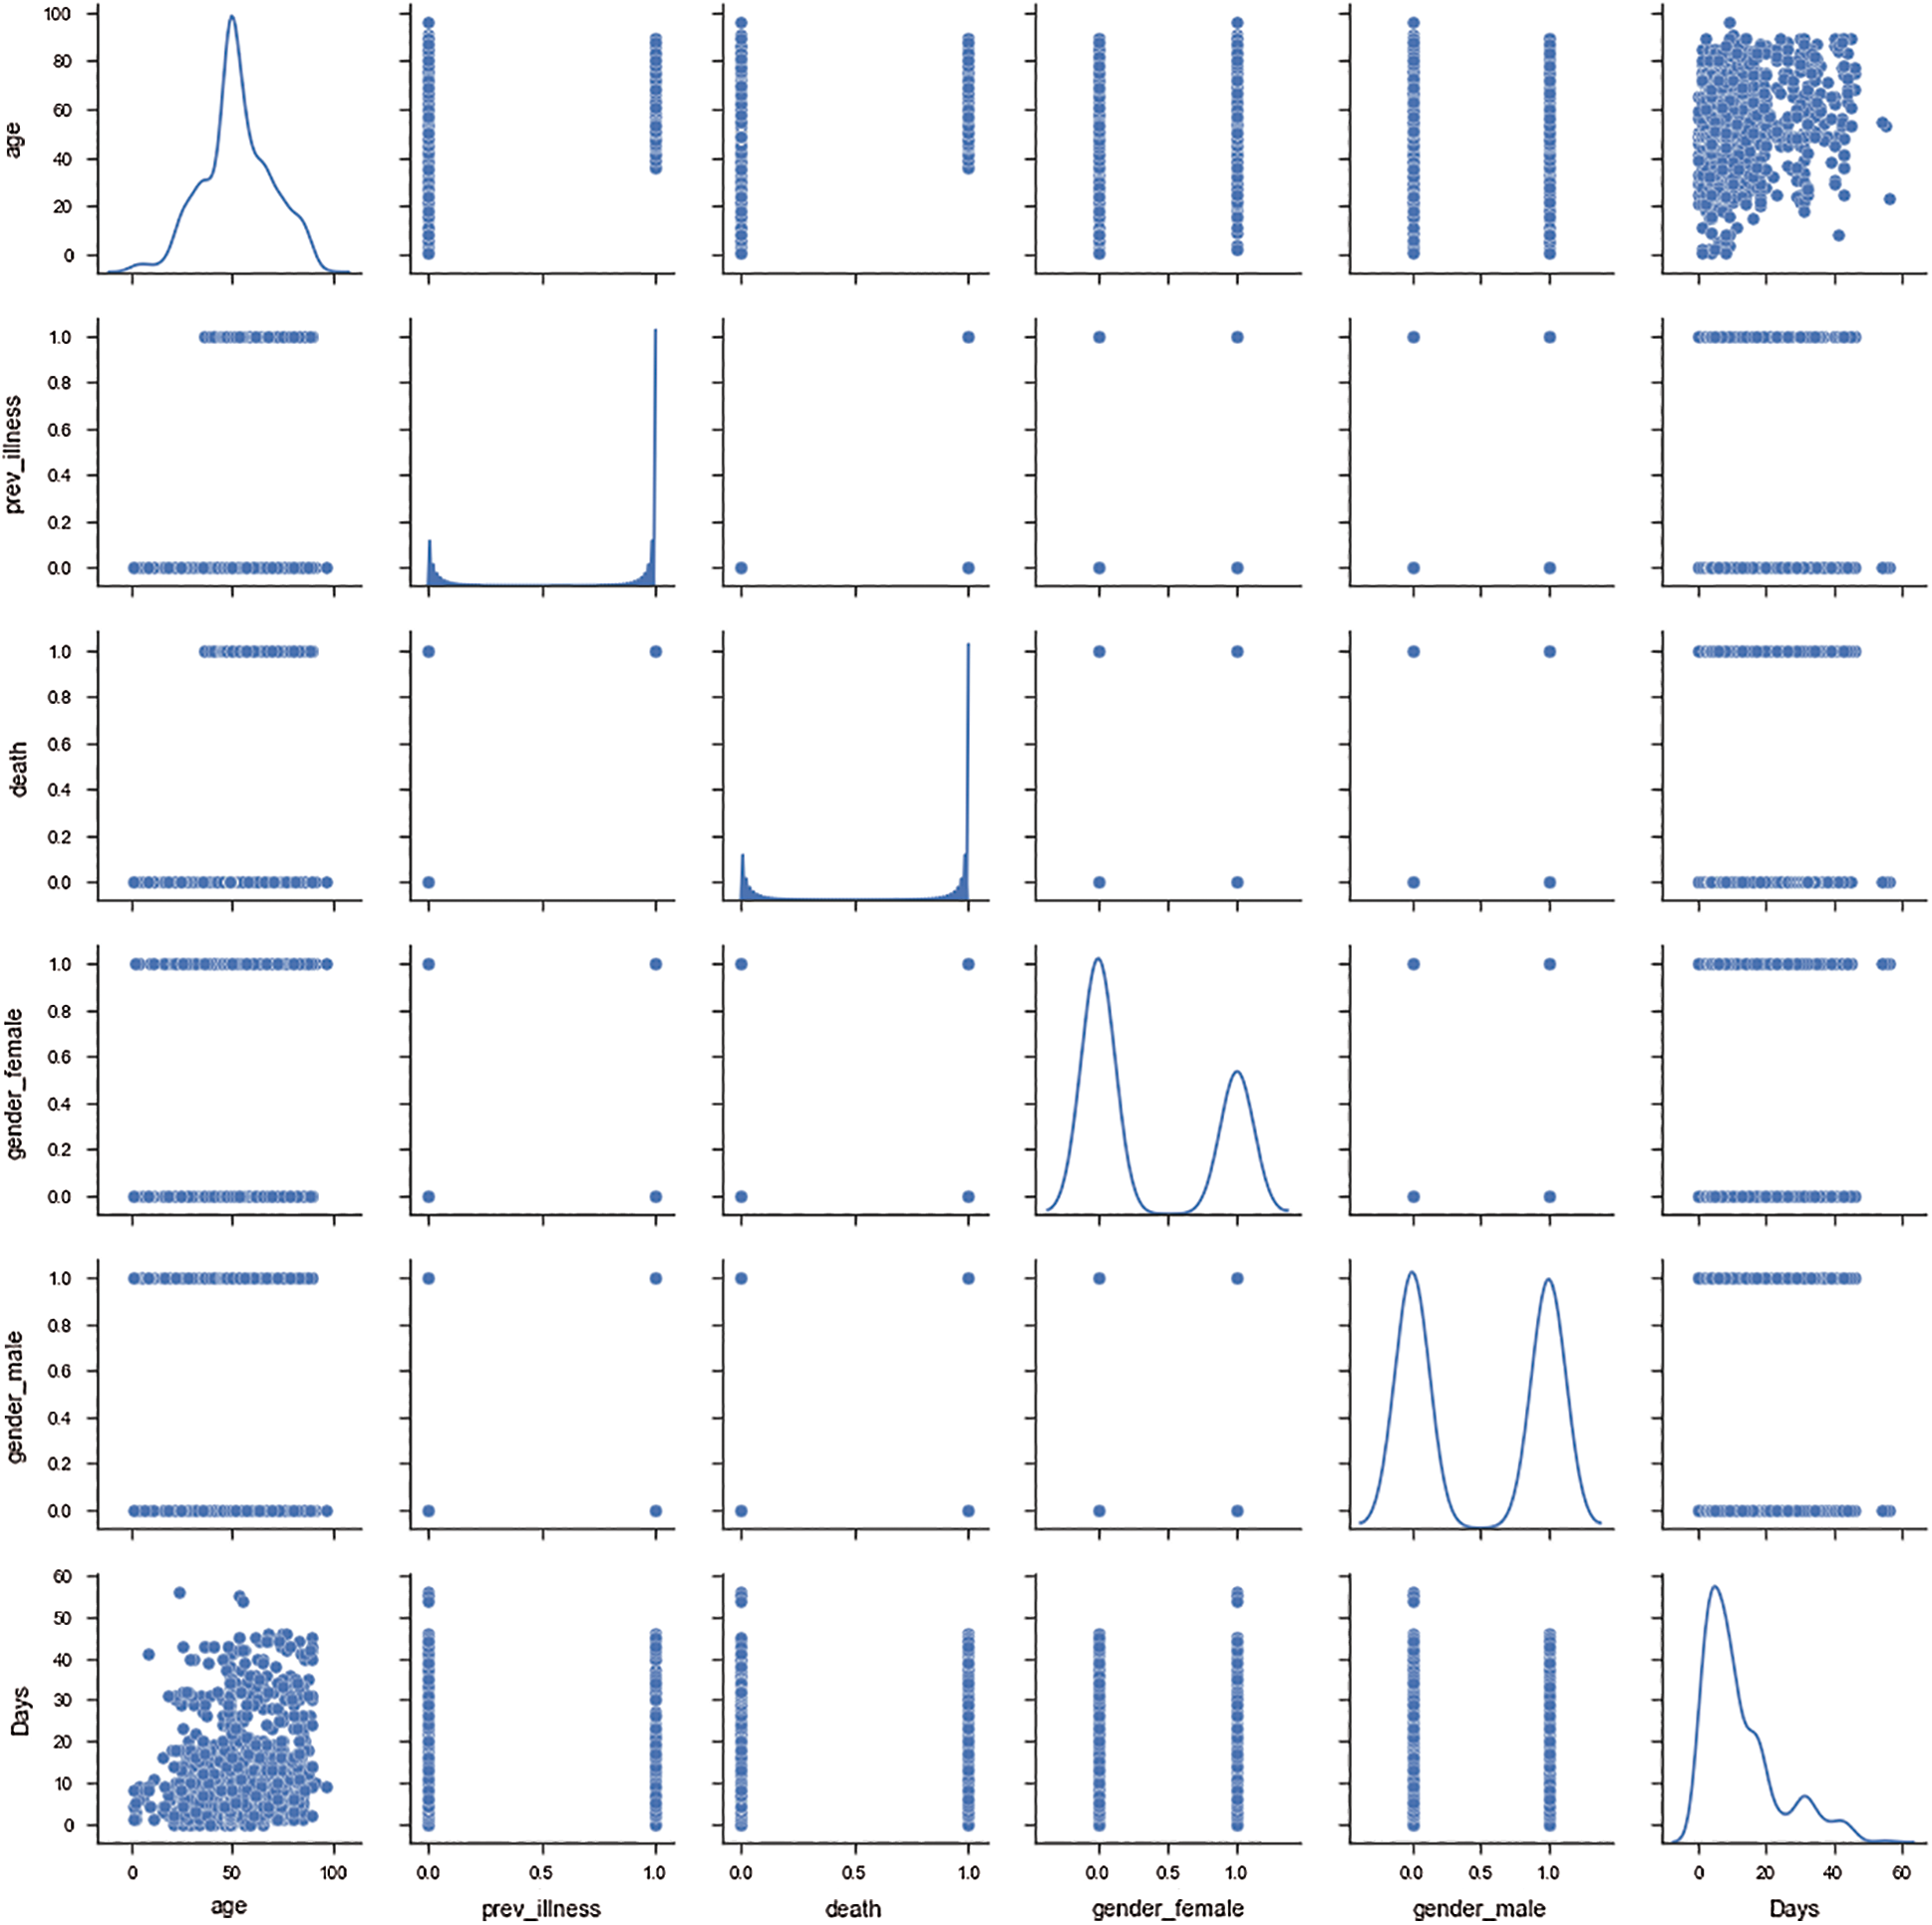
Figure 2: Correlation between different independent attributes
Positive and negative correlation findings were deduced and are presented in Tab. 2, while Tab. 3 presents the interpretations based on these correlations. The correlation coefficient between age and death was 0.38, implying that with an increase of 1% in the age, the death probability would increase by approximately 38%. The correlation coefficient between death and Previous Illness History (PIH) was 0.79, implying that with an increase of 1% in the age, the death probability would increase by approximately 79%. Gender of the individual presented a negligible correlation with death; nonetheless, according to the data, there is a lesser probability of death in females compared to males.
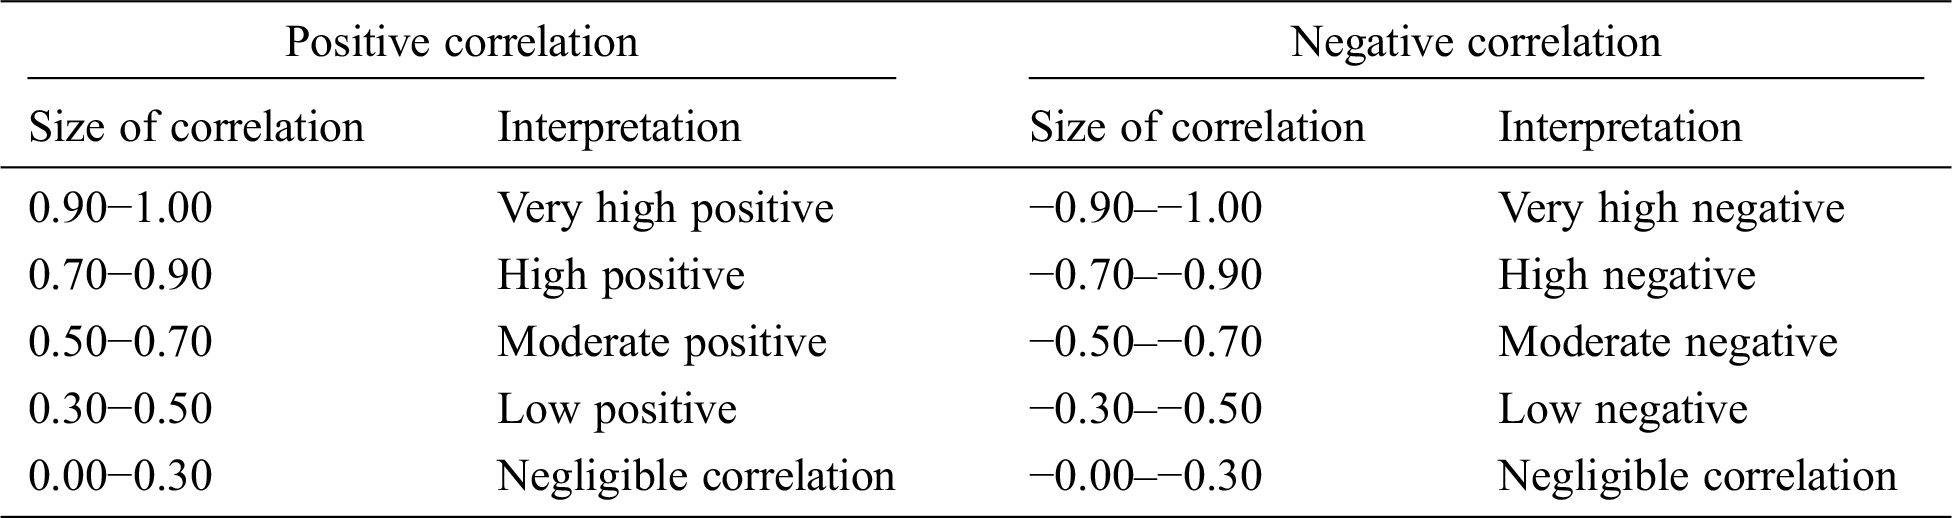
Table 2: Positive and negative correlation between different attributes
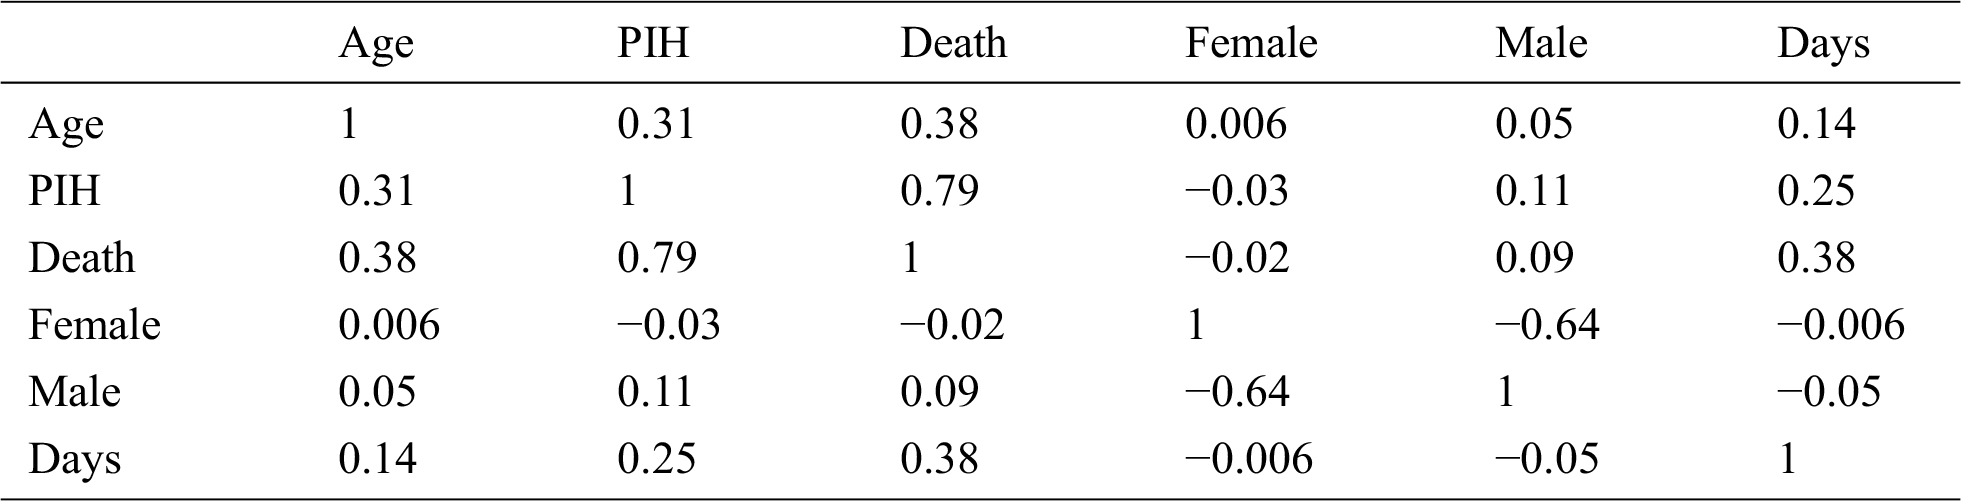
Table 3: Implications of positive and negative correlation between different attributes
On the basis of these findings, a model for bed allocation system was developed for hospitals. This model was based on x1 (prev_illness), x2 (gender_female), x3 (gender_male), and x4 (age) parameters. The regression model is presented below.

The implications are presented in Fig. 3. The bed allocation system is presented in Fig. 4. The chances of survival for a female patient were high after approximately 16 days, while in the case of a male patient, the chances of survival were high after approximately 18 days. Therefore, after this number of days specific to the gender of the patients, the patients could be discharged according to the test results. This would also be convenient in terms of bed release for admitting new patients. ‘O’ denotes the occupied bed and ‘F’ denotes the free bed. In addition, retesting from time to time is recommended. The plot between gender and days revealed that most of the male patients could survive a minimum of 8 days and a maximum of 18 days, while the minimum number of days of survival for the female patients was 3 and they could survive hardly up to 15 days. This relationship could also be explained by the other factors in the dataset, such as the presence of PIH. Another fact that could be inferred from the dataset was that the female patients constituted approximately 42% of the complete dataset, while the remaining 58% were male patients.
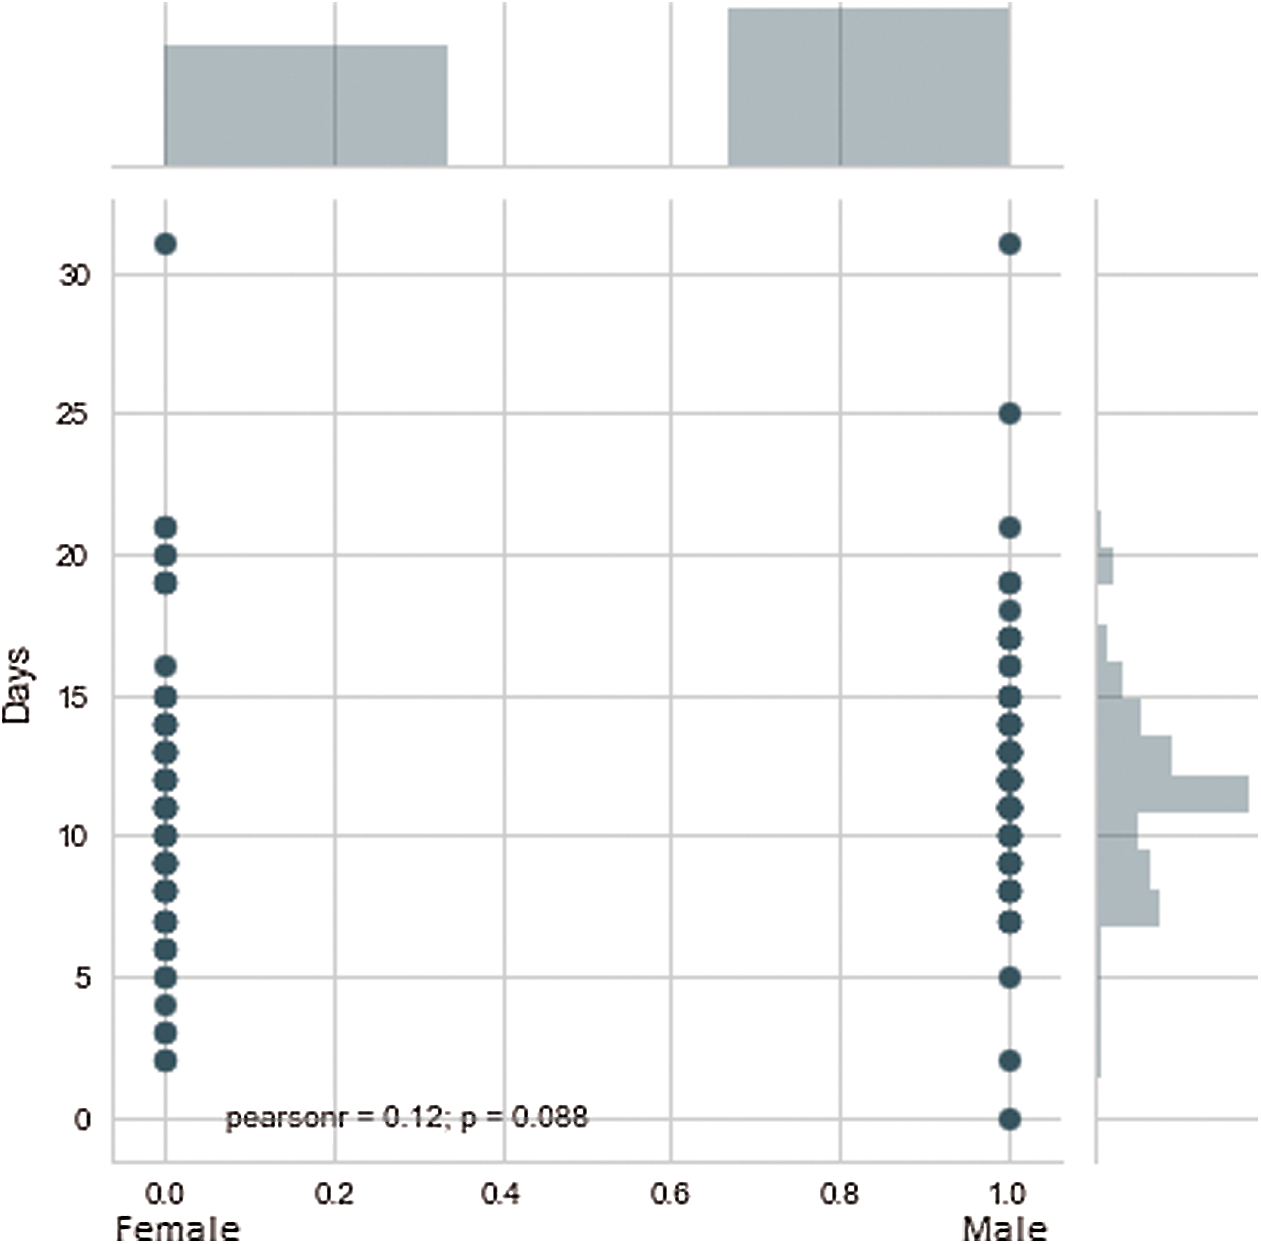
Figure 3: Model implications for the number of days in case of males and females
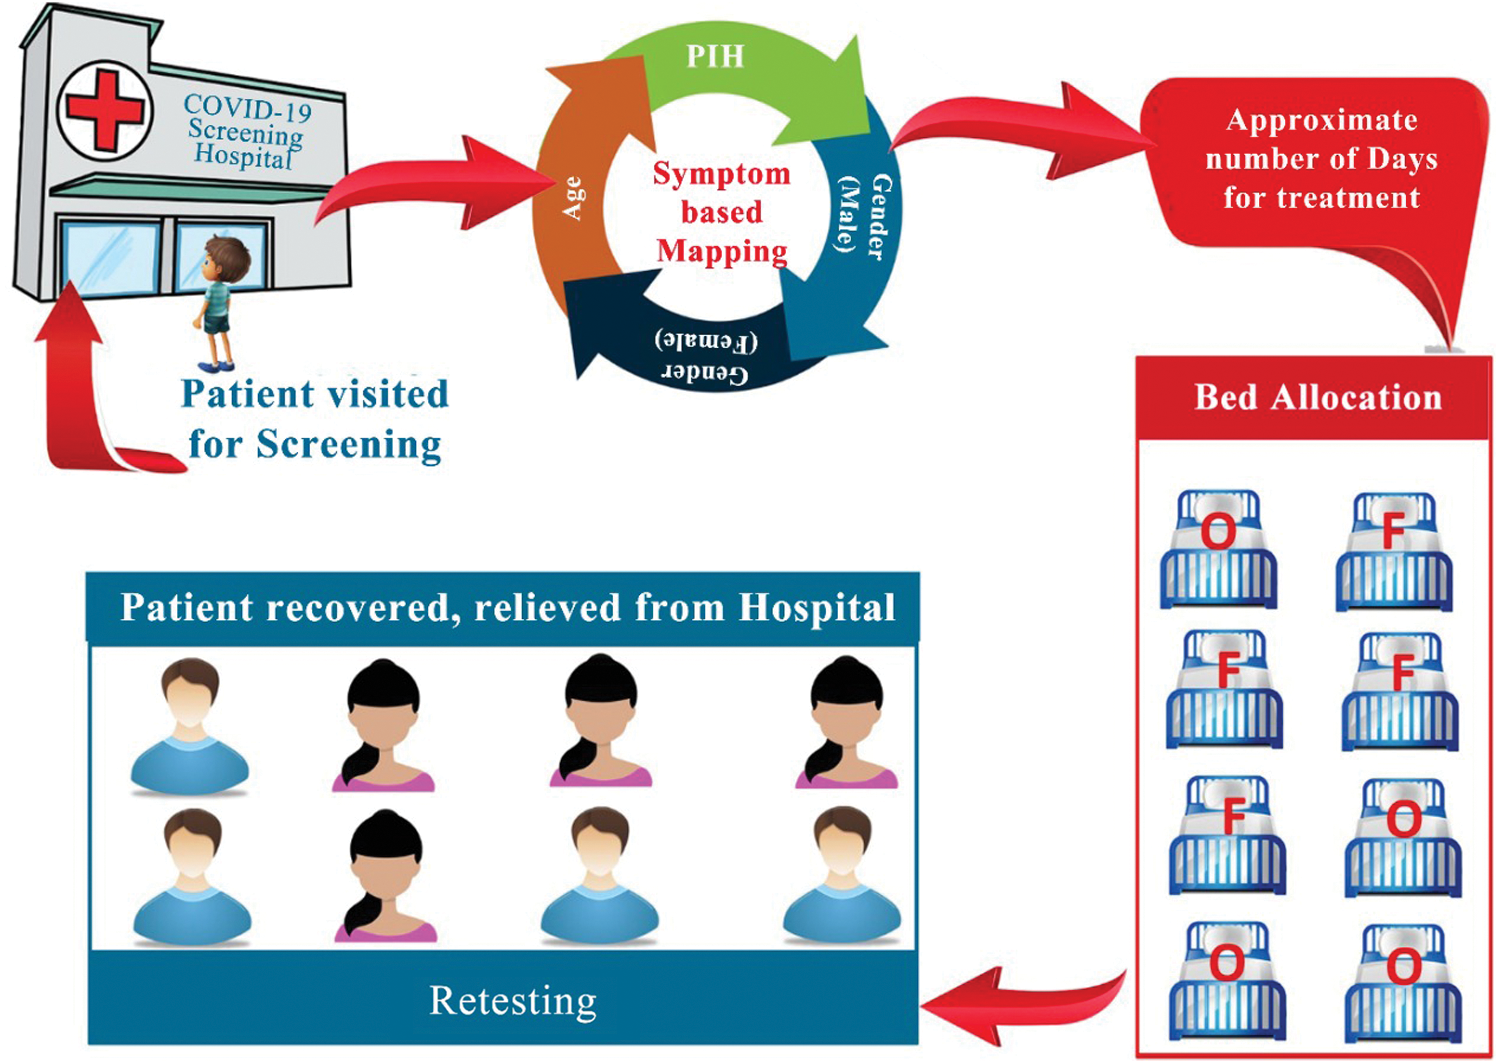
Figure 4: Bed allocation system based on the regression model
Fig. 5 presents the predicted value for days when the sample inputs were fed to the proposed model. The sample inputs comprised the patients’ PIH, their gender (Male or Female), and their age. It was indicated that the patients of COVID-19 exhibited the highest number of days for the treatment when there was no PIH. In addition, it was observed that the approximate number of days for the treatment was reduced for older individuals. Both these findings, when taken together, imply that the older patients who also have PIH would exhibit lesser number of days for the treatment. This also implies that the chances of survival for such patients were less. Another inference from these results comes out that female patients exhibit better chances of survival compared to male patients.
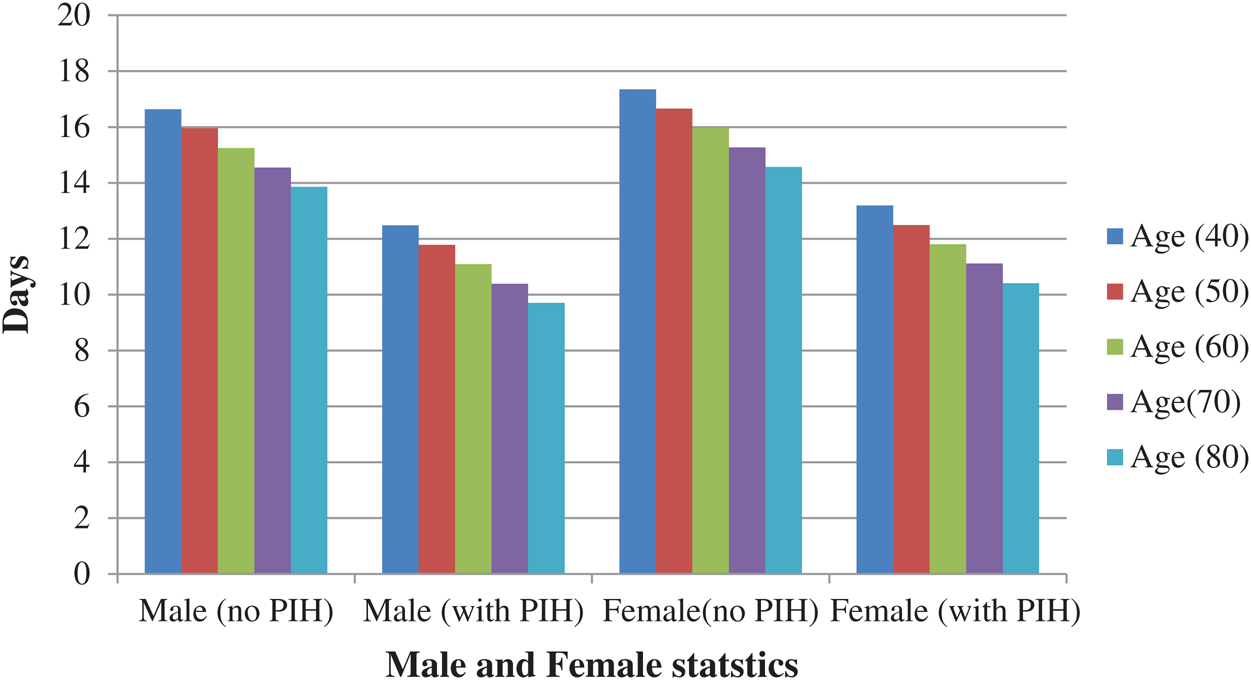
Figure 5: Approximate number of days of treatment in case of males and females (with and without PIH)
3.2 Model Accuracy and Evaluation
The performance of the model was evaluated on the basis of the following measures:
Accuracy: The ratio of predicted implications to total implications.
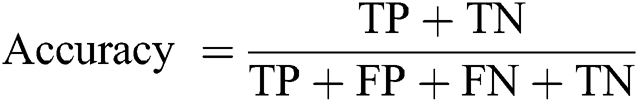
where, TP denotes true positive, TN represents true negative, FP represents false positive, and FN denotes false negative.
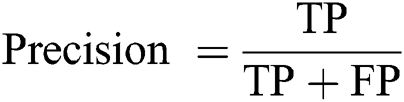
Precision: The ratio of predicted positive implications to total positive implications.
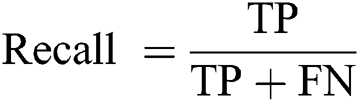
Recall (Sensitivity): The ratio of predicted positive implications to all implications in the actual class—yes.
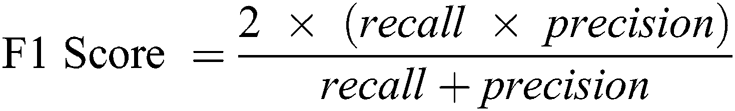
F1-Score: This score is calculated on the basis of precision and the recall weighted average.
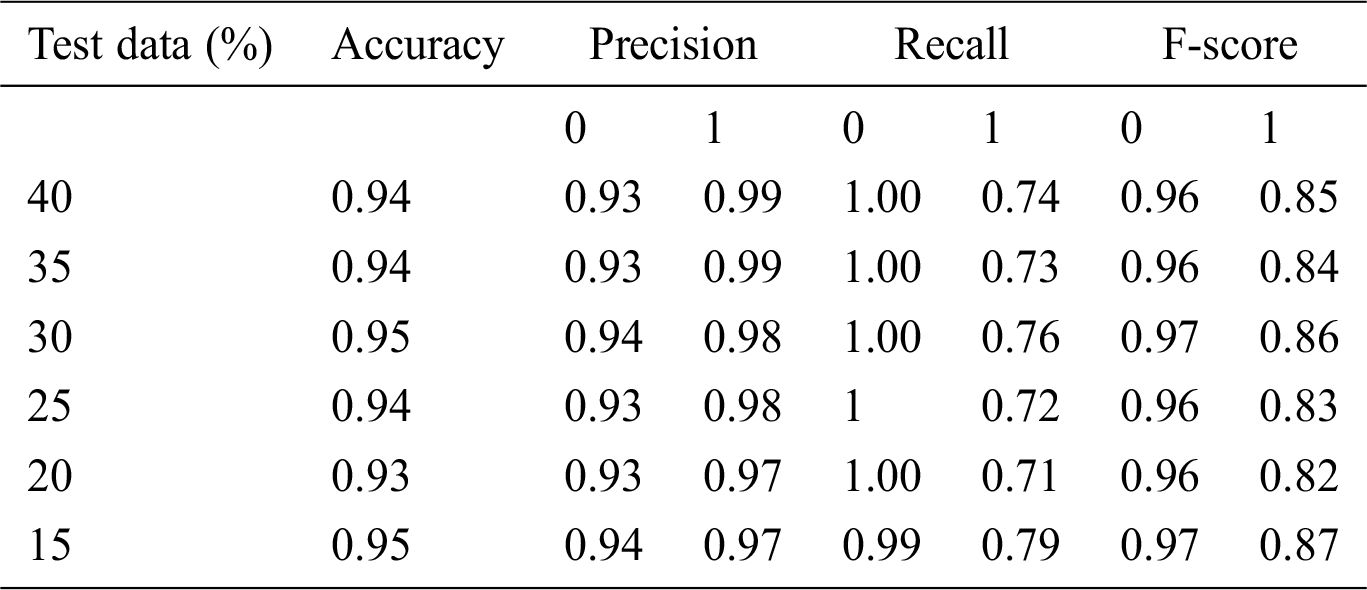
Here, 0 and 1 represent the live status and dead status. Tabs. 4–8 present the values for accuracy, precision, recall, and F-score obtained using logistic regression, DT, KNN, SVM, and SVM with Grid search. The test data considered here were 15%–40%. In the case of KNN, different values of K were considered running for n times for the selection of K, for which the error was minimized. The mean values for the count of false predictions in each prediction performed by the classifier were recorded as error rates and were visualized (Fig. 6). The value of K was also cross-verified using K-means cross-validation. As evident from the figure (Fig. 6), the error rate was lowest for k = 15, which was eventually selected for the classifier. Fig. 7 presents the comparison of all the five models in terms of predicting the chances of death for a COVID-19 patient on the basis of the input characteristics of the patient. The same random seed was selected for all the algorithms for a fair comparison. A comparison of the average accuracy values among all the models was performed and plotted accordingly. It is evident that SVM with Grid search presented the highest accuracy of approximately 95%, followed by the decision tree with an accuracy of approximately 94%.
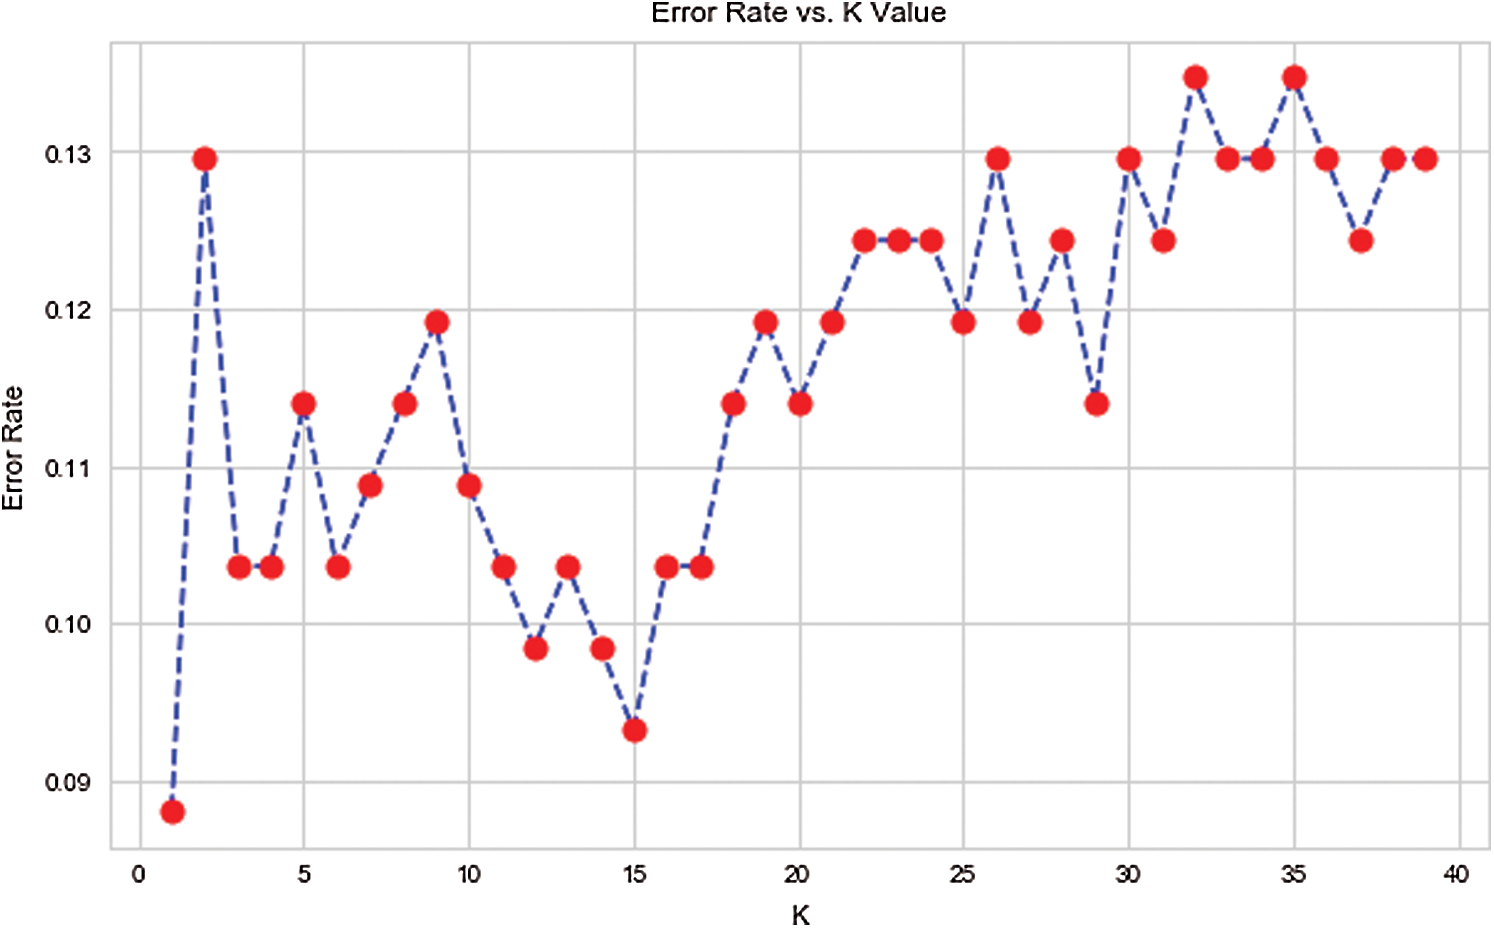
Figure 6: Error rate and K value in case of KNN
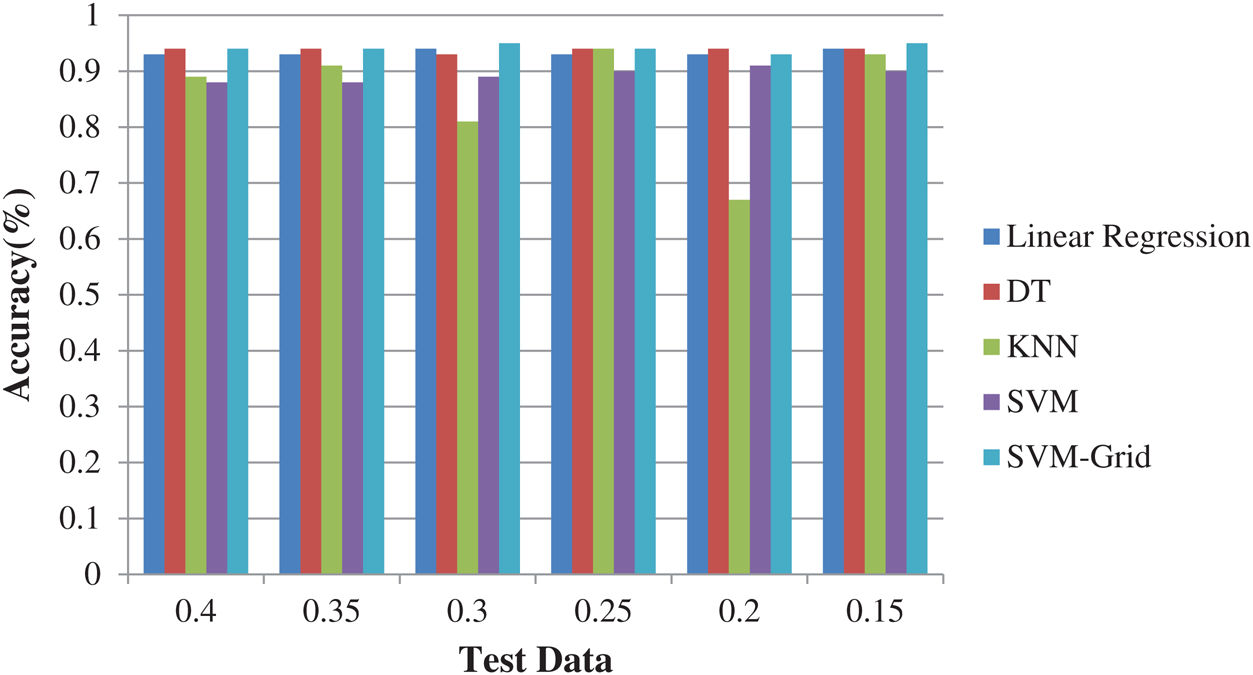
Figure 7: Comparison of algorithms
Table 4: Accuracy obtained based on logistic regression
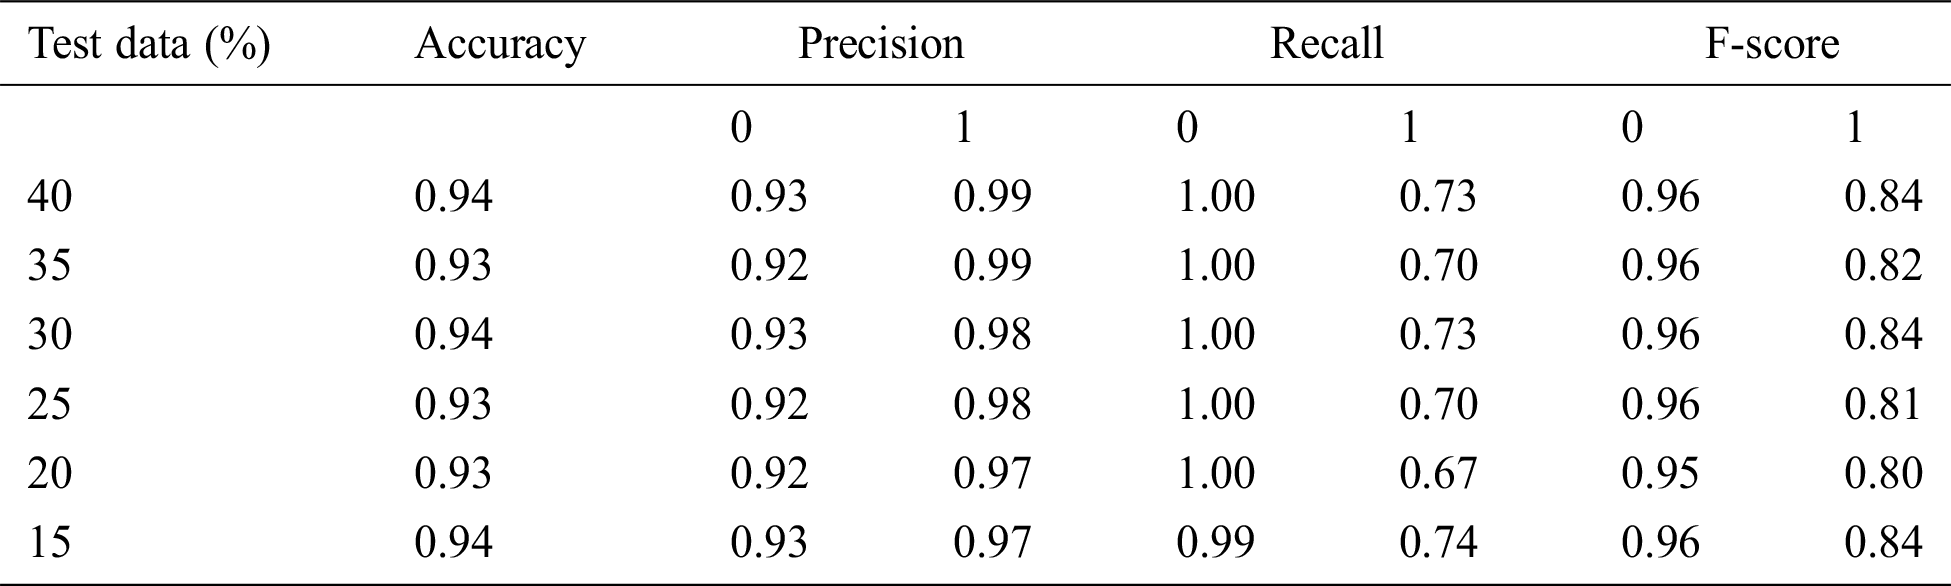
Table 5: Accuracy obtained based on DT
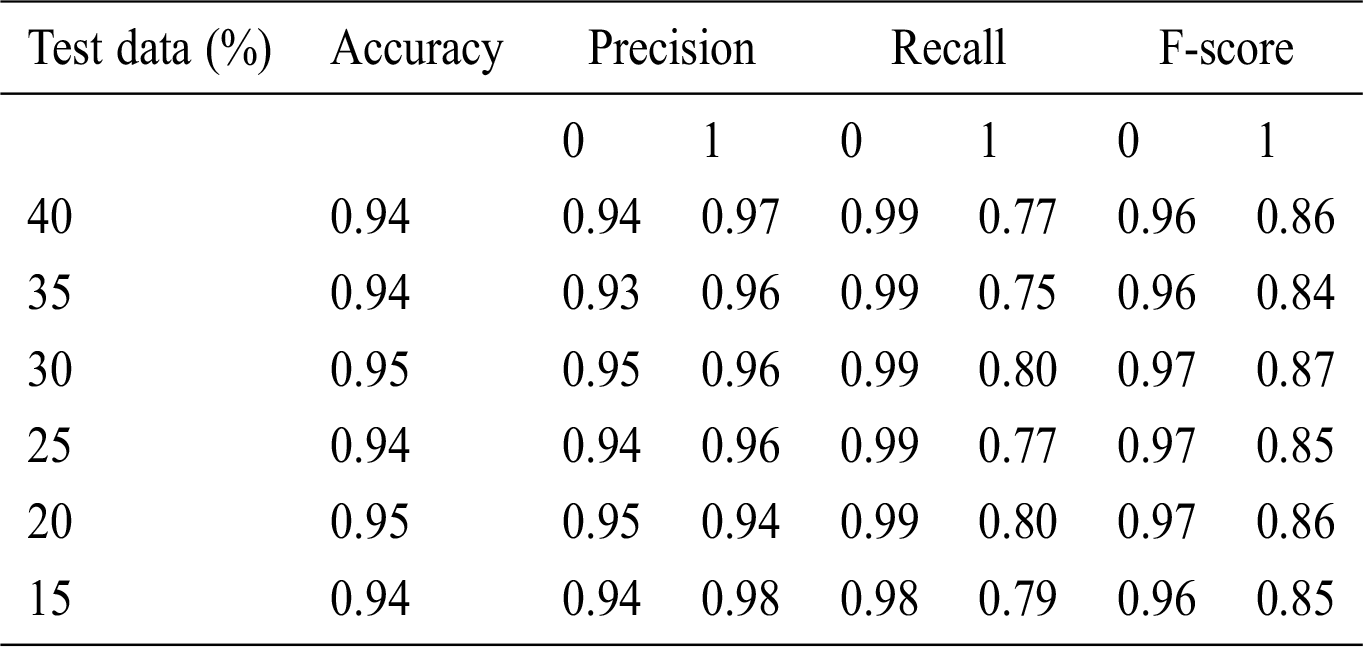
Table 6: Accuracy obtained based on KNN

Table 7: Accuracy obtained based on SVM
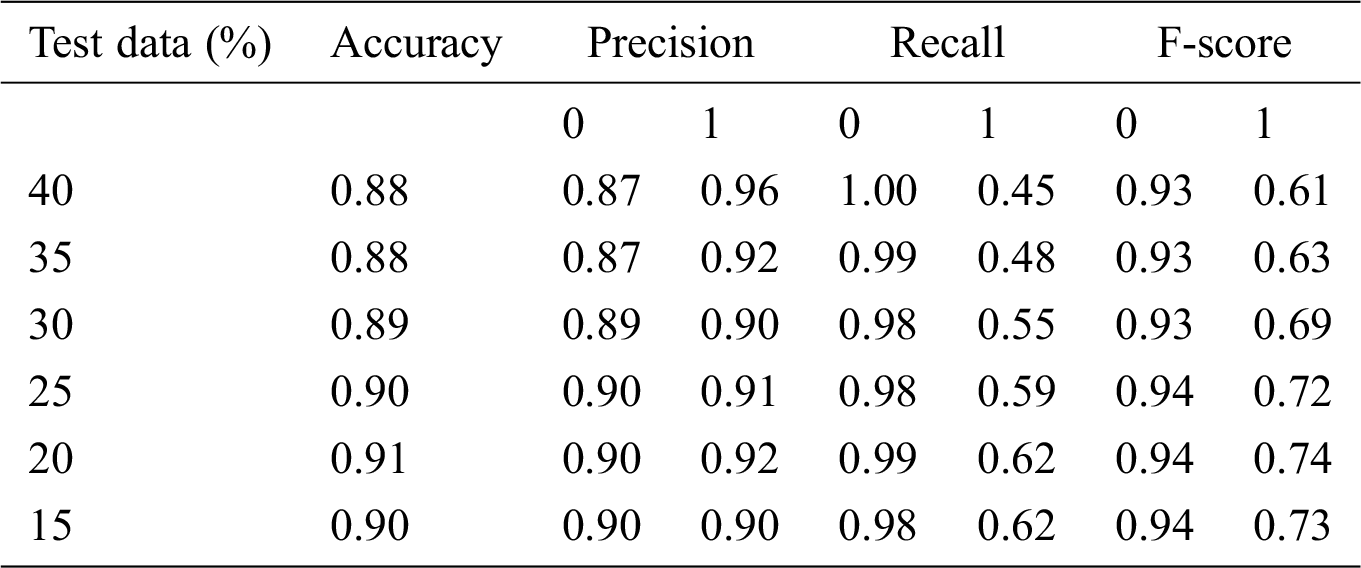
Table 8: Accuracy obtained based on SVM with Grid search
Root Mean-Squared Error (RMSE) and Mean Absolute Scaled Error (MASE) were used for model error rate evaluation. RMSE demonstrates underestimation and overestimation within the same pattern, while MASE is beneficial for relative accuracy. A lower value of error implies a better fit.
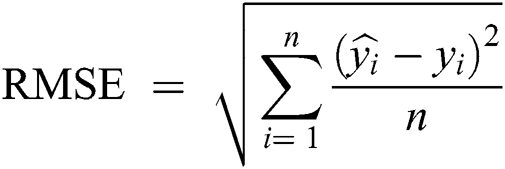
yi = Observed values
n = Number of observations
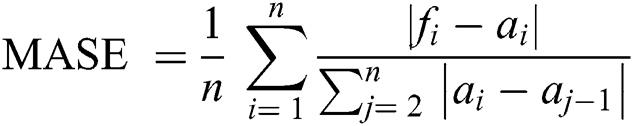
ai = Actual time series
fi = Forecast results
The error rate presented in Fig. 8 also suggests that SVM with Grid search was the most efficient, followed by DT.
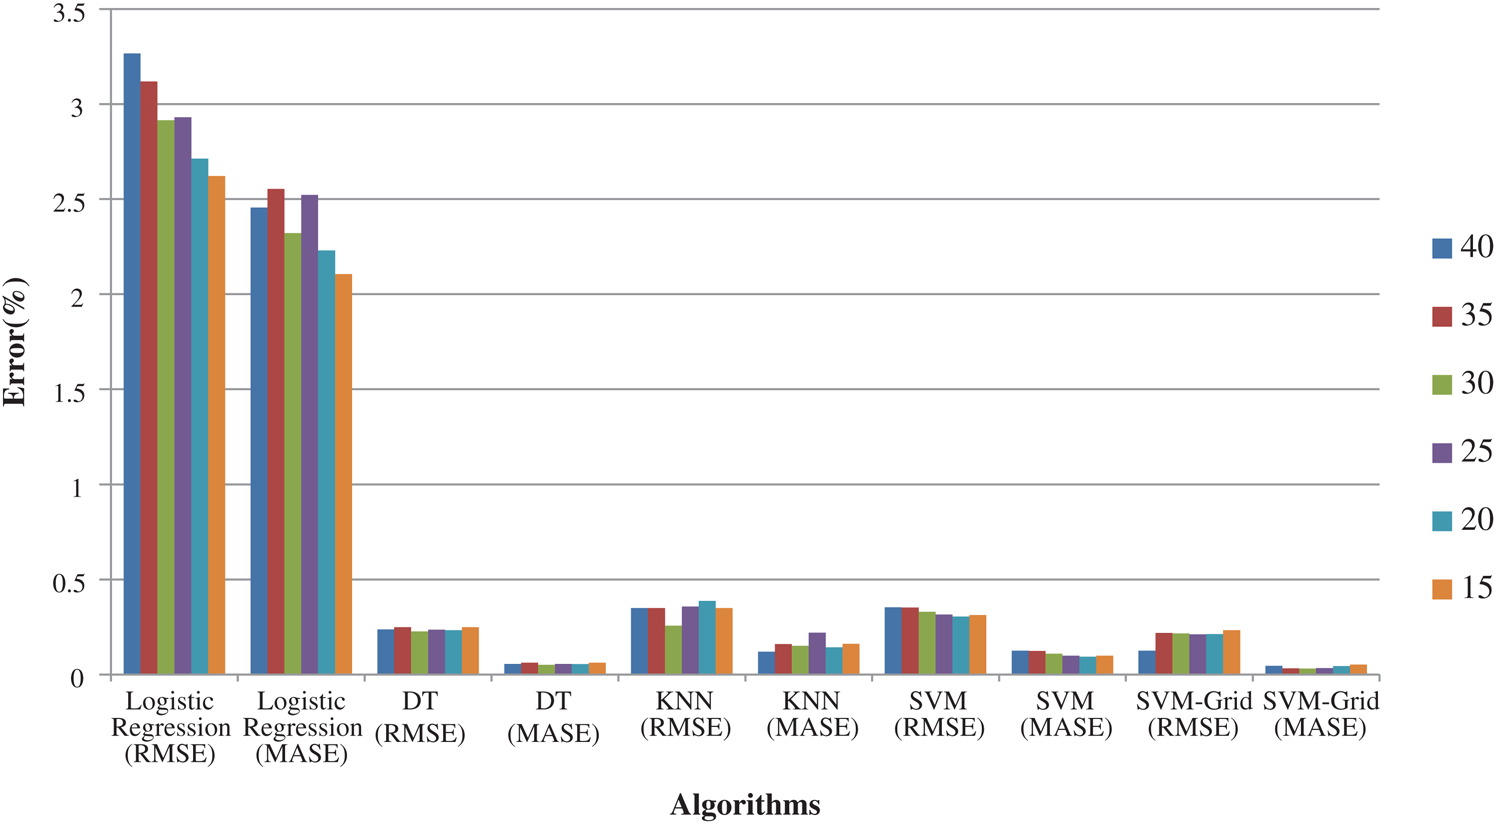
Figure 8: Logistic regression, DT, KNN, SVM and SVM-Grid based error rate comparison
The key findings of the present study are as follows:
1. The results indicated that, on average, the risk period for the patients was 12–14 days, beyond which the chances of survival of the patient may increase.
2. The main attributes affecting the prediction and classification were PIH, gender, and the number of days.
3. The chances of survival for a female patient were high after approximately 16 days, while in the case of a male patient, the chances of survival were high after approximately 18 days.
4. The results indicated that the patients of COVID-19 exhibited the highest number of days for the treatment when there was no PIH. In addition, female patients were indicated to have a higher number of days for treatment compared to male patients.
5. It was inferred that even though the virus could attack males mostly, probably because males were more exposed to the virus because of being at places of work or outside of their homes to earn their livelihood, nonetheless, the immunity level of male patients was higher than that of the female patients.
6. Finally, it was indicated that machine learning algorithms were capable of providing prediction and classification in relation to COVID-19 as well. SVM with Grid search has observed to be the most efficient in this regard, followed by DT.
Despite promising results, the present study also has certain limitations. The first one remains the limited availability of data related to COVID-19 patients. The information regarding the attributes varies continually, and updation in the dataset is quite possible in the future. Therefore, few results may vary accordingly. However, that would not critically alter the impact of the important attributes, such as age, PIH, and gender, as these have already been considered individually as well as in association with other attributes. Also, if the number of countries, affected by the COVID-19 virus, increase, results may vary further. Currently, the impact is limited, as the country’s association is limited. Finally, it must be stated that further research is required to elucidate how a hybrid combination of different computational methods could be formed and used in order to provide the most effective outcomes when used in combination.
The present report discusses the current scenario due to the COVID-19 pandemic in terms of the current statistics, the major symptoms exhibited by the patients, and its impact on the survival and the death rates. The machine learning algorithms, such as linear as well as non-linear regression, logistic regression, DT, KNN, SVM, and SVM with Grid search, have been considered for the purposes of classification and prediction in relation to COVID-19. The present report discusses three main attributes: PIH, gender, and the number of days. The dataset considered in the present study was obtained from CSSE, JHU. The results of experimentation indicated that the chances of death are higher in the case of PIH and patients older in age. On the basis of these attributes, the average number of treatment days after which the chances of survival may increase for the patient could be calculated. In addition, it was indicated that females exhibit lesser chances of death compared to males. The SVM with Grid search outperformed all the other algorithms studied, in terms of classification accuracy.
Funding Statement: The author(s) received no specific funding for this study.
Conflicts of Interest: The authors declare that they have no conflicts of interest to report regarding the present study.
1. S. P. Adhikari, S. Meng, Y. Wu, Y. Mao, R. Ye. (2020). et al., “Epidemiology, causes, clinical manifestation and diagnosis, prevention and control of coronavirus disease (COVID-19) during the early outbreak period: A scoping review,” Infectious Diseases of Poverty, vol. 9, no. 1, pp. 1–12. [Google Scholar]
2. X. Jiang, M. Coffee, A. Bari, J. Wang, X. Jiang. (2020). et al., “Towards an artificial intelligence framework for data-driven prediction of Coronavirus clinical severity,” Computers, Materials & Continua, vol. 63, no. 1, pp. 537–551. [Google Scholar]
3. Q. Li, X. Guan, P. Wu, X. Wang, L. Zhou. (2020). et al., “Early transmission dynamics in Wuhan, China, of novel coronavirus-infected pneumonia,” New England Journal of Medicine, vol. 382, no. 13, pp. 1199–1207.
4. CDC. (2020). “Novel coronavirus, Wuhan, China,” . [Online]. Available: https://www.cdc.gov/coronavirus/2019-nCoV/summary.html.
5. N. Zhu, D. Zhang, W. Wang, X. Li, B. Yang. (2020). et al., “A novel coronavirus from patients with pneumonia in China, 2019,” New England Journal of Medicine, vol. 382, no. 8, pp. 727–733. [Google Scholar]
6. F. Wu, S. Zhao, B. Yu, Y. M. Chen, W. Wang. (2020). et al., “A new coronavirus associated with human respiratory disease in China,” Nature, vol. 579, no. 7798, pp. 265–269. [Google Scholar]
7. X. L. Qiang, P. Xu, G. Fang, W. B. Liu and Z. Kou. (2020). “Using the spike protein feature to predict infection risk and monitor the evolutionary dynamic of coronavirus,” Infectious Diseases of Poverty, vol. 9, no. 1, pp. 1–8. [Google Scholar]
8. S. J. Fong, G. Li, N. Dey, R. G. Crespo and E. Herrera-Viedma. (2020). “Finding an accurate early forecasting model from small dataset: a case of 2019-ncov novel coronavirus outbreak,” International Journal of Interactive Multimedia and Artificial Intelligence, vol. 6, no. 1, pp. 132–140. [Google Scholar]
9. A. M. Habib, M. A. Ali, B. R. Zouaoui, M. A. Taha and B. S. Mohammed. (2019). “Clinical outcomes among hospital patients with Middle East respiratory syndrome coronavirus (MERS-CoV) infection,” BMC Infectious Diseases, vol. 19, no. 1, pp. 1–6. [Google Scholar]
10. D. Schoeman and B. C. Fielding. (2019). “Coronavirus envelope protein: Current knowledge,” Virology Journal, vol. 16, no. 1, pp. 1–22. [Google Scholar]
11. X. Xu, X. Jiang, C. Ma, P. Du, X. Li. (2020). et al., “A deep learning system to screen coronavirus disease 2019 pneumonia,” Engineering, pp. 1–8. [Google Scholar]
12. A. E. Hassanien, L. N. Mahdy, K. A. Ezzat, H. H. Elmousalami and H. A. Ella. (2020). “Automatic x-ray COVID-19 lung image classification system based on multi-level thresholding and support vector machine,” MedRxiv, [Preprint]. [Google Scholar]
13. W. Naudé. (2020). “Artificial intelligence against COVID-19: An early review,” . [Online]. Available: https://www.econstor.eu/bitstream/10419/216422/1/dp13110.pdf. [Google Scholar]
14. Y. Ma, Y. Zhao, J. Liu, X. He, B. Wang. (2020). et al., “Effects of temperature variation and humidity on the death of COVID-19 in Wuhan, China,” Science of the Total Environment, vol. 724, no. 1, pp. 1–7. [Google Scholar]
15. K. C. Santosh. (2020). “AI-driven tools for coronavirus outbreak: Need of active learning and cross-population train/test models on multitudinal/multimodal data,” Journal of Medical Systems, vol. 44, no. 5, pp. 1–5. [Google Scholar]
16. Y. Hu, J. Sun, Z. Dai, H. Deng, X. Li. (2020). et al., “Prevalence and severity of corona virus disease 2019 (COVID-19A systematic review and meta-analysis,” Journal of Clinical Virology, vol. 127, pp. 1–7. [Google Scholar]
17. D. Roy, S. Tripathy, S. K. Kar, N. Sharma, S. K. Verma. (2020). et al., “Study of knowledge, attitude, anxiety & perceived mental healthcare need in Indian population during COVID-19 pandemic,” Asian Journal of Psychiatry, vol. 51, pp. 1–7. [Google Scholar]
18. J. Bullock, K. H. Pham, C. S. Lam and M. Luengo-Oroz. (2020). “Mapping the landscape of artificial intelligence applications against COVID-19,” arXiv preprint, arXiv:2003.11336. [Google Scholar]
19. https://www.kaggle.com/anjanatiha/corona-virus-time-series-dataset. [Google Scholar]
20. S. Sperandei. (2014). “Understanding logistic regression analysis,” Biochemia Medica, vol. 24, no. 1, pp. 12–18. [Google Scholar]
21. J. C. Stoltzfus. (2011). “Logistic regression: A brief primer,” Academic Emergency Medicine, vol. 18, no. 10, pp. 1099–1104. [Google Scholar]
22. Y. Zhong. (2016). “The analysis of cases based on decision tree,” in Proc. IEEE, ICSESS, Beijing, China, pp. 142–147. [Google Scholar]
23. H. Yang and S. Fong. (2011). “Optimized very fast decision tree with balanced classification accuracy and compact tree size,” in Proc. IEEE, ICMIA, Macao, China, pp. 57–64. [Google Scholar]
24. Z. Chen, L. J. Zhou, L. X. Da, J. N. Zhang and W. J. Huo. (2020). “The lao text classification method based on KNN,” Procedia Computer Science, vol. 166, pp. 523–528. [Google Scholar]
25. G. N. Kouziokas. (2020). “SVM kernel based on particle swarm optimized vector and Bayesian optimized SVM in atmospheric particulate matter forecasting,” Applied Soft Computing, vol. 93, pp. 1–18. [Google Scholar]
26. M. J. Safari, S. R. Arashloo and A. D. Mehr. (2020). “Rainfall-runoff modeling through regression in the reproducing kernel Hilbert space algorithm,” Journal of Hydrology, vol. 587, pp. 1–12. [Google Scholar]
27. S. Mutasa, S. Sun and R. Ha. (2020). “Understanding artificial intelligence based radiology studies: What is overfitting,” Clinical Imaging, vol. 65, pp. 96–99. [Google Scholar]
 | This work is licensed under a Creative Commons Attribution 4.0 International License, which permits unrestricted use, distribution, and reproduction in any medium, provided the original work is properly cited. |