DOI:10.32604/cmc.2020.012398
| Computers, Materials & Continua DOI:10.32604/cmc.2020.012398 | |
| Article |
Deep Learning Based Intelligent and Sustainable Smart Healthcare Application in Cloud-Centric IoT
1Department of Information Technology, St. Peters College of Engineering and Technology, Chennai, 600054, India
2Department of Information Technology, RMD Engineering College, Chennai, 601206, India
3Department of Computer Science and Engineering, Kalasalingam Academy of Research and Education, Krishnankoil, 626128, India
4Department of Computer Science and Engineering, Sphoorthy Engineering College, Hyderabad, 501510, India
5Department of Electrical and Electronics Engineering, J B Institute of Engineering and Technology, Hyderabad, 500075, India
6Department of Entrepreneurship and Logistics, Plekhanov Russian University of Economics, Moscow, 117997, Russia
7Department of Logistics, State University of Management, Moscow, 109542, Russia
*Corresponding Author: Denis A. Pustokhin. Email: dpustokhin@yandex.ru
Received: 29 June 2020; Accepted: 28 July 2020
Abstract: Recent developments in information technology can be attributed to the development of smart cities which act as a key enabler for next-generation intelligent systems to improve security, reliability, and efficiency. The healthcare sector becomes advantageous and offers different ways to manage patient information in order to improve healthcare service quality. The futuristic sustainable computing solutions in e-healthcare applications depend upon Internet of Things (IoT) in cloud computing environment. The energy consumed during data communication from IoT devices to cloud server is significantly high and it needs to be reduced with the help of clustering techniques. The current research article presents a new Oppositional Glowworm Swarm Optimization (OGSO) algorithm-based clustering with Deep Neural Network (DNN) called OGSO-DNN model for distributed healthcare systems. The OGSO algorithm was applied in this study to select the Cluster Heads (CHs) from the available IoT devices. The selected CHs transmit the data to cloud server, which then executes DNN-based classification process for healthcare diagnosis. An extensive simulation analysis was carried out utilizing a student perspective healthcare data generated from UCI repository and IoT devices to forecast the severity level of the disease among students. The proposed OGSO-DNN model outperformed previous methods by attaining the maximum average sensitivity of 96.956%, specificity of 95.076%, the accuracy of 95.764% and F-score value of 96.888%.
Keywords: IoT devices; healthcare; deep learning; energy efficiency; glowworm swarm optimization
In recent times, the smart cities started offering sophisticated and customized services to end users. At the same time, there can be various security and privacy challenges that pose threat to users in the near future. It is noted that smart, sustainable, secure, and energy-efficient computing architectural models are the essential need for the present smart city environment. Internet of Things (IoT) mainly concentrates on linking the world through smart machines or objects with ability to gather and distribute diverse types of data at any place and anytime. By allocating exclusive identification for every object in the system, IoT enables the people to lead a modern and secure lifestyle. In healthcare industry, IoT has been mainly applied to obtain healthcare data in a rapid manner. IoT is defined as an interlinked network that connects numerous tools to develop large-scale data which needs to be employed simultaneously.
Healthcare organizations should be able to interchange the information among each other to report the issue and enhance the working function. Health-based data gains more significance in these firms to offer good healthcare facilities to patients. The health data exchange among these companies is named ‘Health Information Exchange (HIE),’ which has been the universal criteria [1]. Though HIE is not a new method in health sector, it requires annual reinvention to adapt to the recent technical developments and modifications that take place in the atmosphere [2]. The medical data of every patient gets saved in external as well as digital databases. Therefore, if a patient decides to transfer to novel healthcare sectors, the latter is not constrained with the directory which has been applied to derive the recorded patient’s data anywhere and anytime. The problem of inaccessibility of medical data may lead to unwanted strategies, repeated sampling, and many other issues like immediate drug response.
In line with the study conducted by Tharmalingam et al. [3], Canada has massive complications in HIE such as tedious systems, absence of knowledge about the place of patient’s medical data and absence of permission to apply the data standards which enables the replacement of medical data. There are few non-technical obstacles such as care burden, problems associated with the patient, different business concepts, less knowledge about strategies as well as lack of competing merits. The fast proliferation of modern devices provides unprecedented options for patients and health care experts to digitally replace the health data [4]. IoT is a modern approach to combine all the modern devices into the system. Besides, IoT is also deemed as a universal data structure that enables the latest facilities by exchanging devices, based on previous and interoperable data as well as communication schemes [5]. Hence, it is defined as a set of various opportunities, provided for the medical centers like resource optimization by automatic workflows and tremendous process. For example, many clinics apply IoT facilities for asset management, balancing humidity, temperature inside the living rooms, etc [6]. The set of health information can provide numerous advantages of interdisciplinary healthcare collaboration. It aims at a personal fitness plan in the absence of compatibility and extensibility between smart devices and the business paradigm. Compatibility is defined as data exchange, communication as well as computation events. Also, there is a robust requirement for effective management and interlinking of objects. Therefore, the compatibility problem has emerged among heterogeneous devices which must be considered into assumption and reported for communication issues [7].
Fig. 1 depict the revolution of medical sectors in an IoT-enabled hospital. The patient would have an ID card which is used for scanning and it is connected to protect the cloud that saves the digital health data, lab results, medical and treatment records. IoT provides various advantages for health sectors like remote health observation, fitness programs, chronic infections, and child care. Moreover, it facilities distribution and management of data among human-machines under the application ‘Internet’ through ubiquitous sensors [8]. Hence, diverse medical tools, sensors, diagnostic and imaging gadgets could be viewed as intelligent devices as the kernel portion of IoT. The IoT-relied e-Health observation model would assist in limiting the number of doctor visits whereas the physicians could monitor the patients directly. Unfortunately, this model could not be successfully applied in the last few decades; the method is not capable of dealing real-time applications. The e-Health solutions, offered by IoT tools, are highly accurate and considered in the evolution of IoT business landscape that gives diverse options as well as problems for the organization [9].
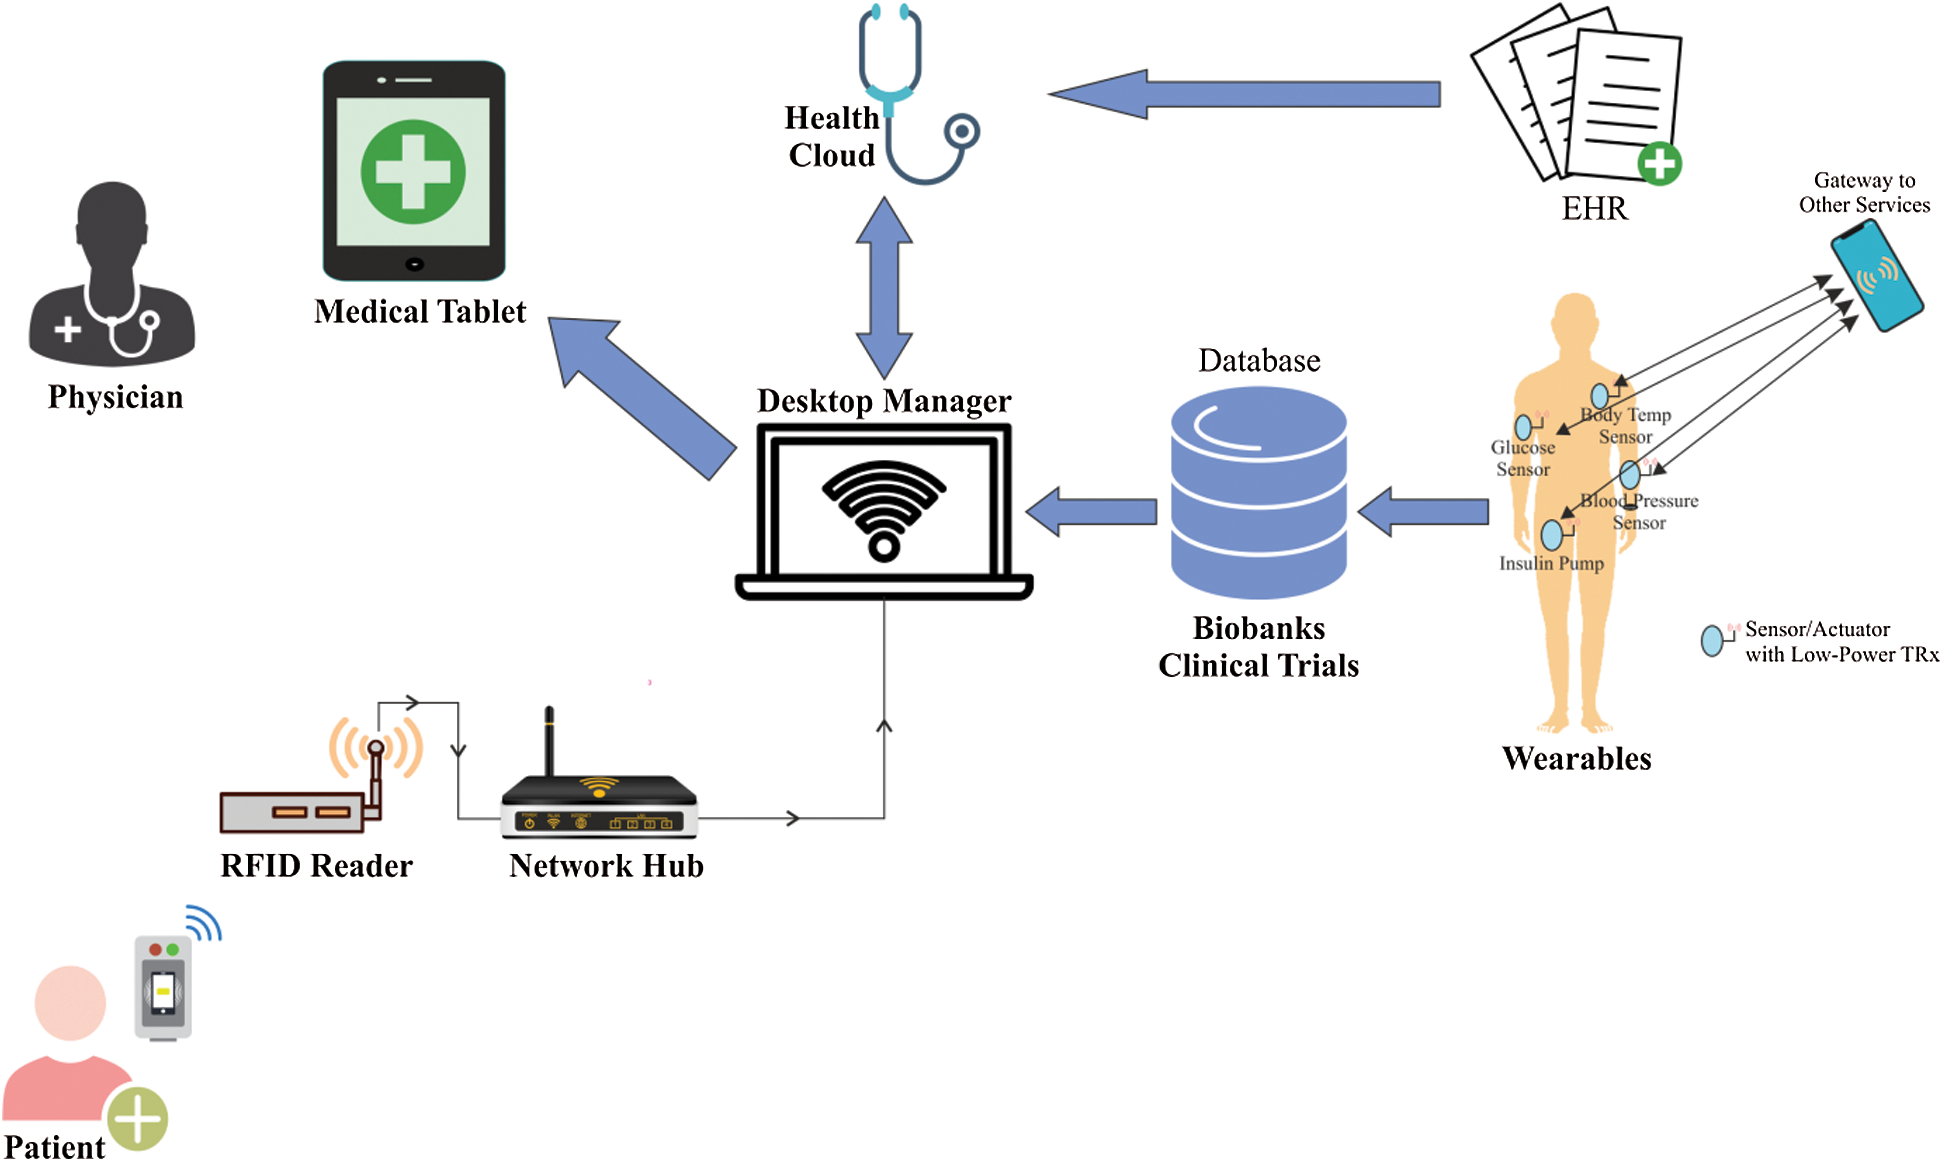
Figure 1: An IoT-based healthcare system—An overview
The sensor model and the automatic data collection process enable passive monitoring at a psychological condition that considers both patients who suffer from acute and chronic disease and their caretakers [10]. Such types of sensors could be employed in patient observation state, monitoring regular functions, and critical care of chronic disease patients [11]. This data provides the treatment which remains the proof according to the data attained from sensors and monitoring events. These technological deployments are collected to provide improved comfort, satisfaction, and better control to enhance the individual's lifetime.
Tyagi et al. [12] deployed a cloud IoT-based healthcare approach. They presented Platform as a Service (PaaS) and Infrastructure as a Service (IaaS) that guide the patients in cost cutting by enabling them save and distribute the health data to healthcare firms in a protective manner. Gathering data from objects, tools, as well as massive sources, come up with significant issue. The patients are categorized as patients with selective treatment while emergency patients require adverse treatment. Numerous mobile health sectors are being operated offline which are combined into semantic web models for e-Health facilities. Datta et al. [13] projected machine-to-machine (M3) model that activates the maintenance of modern, linked, and personalized healthcare and facilities for modern buildings.
Prayoga et al. [14] conducted a study in which they regularly sampled, used, confined, and verified the Technology Acceptance Model (TAM) as the major technique employed in Greater Jakarta to find that these variables are applicable to detect the aim of a user and concatenate it into a theoretical concept. Jagatheesan et al. [15] defined various sensors with diverse applications from every manufacturer that was not preferred by the customers. Hence, the study presented Multiple Producer Multiple Consumer (MPMC) system which collects human interfaces to manage the portion of data distribution.
The developers examined a diabetic patient who had been admitted in emergency. The IoT interaction approach was deployed as a major activation of distributed healthcare domains. The major objective in this method is observed by patients, doctors, and shared databases. Manashty et al. [16] concentrated on occupying the space among signs and diagnostic trend data to detect the health abnormalities accurately. Sheriff et al. [17] developed a reference approach for healthcare data through a combination of IoT, Complex Event Processing (CEP) as well as big data analytics. Pir et al. [18] followed the HMIS approach with content awareness to model the management systems of modern hospitals on the basis of IoT.
In spite of diverse enhancements, deep learning (DL) models have arouse as an effective tool to handle big data. It is derived from the traditional artificial neural network (ANN) with multiple hidden perceptron layers which assists in the identification of the hidden patterns. The core concept of DL lies in the replication of how the human brain works. Therefore, in IoT based network, the DL model receives the input from the sensors and repeatedly sends it to the next layers till the required outcome is achieved.
Though the earlier works have been focused on healthcare, still there is a need to develop new optimization algorithms for achieving energy efficiency among the IoT devices. The IoT devices demand high amount of energy when transferring the patient data to cloud server. So, the clustering process is applied to achieve energy efficiency. In this view, the current research article presents a new OGSO algorithm-based clustering with DNN called OGSO-DNN model. The oppositional based learning process is incorporated into GSO algorithm to increase the convergence rate. The OGSO method was used to select Cluster Heads (CHs) from the available IoT devices. Then, the DNN-based classification process gets executed to identify the presence of disease and the severity level.
The upcoming portions of the paper are organized as follows. The OGSO-DNN model is elaborated in Section 2. Followed by, the performance validation of OGSO-DNN is done in Section 3, and the paper is concluded in Section 4.
The presented method operates on three major subsystems such as user subsystem, cloud subsystem, and alert subsystem. Initially, the user subsystem contributes to data acquisition process, under the application of IoT medical devices from an individual. Simultaneously, the OGSO-DNN algorithm is implemented to collect the information from IoT devices and choose an appropriate CH. Followed by, the CHs transmit the sensed information from IoT devices to gateway devices and cloud subsystem. Consequently, the cloud subsystem is used for disease analysis that is conducted by applying DNN which helps in the detection of disease with diverse stages of severity and finally it produces an alert system. The entire process involved in the newly developed approach is shown in the Fig. 2.
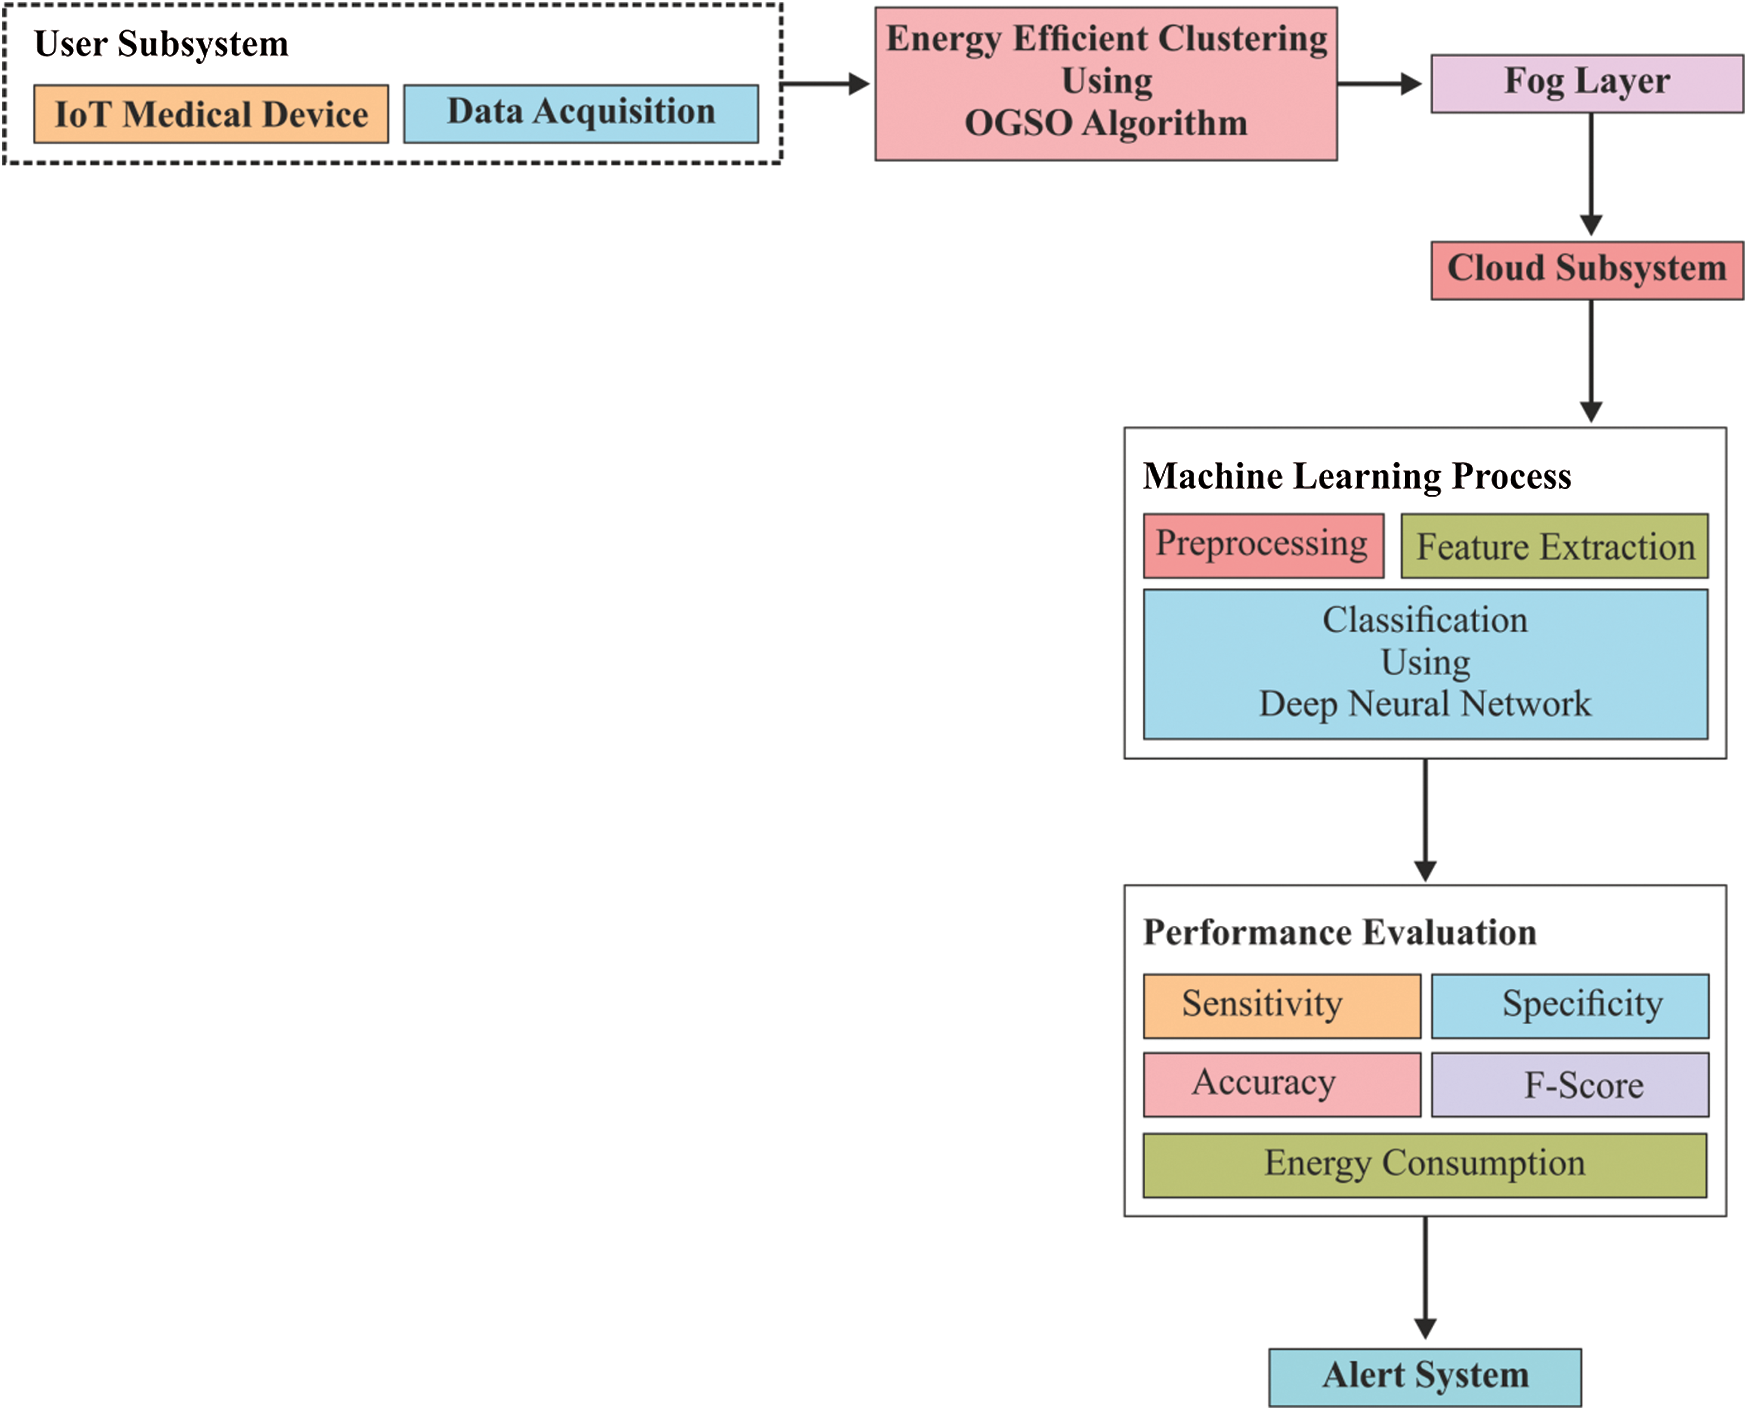
Figure 2: The Block diagram of OGSO-DNN model
The patient's health records are gathered by applying a data acquisition approach which activates a seamless integration of smart, less-power sensors, and medical devices. These sensors are placed across the entire human body either externally or internally to monitor the person’s actions. Here, a user's body sensor network is enclosed with wearable as well as inbuilt sensors. All sensors are combined with bio-sensors namely, ECG, EEG, Blood Pressure (BP), and so on. The sensor nodes are suitable in collecting student physiological values of both structured and unstructured types and send to the coordinator. To retain the data integrity, while performing the transmission task, a channel is secured with the help of Secure Socket Layer (SSL) to provide security and privacy. The timestamp synchronization of diverse categories of sensors is carried out. The fog layer is comprised of a gateway, named as synchronizing devices, for routine data at the cloud layer for next iteration [19–23].
2.2 Energy-Efficient Clustering Process
In this section, the clustering process involved in the OGSO algorithm is explained.
2.2.1 Glowworm Swarm Optimization (GSO)
Glowworm Swarm Optimization (GSO) is assumed to be a smart swarm optimization algorithm which is used in accelerating luminescent features of fireflies. In GSO technique, the glowworm swarms are distributed in a solution space based on Fitness Function (FF) of every glowworm’s location. The robust glowworm has maximum brightness and an optimal position where it secures maximum FF rate. Glowworms are comprised of vigorous lines of sight, named as a decision domain, which has the range of density for neighboring nodes. In contrast, the decision radius is limited while the glowworms travel towards a similar type of strong fluorescence in a decision domain. All the glowworms would be placed in the best positions once higher values of iterations are achieved. The process involved in the GSO algorithm is shown in the Fig. 3. It is comprised of five phases as given below:
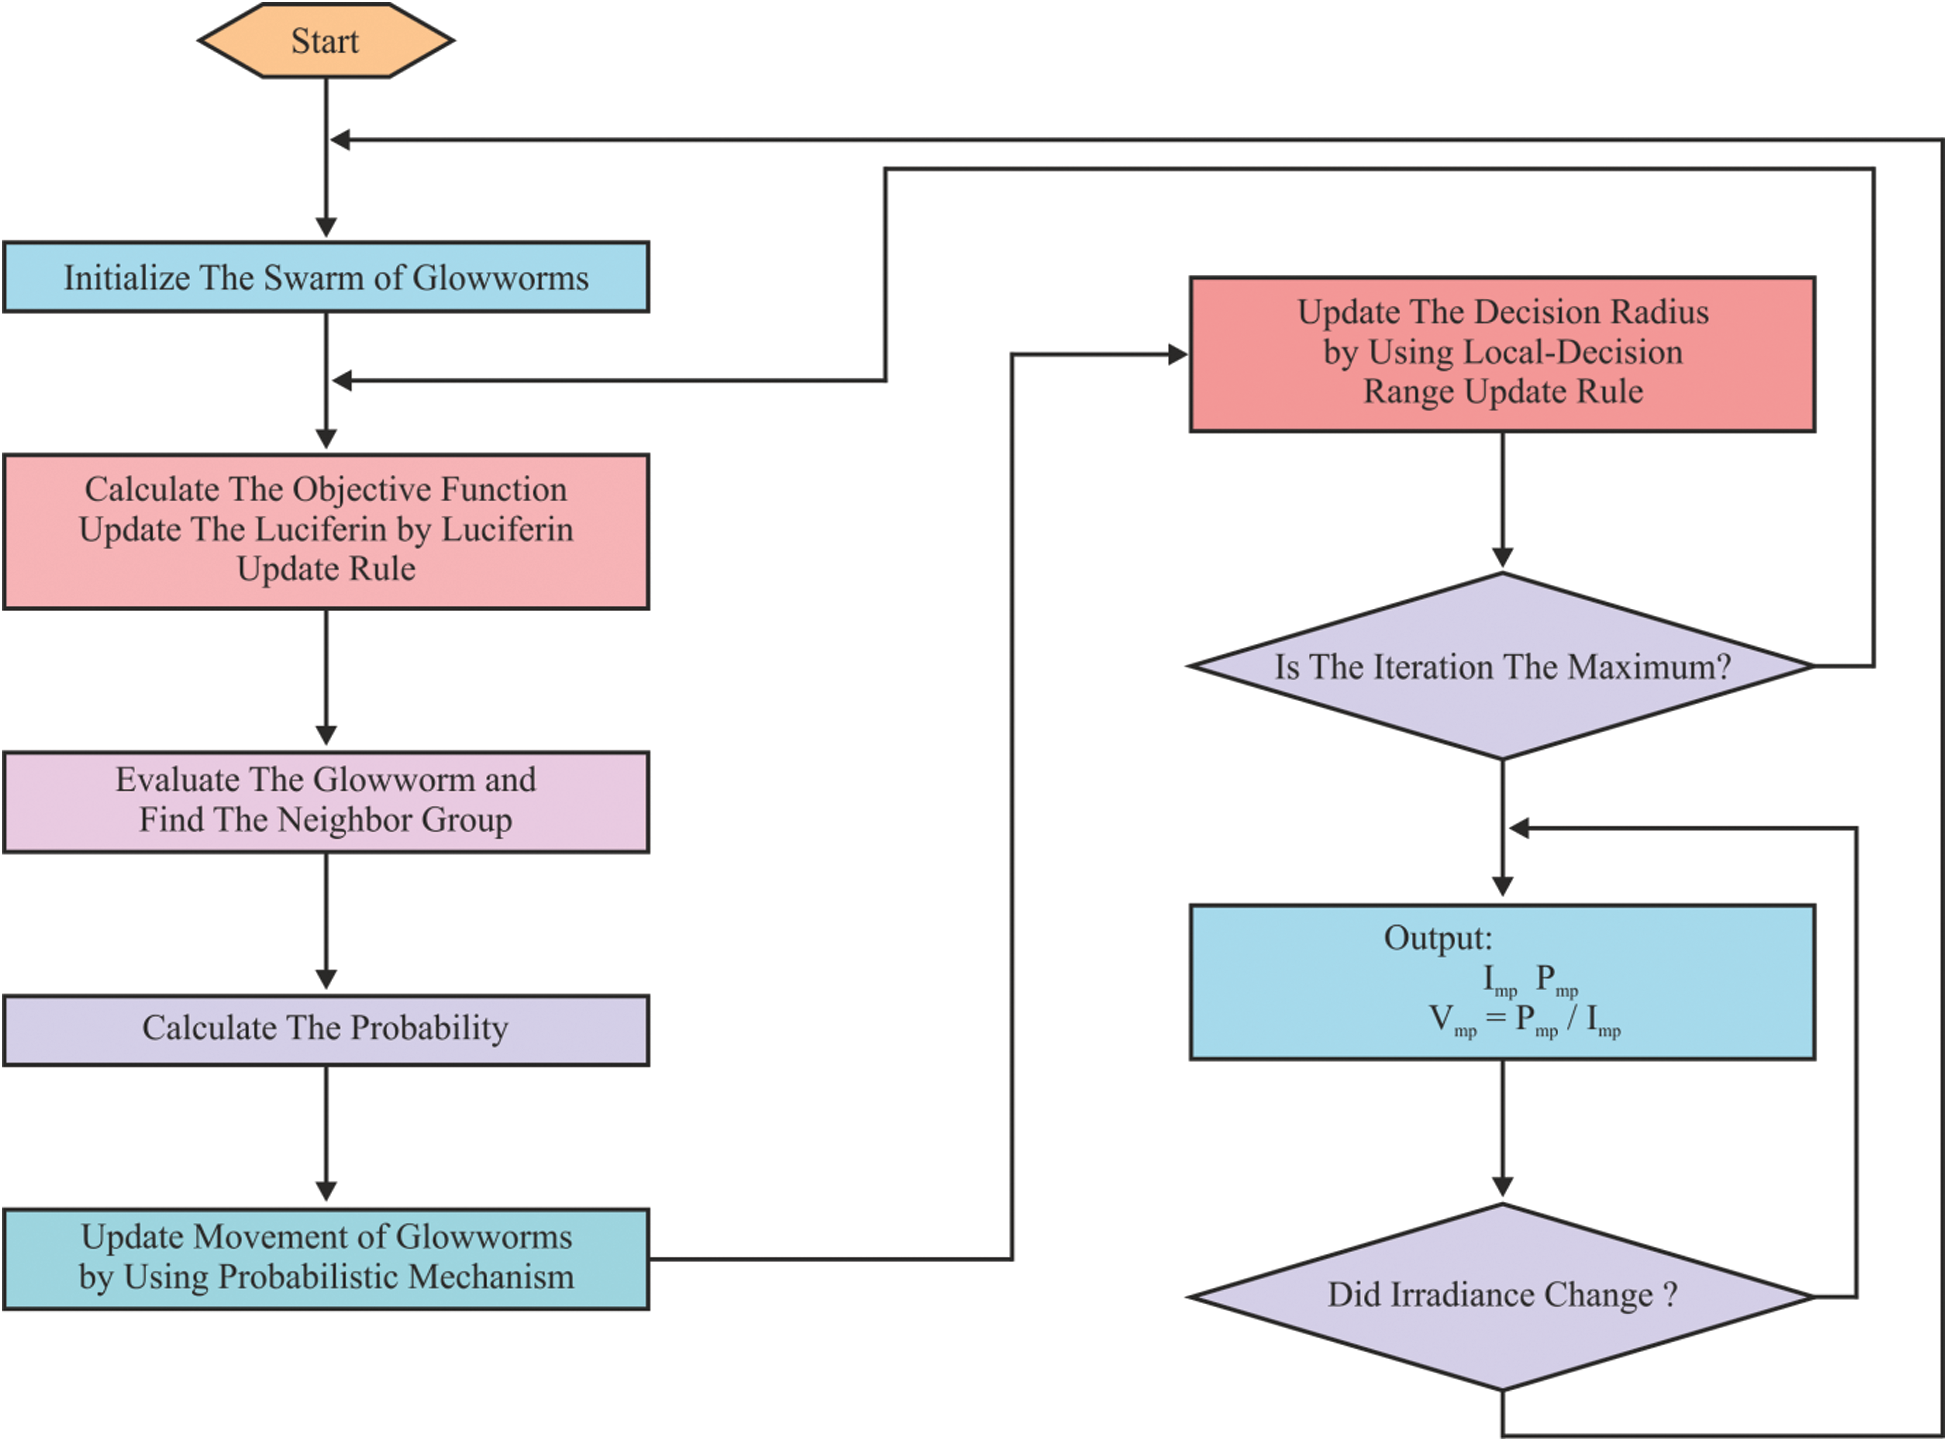
Figure 3: The flowchart of the GSO algorithm
• Fluorescence in concentration
• Neighbour set
• Decision domain radius
• Moving probability
• Glowworm position
The fluorescence in the concentration updating method is simplified by the Eq. (1).

where li(f) is the fluoresence in the concentration of ith glowworm at time  implies the fluoresence in volatilization coefficient,
  signifies fluorescence in improvement factor,
  denotes the fitness function and
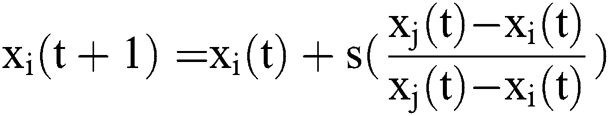
  represents the location of glowworm i at f time which is implied in the Eq. (2).

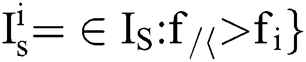
where  is the neighbor set of
  th glowworm at time r and
  implies the radius of the decision domain for ith glowworm at moment f as expressed in the Eq. (3).

where  denotes the attained radius of a glowworm,
  refers the value of the decision domain, and
  shows the neighbor threshold. The moving possibility of an updated technique is depicted in the Eq. (4).
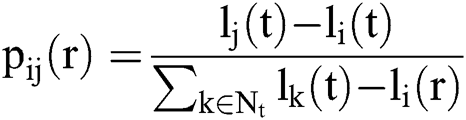
where  shows the probability where glowworm
  travels to the glowworm
 at
at  time as represented in the Eq. (5).
Opposition Based Learning (OBL) is a major objective in effective optimization process to improve the convergence speed of diverse heuristic optimizing models. The effective execution of OBL helps in the estimation of opposite population as well as the recent population in a similar generation to identify the optimal candidate solution of a provided problem. The OBL model has effectively been applied in diverse meta-heuristics to improve the convergence speed. The model of the opposite count has to be explained in OBL.
Assume 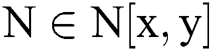 is a real number. The opposite number N0 is expressed as:
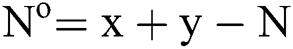
In case of d-dimensional search space, the description might be expanded in the following:
where ( is referred to d-dimensional search space as well as
  . From Oppositional Based Optimization (OBO), the method of OBL is applied in these initialization process of the GSO algorithm and for every iteration, under the application of jumping rate.
2.2.3 Optimal Clustering Process
The GSO FF could resolve the best clustering models. Since the clustering method is often difficult, more amount of data has to be exchanged among the nodes in CH selection and this results in few overheads. Hence, it is deployed as GSO FF. The metrics are used to manage the production of uneven network clustering. While selecting a CH, it undergoes dispersion, eliminates missing data and tends to develop the nearest node to combine CH rapidly. The power application of CH is higher when compared with alternate member nodes. In the absence of optimal balancing values, it is simple and leads to CH power dissipation and finally it gets expired. Hence, the CH power has to be estimated. The CH is often facilitated with maximum energy.
2.2.4 Cluster Generation Algorithm
An assumption is made that there are  nodes in a network to label K clusters with
  candidate CHs. Followed by, from the
  feasible clustering techniques, selecting the best clustering concept is named as optimization issue. At the time of applying GSO FF to resolve the optimal clustering approach, the FF model has to assume two things such as the local density of CH, which is nothing but the maximum distance inside a cluster, and the power dissipation of nodes in the cluster. Hence, the management over uneven network clustering is caused due to CH dispersion.
At the beginning, the cloud server estimates the maximum power of every node on the basis of energy data from the network. A node, in which the Residual Energy (RE) is higher when compared with maximum energy, is assumed as a candidate CH of the present round. The BS implements the GSO model to compute the best clustering so as to identify higher FF measures as depicted in the Eq. (8).

The local density  of CH is developed through a kernel function as illustrated in the Eq. (9)
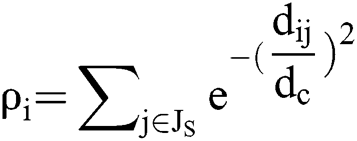
where 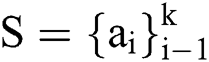 implies the CH set,
  represents the truncation distance whereas
 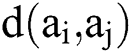 signifies the distance from CH
  and CH
  shows the CH distance evaluation factor. The CH dispersion could be attained by limiting the adjacent distance of CH. The
  is expressed through the Eq. (10).
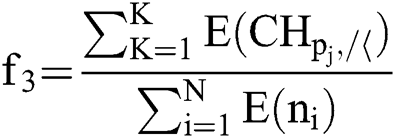
where f2 indicates the cluster compactness estimation factor whereas the lower distance between node and the CH is determined using the Eq. (11).
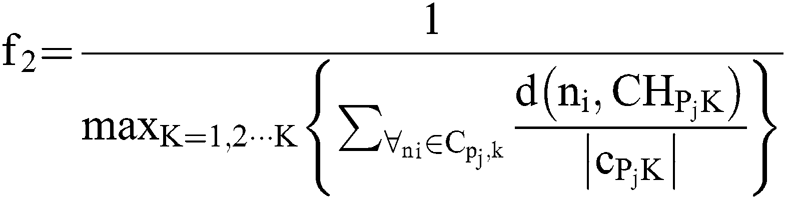
where  is the distance between node ni and adjacent CH while
  implies the count of nodes in cluster
  signifies the CH power estimation while the ratio of CH energy is identified by applying Eq. (12).
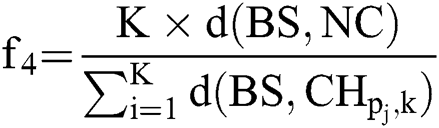
where f4 depicts CH position evaluation measure, NC shows the network center, and CH position is calculated by Eq. (13).
The weight coefficient of every evaluation factor meets 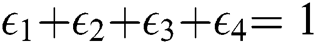 . Based on the FF the higher FF measure could satisfy the given criteria such as optimal CH dispersion, compact cluster geometry, maximum CH energy and CH is nearby BS. The cluster developed by FF could apply lower energy and distribute the CHs so that tiny clusters are deployed in a vicinity of BS that manages the power dissipation among the clusters.
The sensory IoT data is recorded in a Cloud-relied atmosphere after being identified ubiquitously. It derives the time elements, gets saved at CC side server termed as ‘CC storage repository’. The health-based measures are forwarded in a medical examining strategy, where the examination is used to evaluate the patient’s health state. The data is attained from User Diagnosis Result (UDR) and comprised of the association of critical disease and probability to acquire them [24,25].
The projected DNN relies upon diagnosis as well as prediction system and is used in finding disease and its severity. The advantage of this method is the selection of vital parameters and classification of medical data based on time restrictions to deploy an effective decision. Artificial Neural Network (ANN) is a computational intelligence model that emerged from a system of biological neurons to solve the prediction issue, Natural Language Processing as well as drug identification. DNN has a certain level of complexity while a NN has massive layers. DNN applies the difficult arithmetical method in computing the data. Hence, the NN is able to achieve efficiency in tedious applications to find the patterns in the last few decades. DNN is composed of an input layer for actual descriptors Xl, L hidden layers, and a resultant layer for data prediction.
The DNN is established by the exploitation of the TensorFlow model, the tf.contrib.learn.DNN Classifier DL library from Google, in Python programming language. Recently, the traditional models are developed with the best NN inclusive of many layers and neuron values. Thus, a DNN is deployed by processing the maximum set of trials. The manual configuration of DNN is carried out by changing the given metrics. In essence, the number of hidden layers, the activation function, the number of learning steps and, each hidden layer is composed of neurons. The DNN classifier applied, tends to produce every neuron layer, under the application of ReLU (Rectified Linear Unit) activation function. DNN is simple and productive. The output layer is based on softmax function and the cost function is named as cross-entropy. The rectifier is said to be activation function as given in the Eq. (14):
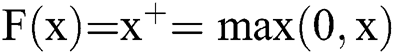
where  denotes the input. It is named as ramp function and is same as half-wave rectification computation. A unit that applies a rectifier is called as ReLU.
This is named as softplus function. While experimenting the prediction process, a novel depiction of actual descriptors is extracted from hidden layers as given below:

where  and
and  imply the weight matrix and biasing
 th hidden layer whereas H denotes the relevant activation function.
For the validation of results provided by OGSO-DNN method, an extensive analysis was conducted under the application of provided datasets and UCI datasets. The latter consists of massive data samples for disease analysis of students with obesity, infectious, respiratory, and heart-based diseases, and random development of EEG signal by exploiting EMOTIVEPOC sensor data to find the stress level among 25 students. The test instances were used to predict significant diseases projected by the application of available data regarding the physicians. For experimentation, 10 fold cross validation process is applied to split the dataset into training and testing parts.
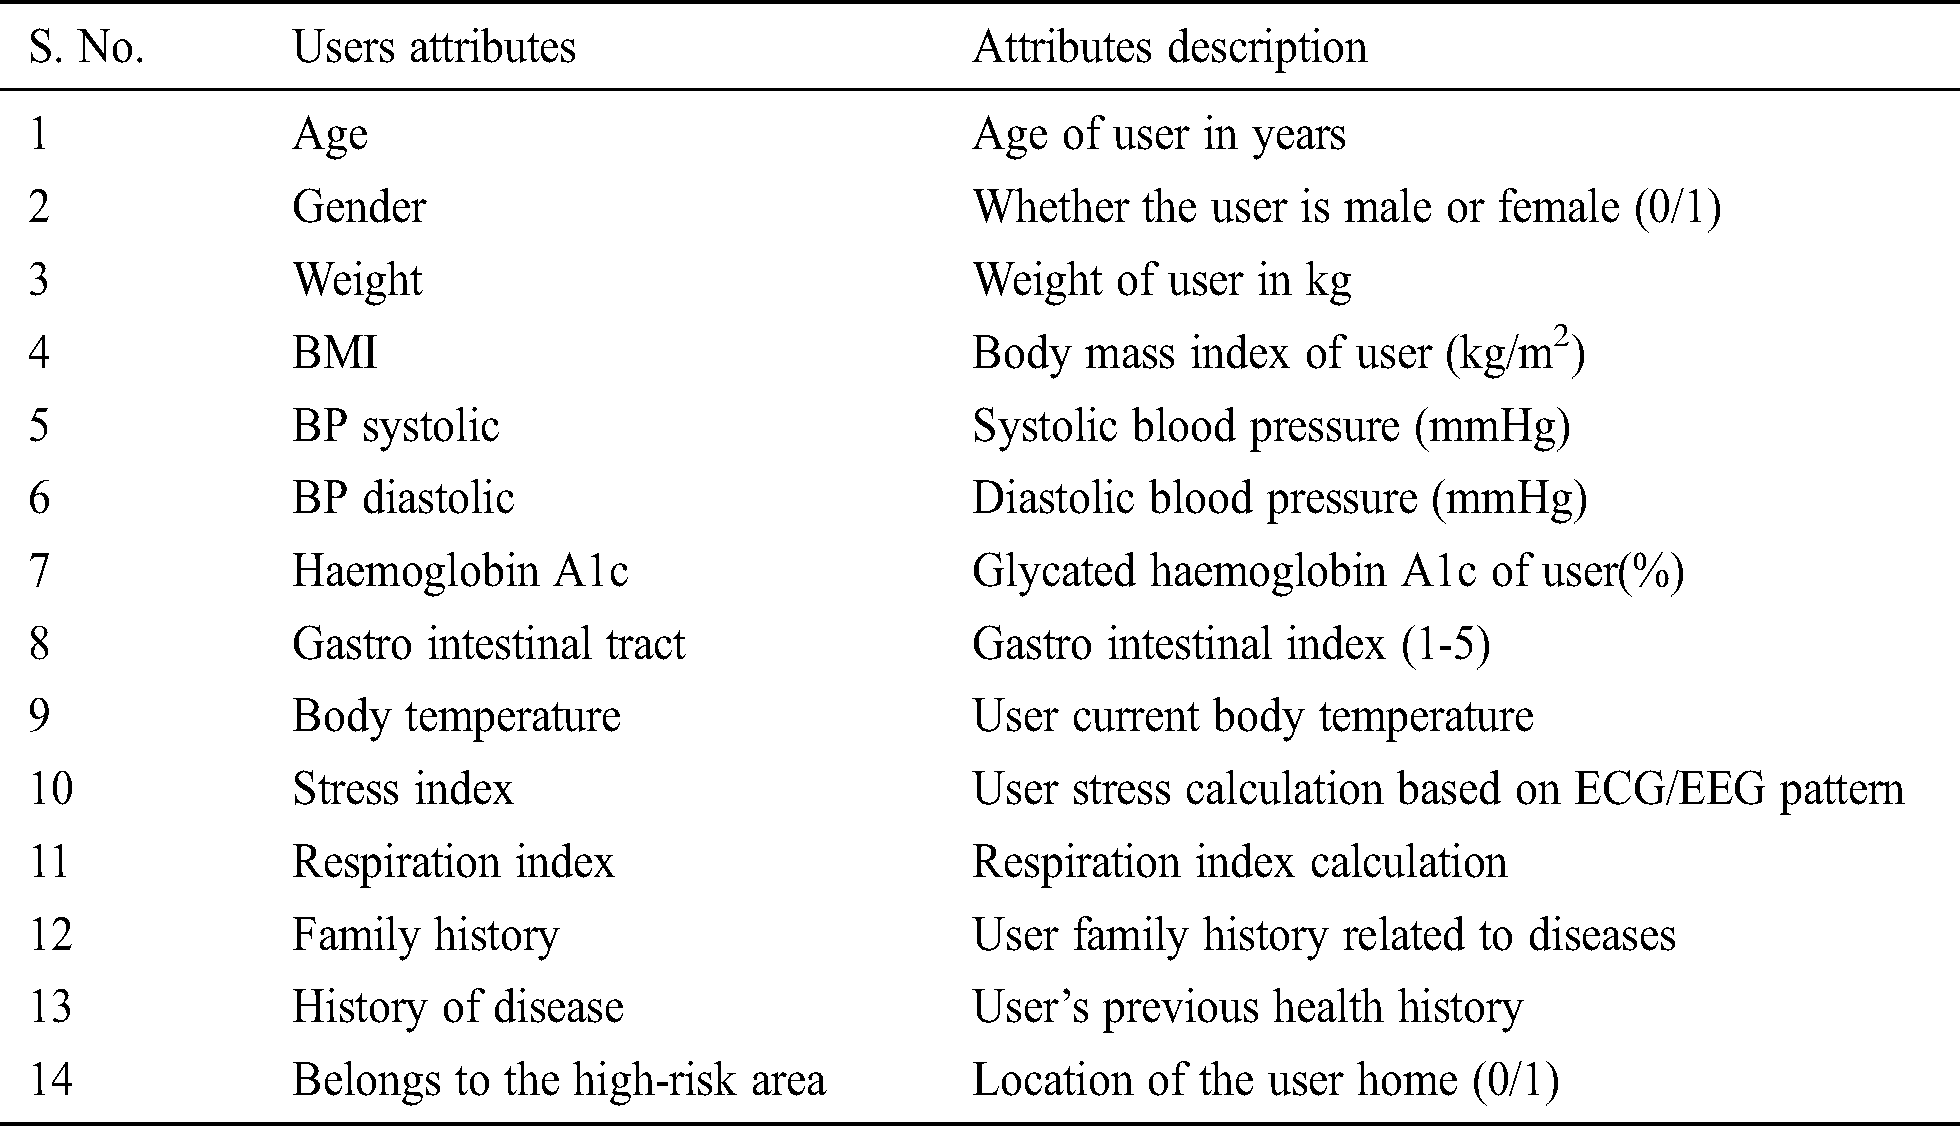
The test instances were sampled physically by making a comparison of student health signs derived from the UCI data repository as well as sensor readings with proper diagnostic rules. Tab. 1 displays the list of user parameters and feasible diseases predicted from the respective student data. Fig. 4 shows the possible diseases detected among students.
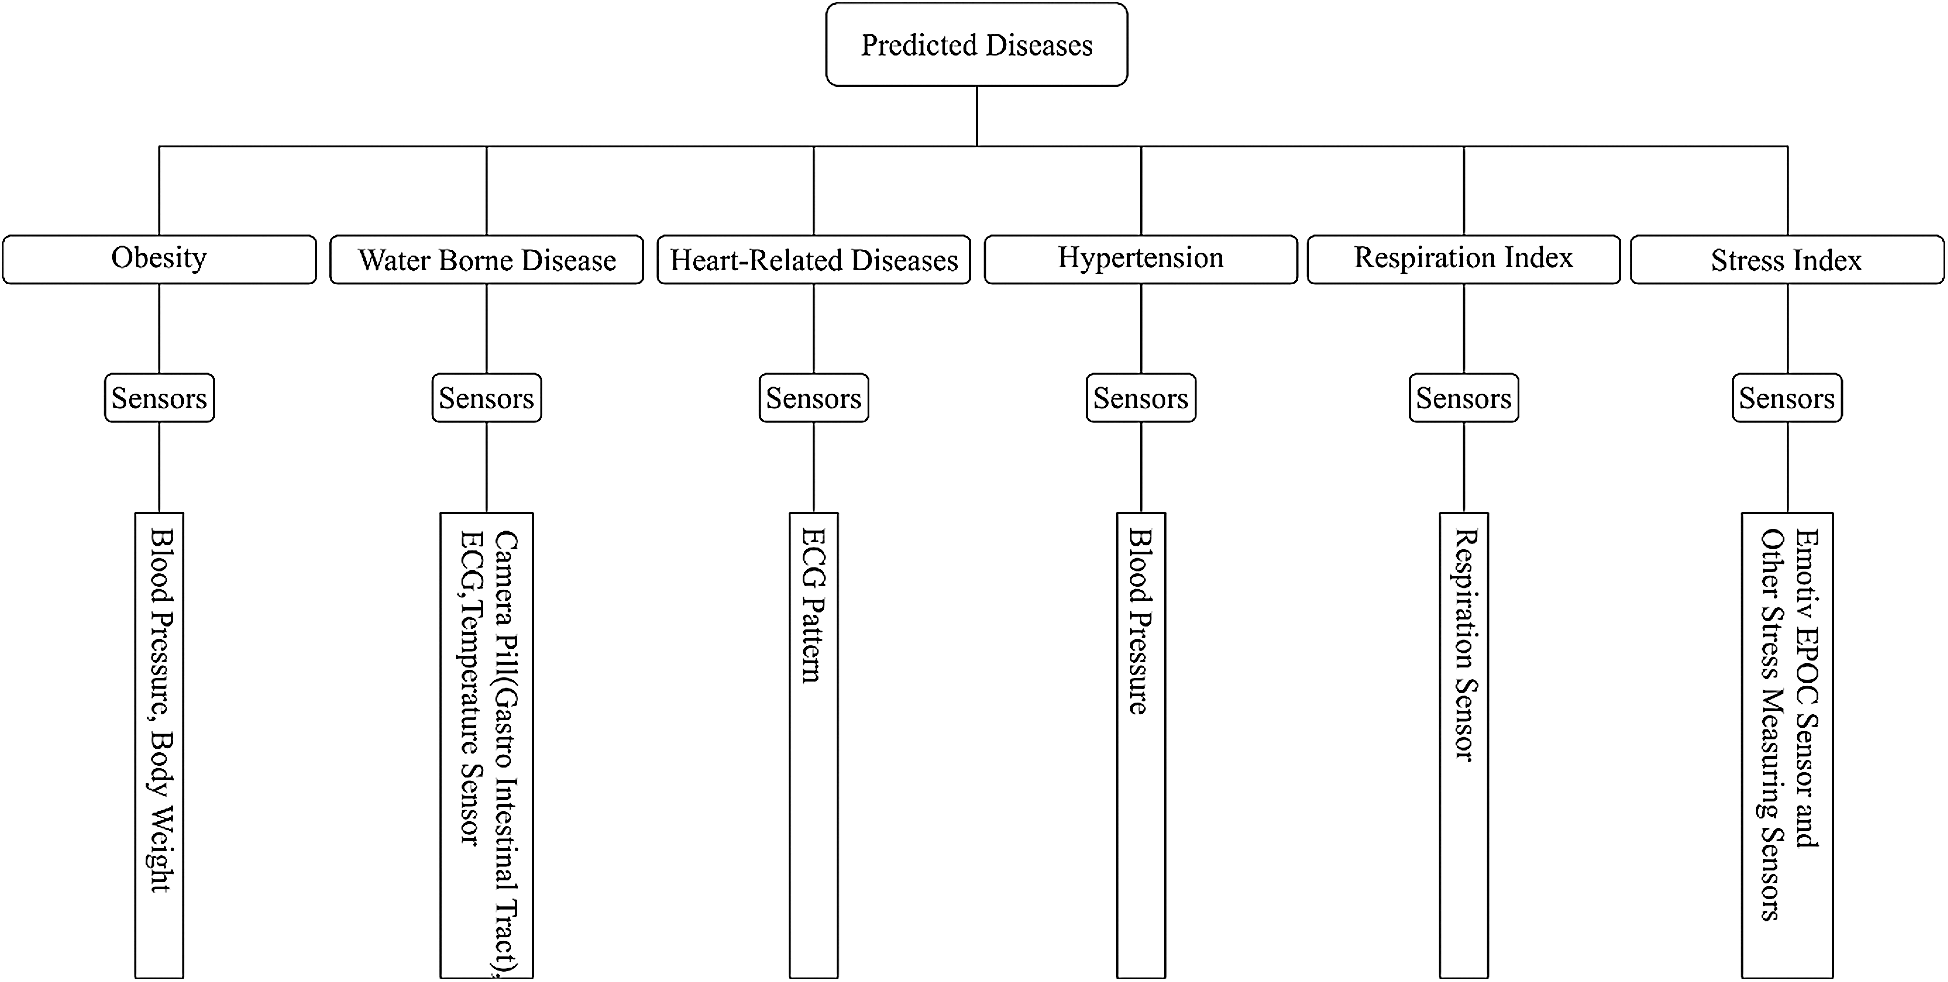
Figure 4: The possible diseases detected in students
Table 1: Attributes and its descriptions
Tab. 2 and Fig. 5 depict the sensitivity analyses of previous models and the OGSO-DNN method. The table values stated that the OGSO-DNN approach yielded higher sensitivity than other techniques. SVM scheme is highly ineffective one with least sensitivity value. On the other hand, the NB approach yielded slightly manageable outcomes with improved sensitivity value. Additionally, the K-NN scheme produced gradual sensitivity value when compared with existing models like NB and SVM models, though it remains suboptimal to DT, EEPSOC-ANN as well as OGSO-DNN approaches. Furthermore, the DT and EEPSOC-ANN methodologies resulted in a closer and identical sensitivity value. Therefore, it can be inferred that the OGSO-DNN framework performed quite-well when compared to previous models by producing the maximum sensitivity value. For sample, the SVM technique accomplished an average minimum sensitivity value of 83.22% whereas a slightly better average sensitivity of 87.32% was attained by NB model. Similarly, the K-NN and DT frameworks illustrated appreciable results with gradual average sensitivity values of 92.04% and 94.42% correspondingly. The EEPSOC-ANN method yielded a competing sensitivity value of 96.094%. However, the proposed OGSO-DNN system exhibited qualified results with higher sensitivity value of 96.956%.
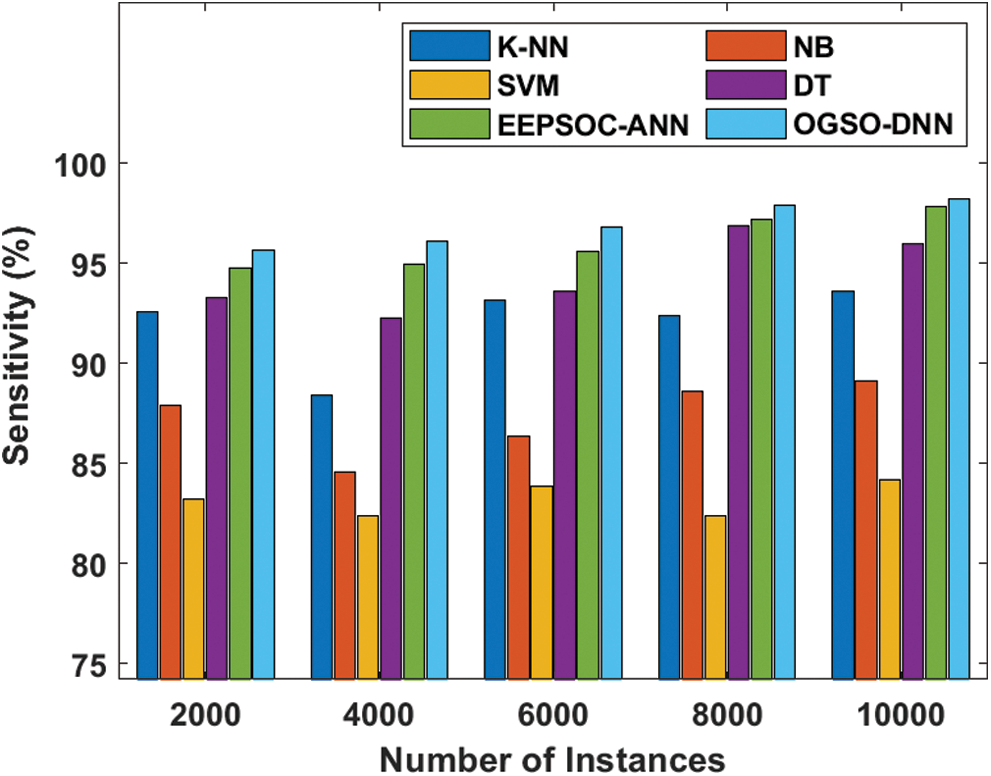
Figure 5: Sensitivity analysis of the existing techniques
Table 2: Sensitivity analysis of existing models and the proposed OGSO-DNN method
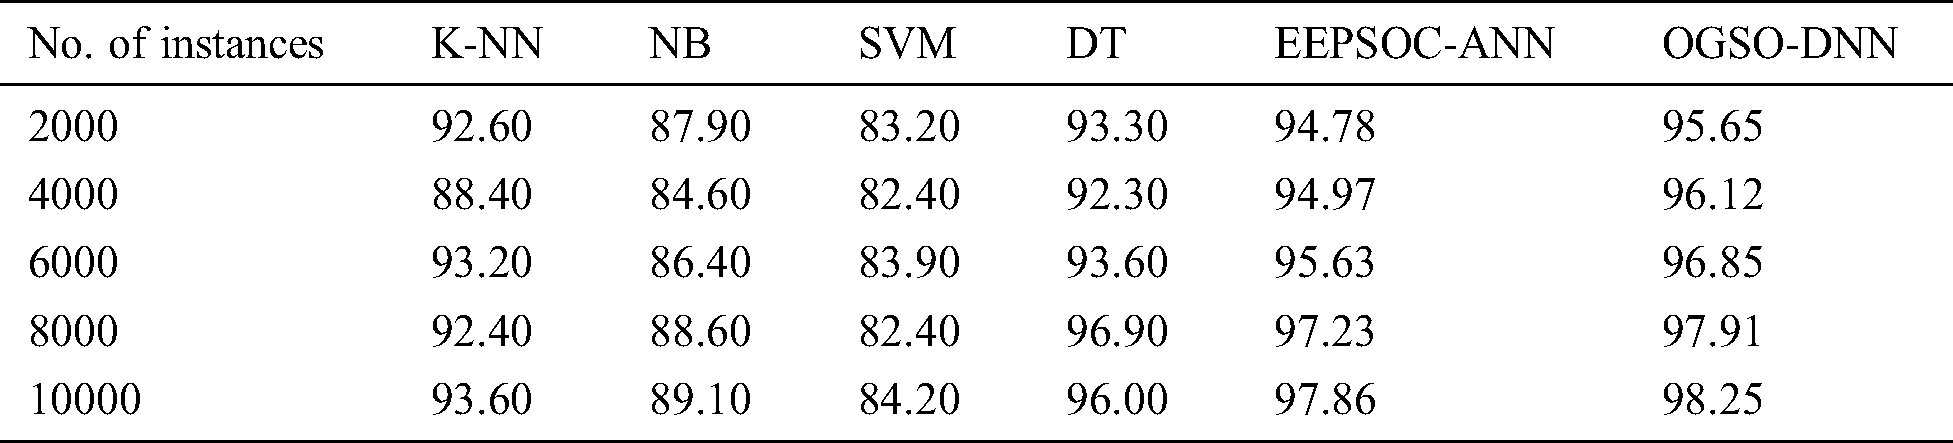
As per Tab. 3 and Fig. 6 EEPSOC-ANN examined the function of EEPSOC-ANN model when compared with alternate models for specificity. The table values imply that the EEPSOC-ANN technique offered better outcomes than traditional models. Simultaneously, it is illustrated that the from minimum specificity value that SVM scheme is the ineffective performer. Additionally, the NB approach concluded to a slightly better result with improved specificity value. Furthermore, the K-NN model provided a reasonable specificity value than the existing two approaches such as NB and SVM models yet not better than DT, EEPSOC-ANN, and OGSO-DNN methodologies. The DT and EEPSOC-ANN model illustrated closer optimal specificity values. However, the OGSO-DNN model demonstrated efficient results with maximum specificity value. For example, the SVM technology achieved an average minimum specificity value of 81.68% while a moderate average specificity value of 84.48% was provided by NB approach. In line with this, the K-NN and DT models resulted in reasonable outcome with the average specificity values of 87.04% and 91.04% correspondingly. Meanwhile, a slightly better specificity value of 9.492% was attained by the EEPSOC-ANN technique. Finally, the proposed OGSO-DNN scheme accomplished good results with higher specificity of 95.076%.
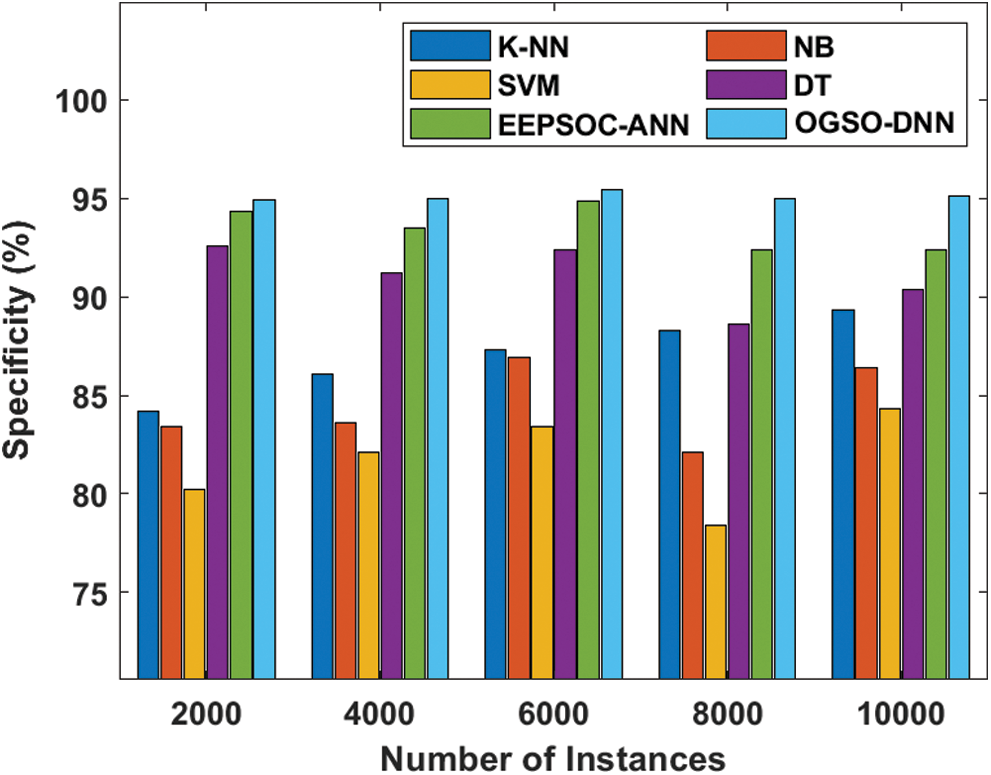
Figure 6: Specificity analysis of the existing techniques
Table 3: Specificity analysis of the existing models and the proposed OGSO-DNN method
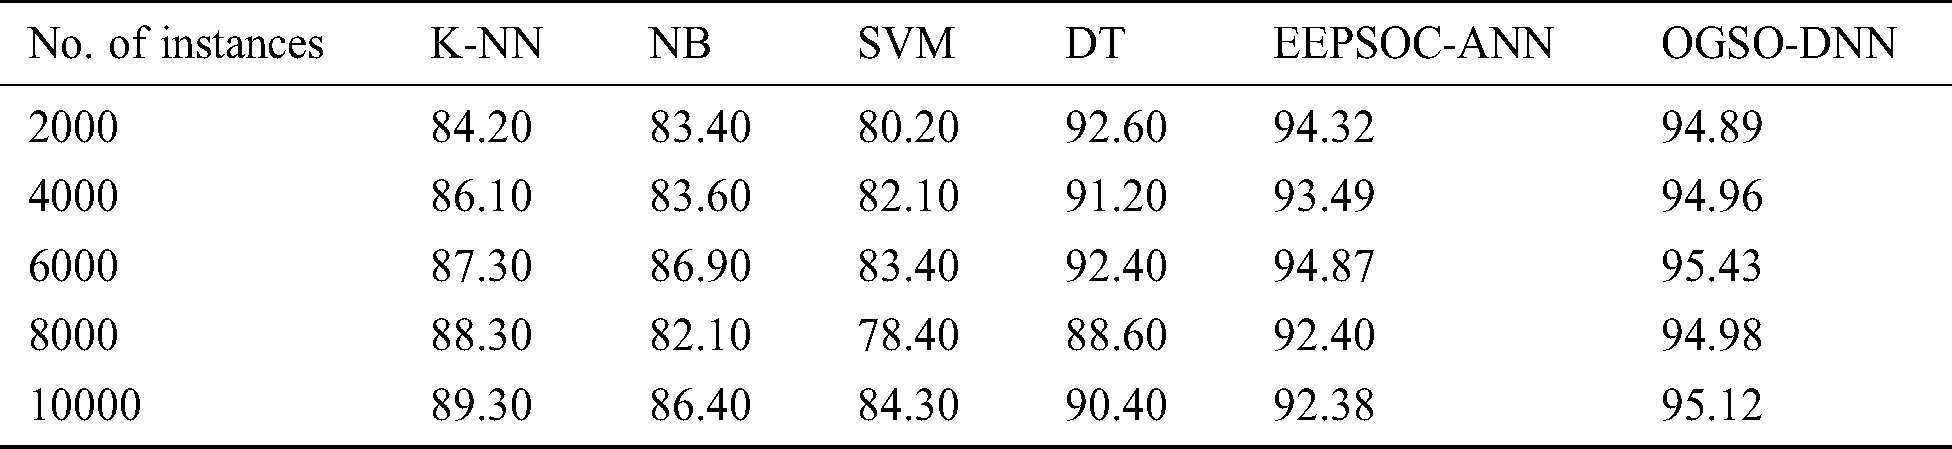
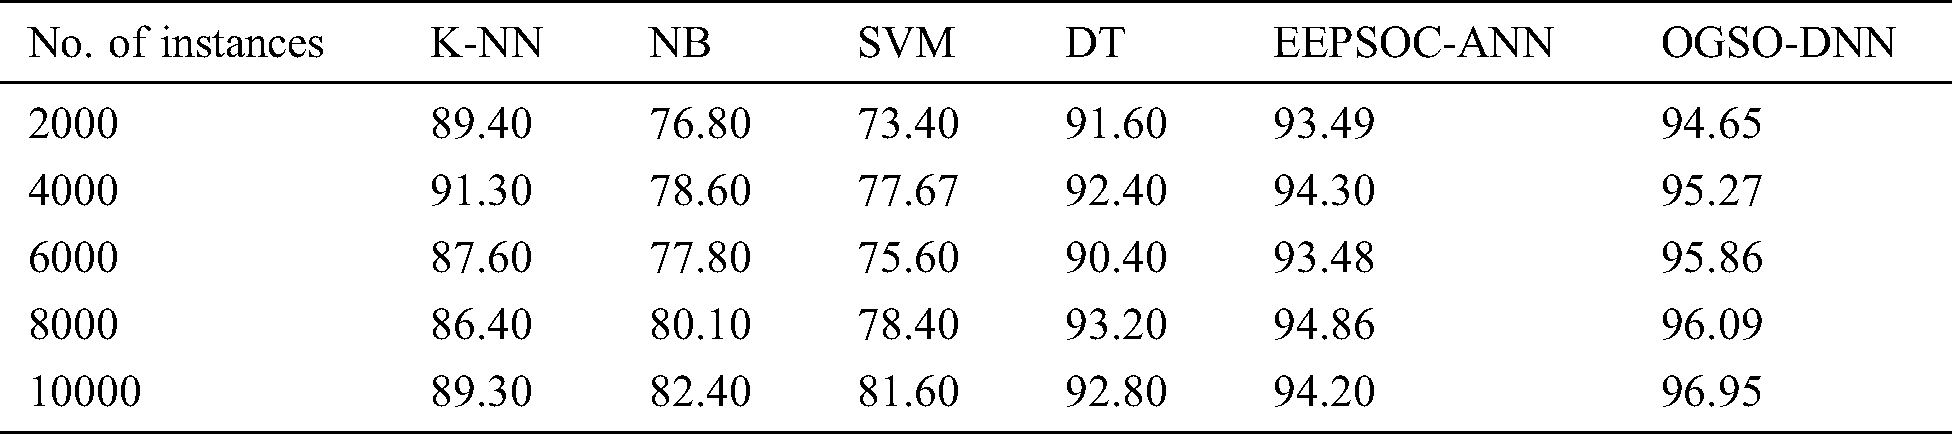
Tab. 4 and Fig. 7 demonstrates the accuracy analyses of previous approaches and the OGSO-DNN model. The table values clearly show that the OGSO-DNN framework accomplished higher accuracy in comparison with other models. It has been proved that the SVM model remained ineffective with least accuracy. Followed by, the NB method generated a slightly gradual outcome with enhanced accuracy value. Also, the K-NN model obtained moderate accuracy value than NB and SVM models, unfortunately not better than DT, EEPSOC-DNN, and OGSO-DNN methodologies. Furthermore, the DT mechanism depicted near optimized accuracy value. Hence, it can be inferred that the OGSO-DNN system outperformed all other previous approaches by achieving the maximum accuracy measure. For illustration, the SVM scheme accomplished an average minimum accuracy value of 77.334% and a slightly higher average accuracy value of 79.14% has been attained by the NB model. Along with that, the K-NN, DT, and EEPSOC-ANN frameworks exhibited appreciable results with average accuracy values of 88.8%, 92.08%, and 94.066% correspondingly. Thus, the proposed OGSO-DNN method accomplished qualified results with higher accuracy value of 95.764%.
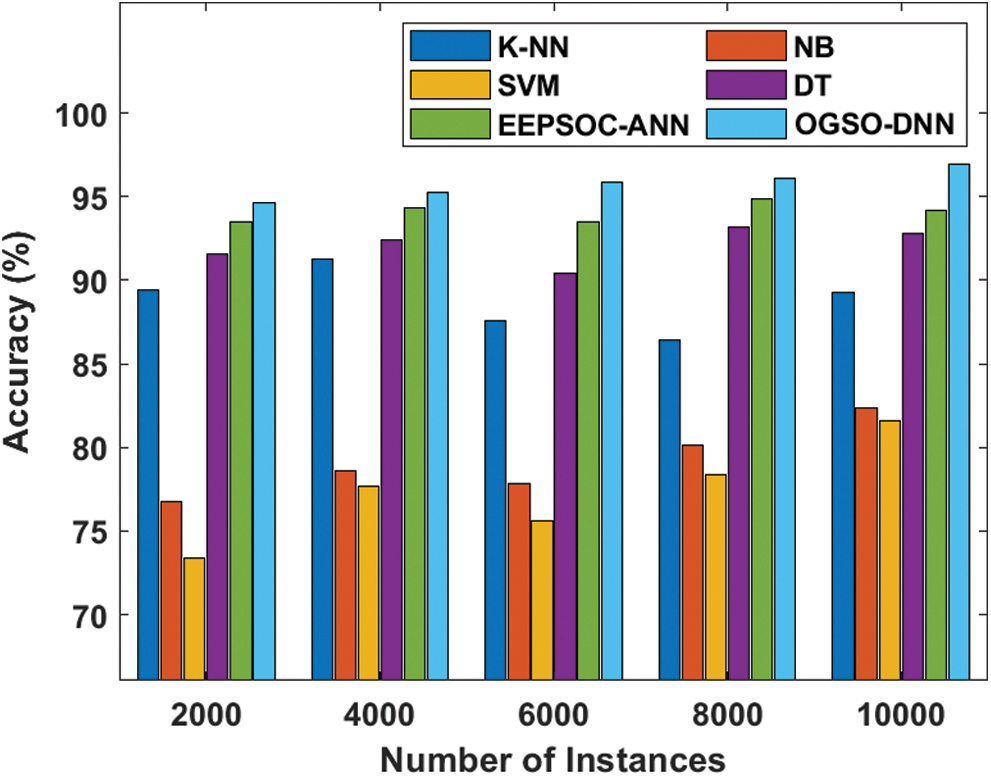
Figure 7: Accuracy analysis of the existing techniques
Table 4: Accuracy analysis of the existing models and the proposed OGSO-DNN method
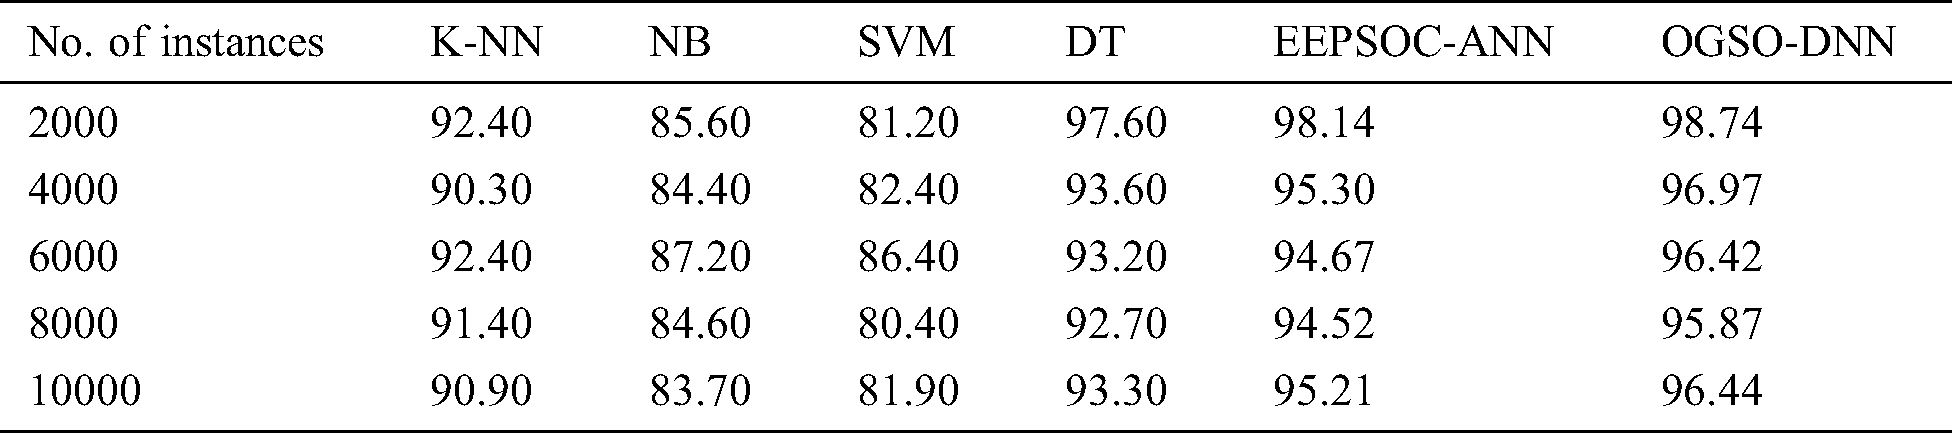
The experimental results of various techniques, utilizing the F-score, are demonstrated in Tab. 5 and Fig. 8. From the figure, it is evident that the OGSO-DNN technique offered the maximum F-score when compared with traditional methods. The SVM model seems to be ineffective by achieving the least F-score value.
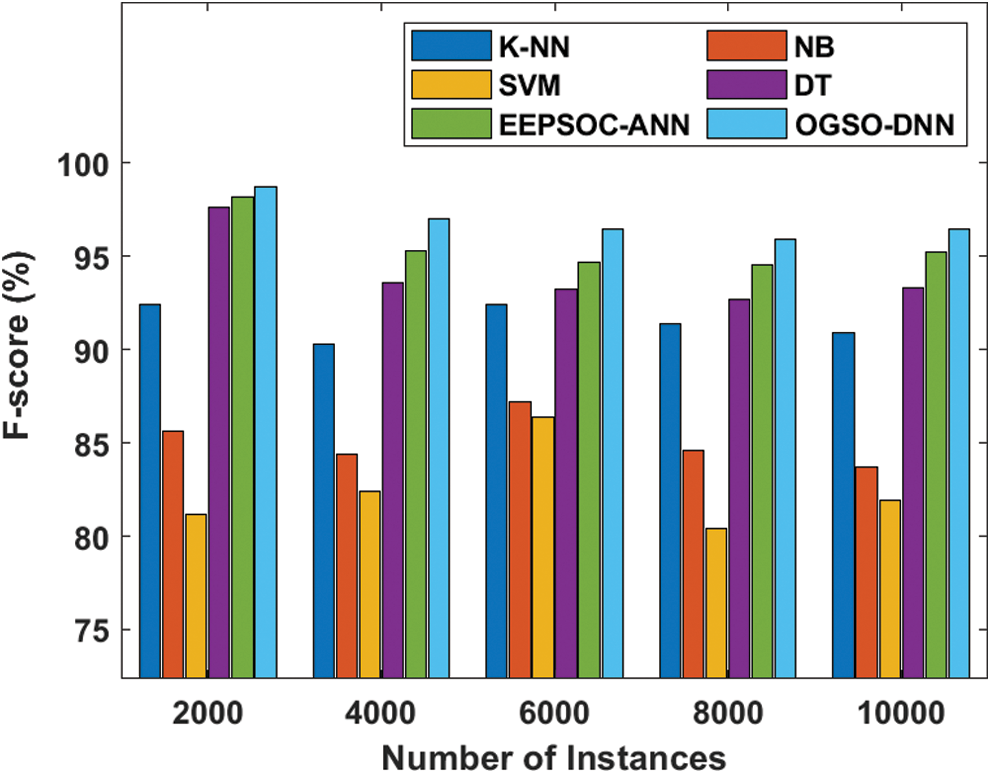
Figure 8: F-score analysis of the existing methods
Table 5: F-score analysis of the existing methods and the proposed OGSO-DNN method
Also, the NB approach achieved a gradual result with enhanced F-score value. On the other end, the K-NN method accomplished a better F-score value than two models such as NB and SVM models, but not better than DT, EEPSOC-ANN, and OGSO-DNN technologies. Additionally, the DT, as well as EEPSOC-ANN frameworks accomplished competing F-score values. Hence, it can be inferred that the OGSO-DNN model outperformed other techniques by achieving the maximum F-score value. For the sample, the SVM mechanism offered an average minimum F-score value of 77.334% while a moderate F-score value of 79.14% was attained by NB model. Simultaneously, the K-NN, DT, and EEPSO-C approaches reached better outcomes with gradual average F-score values of 88.8%, 92.08%, and 94.066% respectively. Therefore, the projected OGSO-DNN system depicted the superiority with tremendous F-score value of 96.888%.
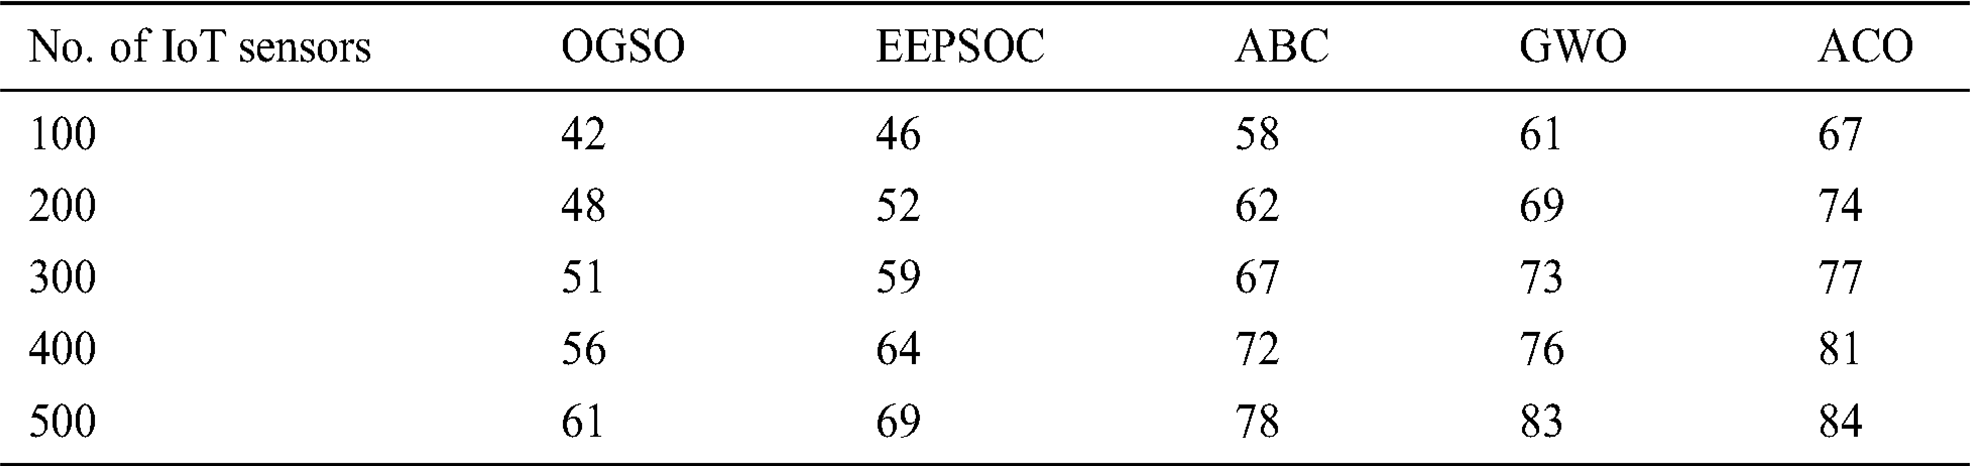
Tab. 6 and Fig. 9 show a brief power consumption analysis of the OGSO-DNN model with classical methods. The figure defines that both ACO and GWO techniques consumed more amount of energy and resulted in the rapid power dissipation of IoT devices. Meanwhile, it is pointed out that the ABC model applied only minimum amount of energy to ACO and GWO approaches. However, the presented OGSO-DNN technique illustrated higher energy effective features with lower quantity energy among diverse number of IoT sensors. The proposed OGSO-DNN model has achieved better performance due to the incorporation of oppositional based learning concept, which helps to increase the convergence rate of GSO algorithm.
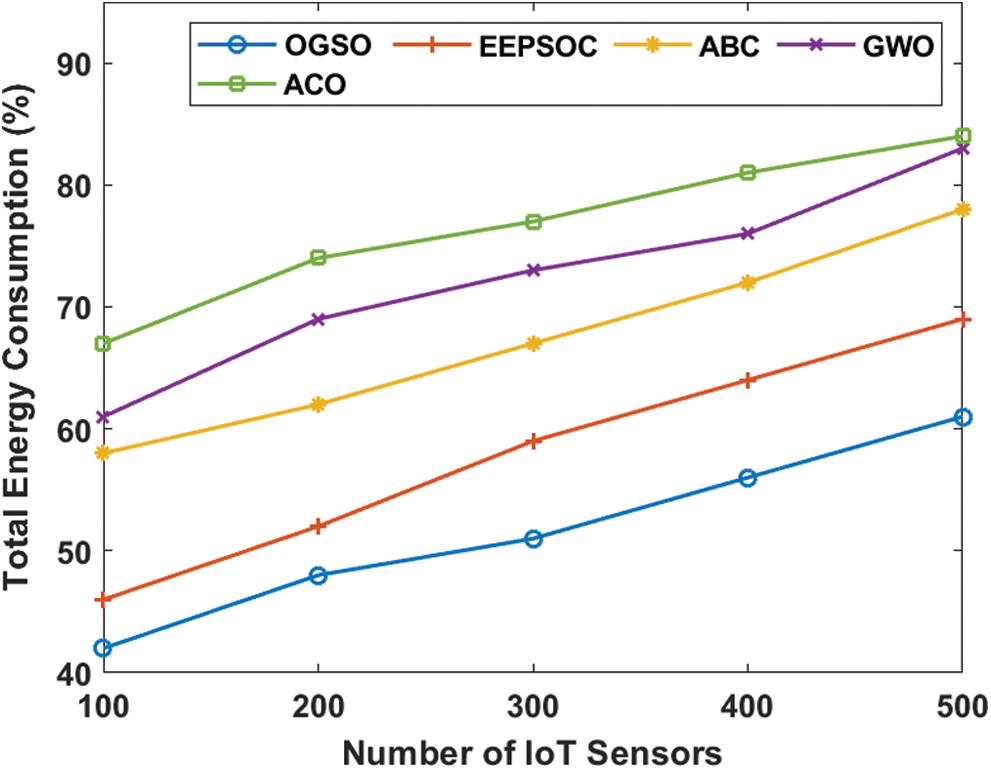
Figure 9: The Result analysis of total energy consumption
Table 6: Result analysis of total energy consumption (%) with existing and proposed OGSO method
This paper has presented an energy-efficient clustering and disease diagnosis model called OGSO-DNN model for IoT-based sustainable healthcare systems. The Oppositional Based Learning process is incorporated into GSO algorithm to increase the convergence rate. The oppositional concept is applied in the initialization process of the GSO algorithm. Then the OGSO algorithm selects the optimal number of CHs for data transmission between IoT devices and the cloud server. Once the medical data reaches the cloud, DNN-based classification process begins and classifies the disease along with its severity level. An extensive simulation analysis was carried out utilizing a student perspective healthcare data generated from UCI repository and IoT devices to forecast the severity level of the disease among students. The proposed OGSO-DNN model outperformed previous methods by attaining the maximum average sensitivity of 96.956%, specificity of 95.076%, the accuracy of 95.764%, and F-score value of 96.888%. In the future, the proposed model can be applied in real-time hospital setting to collect the patient data and perform the diagnosis process effectively. Besides, the performance of the OGSO-DNN model can be improved by long short term memory (LSTM), bidirectional LSTM, etc.
Funding Statement: The author(s) received no specific funding for this study.
Conflicts of Interest: The authors declare that they have no conflicts of interest to report regarding the present study.
1. N. L. Downing, J. A. Milstein, J. P. Palma, S. Lane, M. Eisenberg et al. (2016). , “Health information exchange policies of 11 diverse health systems and the associated impact on the volume of exchange,” Journal of the American Medical Informatics Association, vol. 34, no. 13, pp. 150–160. [Google Scholar]
2. A. Akhlaq, A. Sheikh and C. Pagliari. (2016). “Health information exchange as a complex and adaptive construct: Scoping review,” Journal of Innovation in Health Informatics, vol. 23, no. 4, pp. 633–683. [Google Scholar]
3. S. Tharmalingam, S. Hagens and J. Zelmer. (2016). “The value of connected health information: perceptions of electronic health record users in Canada,” BMC Medical Informatics and Decision Making, vol. 16, no. 1, pp. 633–683. [Google Scholar]
4. K. J. Serrano, M. Yu, W. T. Riley, V. Patel, P. Hughes et al. (2016). , “Willingness to exchange health information via mobile devices: findings from a population-based survey,” Annals of Family Medicinsse, vol. 14, no. 1, pp. 34–40. [Google Scholar]
5. A. Roy, A. M. S. Zalzala and A. Kumar. (2016). “Disruption of things: A model to facilitate adoption of IoT-based innovations by the urban poor,” Procedia Engineering, vol. 159, pp. 199–209. [Google Scholar]
6. F. Sallabi and K. Shuaib. (2016). “Internet of things network management system architecture for smart healthcare,” in Sixth Int. Conf. on Digital Information and Communication Technology and its Applications, Konya, Turkey, pp. 165–170. [Google Scholar]
7. S. Li, L. D. Xu and S. Zhao. (2015). “The internet of things: a survey,” Information Systems Frontiers, vol. 17, no. 2, pp. 243–259. [Google Scholar]
8. K. Ullah, M. A. Shah and S. Zhang. (2016). “Effective ways to use internet of things in the field of medical and smart health care,” in 2016 Int. Conf. on Intelligent Systems Engineering, IEEE, Islamabad, Pakistan, pp. 372–379. [Google Scholar]
9. Y. Jog, A. Sharma, K. Mhatre and A. Abhishek. (2015). “Business approach for IoT based health solutions in India with respect to osterwalder framework,” International Journal of Bio-Science and Bio-Technology, vol. 7, no. 6, pp. 173–188. [Google Scholar]
10. A. K. Lim and C. Thuemmler. (2015). “Opportunities and challenges of internet-based health interventions in the future internet,” in 2015 12th Int. Conf. on IEEE Information Technology-New Generations, Las Vegas, NV, USA, pp. 567–573. [Google Scholar]
11. H. C. Keh, C. C. Shih, K. Y. Chou, Y. C. Cheng, H. K. Ho et al. (2014). , “Integrating unified communications and internet of M-health things with micro wireless physiological sensors,” Journal of Applied Science and Engineering, vol. 17, no. 3, pp. 319–328. [Google Scholar]
12. S. Tyagi, A. Agarwal and P. Maheshwari. (2016). “A conceptual framework for IoT based healthcare system using cloud computing,” in 6th Int. Conf.—Cloud System and Big Data Engineering, Noida, India, pp. 503–507. [Google Scholar]
13. A. Gyrard, S. K. Datta, C. Bonnet and K. Boudaoud. (2014). “Standardizing generic cross–domain applications in internet of things,” in IEEE Globecom Work, Austin, TX, USA, pp. 589–594. [Google Scholar]
14. T. Prayoga and J. Abraham. (2016). “Behavioral intention to use IoT health device: The role of perceived usefulness, facilitated appropriation, big five personality traits, and cultural value orientations,” International Journal of Electrical and Computer Engineering, vol. 6, no. 4, pp. 1751–1765. [Google Scholar]
15. A. Jagatheesan, S. Maragathavel, M. Sivapurapu and J. Lee. (2015). “Drops: A multiproducer and multi-consumer data sharing framework with human experience,” in 12th Annual IEEE Consumer Communications and Networking Conf., Las Vegas, NV, USA, pp. 601–602. [Google Scholar]
16. A. Manashty, J. Light and U. Yadav. (2016). “Healthcare event aggregation lab (HEALa knowledge sharing platform for anomaly detection and prediction,” in IEEE 17th Int. Conf. on e-Health Networking, Applications and Services, Boston, MA, USA, pp. 648–652. [Google Scholar]
17. C. I. Sheriff, T. Naqishbandi and A. Geetha. (2015). “Healthcare informatics and analytics framework,” in 2015 International Conf. on Computer Communication and Informatics, Coimbatore, India, pp. 1–6. [Google Scholar]
18. A. Pir, M. U. Akram and M. A. Khan. (2016). “Internet of things based context awareness architectural framework for HMIS,” in 2015 17th International Conf. on E-Health Networking, Application & Services, Boston, MA, USA, pp. 55–60. [Google Scholar]
19. I. V. Pustokhina, D. A. Pustokhin, D. Gupta, A. Khanna, K. Shankar et al. (2020). , “An effective training scheme for deep neural network in edge computing enabled internet of medical things (IoMT) systems,” IEEE Access, vol. 8, no. 1, pp. 107112–107123. [Google Scholar]
20. V. Porkodi, A. R. Singh, A. R. W. Sait, K. Shankar, E. Yang et al. (2020). , “Resource provisioning for cyber-physical–social system in cloud-fog–edge computing using optimal flower pollination algorithm,” IEEE Access, vol. 8, no. 1, pp. 105311–105319.
21. J. S. Raj, S. J. Shobana, I. V. Pustokhina, D. A. Pustokhin, D. Gupta et al. (2020). , “Optimal feature selection based medical image classification using deep learning model in internet of medical things,” IEEE Access, vol. 8, no. 1, pp. 58006–58017.
22. K. Shankar, A. R. W. Sait, D. Gupta, S. K. Lakshmanaprabu, A. Khanna et al. (2020). , “Automated detection and classification of fundus diabetic retinopathy images using synergic deep learning model,” Pattern Recognition Letters, vol. 33, pp. 210–216.
23. S. K. Lakshmanaprabu, S. N. Mohanty, S. Rani, S. Krishnamoorthy, J. Uthayakumar et al. (2019). , “Online clinical decision support system using optimal deep neural networks,” Applied Soft Computing, vol. 81, pp. 1–10. [Google Scholar]
24. Q. Tang, K. Yang, P. Li, J. Zhang, Y. Luo et al. (2012). , “An energy efficient MCDS construction algorithm for wireless sensor networks,” EURASIP Journal on Wireless Communications and Networking, vol. 2012, no. 1, pp. 102. [Google Scholar]
25. M. S. Magurawalage, K. Yang, L. Hu and J. Zhang. (2014). “Energy-efficient and network-aware offloading algorithm for mobile cloud computing,” Computer Networks, vol. 74, pp. 22–33. [Google Scholar]
 | This work is licensed under a Creative Commons Attribution 4.0 International License, which permits unrestricted use, distribution, and reproduction in any medium, provided the original work is properly cited. |