DOI:10.32604/cmc.2020.012423
| Computers, Materials & Continua DOI:10.32604/cmc.2020.012423 | |
| Article |
A Hybrid Deep Learning Model for COVID-19 Prediction and Current Status of Clinical Trials Worldwide
Department of Computer Science, Institute of Science, Banaras Hindu University, Varanasi, India
*Corresponding Author: Shwet Ketu. Email: shwetiiita@gmail.com
Received: 30 June 2020; Accepted: 05 October 2020
Abstract: Infections or virus-based diseases are a significant threat to human societies and could affect the whole world within a very short time-span. Corona Virus Disease-2019 (COVID-19), also known as novel coronavirus or SARS-CoV-2 (Severe Acute Respiratory Syndrome-Coronavirus-2), is a respiratory based touch contiguous disease. The catastrophic situation resulting from the COVID-19 pandemic posed a serious threat to societies globally. The whole world is making tremendous efforts to combat this life-threatening disease. For taking remedial action and planning preventive measures on time, there is an urgent need for efficient prediction models to confront the COVID-19 outbreak. A deep learning-based ARIMA-LSTM hybrid model is proposed in this article for predicting the COVID-19 outbreak by utilizing real-time information from the WHO’s daily bulletin report as well as provides information regarding clinical trials across the world. To evaluate the suitability and performance of our proposed model compared to other well-established prediction models, an experimental study has been performed. To estimate the prediction results, the three performance measures, i.e., Root Mean Square Error (RMSE), Coefficient of determination (R2 Score), and Mean Absolute Percentage Error (MAPE) have been employed. The prediction results of fifty countries substantiated the fact that the proposed ARIMA-LSTM hybrid model performs very well as compared to other models. The proposed model archives the lowest RMSE, lowest MAPE, and highest R2 Score throughout the testing, under varied selection criteria (country-wise). This article aims to contribute a deep learning-based solution for the well-being of livings and to provide the current status of clinical trials across the globe.
Keywords: COVID-19; deep learning; prediction; clinical trials; healthcare
The last couple of decades have experienced several pandemic situations. The Severe Acute Respiratory Syndrome (SARS) came into the picture in 2002. Afterward, in 2009, the world was combating with SWINE FLU. In 2013, the EBOLA virus, the Marsh virus in 2014, and currently in 2019, the entire world is struggling against the Corona Virus Disease-2019 (COVID-19) [1–5]. These pandemic encounters have a very severe impact on both the social as well as economic aspects of the countries. The COVID-19 infection first emerged from China in December 2019. As quoted by the Chinese government in their report that it was initially observed in the fish market of Wuhan city and documented as a new virus. It was initially named as the Wuhan virus. But after several laboratory studies, it has been renamed as COVID-19 or novel coronavirus [6,7].
Previous studies have established the fish market in Wuhan city as the origin of this virus, and it was also proposed that this virus was transmitted to humans by bats. Wuhan city witnessed the preliminary growth in the number of infected people, and within less time, it had taken the whole world into its trellis [8–10]. Such a dreaded situation compelled the World Health Organization (WHO) to declare it a pandemic disease in the first week of March 2020. Across the globe, 213 countries are affected by this pandemic, thereby making the current situation very perilous [11,12]. Initially, it was claimed to be an air-borne disease; however, a thorough investigation in the various laboratories throughout the world declared it as a touched contagious disease. The life cycle of COVID-19 may differ with variation in surfaces and environmental conditions. It can last from days to hours in different atmospheres or on different surfaces. Due to touched contagious disease, the exposure of this disease is more and can easily transmit from human to human and human to surface.
The emblematic worldwide situation, owing to the COVID-19 outbreak, has been illustrated in Fig. 1 with the bar graph. On the y-axis, the number of infected people, whereas, on the x-axis, the total number of infected cases, the total number of recovered cases, the total number of active cases, and the total number of deaths has been demonstrated [13].
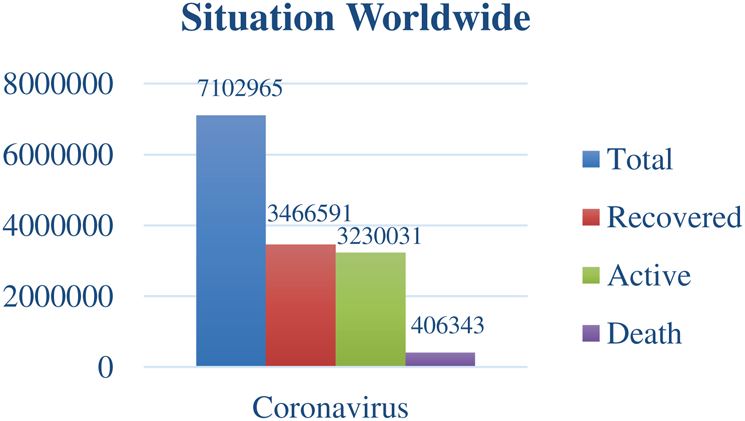
Figure 1: COVID-19 situation worldwide
Deep learning models offer ample of promises in the forecasting of time-series datasets. It is also capable of handling modeling problems, including temporal dependence and structures of the model [14,15]. Moreover, it plays a vital role in Exploratory Data Analysis (EDA). Both linear and nonlinear relationships are often included in various time-series models. The Autoregressive Integrated Moving Average (ARIMA) model is very competent in modeling the linear relationships in time series paradigms. But it is not applicable to the modeling of nonlinear relationships [16]. On the other hand, the Long Short-term Memory (LSTM) model is appropriate for modeling both nonlinear and linear relationships but may not offer the same result for all the datasets [17,18]. In order to overcome these limitations and achieve the best prediction results, the hybrid model concept has been introduced based on the differential modeling concept of nonlinear and linear components. Time to time, various hybrid time series prediction models have been introduced, and they have also achieved great success. It has been observed that better estimation can be obtained by applying multiple or hybrid learning algorithms than creative learning algorithms [19–21].
In a problematic epidemic situation, any small verdict may contribute a great help. As far as the algorithmic approach is concerned, the deep learning-based analysis for the COVID-19 outbreak is a complex but novel task. The model results can guide us to estimate the epidemic exposure and, accordingly, take preventive measures. The present article proposed a hybrid deep learning model for COVID-19 prediction. This hybrid model has been compared with the other models to assess its correctness and suitability. Apart from this, the current global status of clinical trials has been discussed.
The essential objectives of this study are:
To develop the deep learning-based ARIMA-LSTM hybrid model for predicting the COVID-19 outbreak with real-time information from the WHO’s daily bulletin report.
To contribute a deep learning-based solution for the well-being of livings and to provide the current status of clinical trials across the globe.
The structure of this research article is as follows. In Section 2, the recent works and findings related to COVID-19 have been summarized. The Dataset description, along with the used methodologies and statistical parameters, has been described in Section 3. Section 4 deals with the statistical parameters based on experimental results. Section 5 comprises the prediction results along with the current status of clinical trials across the globe. The concluding remarks with the possible future scopes have been discussed in Section 6.
Information Technology (IT) faced massive advancement in the last couple of decades. It plays a vital role in providing solutions for the healthcare domain, such as disease detection and prevention. The digital market, too witnessed immense growth for the last few years. In other words, enormous growth is noted in the field of digital technologies. At present, the pandemic situation caused by COVID-19 also necessitated technical assistance in the handling of such a complicated circumstance [22]. Ting et al. [23] detailed the latest digital technologies based on potential applications, implemented to provide a solution for COVID-19 detection, monitoring, and prevention. The authors had explained digital technologies such as Big-data analytics, the Internet of Things (IoT), Blockchain, Artificial Intelligence (AI), and Deep Learning. Moreover, the authors identified the impact of the COVID-19 epidemic on the healthcare domain. The ARIMA model for the prediction of COVID-19 spread was proposed by Benvenuto et al. [24]. This article emphasized the prevalence-based forecasting of the COVID-19 outbreak for the next two days. With the help of ARIMA and correlogram graphs, this paper also highlighted the prevalence and incidence-based forecasted results.
Deb et al. [25] put forward a time-series model for predicting the incidence pattern and estimating the reproduction rate of the COVID-19 outbreak. The trends of the epidemic in various countries were determined by suitable statistical methods in this article. It also highlights the current situation of the epidemiological stages in different regions. As per the present scenario, early detection of the spread patterns is essential as it helps in the planning and controlling of the outbreak by taking efficient preventive measures. A scientific model proposed by Kucharski et al. [26] deals with the critical analysis of SARS-CoV-2 transmission on different datasets to comprehend the COVID-19 outbreak outside and inside Wuhan city. With the aid of this model, the authors could explore the possible towns (outside the Wuhan city) where the infection was likely to propagate.
The EDA based COVID-19 outbreak analysis has been utilized in several studies. The EDA is executed on the various available datasets of COVID-19. These recent studies are focused on confirm, recover, and death cases across the world to elucidate the outbreak pattern and devise the preventive police accordingly [27]. Lauer et al. [28] conducted a critical study on the incubation period of COVID-19. In this crucial study, they had examined 181 confirm cases to identify the ideal incubation period. This critical study revealed that the incubation period is dynamic and can be between the 5 to 14 days timestamp. Finding from this study helped the government to plan better control activities and surveillance facilities. Short term predictions for twenty-five COVID-2019 infected countries had been documented by Singer [29]. This research work had quoted that the country-specific or location-specific rate of COVID-19 outbreak depends on the steady or explosive power-method with varying scaling exponents. In this study, the effect and pattern of lockdown throughout the world were also analyzed by the authors.
It is quite evident from the above literature that there is adequate research work on COVID-19 data analysis to understand the recent pattern of epidemics. However, there is still plenty of opportunities for developing and testing effective deep learning-based prediction models. Thus, correct and appropriate prediction models can aid in fostering proactive policies to meet immediate needs.
This section encompasses the various materials and methods exploited in procuring the result findings. This section is divided into three subsections. The first subsection presents the exhaustive discussion about the dataset. The mathematical modeling with a brief introduction about various forecasting models has been described in the second subsection. In the third subsection, a brief discussion about the statistical analysis has been drawn.
In this study, the data was obtained from the WHO. We have extracted the data from the WHO’s daily health bulletin reports on a daily basis. The data, considered for this article, are from WHO’s health bulletin of 31/12/2019 to 10/6/2020 time-span. This dataset consists of information regarding the number of active cases, number of new cases, number of confirmed cases, number of recovered patients, the total number of deaths, date, and the country name [13]. The current situation of the COVID-19 reveals that the virus has affected approximately 213 countries. It has reached its worst stage in various countries, referred to as the community-level spread. With the immense number of daily new cases and the increment in the death toll, these countries’ situation is getting worse day by day.
The COVID-19 dataset is observed to understand the seriousness of the pandemic situation. This visualization is based on the total number of confirmed cases in the period of 31/12/2019 to10/6/2020 and illustrated in Fig. 2. The circle area represents the exposer in the respective countries. The map has been plotted by using the geographical location of the infected countries.
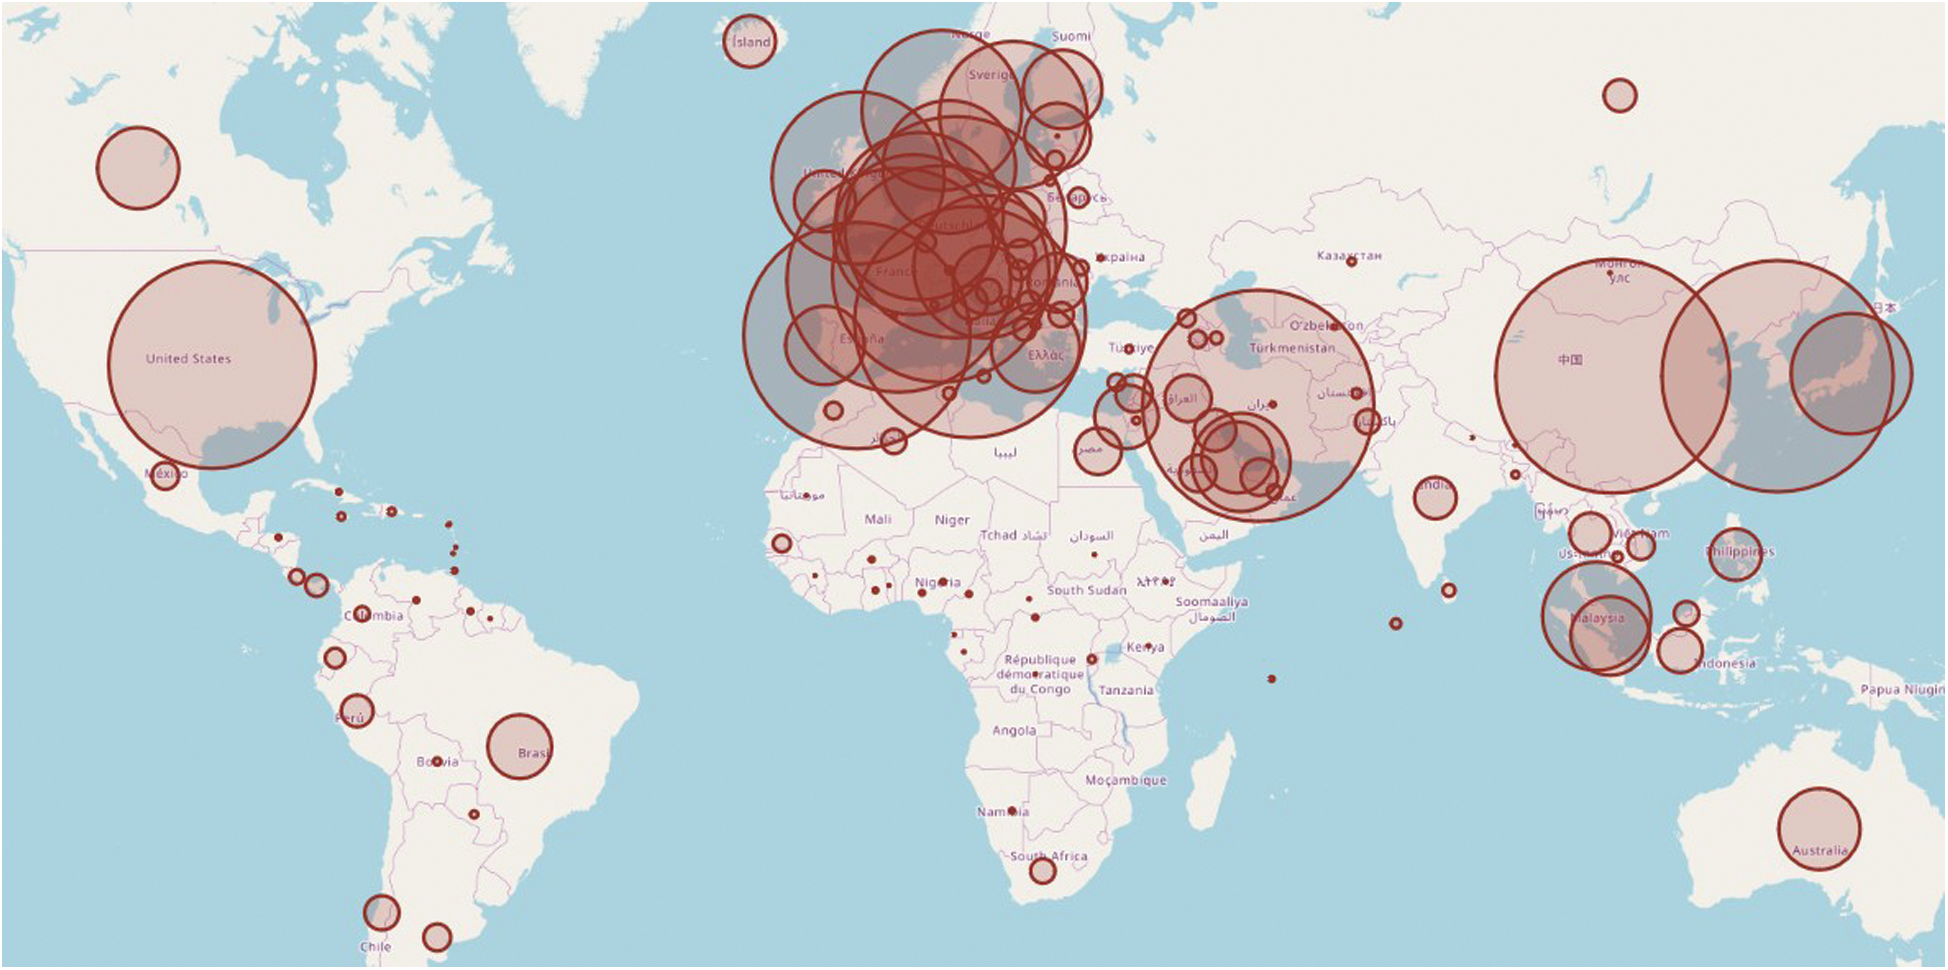
Figure 2: Novel coronavirus outbreak worldwide
This section deals with the basic principles and modeling procedures of the various models (such as LSTM, ARIMA, and proposed hybrid model) used for the prediction of the COVID-19 outbreak. All the simulation is accomplished on a Dell workstation having the configuration of 64-bit Intel Xeon Processor with 3.60 GHz speed and 32 GB of RAM. All the algorithms deployed for the simulation have been implemented in Python.
3.2.1 Autoregressive Integrated Moving Average (ARIMA)
ARIMA model is one of the widely used time series prediction models. It was introduced in 1976 by the Box and Jenkins. It can be easily applied to all the application areas attributed to its robust data processing and operational prediction capabilities. The ARIMA model comprises of three essential tasks or processes, such as diagnostic checking, identification, and prediction [30]. With the help of a diagnostic check, we can apply the stationarity control mechanism on the time series dataset. The series is said to be stationary only if the statistical properties such as mean, covariance, and variance are directly related to time. Thus, for a practical and useful prediction, it is essential to incorporate it while developing the ARIMA model. The differencing (d) task is performed on the appropriate degree to make the non-stationary time series to the stationary time series. This process is continued until the stable time series has been achieved. ARIMA model is made up of the three beneficial fundamental aspects which have been used to characterize time series. These aspects are:
• Autoregressive terms (AR)—It is responsible for storing and retrieving the past information of the process.
• Integrated terms (I)—It is responsible for converting the non-stationary time series to the stationary time series.
• The moving average (MA)—It is responsible for regulating the noise-related past information of the process.
The mathematical formulation of the ARIMA model is depicted in Eq. (1) with the help of three fundamental aspects, such as AR, I, and MA. The value of autoregressive (AR) and moving average (MA) parameters are determined by  and
and  , respectively. In 1983 the Newbold defined the ARIMA model as
  , where
  denotes the degree of the AR (Autoregressive),
  signifies the differencing degree, and
  indicates the degree of the MA (Moving Average).

where  are the Autoregressive (AR) parameters,
  are the Moving Average (MA) parameters,
  represents the time,
  are the unknown random residuals (errors), observed data are designated by
  , and error data are presented by
  .
.
3.2.2 Long Short-Term Memory (LSTM)
The LSTM model, developed in 1997 by Hochreiter et al. [31], is a particular type of Recurrent Neural Network (RNN) model. LSTM model had been designed to learn from long-term dependencies. It consists of the complex structure inside the hidden layers, which is known as LSTM. Nowadays, LSTM is a trendy and widely used deep learning model adopted in various application areas [32]. The underlying LSTM architecture has been outlined in Fig. 3.
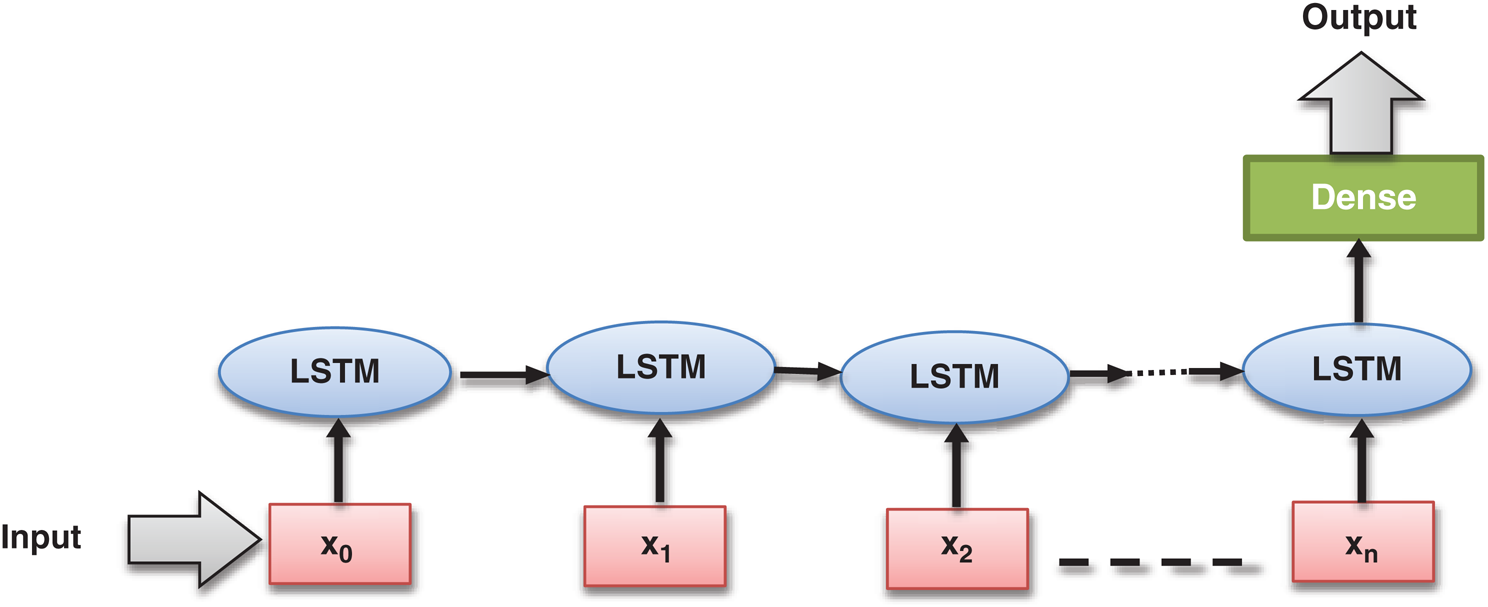
Figure 3: Basic long short-term memory (LSTM) architecture
The basic structure of the LSTM involves the memory-based RNN cell. This memory cell is beneficial for storing information and retrieving past information. This memory cell aids in the transmission of prior information to the next level. The model selects previous information based on its training requirements. Remembering useful information over a long period is regular exercise, but an essential behavior of the LSTM network [33]. The basic LSTM structure has been delineated in Fig. 4.
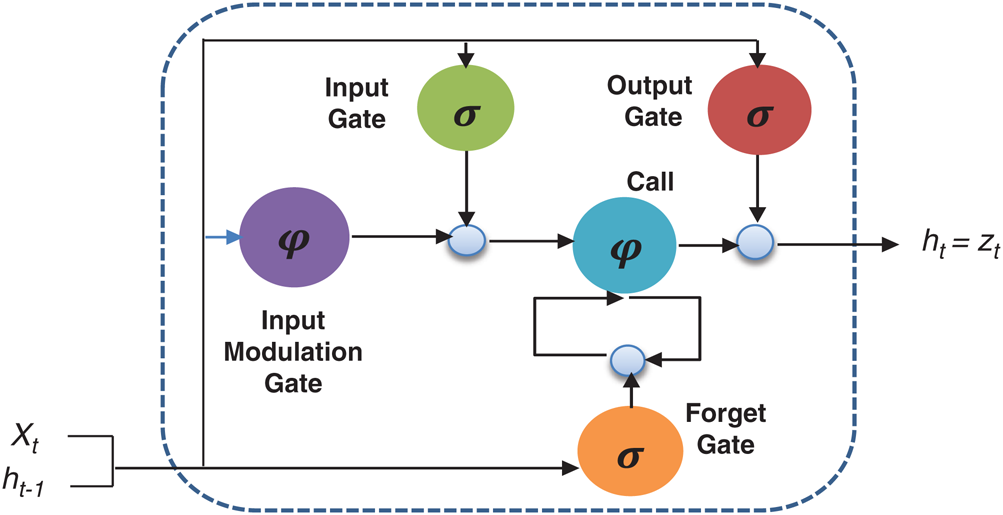
Figure 4: Basic structure of LSTM
Here the  denotes the input data or output of the previous unit at the time
  ,
,  represents the hidden output unit, and
  stands for the previous or past output. The LSTM model contains various gates, such as Input gate, output gate, forget gate, and input modulation gate. The input gate
  , forget gate
  , and output gate
  for the LSTM model are computed using Eqs. (2), (3), and (4), respectively.
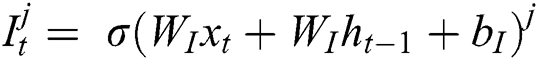
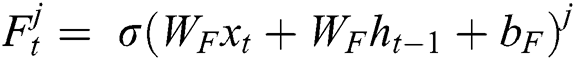
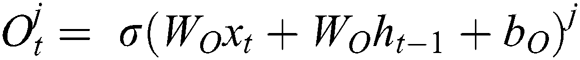
where  represents the sigmoid function,
  symbolizes the voltage vectors, and
  denotes the weight matrices.
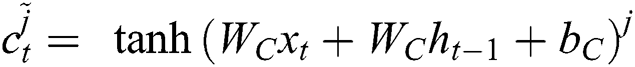
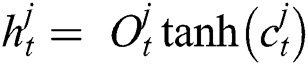
In the LSTM model, the memory is preserved at time  and then the updated memory function
  is calculated following Eq. (5),
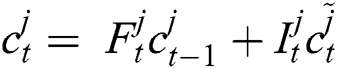
Now, with the help of Eq. (6), the updated new memory content is determined, and then, Eq. (7) is employed to estimate the output of the LSTM model.
Like other Artificial Neural Networks (ANNs), the training task on LSTM networks is managed by the epoch. The epoch is responsible for evaluating the network weight  . The epoch specifies this network weight, and it depends upon the number of iterations on the given dataset. The model optimization by updating the weights is an essential task for deep learning algorithms. Thus, the transmission of the entire data on the same network over multiple times is a prudent task, and with the help of this, we can target a more accurate and better predictive model. However, it is unclear how many epochs would be required to achieve optimal weights because each dataset may consist of different behaviors. Thus, the best train network may require different numbers of epochs.
Various time-series models may include both linear and nonlinear relationships. The ARIMA model is very efficient in modeling the linear relationship in time series paradigms. However, it is insufficient for modeling of the nonlinear relationships. On the other hand, the LSTM model is suitable for modeling both nonlinear and linear relationships, but the same result may not be obtained for all the datasets. The hybrid model concept had been introduced, which relies on the differential modeling concept of nonlinear and linear components to overcome these challenges and achieve the best prediction results. Various hybrid time series prediction models have been introduced with time, and they have also achieved great success. It is also perceived that in comparison to the creative learning algorithms, better estimation and performance may be obtained by using multiple or hybrid learning algorithms [34]. These hybrid models are developed based on the concept of supervised learning algorithms. The primary aim of these hybrid models is to make the model more diverse with better prediction results [35,36].
From the experimental evaluation, the result obtained from the hybrid model and the result obtained from the individual model, though unrelated to each other, are much capable of minimizing the general error or variance [37]. This reason has contributed to making the hybrid model, the most successful and recognized model for prediction paradigms.
Several hybrid models have been reported in various studies. These models follow the nonlinear and linear paradigms for the prediction of time-series data. Taking the motivation from there, we proposed the ARIMA-LSTM Hybrid model for the prediction of COVID-19 outbreak across the world. The working of our proposed ARIMA-LSTM hybrid model has been summarized in Fig. 5.
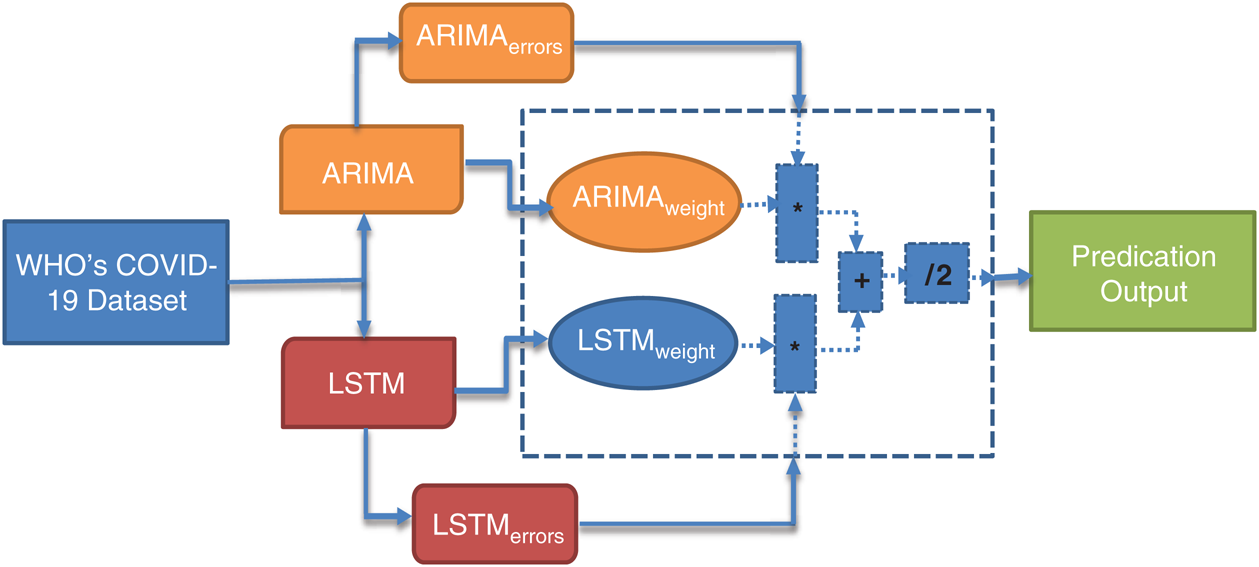
Figure 5: Working principle of the proposed ARIMA-LSTM hybrid model
The time series prediction model is usually expressed as the sum of nonlinear and linear components [38]. The mathematical formulation of the time series prediction model is shown in Eq. (8).
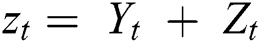
where  and
and  are linear and nonlinear components of time series, respectively.
In our ARIMA-LSTM hybrid model, the linear component  is computed by the ARIMA model, whereas the nonlinear component
  is evaluated by the LSTM model. After estimating the linear and nonlinear components, the error values of ARIMA and LSTM are calculated by Eqs. (9) and (10), respectively.


After calculating the errors, the appropriate weights for ARIMA and LSTM models are computed following Eqs. (11) and (12), respectively.
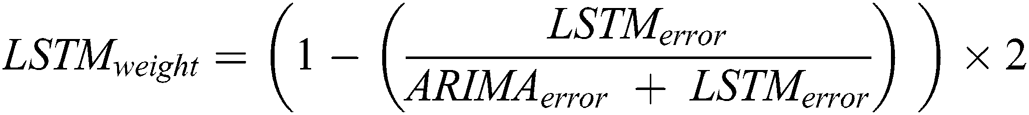

Now, with the help of the models’ weight and error, the predicted values of the hybrid model are calculated following Eq. (13).

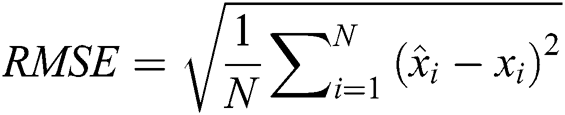
Statistical analysis is based on three performance evaluation metrics, i.e., Root Mean Squared Error (RMSE), Coefficient of Determination (R2 score), and Mean Absolute Percentage Error (MAPE). These performance evaluation metrics facilitate the measurement of the performance, accuracy, and suitability of these prediction models. In this section, the mathematical foundation of evaluation metrics has been discussed in detail [39].
3.3.1 Root Mean Square Error (RMSE)
The RMSE is one of the indispensable statistical measures commonly adopted for validating prediction results. RMSE is nothing but a standard derivation for residuals. The residual is one of the critical error predictors that estimates the distance among the regression line and data points. Where squares of errors are denoted by  , the number of errors is represented by
  , observed values are indicated by
  , and the forecasted values are designated by
  .
.
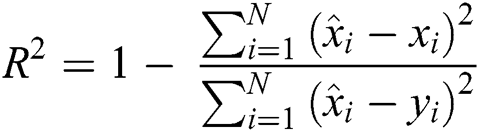
3.3.2 Coefficient of Determination (R2 Score)
R2 Score is also known as the Coefficient of Determination. It is one of the essential statistical measures which is commonly used to authenticate the prediction results. The R2 Score is measured by subtracting the division ratio by one. Where the division ratio is the ratio of explained variation (first sum of squares of errors) by the unexplained variation (second sum of squares of errors). Where squares of residuals are represented by  ,
, squares of the total is signified by
 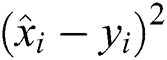 , the number of errors is denoted by
  , observed values are indicated by
  ,
,  , and
, and  stands for the forecasted values.
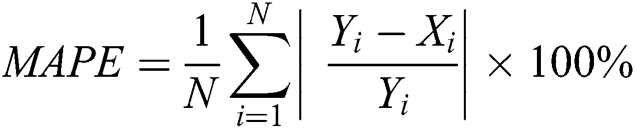
3.3.3 Mean Absolute Percentage Error (MAPE)
The MAPE is one of the vital statistical measures commonly employed to elucidate the accuracy of the prediction model. Where the number of predicted samples is denoted by  , actual values are indicated by
  , and predicted values are represented by
  i.
i.
The identification of accurate prediction models that could efficiently predict the COVID-19 outbreak across the world is a very complex but novel task. The fundamental objective of this study is to construct such a prediction model that can accurately envisage the outbreak of COVID-19 worldwide. All preventive policies count on the prediction results. Henceforth, accurate prediction is an essential requirement in recent times. An exact prediction model will indulge in drafting effective strategies to minimize the risk of the COVID-19 outbreak.
In Fig. 6, two traditional time-series prediction models and a proposed model, i.e., ARIMA, LSTM, and ARIMA-LSTM hybrid model have been demonstrated. These prediction models have been applied in the forecasting of the COVID-19 outbreak globally. The purpose of this study is to assess the exactness and aptness of the proposed model among the traditional time-series prediction models.
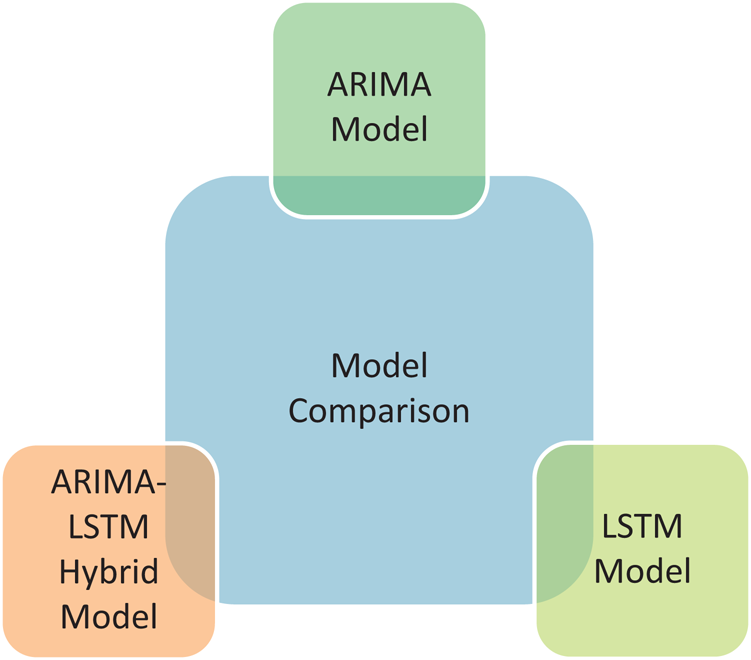
Figure 6: Prediction models comparison- A quick lookup
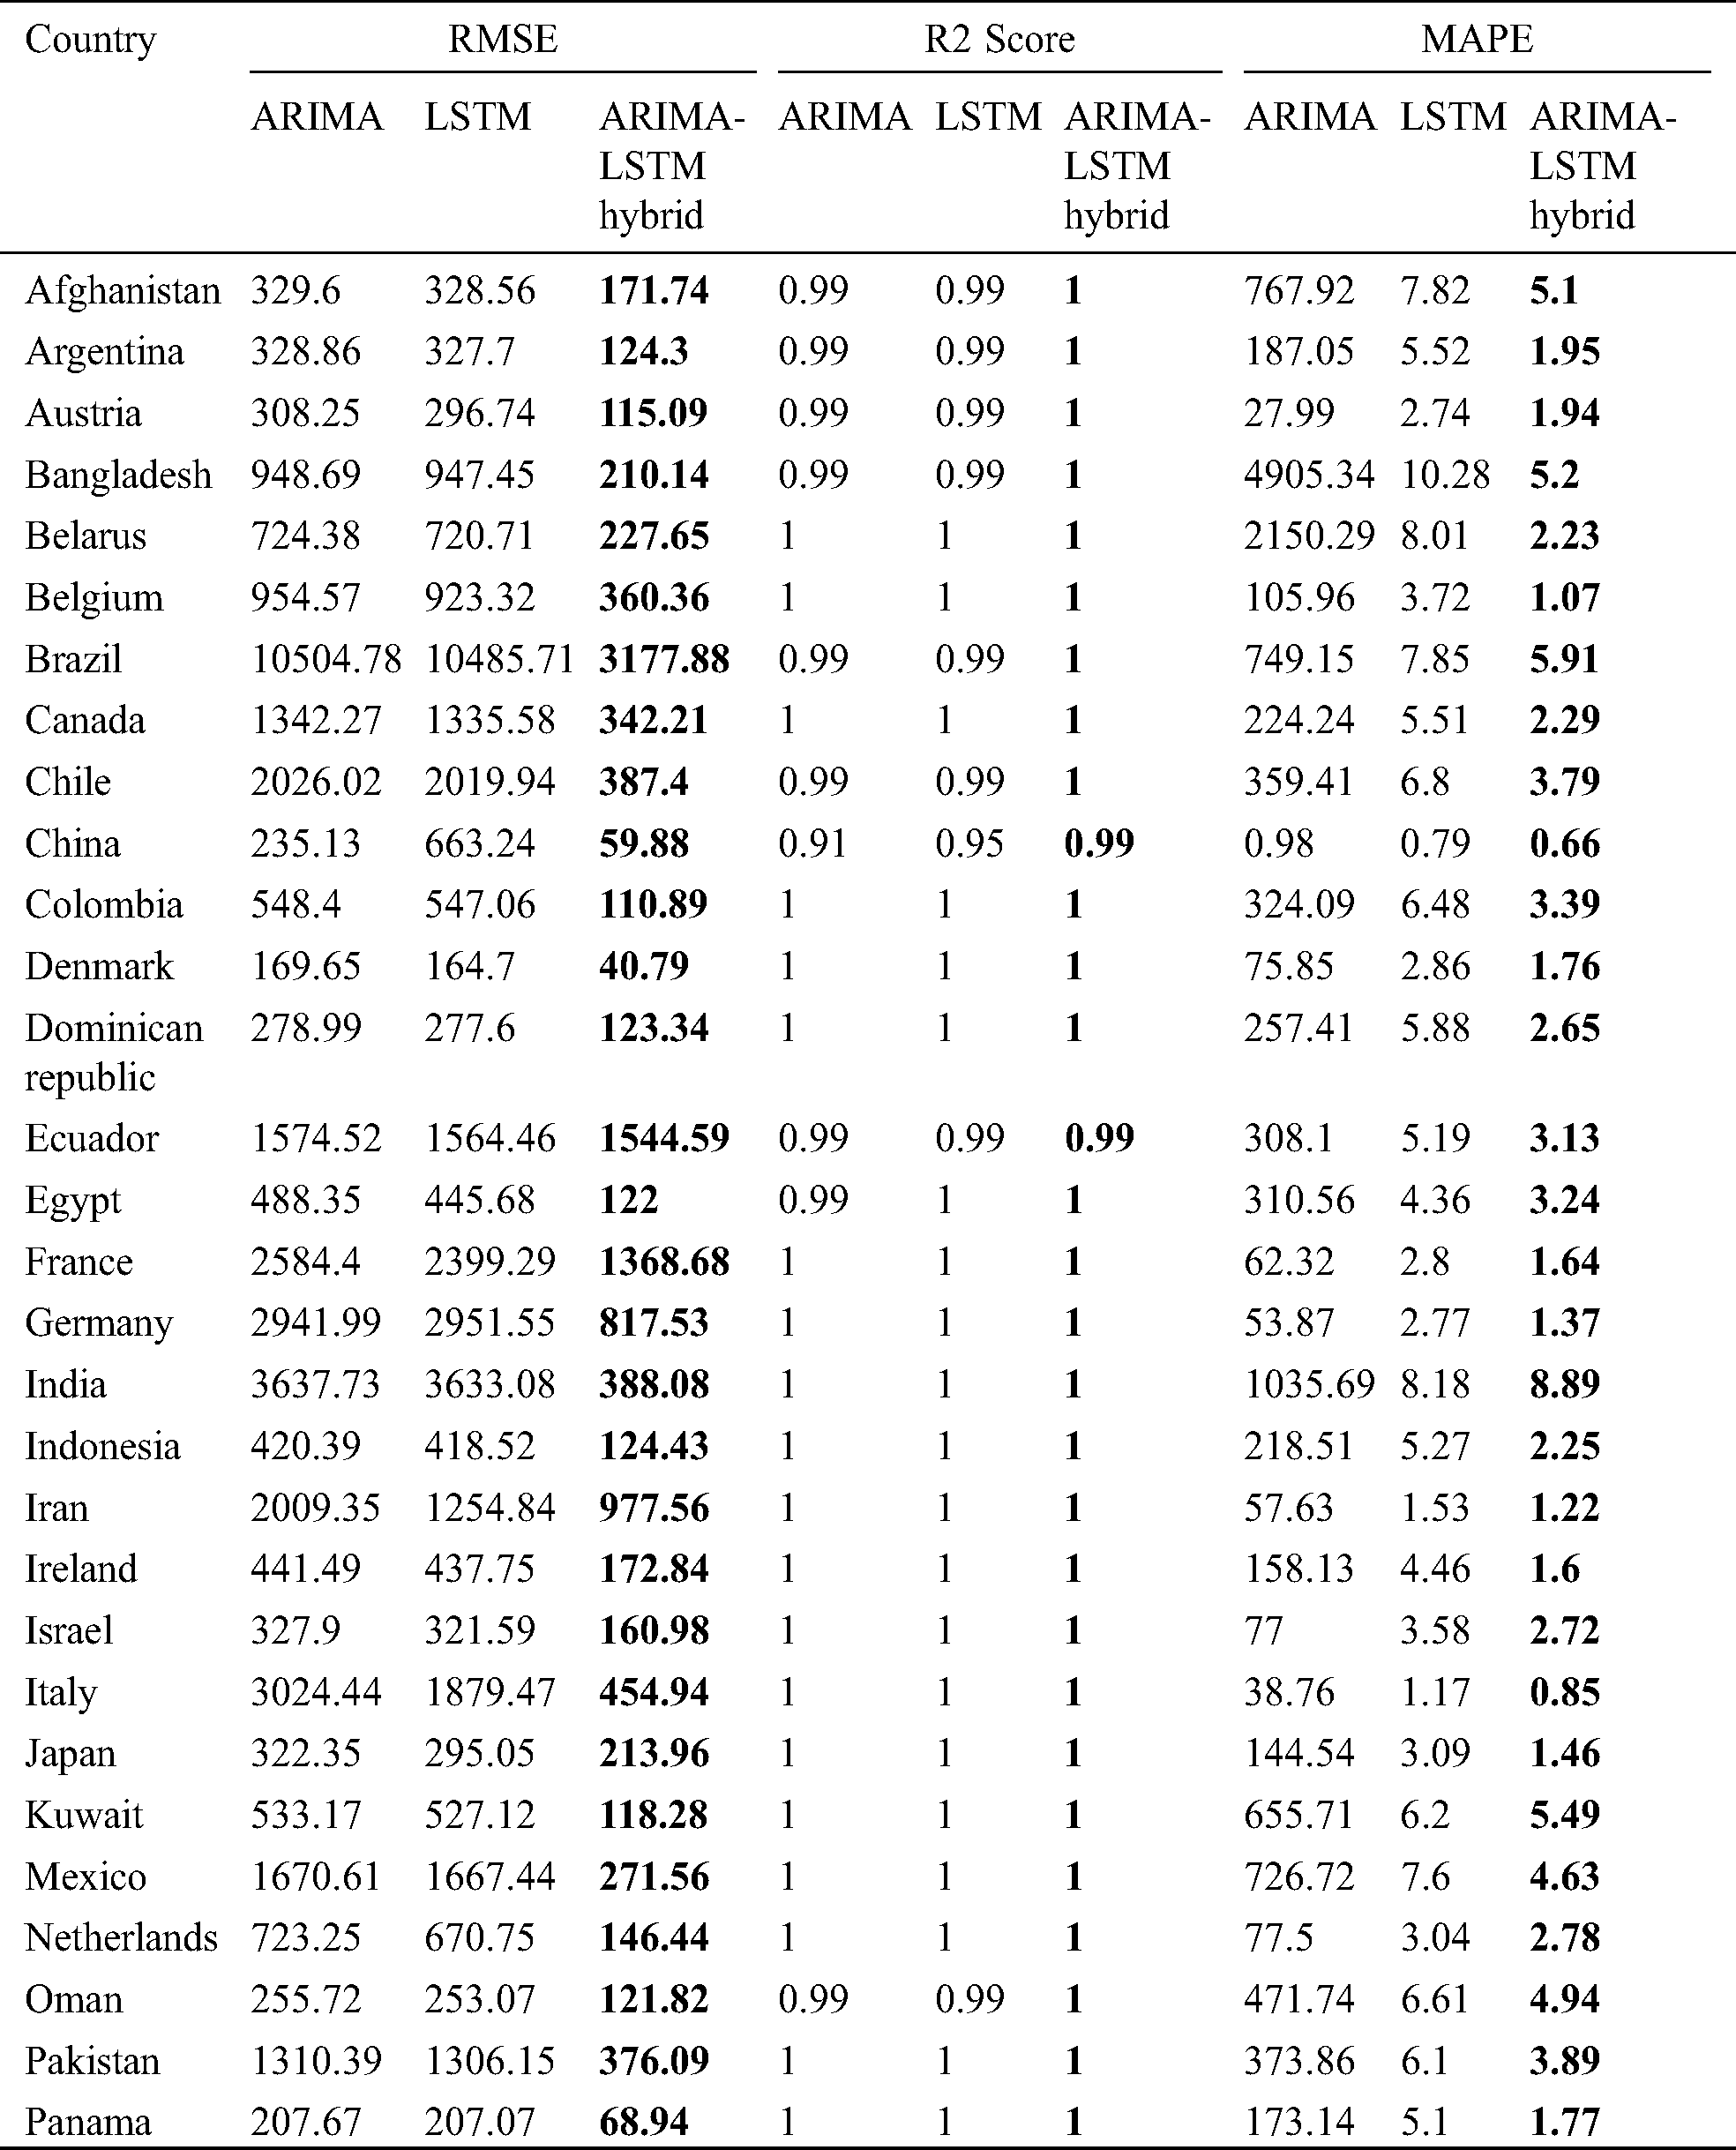
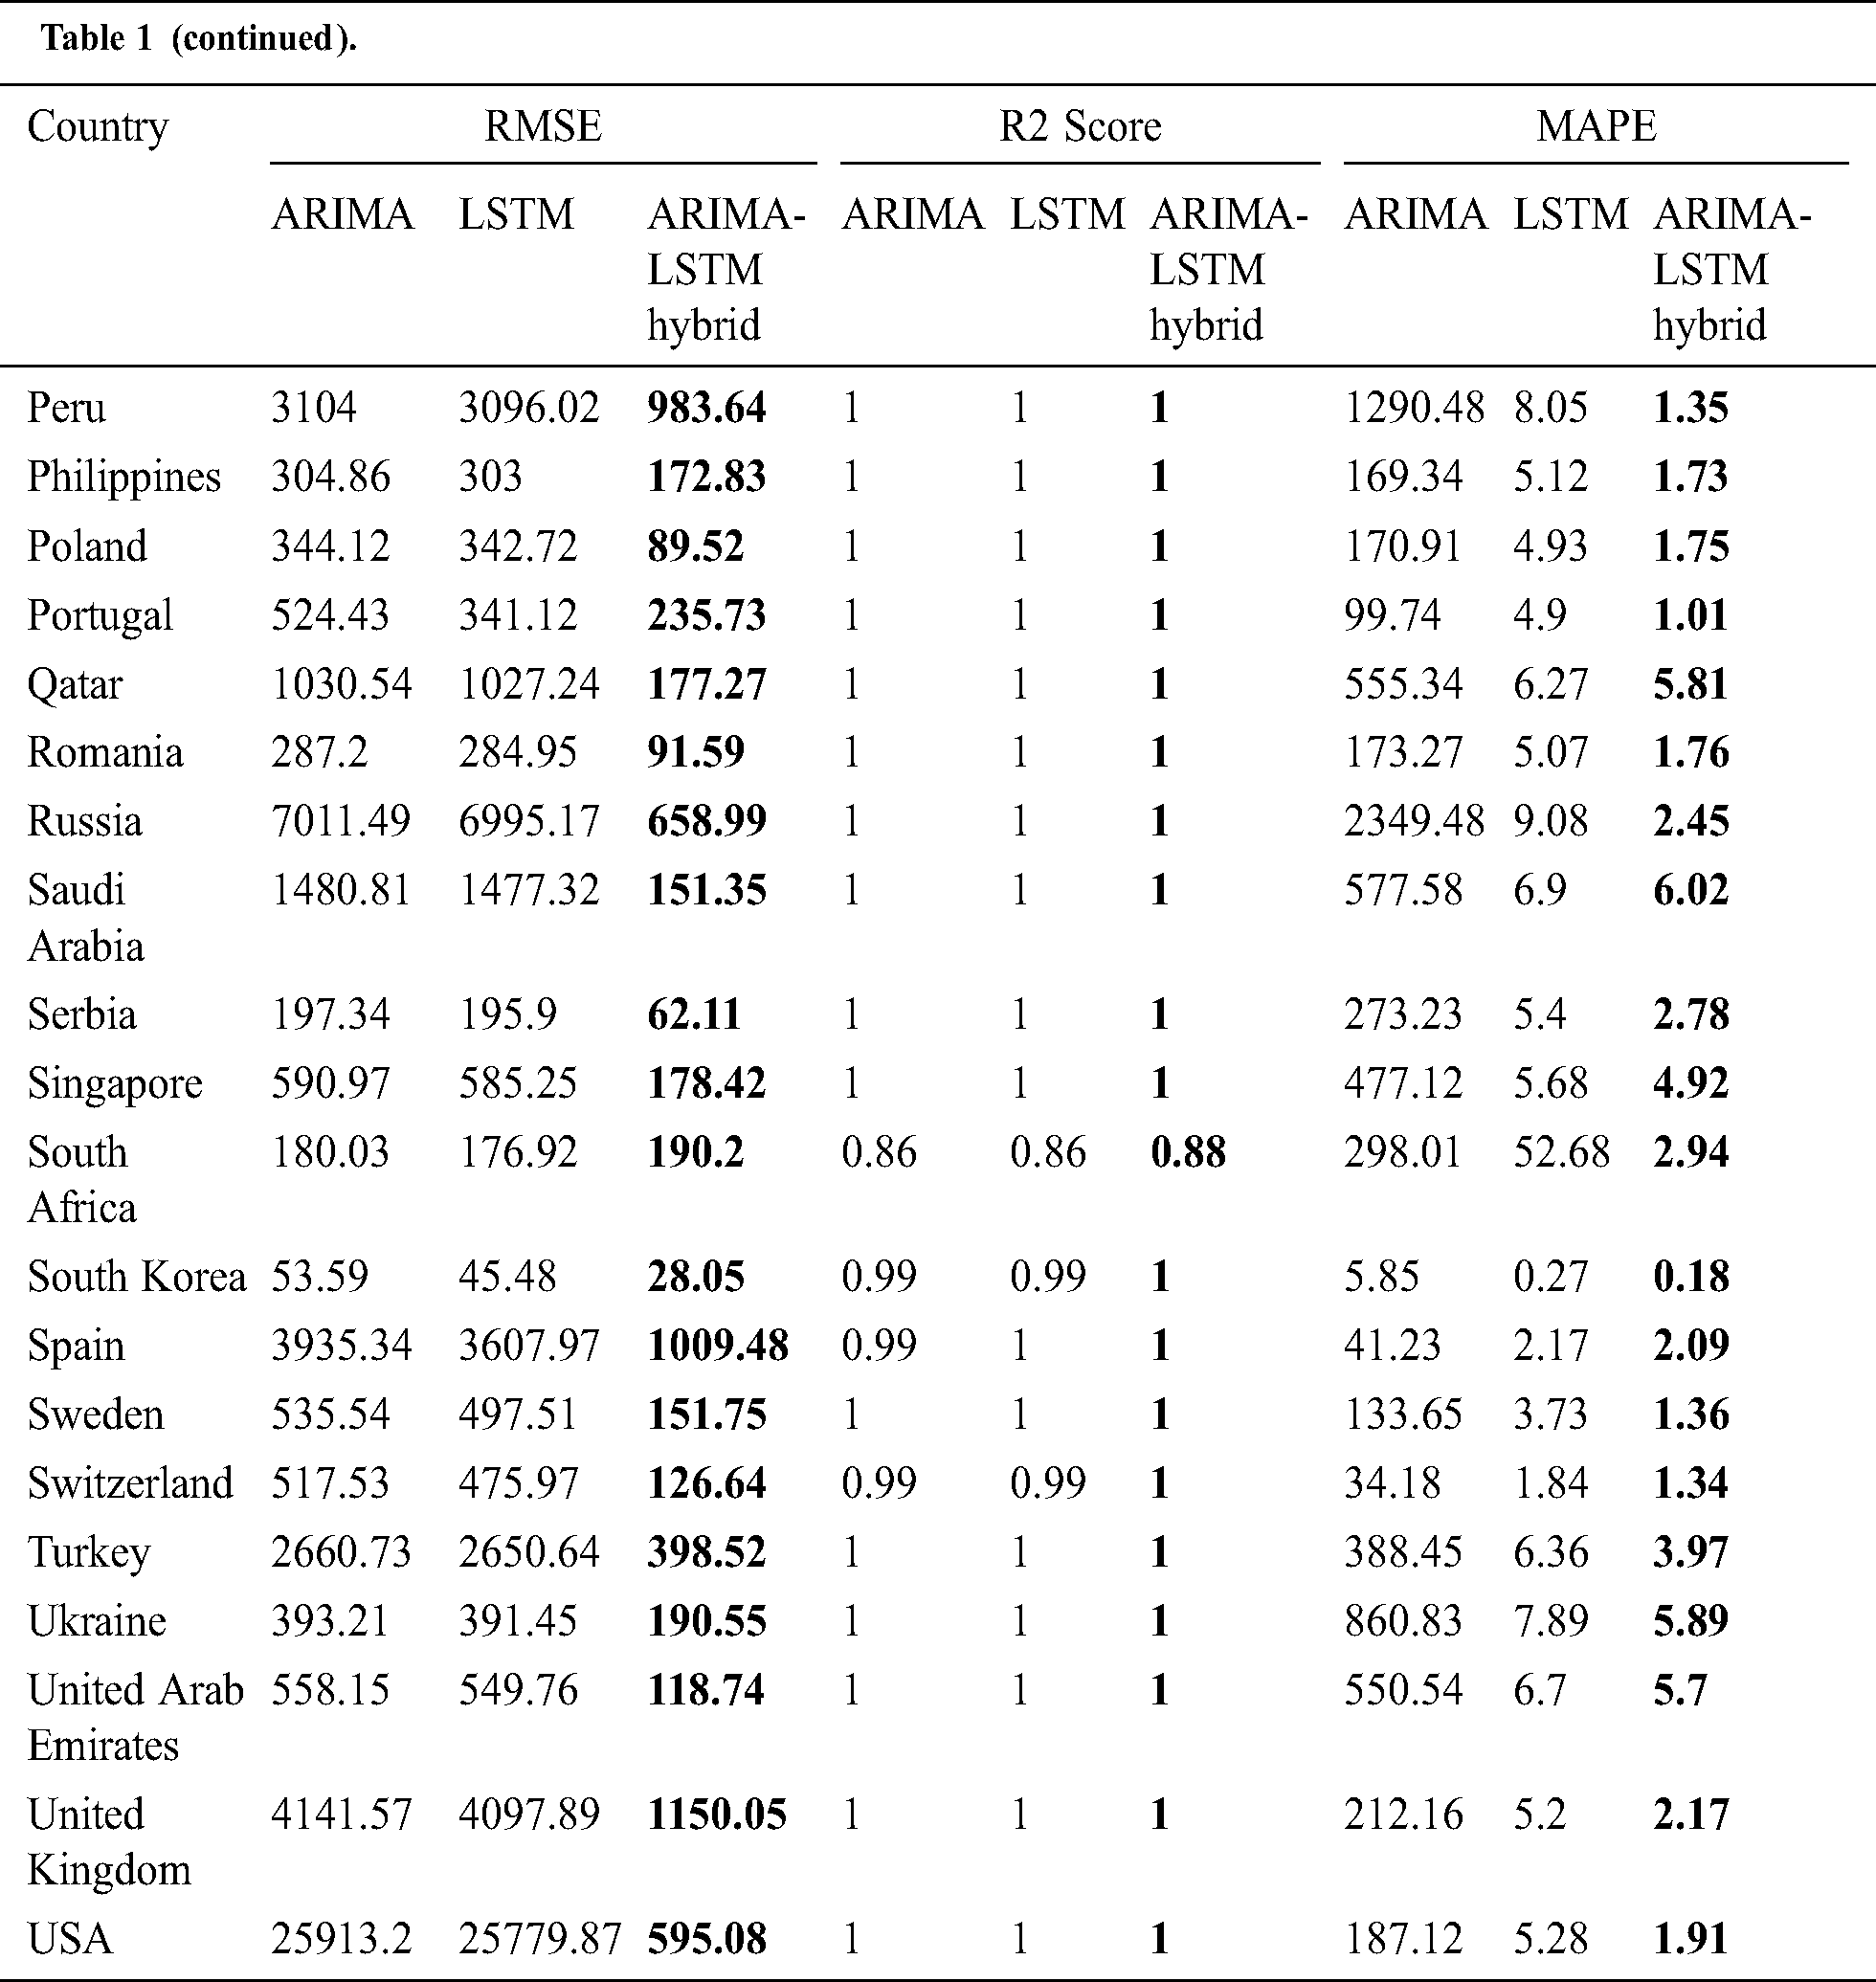
The prediction model’s performance evaluation on the COVID-19 outbreak (confirmed cases) across the globe has been summarized in Tab. 1. Among 213 affected countries, the top 50 countries have been considered for this prediction task [13]. The key intention of this experimental analysis is to reveal the suitability and correctness of the proposed ARIMA-LSTM hybrid model. For this purpose, two well established time series prediction models, i.e., ARIMA and LSTM, have been considered. The three performance measures, i.e., RMSE (should be low), R2 Score (should be high), and MAPE (should be low) have been used for evaluating the prediction results. From the prediction results of fifty countries, it is quite evident that the proposed ARIMA-LSTM hybrid model performs exceptionally well, as compared to other time series prediction models. The proposed model archives the lowest RMSE, lowest MAPE, and highest R2 Score throughout the testing, under various selection criteria (country-wise).
Table 1: Performance evaluation of the prediction algorithms (confirmed cases)
The experimental evaluation is done by extracting the data, recurrently, from the WHO’s daily health bulletin reports. The data we have taken into consideration for analysis is for the tenure—31/12/2019 to 10/6/2020 [13]. The WHO’s daily health bulletin reports document country-wise information about the number of active cases, number of new cases, date, country name, number of confirmed cases, number of recovered patients, the total number of deaths, date, and the country name [13]. The data for the top 15 most affected countries have been collected from WHO’s COVID-19 dataset and used for experimental investigation. The forecasting models such as ARIMA, LSTM, and proposed hybrid model (ARIMA-LSTM) have been trained with WHO’s dataset in the 60–40 ratio, which means 60 percent of the dataset has been used for training, and the rest 40 percentage has been used for testing purposes.
Statistical parameters, i.e., RMSE, R2 Score, and MAPE based forecasting results, have been depicted in Figs. 7, 8, and 9, respectively. The statistical parameter-based results substantiate the fact that among all the forecasting models, the proposed ARIMA-LSTM hybrid model is more suitable for the prediction of the COVID-19 outbreak.
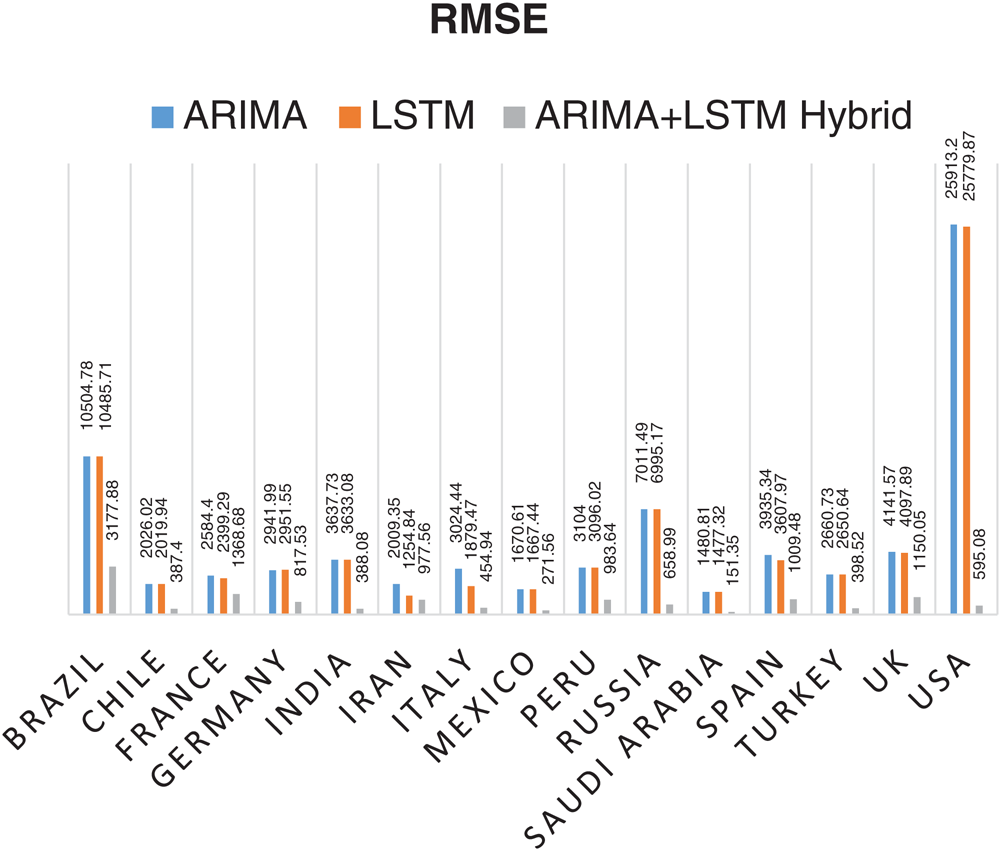
Figure 7: Root Mean Square Error (RMSE) based prediction results of COVID-19 outbreak
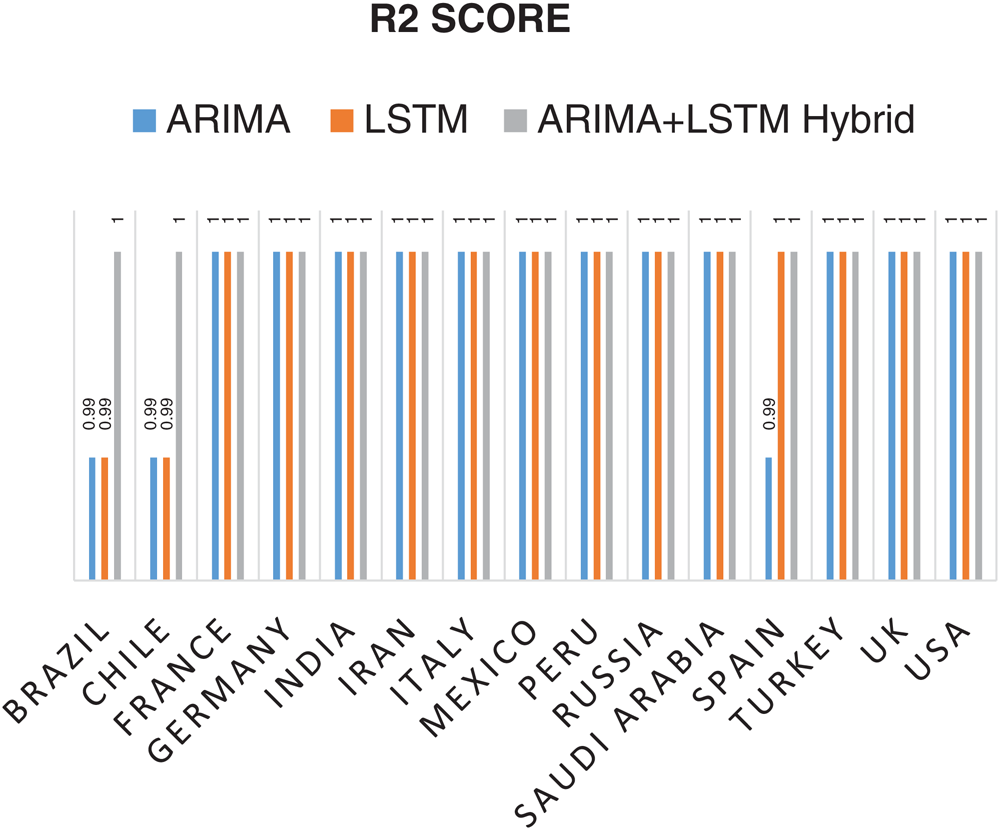
Figure 8: Coefficient of Determination (R2 Score) based prediction results of COVID-19 outbreak
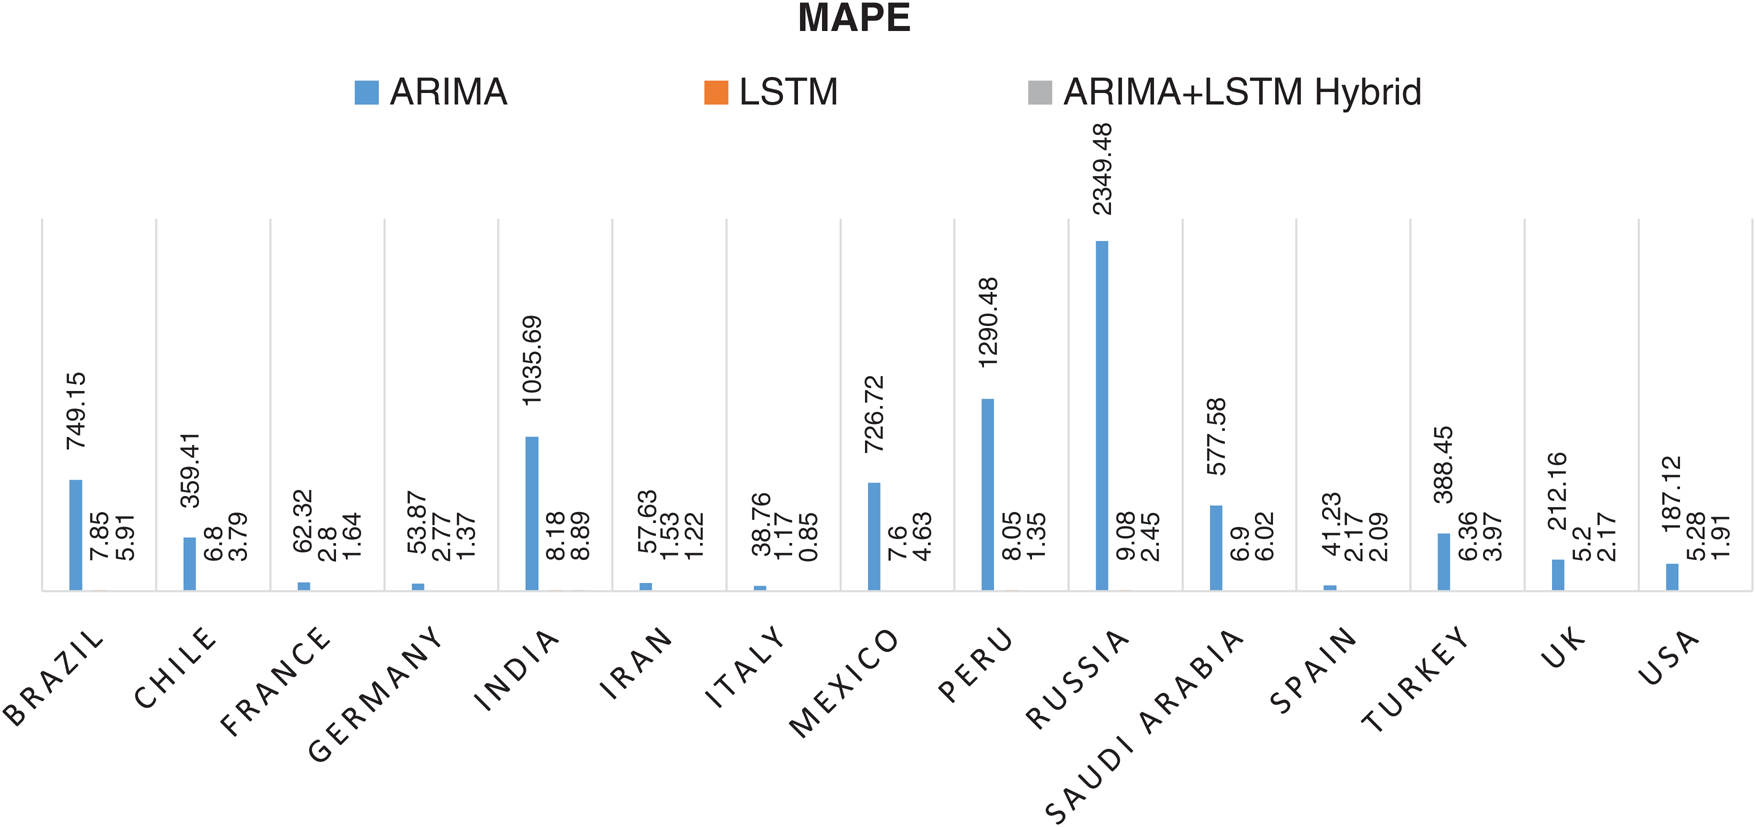
Figure 9: Mean Absolute Percentage Error (MAPE) based prediction results of COVID-19 outbreak
The predictive trends of the COVID-19 outbreak based on ARIMA, LSTM, and proposed ARIMA-LSTM based hybrid model have been reported in Fig. 10. The x-axis and y-axis represent the testing samples and the target values (total number of cases), respectively. The experimental evaluation was executed by estimating the data for the top 15 most affected countries from the WHO’s COVID-19 daily health bulletin reports. The experimental analysis accounts for the comparison between the predicted values (observed values) and actual values (real values). The experimental results verify the better performance of our proposed hybrid algorithm as compared to the traditional algorithms (i.e., ARIMA and LSTM) for the prediction of the COVID-19 outbreak.
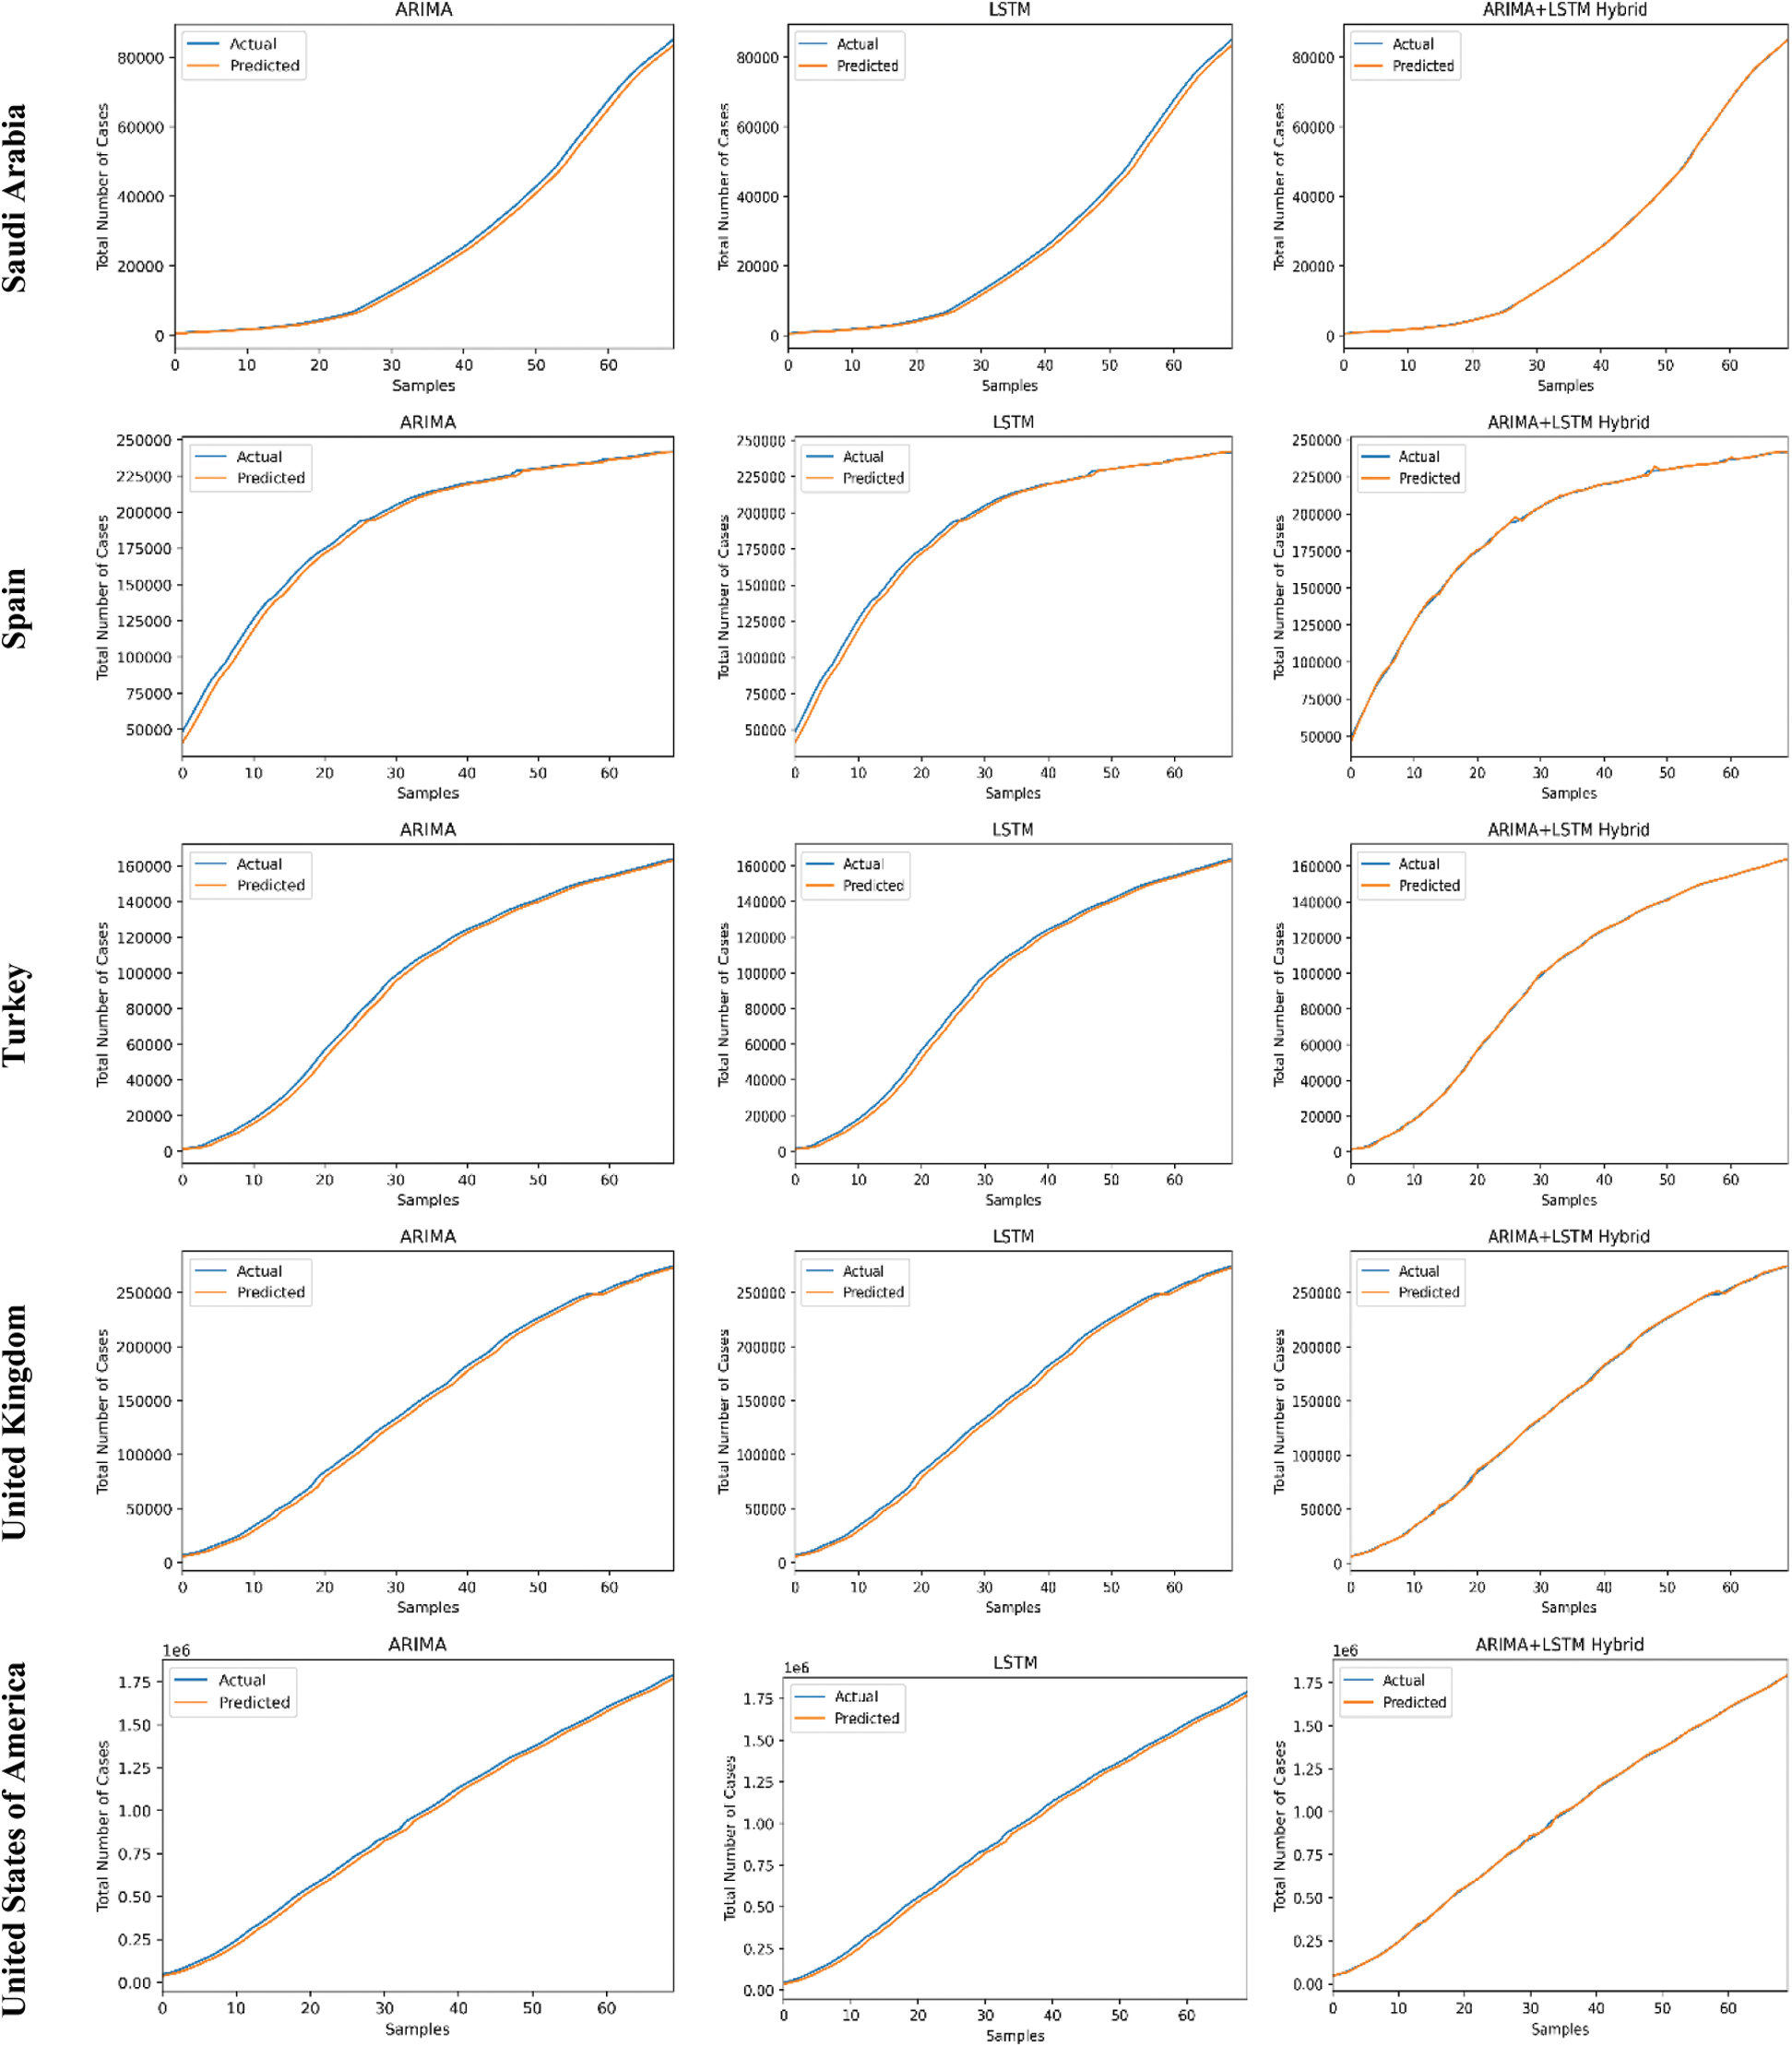
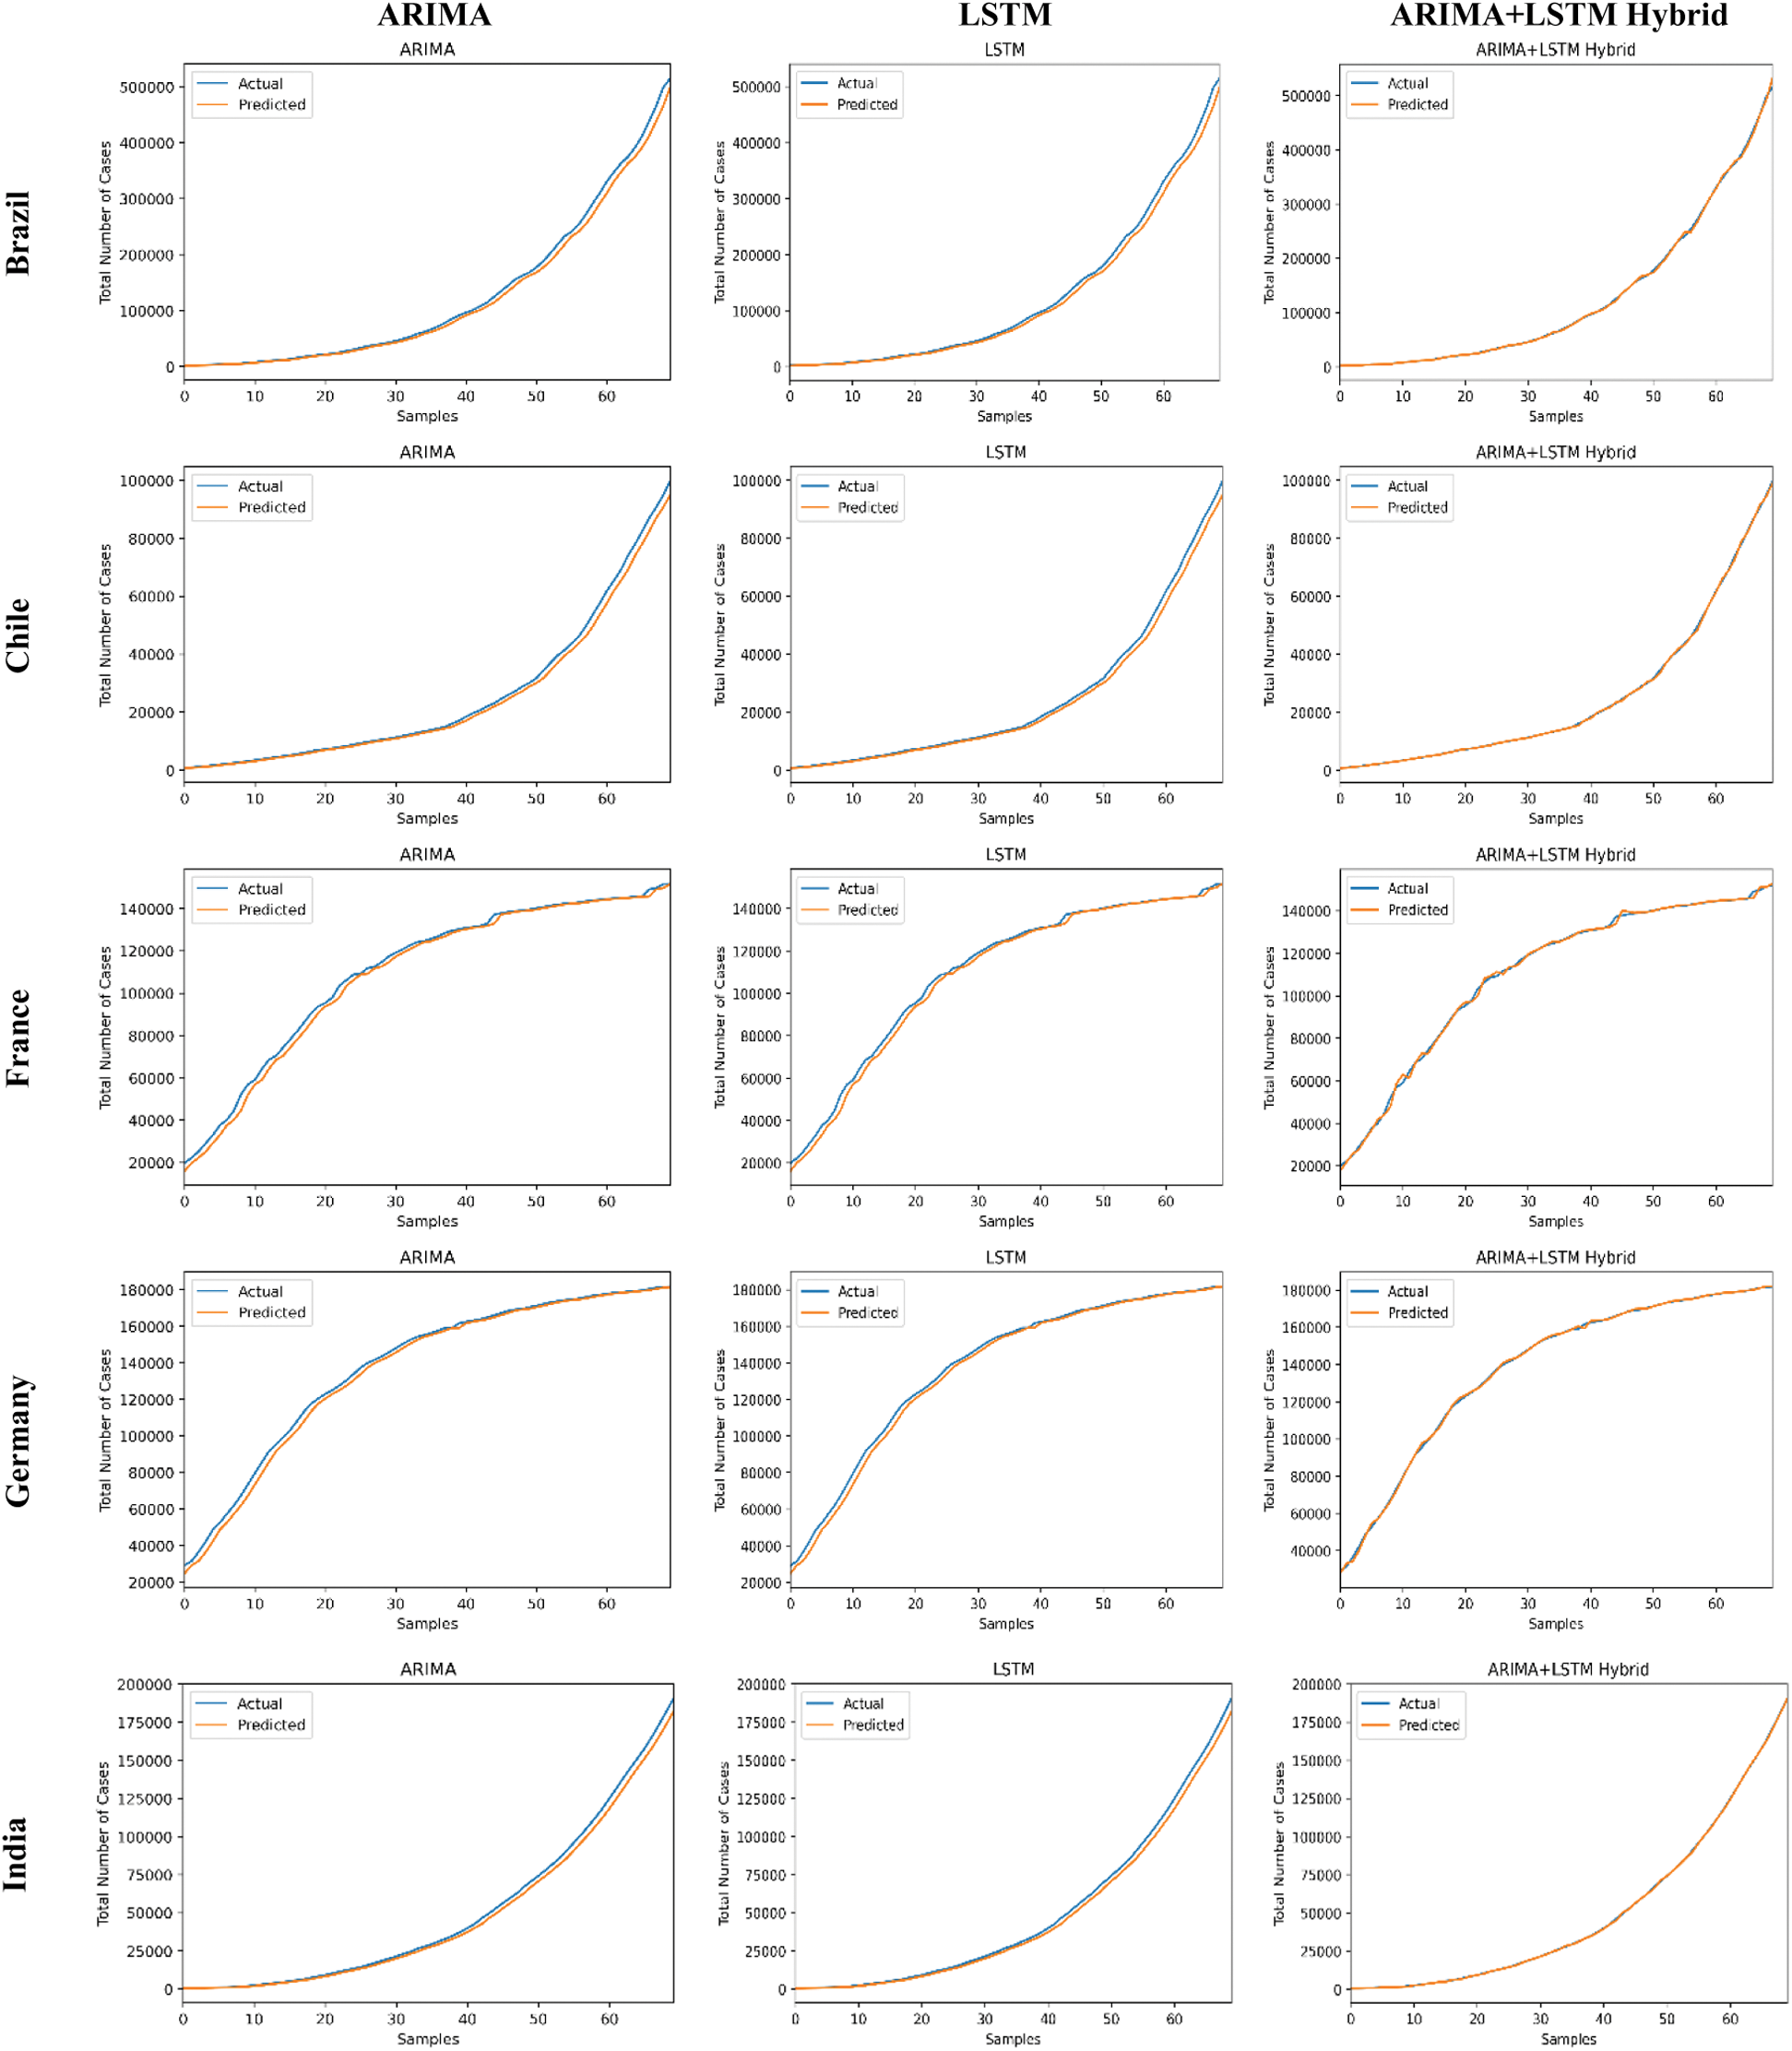
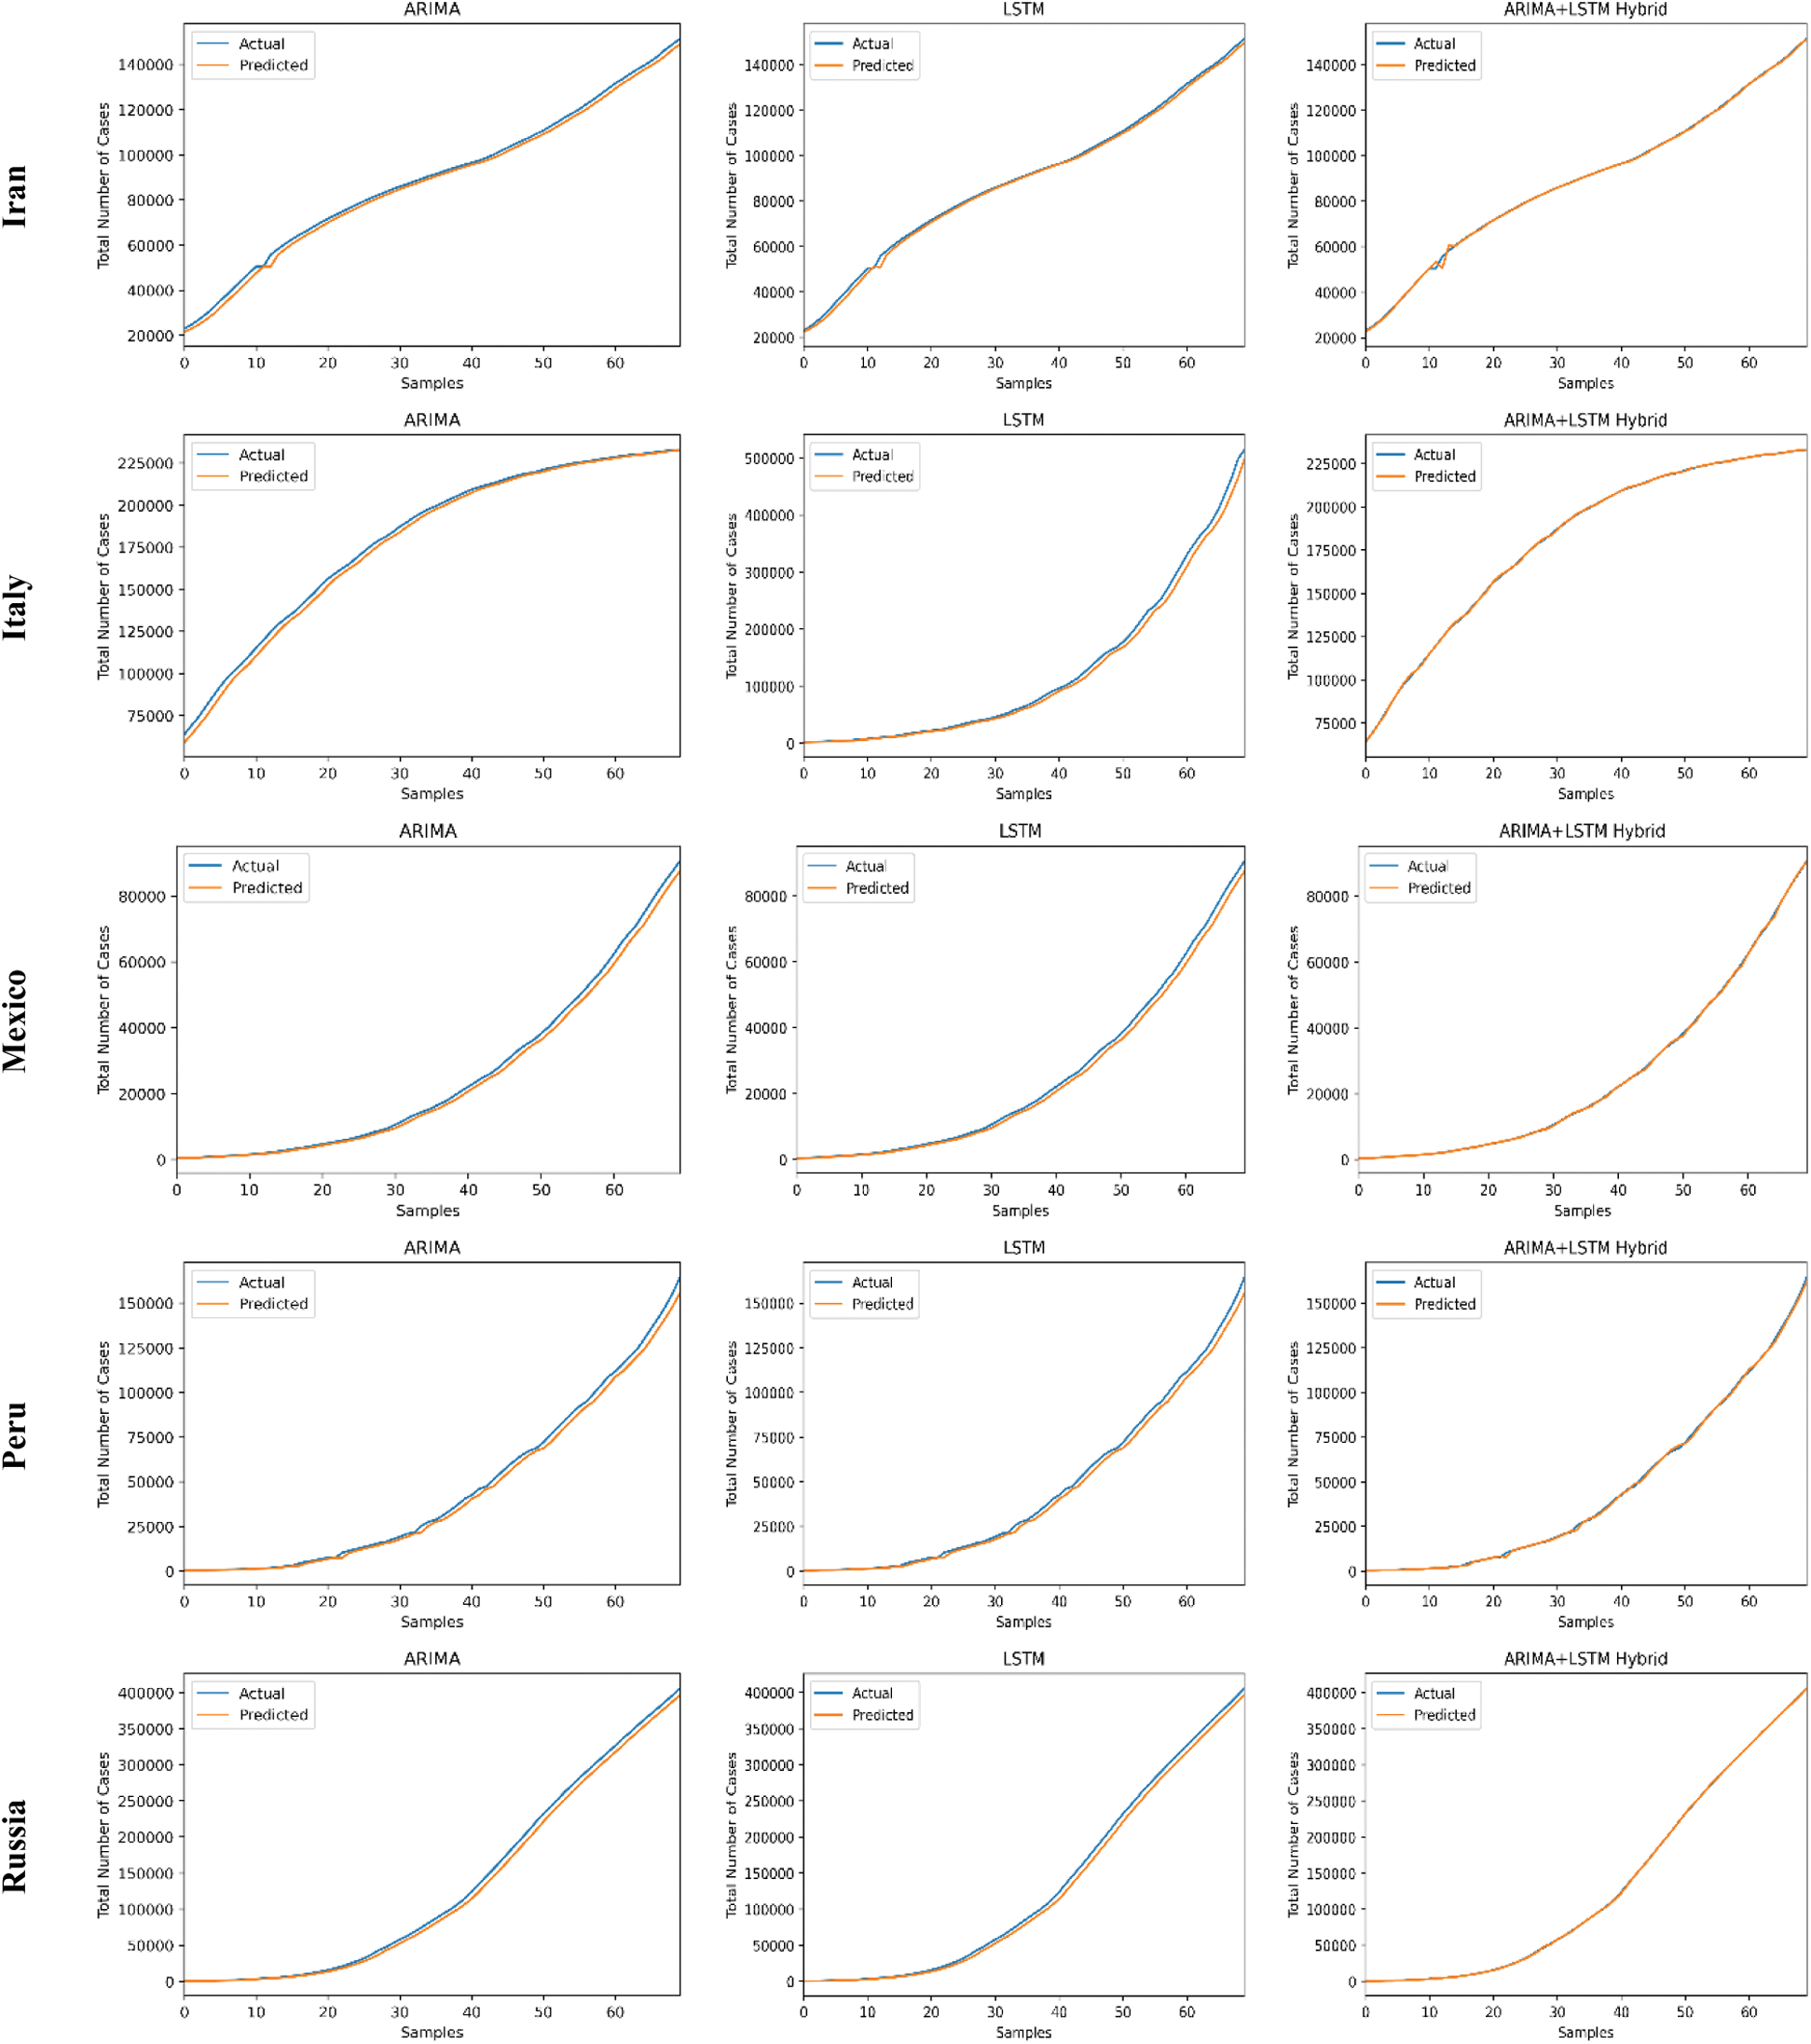
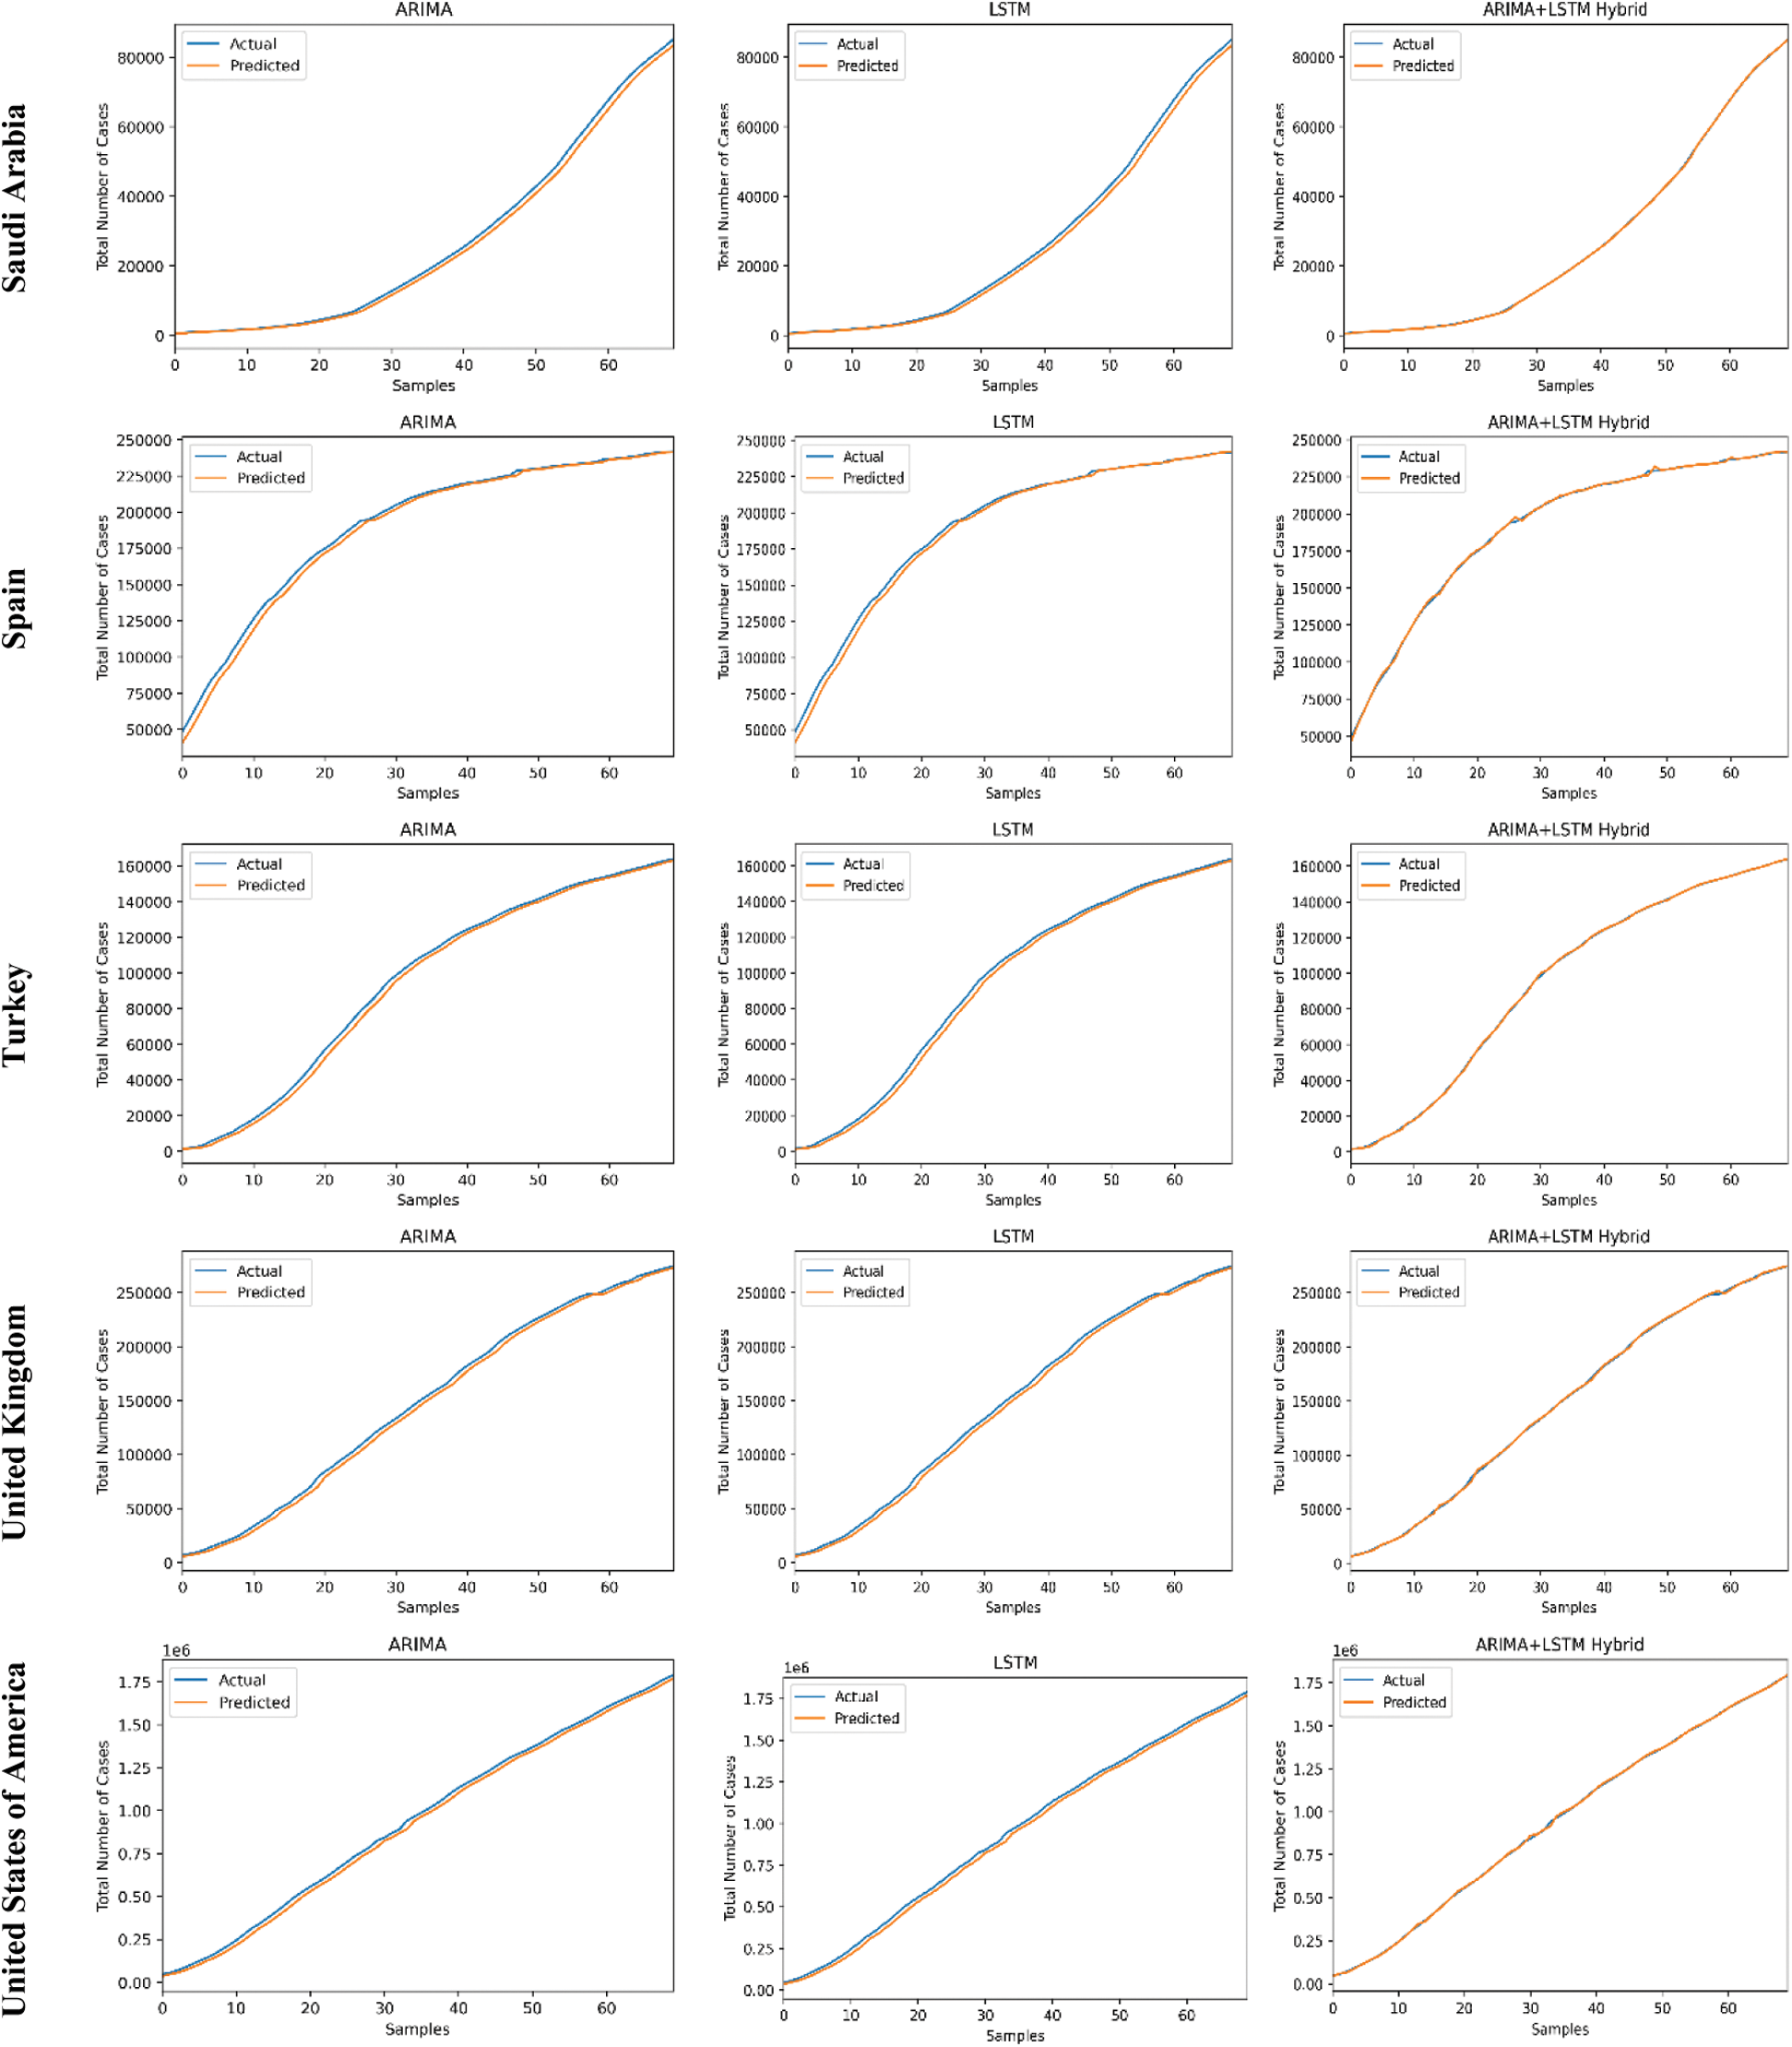
Figure 10: COVID-19 outbreak analysis using ARIMA, LSTM, and proposed ARIMA-LSTM based hybrid model
5.1 Current Status of Clinical Trials Worldwide
Concerning to the current situation, there is an urgent need for medical solutions to reduce or break the growth rate of COVID-19 cases and combat this pandemic situation. These therapeutic solutions might be in the form of an active drug or vaccine which can treat and cure infected patients, thereby saving their lives. In the presence of difficulties and chaos, various countries all over the world are undergoing a large number of clinical trials, in the form of vaccines or medications, to deal with this pandemic situate [40,41]. Among these clinical trials, most of them are in their initial stage, and only a few of them have reached their fourth or final stage.
In order to hunt for the medication of COVID-19, several ongoing tryouts have been conducted throughout the world. All possible solutions based on previously available medications for diseases, such as malaria and HIV, have been taken into consideration [42,43]. These medications are being applied to fight with the COVID-19. The responses to these medications are being recorded, which will further assist in developing the proper medicines for COVID-19. The drugs used in the COVID-19 clinical trials include Hydroxychloroquine, Azithromycin, Chloroquine, Lopinavir-ritonavir, Remdesivir, Favipiravir, Interferon, Ribavirin, and so on [44–47].
In the present study, clinical trials all over the world have been taken into consideration from the WHO’s International Clinical Trials Registry Platform (ICTRP) and clinicaltrials.gov database. A total of 2108 trials across the globe have been registered, between the time period of 30/01/2020 to 10/6/2020 [48]. The 74 countries are actively involved in conducting the clinical trials to figure out an effective and safe therapeutic solution for COVID-19. The country-wise clinical trials (total number of clinical trials <10) are enlisted in Fig. 11.
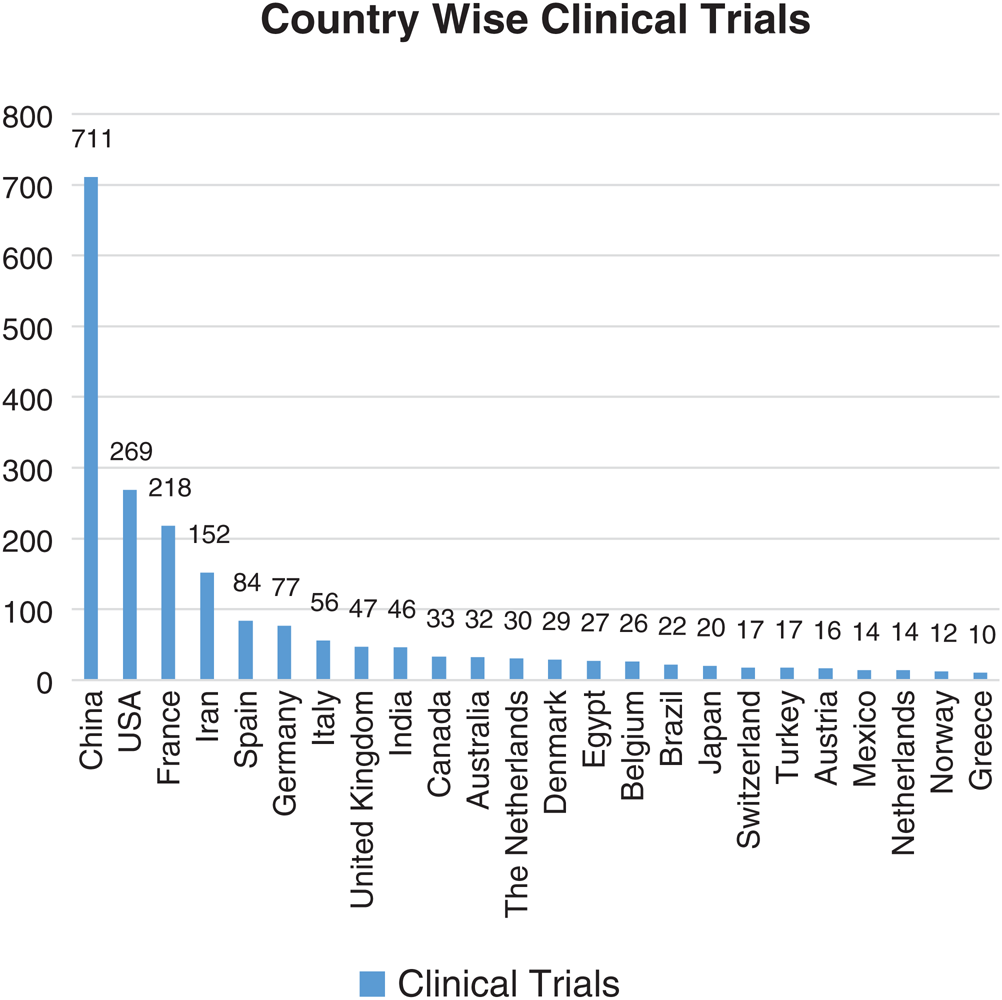
Figure 11: Country-wise number of clinical trials
Fig. 12 documents the collective number of clinical trials on the top ten drugs. The present study considered the data from 30/01/2020 to 10/6/2020, of the WHO’s International Clinical Trials Registry Platform (ICTRP) and clinicaltrials.gov database [48].
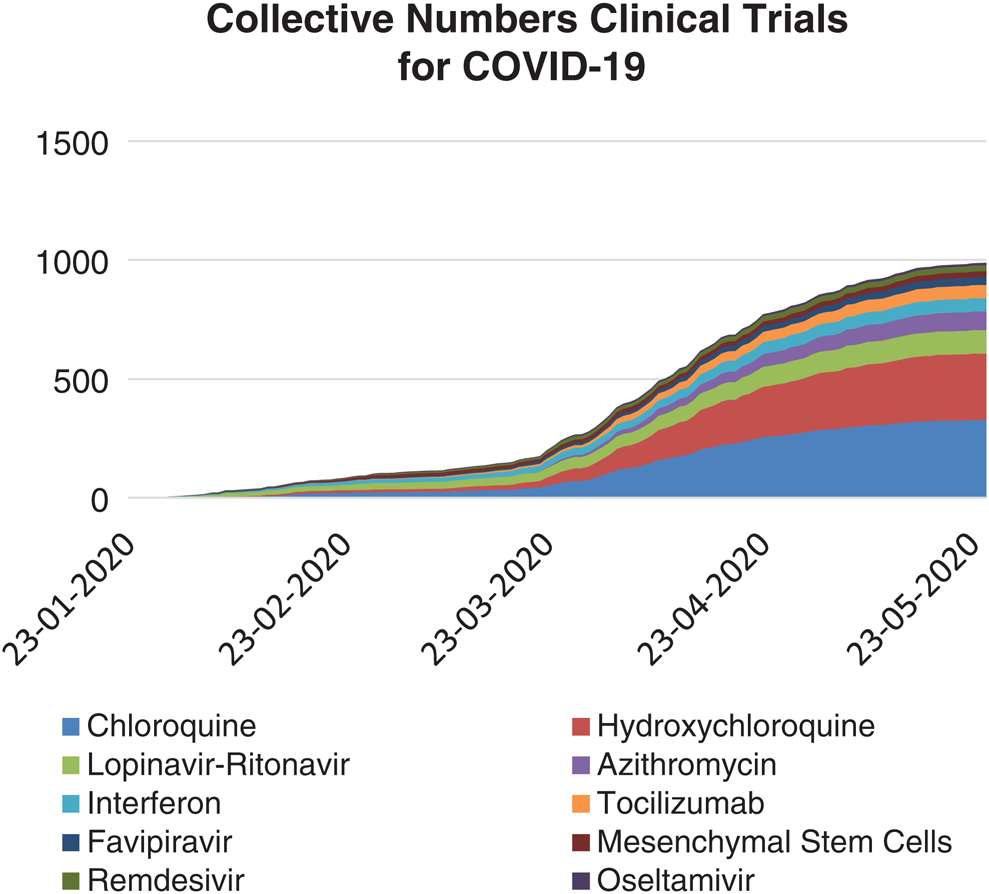
Figure 12: Collective number of clinical trials conducted on top 10 drugs, registered and taken under investigation for COVID-19 (from January 30 to June 10, 2020)
From the various pieces of literature and clinical databases, we found the top ten most frequently prescribed drugs in clinical investigations. The summation of clinical trials based on these drugs is 963, which is a vast number. Multiple combinations of these drugs are also being applied for the clinical trial process or the COVID-19 care process. Based on drugs used in the clinical trials, the top ten drugs have been selected and detailed in Fig. 13.
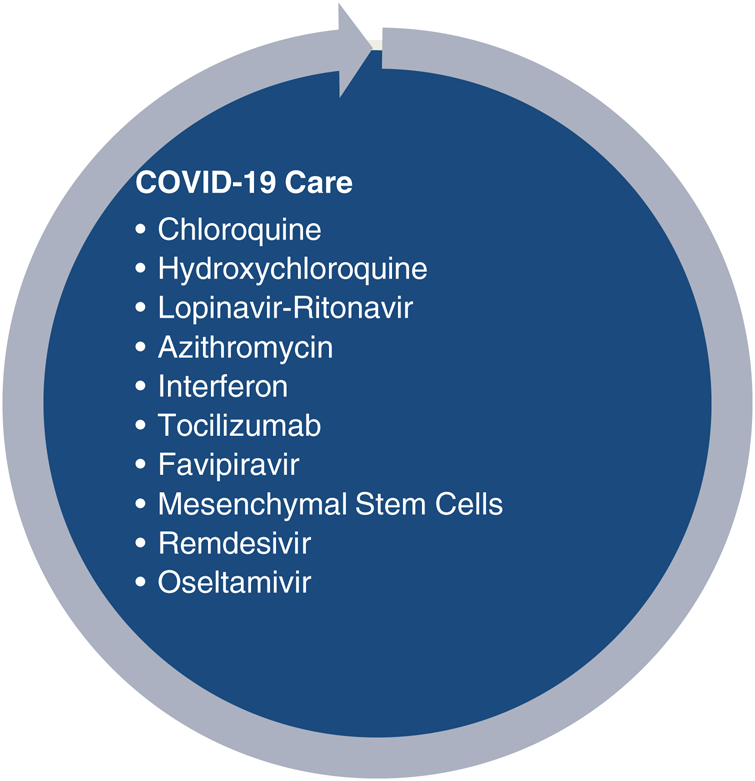
Figure 13: Top 10 drugs recommended for COVID-19 care
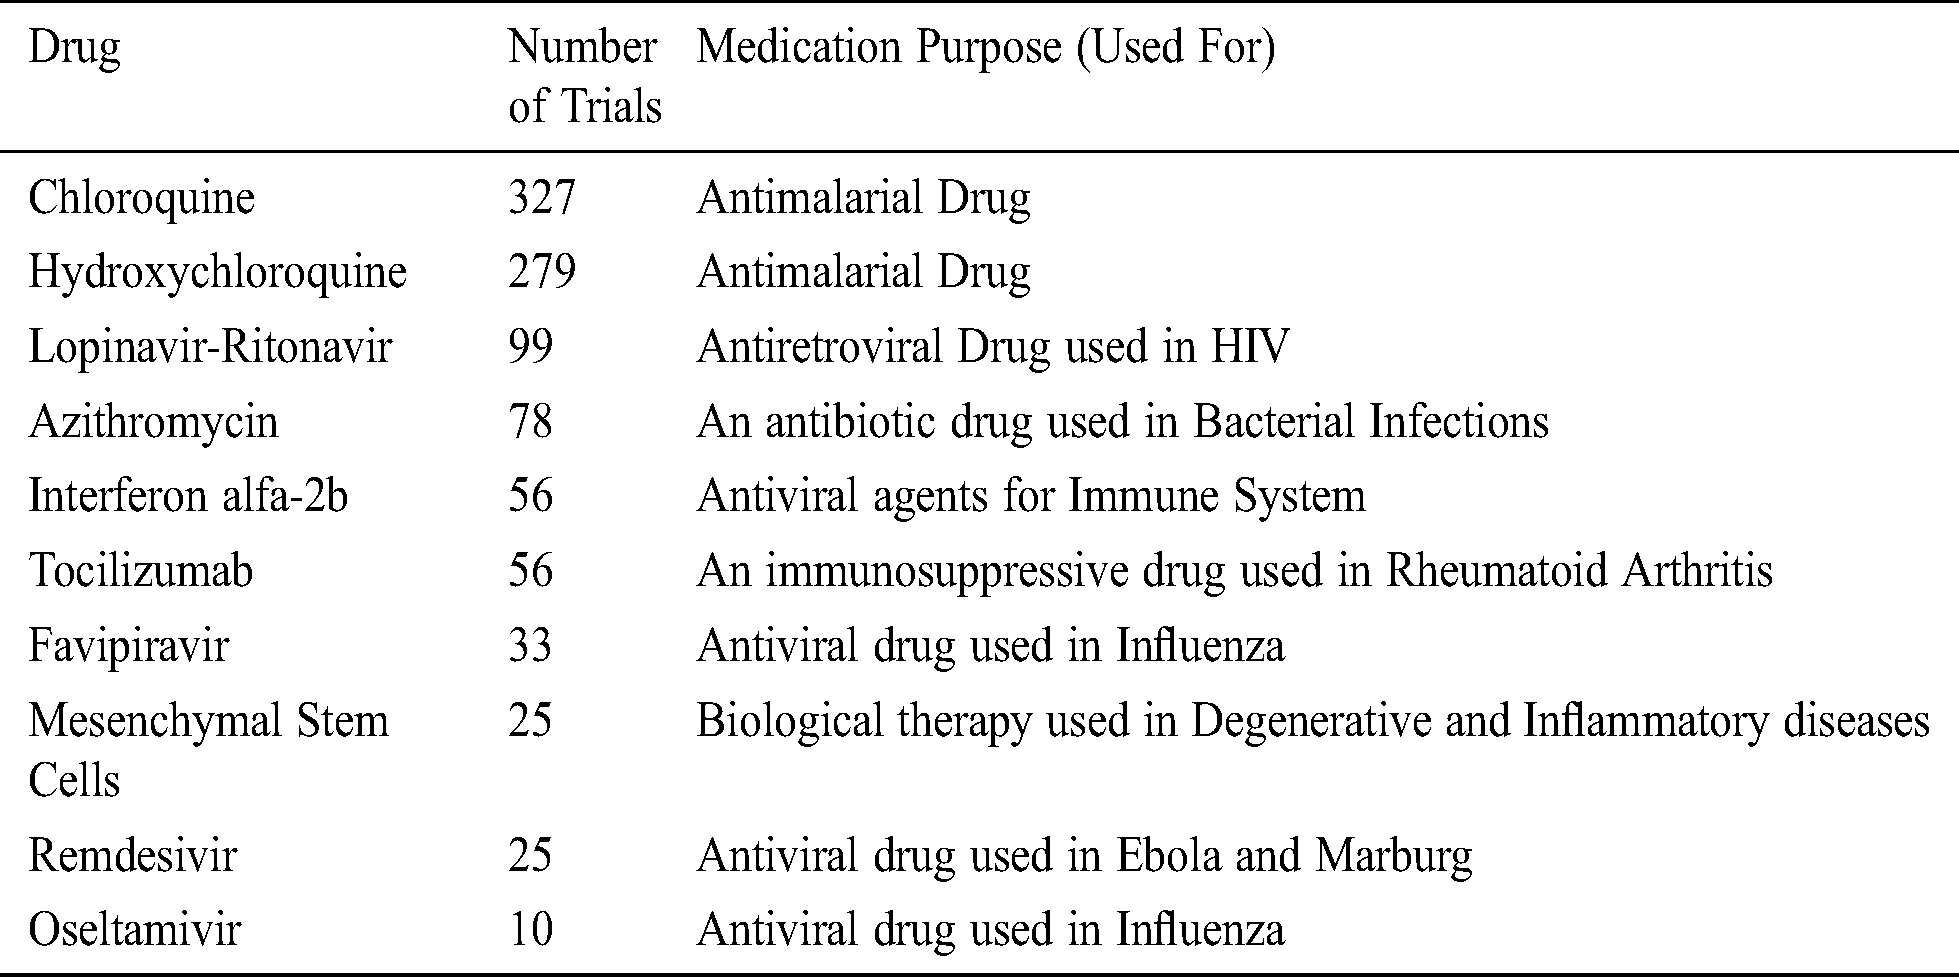
Tab. 2 enlists the top 10 drug-based ongoing and accomplished COVID-19 clinical trials across the globe (30/01/2020 to 10/6/2020) [42,43]. This table contains information relating to the drug name, the total number of clinical trials, and their medication purpose [44–47].
Table 2: Top ten drug-based COVID-19 clinical trials across the globe
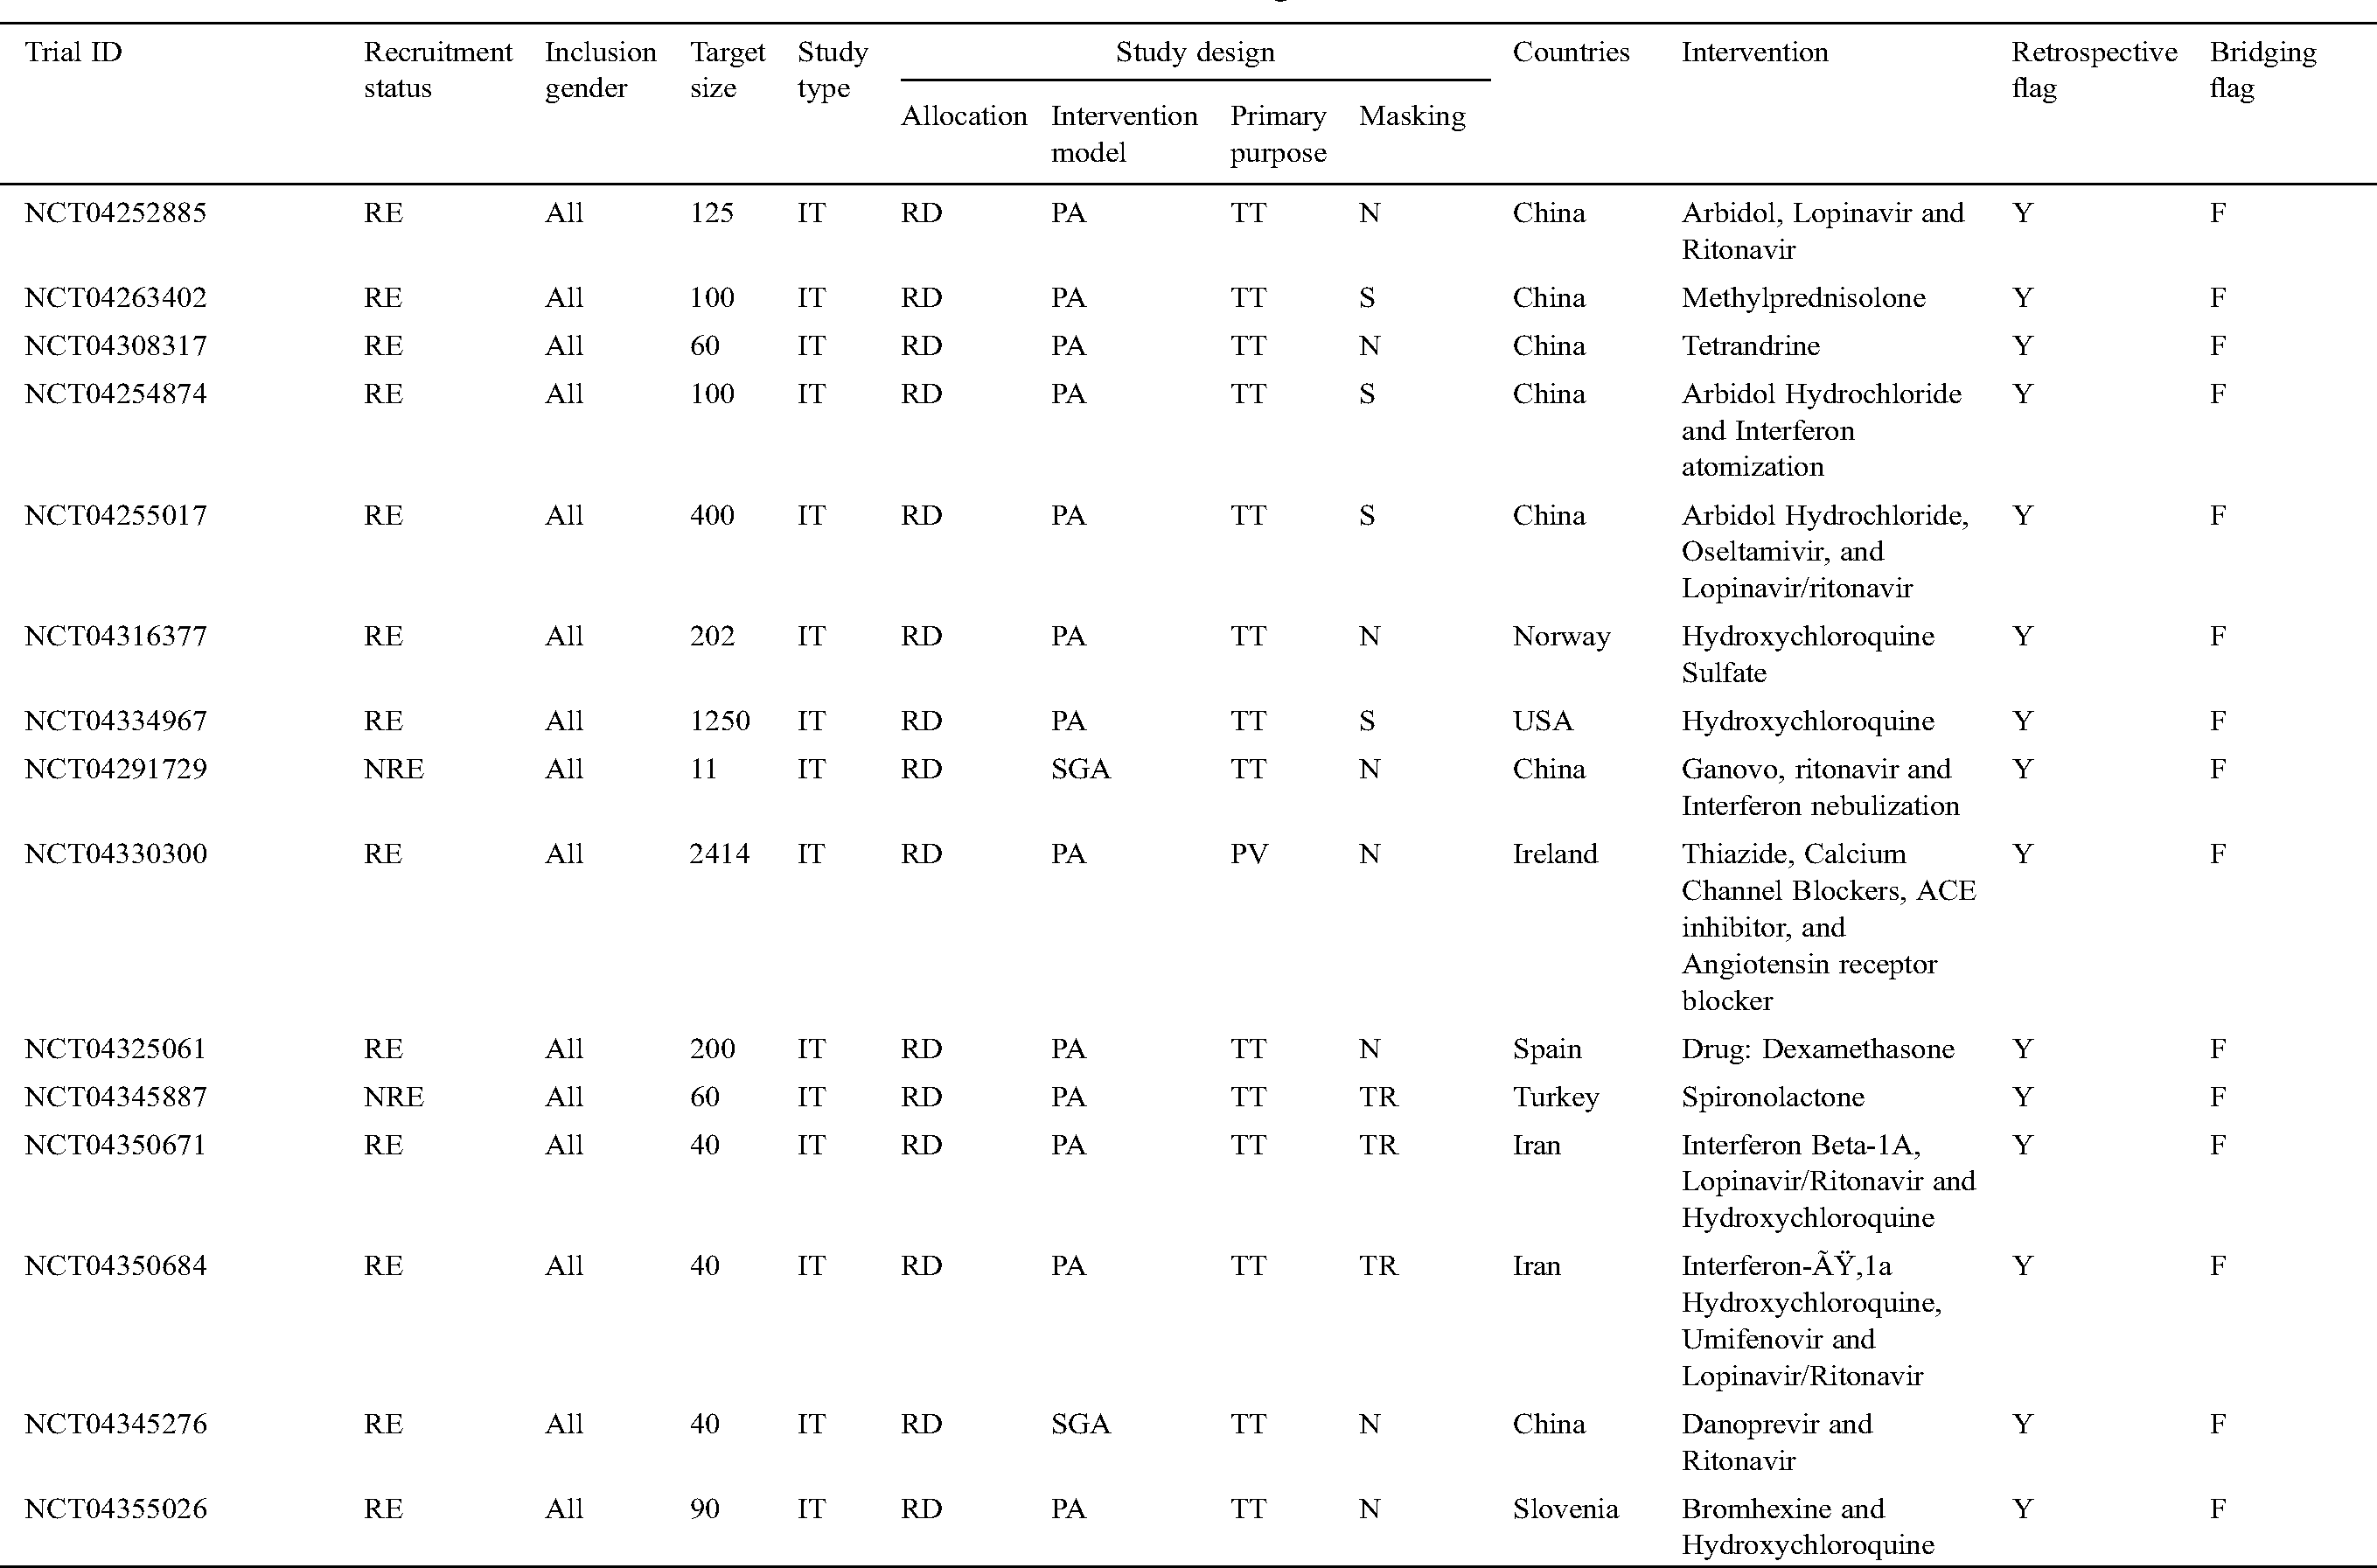
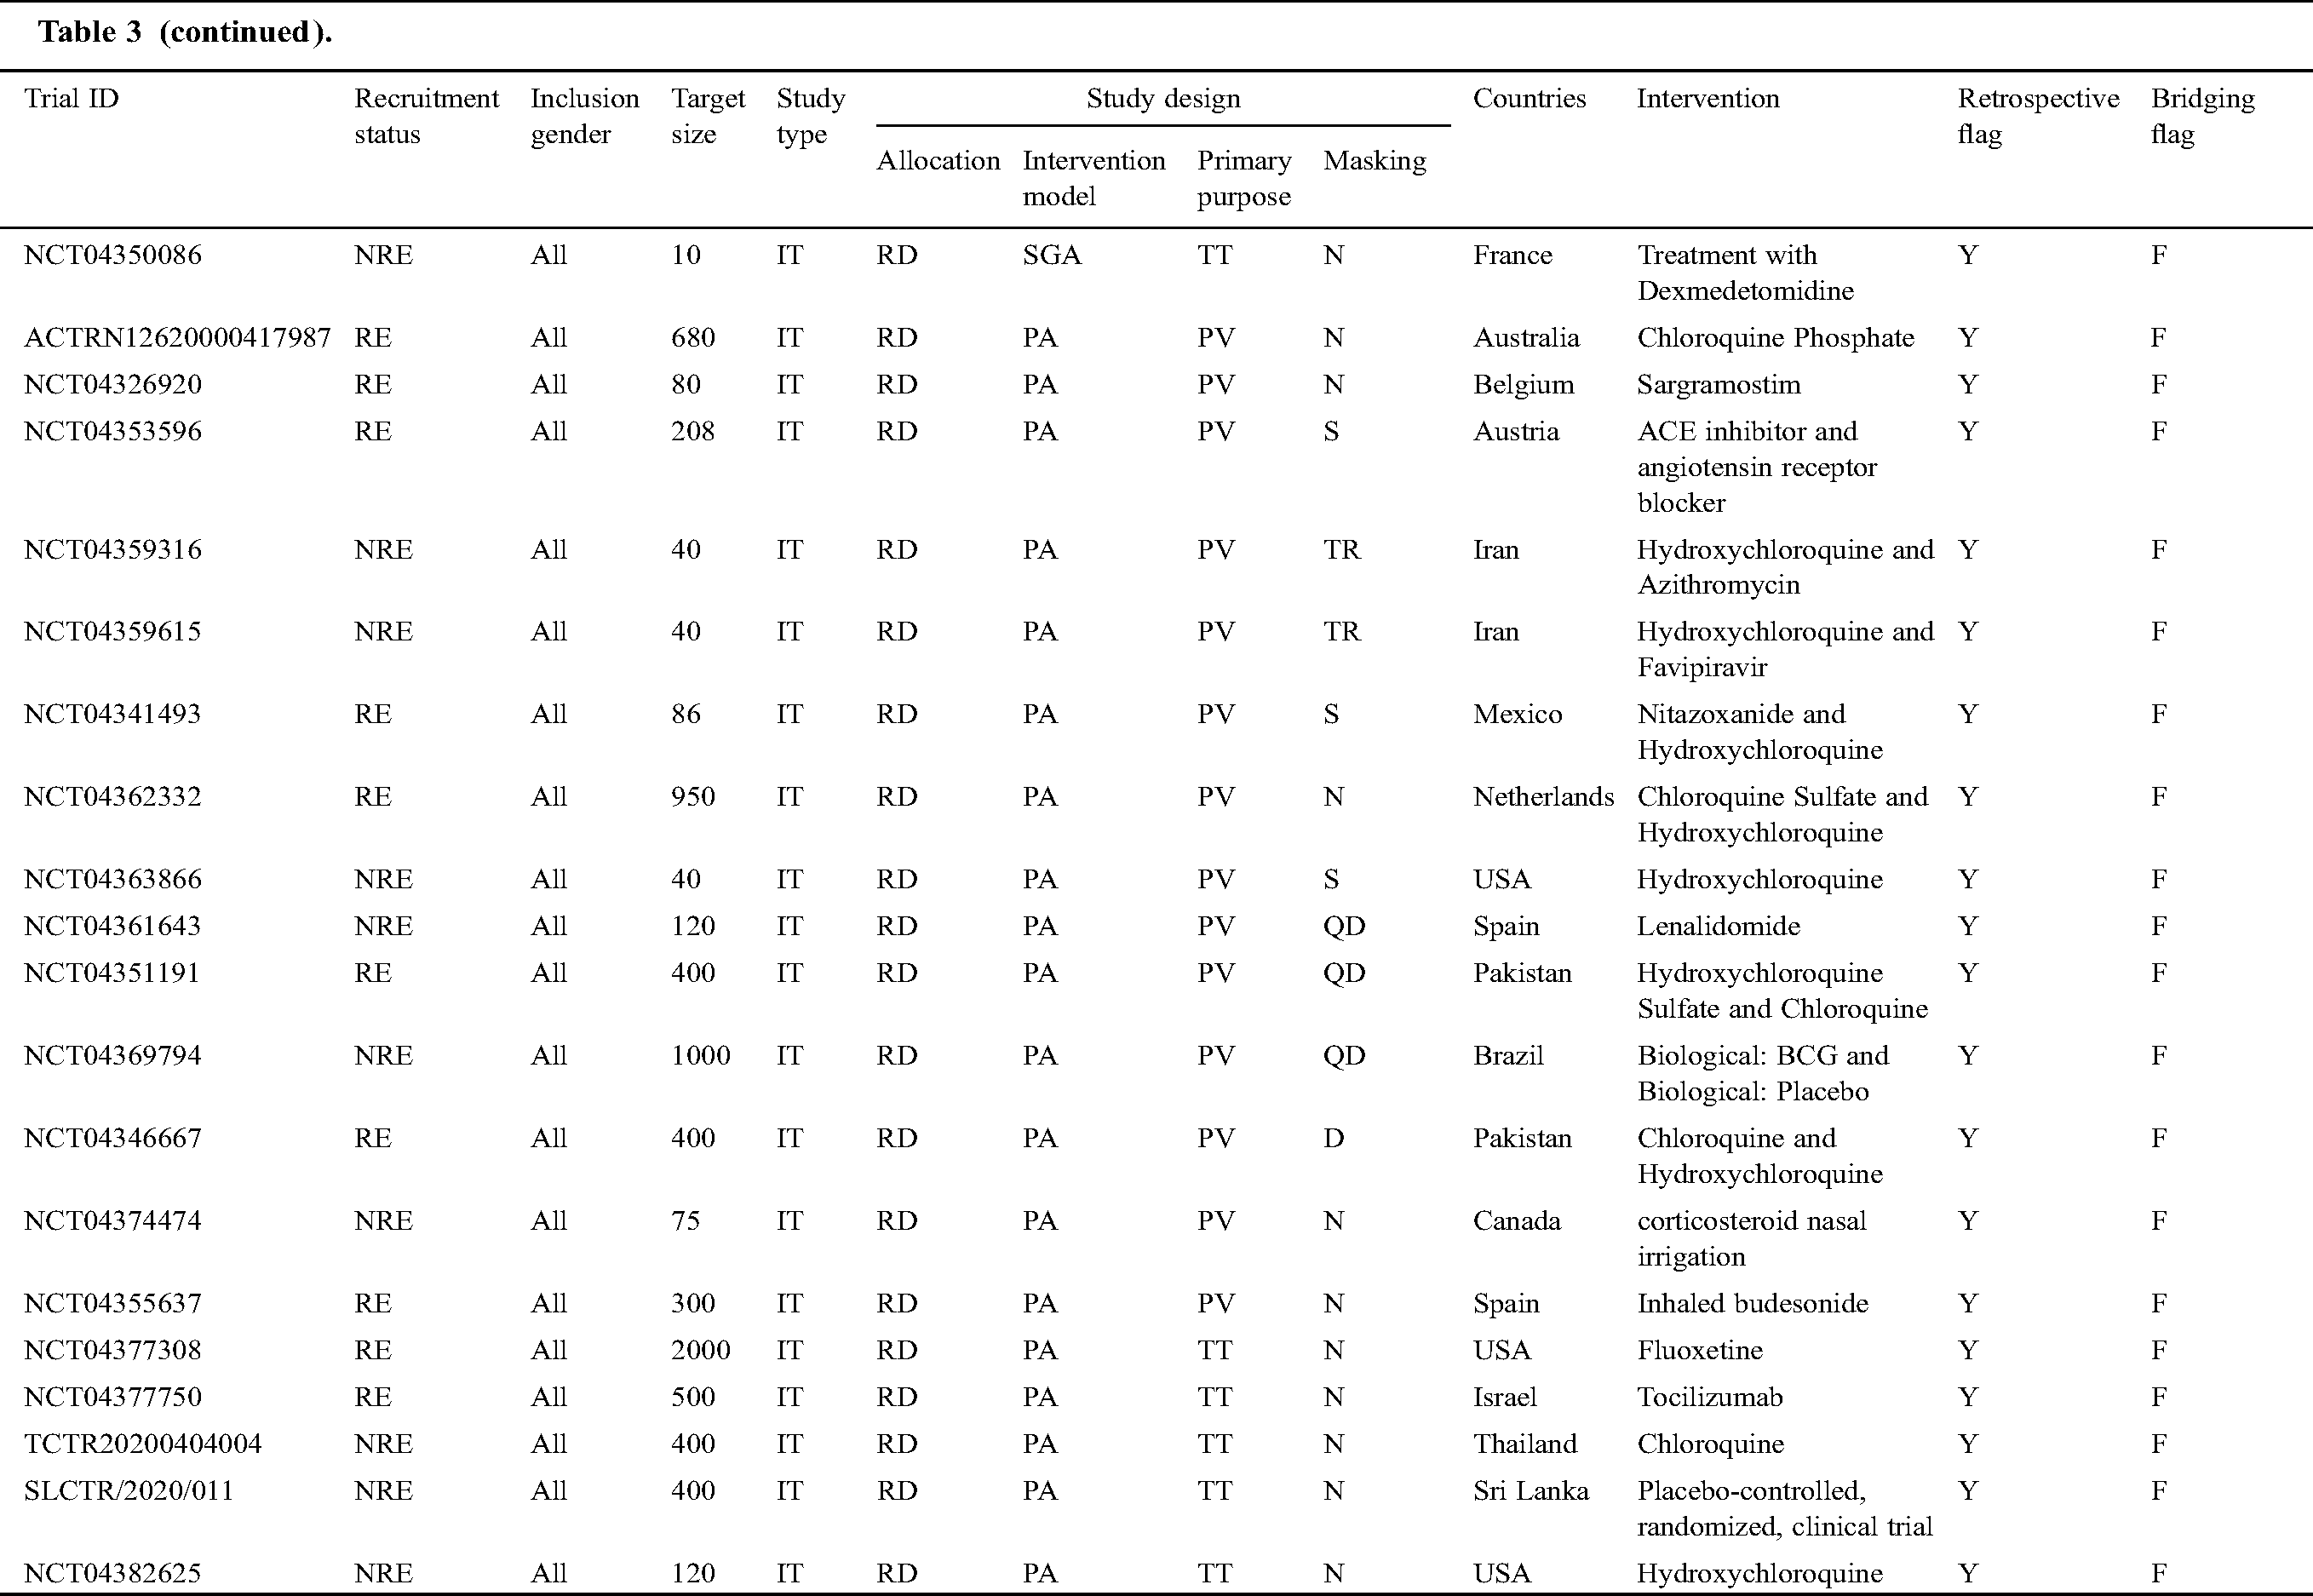
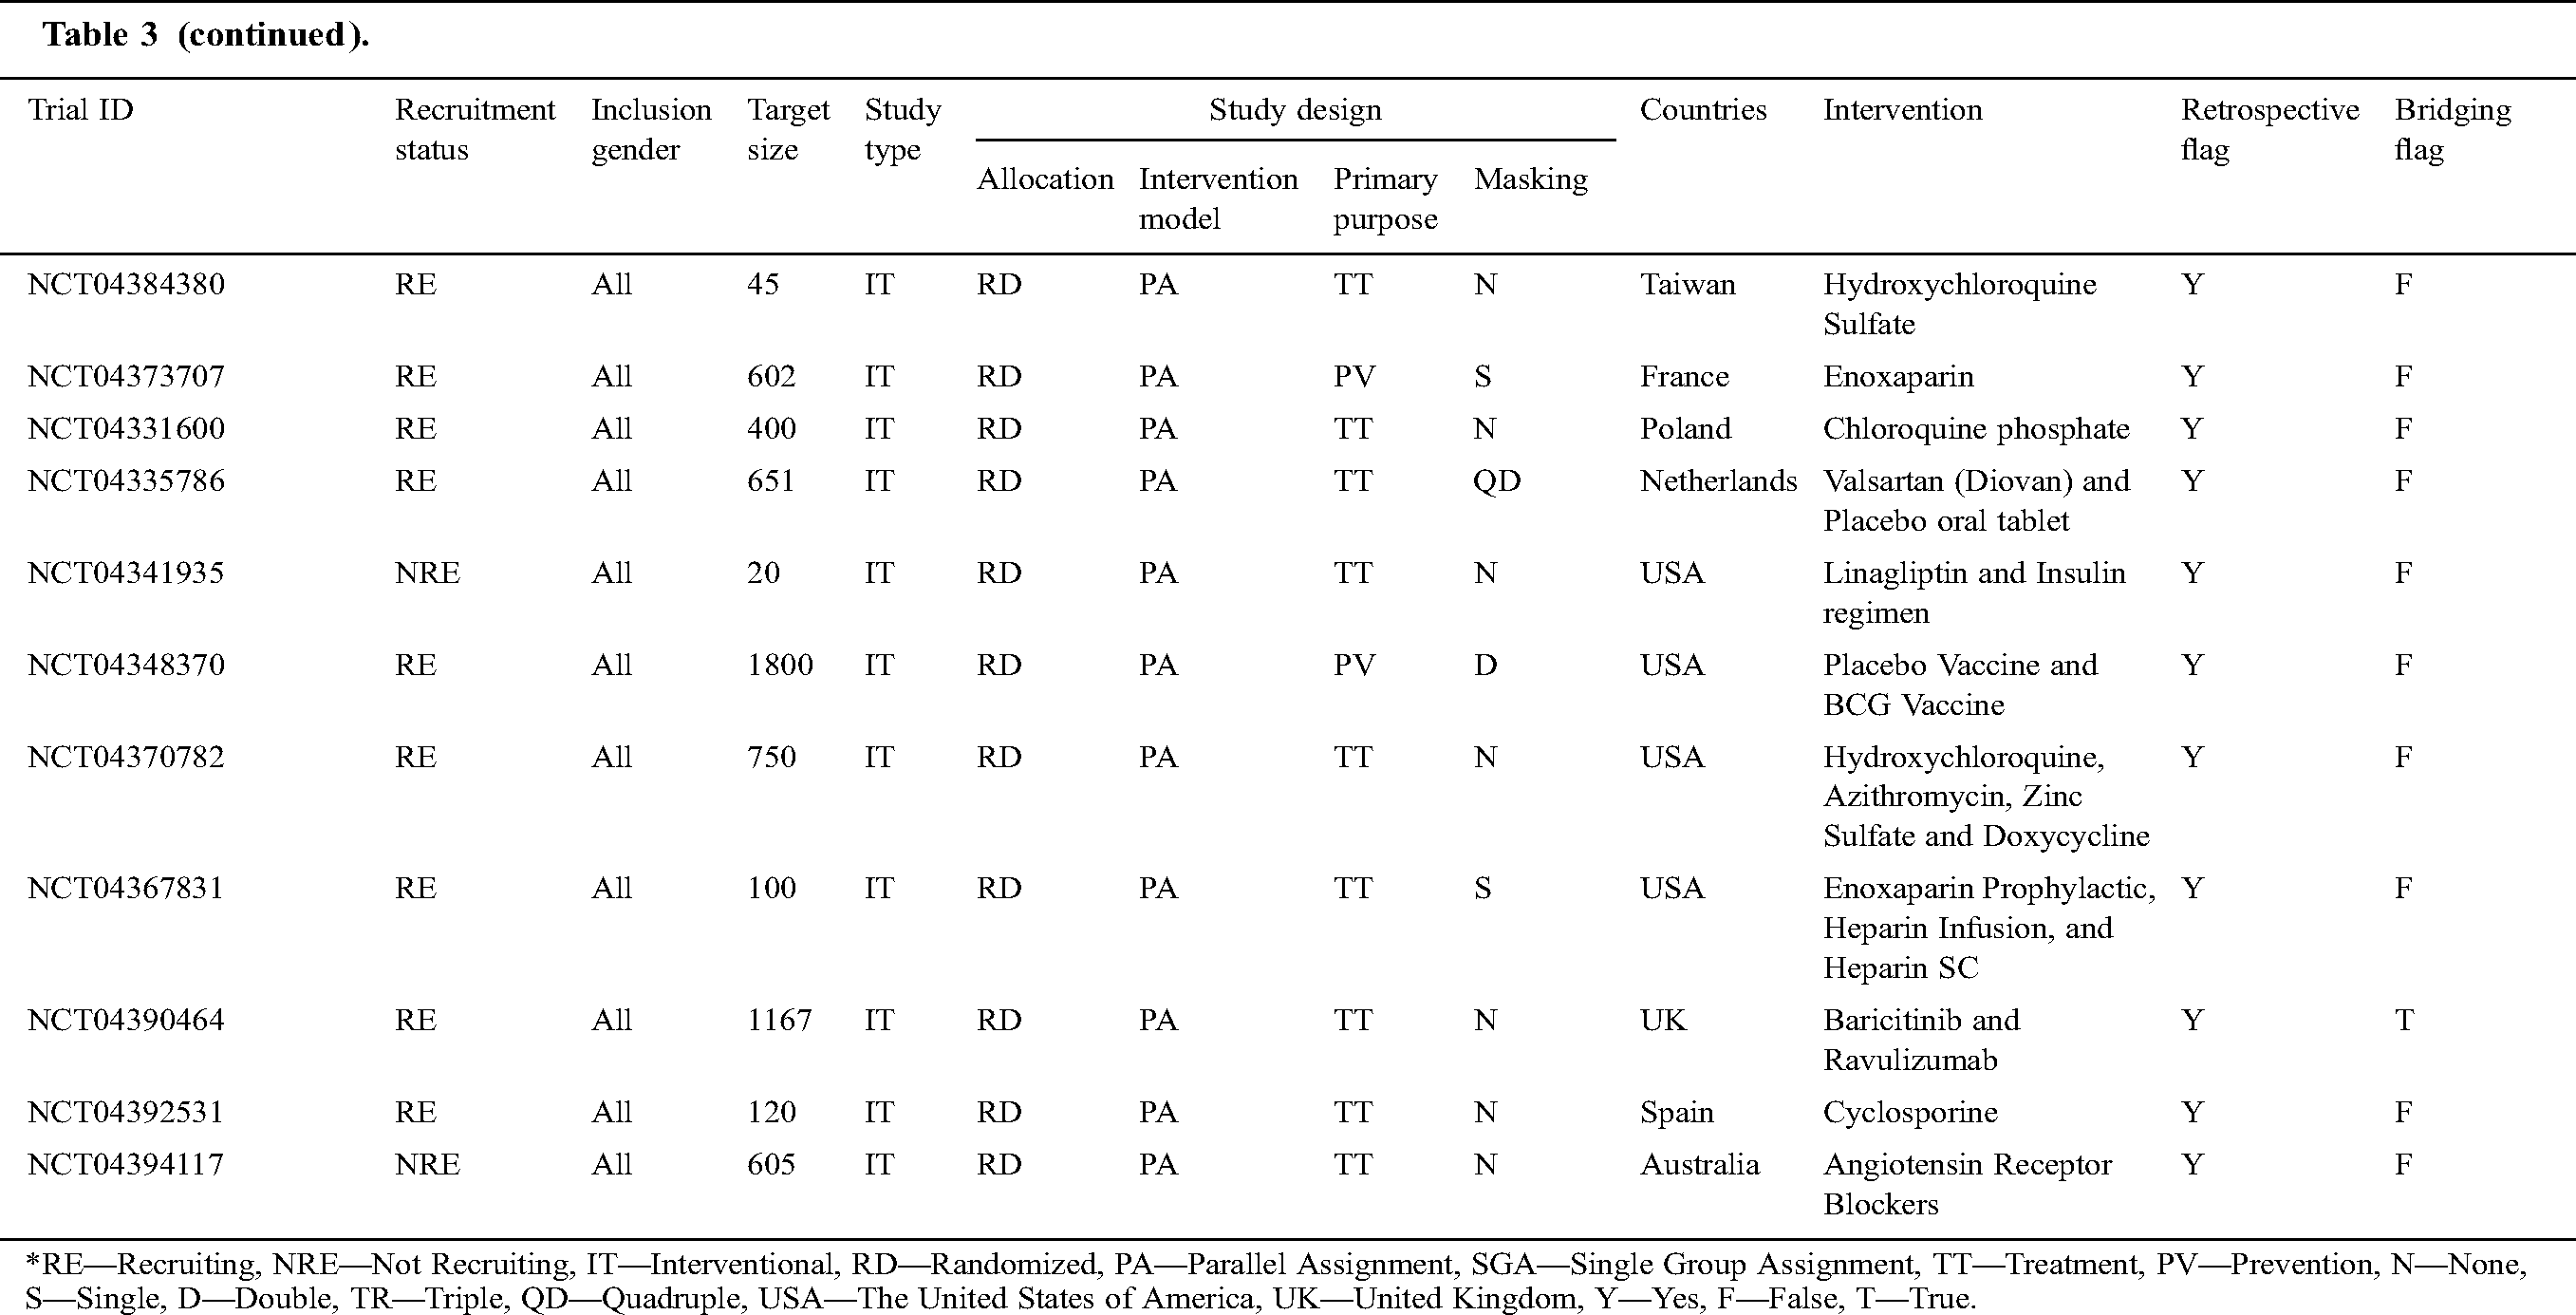
Tab. 3 narrates the current status of clinical trials in the fourth stage across the world during the time slot of 30/01/2020 to 10/06/2020. This table contains the information regarding the clinical trials such as Trial ID, Recruitment Status, Inclusion Gender, Target Size (number of persons on whom the clinical trials have been performed), Study Type, Study Design (Allocation, Intervention Model, Primary Purpose, and Masking), Countries, Intervention, Retrospective Flag, and Bridging Flag [48].
Table 3: Information of the COVID-19 clinical trials at stage four for the tenure of 30/01/2020 to 10/6/2020
The identification of accurate and efficient prediction models for forecasting the COVID-19 outbreak across the world is a complex yet novel task. All prevention policies depend on prediction results. This justifies the fact that accurate prediction is an essential requirement. With the help of an exact prediction model, we can diminish the overall impact caused by the COVID-19 outbreak. This article proposes a deep learning-based ARIMA-LSTM hybrid model that utilizes real-time information from the WHO’s daily bulletin report for the prediction of the COVID-19 outbreak. The primary objective of this experimental analysis is to elucidate the suitability and correctness of the proposed ARIMA-LSTM hybrid model. For this purpose, the two well-established time series prediction models, i.e., ARIMA and LSTM, have also been taken into account. From the prediction results of fifty countries, it is quite evident that the proposed ARIMA-LSTM hybrid model performs exceptionally well when compared with the other prediction models under various selection criteria (country-wise). The proposed model archives the lowest RMSE, lowest MAPE, and highest R2 Score throughout the testing. Apart from this, the present study also highlights the current status of clinical trials for COVID-19 across the globe.
In the future, this study will be further extended with the data and algorithmic perspective.
Funding Statement: The author(s) received no specific funding for this study.
Conflicts of Interest: The authors declare that they have no conflicts of interest to report regarding the present study.
1. D. S. Hui, Z. A. Memish and A. Zumla. (2014). “Severe acute respiratory syndrome vs. the middle east respiratory syndrome,” Current Opinion in Pulmonary Medicine, vol. 20, no. 3, pp. 233–241. [Google Scholar]
2. G. Wong, W. Liu, Y. G. Liu, B. Zhou, Y. Bi et al. (2015). , “MERS, SARS, and Ebola: The role of super-spreaders in infectious disease,” Cell Host & Microbe, vol. 18, no. 4, pp. 398–401.
3. S. Su, G. Wong, W. F. Shi, J. Liu, A. C. K. Lai et al. (2016). , “Epidemiology, genetic recombination, and pathogenesis of coronaviruses,” Trends in Microbiology, vol. 24, no. 6, pp. 490–502.
4. S. Hilton and K. Hunt. (2011). “UK newspapers’ representations of the 2009-10 outbreak of swine flu: One health scare not over-hyped by the media?,” Journal of Epidemiology & Community Health, vol. 65, no. 10, pp. 941–946.
5. Y. R. Guo, Q. D. Cao, Z. S. Hong, Y. Y. Tan, S. D. Chen et al. (2020). , “The origin, transmission and clinical therapies on coronavirus disease 2019 (COVID-19) outbreak-an update on the status,” Military Medical Research, vol. 7, no. 1, pp. 1–10. [Google Scholar]
6. C. Sohrabi, Z. Alsafi, N. O’Neill, M. Khan, A. Kerwan et al. (2020). , “World health organization declares global emergency: A review of the 2019 novel coronavirus (COVID-19),” International Journal of Surgery, vol. 76, pp. 71–76. [Google Scholar]
7. V. J. Munster, M. Koopmans, N. V. Doremalen, D. V. Riel and E. D. Wit. (2020). “A novel coronavirus emerging in China—Key questions for impact assessment,” New England Journal of Medicine, vol. 382, no. 8, pp. 692–694. [Google Scholar]
8. Y. H. Jin, L. Cai, Z. S. Cheng, H. Cheng, T. Deng et al. (2020). , “A rapid advice guideline for the diagnosis and treatment of 2019 novel coronavirus (2019-nCoV) infected pneumonia (standard version),” Military Medical Research, vol. 7, no. 1, pp. l4606. [Google Scholar]
9. D. A. Schwartz and A. L. Graham. (2020). “Potential maternal and infant outcomes from (Wuhan) coronavirus 2019-nCoV infecting pregnant women: Lessons from SARS, MERS, and other human coronavirus infections,” Viruses, vol. 12, no. 2, pp. 194.
10. S. Jiang, L. Du and Z. Shi. (2020). “An emerging coronavirus causing pneumonia outbreak in Wuhan, China: Calling for developing therapeutic and prophylactic strategies,” Emerging Microbes & Infections, vol. 9, no. 1, pp. 275–277. [Google Scholar]
11. Coronavirus (COVID-19). (2020). “Coronavirus.” . [Online]. Available: https://www.who.int/health-topics/coronavirus#tab=tab_1. [Google Scholar]
12. Y. P. Bao, Y. Sun, S. Meng, J. Shi and L. Lu, “epidemic: Address mental health care to empower society,” The Lancet, vol. 395, no. 10224, pp. e37–e38, 2020. [Google Scholar]
13. Coronavirus Disease (COVID-2019) Situation Reports. (2020). “Coronavirus disease (COVID-2019) situation reports,” . [Online]. Available: https://www.who.int/emergencies/diseases/novel-coronavirus-2019/situation-reports/. [Google Scholar]
14. W. J. Li, Y. X. Cao, J. Chen and J. X. Wang. (2017). “Deeper local search for parameterized and approximation algorithms for maximum internal spanning tree,” Information and Computation, vol. 252, pp. 187–200. [Google Scholar]
15. C. Y. Yin, H. Y. Wang, X. Yin, R. X. Sun and J. Wang. (2019). “Improved deep packet inspection in data stream detection,” The Journal of Supercomputing, vol. 75, no. 8, pp. 4295–4308. [Google Scholar]
16. J. Chen, G. Q. Zeng, W. N. Zhou, W. Du and K. D. Lu. (2018). “Wind speed forecasting using nonlinear-learning ensemble of deep learning time series prediction and extremal optimization,” Energy Conversion and Management, vol. 165, pp. 681–695. [Google Scholar]
17. R. Fu, Z. Zhang and L. Li. (2016). “Using LSTM and GRU neural network methods for traffic flow prediction,” in 2016 31st Youth Academic Annual Conf. of Chinese Association of Automation, China, IEEE, pp. 324–328. [Google Scholar]
18. W. Long, Z. C. Lu and L. X. Cui. (2019). “Deep learning-based feature engineering for stock price movement prediction,” Knowledge-Based Systems, vol. 164, pp. 163–173. [Google Scholar]
19. H. Liu, X. W. Mi and Y. F. Li. (2018). “Smart deep learning based wind speed prediction model using wavelet packet decomposition, convolutional neural network and convolutional long short term memory network,” Energy Conversion and Management, vol. 166, pp. 120–131. [Google Scholar]
20. X. F. Chen, C. M. Wu, T. Chen, H. G. Zhang, Z. Liu et al. (2018). , “Age of information aware radio resource management in vehicular networks: A proactive deep reinforcement learning perspective,” IEEE Transactions on Wireless Communications, vol. 19, no. 4, pp. 2268–2281.
21. S. R. Zhou and B. Tan. (2020). “Electrocardiogram soft computing using hybrid deep learning CNN-ELM,” Applied Soft Computing, vol. 86, pp. 105778. [Google Scholar]
22. X. G. Jiang, M. Coffee, A. Bari, J. H. Wang, X. Y. Jiang et al. (2020). , “Toward an artificial intelligence framework for data-driven prediction of coronavirus clinical severity,” Computers, Materials & Continua, vol. 63, no. 3, pp. 537–551. [Google Scholar]
23. D. S. W. Ting, L. Carin, V. Dzau and T. Y. Wong. (2020). “Digital technology and COVID-19,” Nature Medicine, vol. 26, no. 4, pp. 459–461. [Google Scholar]
24. D. Benvenuto, M. Giovanetti, L. Vassallo, S. Angeletti and M. Ciccozzi. (2020). “Application of the ARIMA model on the COVID-2019 epidemic dataset,” Data in Brief, vol. 29, pp. 105340. [Google Scholar]
25. S. Deb and M. Majumdar. (2020). “A time series method to analyze incidence pattern and estimate reproduction number of COVID-19. arXiv preprint arXiv:2003.10655. [Google Scholar]
26. A. J. Kucharski, T. W. Russell, C. Diamond, Y. Liu, J. Edmunds et al. (2020). , “Early dynamics of transmission and control of COVID-19: A mathematical modelling study,” The Lancet Infectious Diseases, vol. 20, no. 5, pp. 553–558. [Google Scholar]
27. S. K. Dey, M. M. Rahman, U. R. Siddiqi and A. Howlader. (2020). “Analyzing the epidemiological outbreak of COVID-19: A visual exploratory data analysis approach,” Journal of Medical Virology, vol. 92, no. 6, pp. 632–638. [Google Scholar]
28. S. A. Lauer, K. H. Grantz, Q. F. Bi, F. K. Jones, Q. Zheng et al. (2020). , “The incubation period of coronavirus disease 2019 (COVID-19) from publicly reported confirmed cases: Estimation and application,” Annals of Internal Medicine, vol. 172, no. 9, pp. 577–582. [Google Scholar]
29. H. M. Singer. (2020). “Short-term predictions of country-specific COVID-19 infection rates based on power law scaling exponents. arXiv preprint arXiv:2003.11997. [Google Scholar]
30. S. V. Kumar and L. Vanajakshi. (2015). “Short-term traffic flow prediction using seasonal ARIMA model with limited input data,” European Transport Research Review, vol. 7, no. 3, pp. 32. [Google Scholar]
31. O. Yildirim. (2018). “A novel wavelet sequence based on deep bidirectional LSTM network model for ECG signal classification,” Computers in Biology and Medicine, vol. 96, pp. 189–202. [Google Scholar]
32. R. Atienza. (2018). Advanced deep learning with Keras: Apply deep learning techniques, autoencoders, GANs, variational autoencoders, deep reinforcement learning, policy gradients, and more. Birmingham, UK, Packt Publishing Ltd. [Google Scholar]
33. Z. Zhao, W. Chen, X. M. Wu, P. C. Y. Chen and J. M. Liu. (2017). “LSTM network: A deep learning approach for short-term traffic forecast,” IET Intelligent Transport Systems, vol. 11, no. 2, pp. 68–75. [Google Scholar]
34. G. H. Liang, X. Q. Zhu and C. Zhang. (2011). “An empirical study of bagging predictors for different learning algorithms,” in Twenty-Fifth AAAI Conf. on Artificial Intelligence, San Francisco, California USA, ACM. [Google Scholar]
35. M. O. Elish, H. Aljamaan and I. Ahmad. (2015). “Three empirical studies on predicting software maintainability using ensemble methods,” Soft Computing, vol. 19, no. 9, pp. 2511–2524. [Google Scholar]
36. M. Oliveira and L. Torgo. (2015). “Ensembles for time series forecasting,” in Asian Conf. on Machine Learning, Nha Trang City, Vietnam, PMLR, pp. 360–370. [Google Scholar]
37. M. Khashei and M. Bijari. (2011). “A novel hybridization of artificial neural networks and ARIMA models for time series forecasting,” Applied Soft Computing, vol. 11, no. 2, pp. 2664–2675. [Google Scholar]
38. I. Khandelwal, R. Adhikari and G. Verma. (2015). “Time series forecasting using hybrid ARIMA and ANN models based on DWT decomposition,” Procedia Computer Science, vol. 48, no. 1, pp. 173–179. [Google Scholar]
39. C. L. Cheng and G. Garg. (2014). “Coefficient of determination for multiple measurement error models,” Journal of Multivariate Analysis, vol. 126, pp. 137–152. [Google Scholar]
40. N. E. Dean, P. S. Gsell, R. Brookmeyer, V. D. Gruttola, C. A. Donnelly et al. (2019). , “Design of vaccine efficacy trials during public health emergencies,” Science Translational Medicine, vol. 11, no. 499, pp. eaat0360. [Google Scholar]
41. G. S. Yin. (2012). Clinical Trial Design: Bayesian and Frequentist Adaptive Methods, Hoboken, New Jersey, John Wiley & Sons, vol. 876. [Google Scholar]
42. Y. Bai, L. S. Yao, T. Wei, F. Tian, D. Y. Jin et al. (2020). , “Presumed asymptomatic carrier transmission of COVID-19,” Jama, vol. 323, no. 14, pp. 1406–1407. [Google Scholar]
43. W. J. Guan, Z. V. Ni, Y. Hu, W. H. Liang, C. Q. Ou et al. (2020). , “Clinical characteristics of coronavirus disease 2019 in China,” New England Journal of Medicine, vol. 382, no. 18, pp. 1708–1720. [Google Scholar]
44. J. Grein, N. Ohmagari, D. Shin, G. Diaz, E. Asperges et al. (2020). , “Compassionate use of remdesivir for patients with severe Covid-19,” New England Journal of Medicine, vol. 382, no. 24, pp. 2327–2336. [Google Scholar]
45. L. Zou, L. Dai, X. Zhang, Z. Zhang and Z. Zhang. (2020). “Hydroxychloroquine and chloroquine: A potential and controversial treatment for COVID-19,” Archives of Pharmacal Research, vol. 43, pp. 765–772.
46. P. Gautret, J. C. Lagier, P. Parola, L. Meddeb, M. Mailhe et al. (2020). , “Hydroxychloroquine and azithromycin as a treatment of COVID-19: Results of an open-label non-randomized clinical trial,” International Journal of Antimicrobial Agents, vol. 56, no. 1, pp. 105949.
47. Q. X. Cai, M. H. Yang, D. J. Liu, J. Chen, D. Shu et al. (2020). , “Experimental treatment with favipiravir for COVID-19: an open-label control study,” Engineering. [Google Scholar]
48. International Clinical Trials Registry Platform (ICTRP). (2020). “International Clinical Trials Registry Platform (ICTRP). ” . [Online]. Available: https://www.who.int/ictrp/en. [Google Scholar]
 | This work is licensed under a Creative Commons Attribution 4.0 International License, which permits unrestricted use, distribution, and reproduction in any medium, provided the original work is properly cited. |