DOI:10.32604/cmc.2020.012707
| Computers, Materials & Continua DOI:10.32604/cmc.2020.012707 | |
| Article |
Smart CardioWatch System for Patients with Cardiovascular Diseases Who Live Alone
1College of Applied Medical Science, Prince Sattam Bin Abdulaziz University, Wadi Ad Dawaser, 11990, Saudi Arabia
2Department Computer Science, Prince Sattam Bin Abdulaziz University, Wadi Ad Dawaser, 11990, Saudi Arabia
*Corresponding Author: Raisa Nazir Ahmed Kazi. Email: raisakolhar@gmail.com
Received: 10 July 2020; Accepted: 24 July 2020
Abstract: The widespread use of smartwatches has increased their specific and complementary activities in the health sector for patient’s prognosis. In this study, we propose a framework referred to as smart forecasting CardioWatch (SCW) to measure the heart-rate variation (HRV) for patients with myocardial infarction (MI) who live alone or are outside their homes. In this study, HRV is used as a vital alarming sign for patients with MI. The performance of the proposed framework is measured using machine learning and deep learning techniques, namely, support vector machine, logistic regression, and decision-tree classification techniques. The results indicated that the analysis of heart rate can help health services that are located remotely from the patient to render timely emergency health care. Further, taking more cardiac parameters into account can lead to more accurate results. On the basis of our findings, we recommend the development of health-related software to aid researchers to develop frameworks, such as SCW, for effective provision of emergency health.
Keywords: Forecasting system; machine learning algorithms; medical forecasting systems; medical control systems; supervised learning
Health care providers very often would like to use innovative tools to forecast individual patient’s prognosis. Such settings will definitely accelerate as health care system enters the digital age. Most likely application of forecasting consists of better targeting of disease management as well as smart technology based patient care system such as myocardial infarction (MI) disease must be continuously monitored for identifying the vital signs before MI occurrence. The early identification of symptoms can help take preventive measures, which substantially improve the survival prospects of the patients. However, limited access to basic health-care facilities increases the mortality rate associated with MI. Heart-rate variability (HRV), when observed before MI, is a crucial forecasting sign of cardiac arrest and death [1]. It is a useful predictor for patients with low and immediate risks of cardiac arrest. It indicates an increase or decrease in the time between two successive heartbeats, or it may indicate a skipped beat. However, compared with a high heart rate, a low heart rate is more common before MI. Reportedly, patients with an HRV of <50 ms have a 5.3-times higher relative risk of mortality than those with an HRV of >100 ms [1–6].
Although smartwatches are not new, they are receiving considerable attention [7–10] because of the development of Android Wear and Apple watch. In addition, the deficit of research exists in the domain of smartwatches, as indicated by the literary analysis of Lu et al. [11]. The risk of cardiac arrest is particularly prominent for individuals who live alone or are socially isolated [12]. Loneliness is also observed to be linked to chronic heart disease (CHD) risk factors such as anxiety and job stress [13]. The use of smart devices can help prevent adverse outcomes and decrease the time for the first medical contact, thereby resulting in better treatment outcomes. Therefore, in this study, we intend to combine smartwatches and CHD patients that are living alone. The study is significant, as no previous research has combined the aforementioned two factors and provided a system for obtaining improved health outcomes.
We propose a framework that precisely identifies HRV as a vital sign for evaluating the cardiac status, particularly in patients during post-MI follow-up. It is because, in most patients, abnormal HRV has been associated with an increased risk of mortality within a few years after developing MI [2]. Conversely, a reduction in the heart rate is associated with an increase in the risk of mortality during post-MI follow-up. In this study, a smart CardioWatch (SCW) framework is designed to predict HRV by monitoring the pulse rate in high-risk patients with cardiovascular diseases, ensuring that they receive necessary medical attention before the occurrence of complications and death due to MI, thereby reducing the MI-associated mortality rate. The SWC monitors vital signs such as heart rate; this information is stored in a container for further analysis. To conveniently describe abbreviations, and corresponding definitions used throughout manuscript are listed in Tab. 1.
The rest of paper is organized as follows. In Section 2, we propose Framework for CardioWatch. Then, we describe each and every modules which represent our proposal. We conducted two types of experiments based on machine learning and deep learning techniques using dataset that is exclusively used for cardio vascular disease in section 3, we obtained results on performance metric on both techniques. Conclusions are given in Section 4.
The proposed framework has only one type of client (patient), regarded as a client or a smart client or App. The App can be loaded on any of the smart devices that supports operating system IOS or Android. The App must connect to the server, namely, the CardioWatch web server or the Smart Doctor. The connection between the smartwatch and smartphone is established with the help of near-field communication, smartphone, and CardioWatch webserver communication are performed with the help of Transmission Control Protocol over Internet Protocol in short TCP/IP suite. The architectural framework of CardioWatch is depicted in Fig. 1. It has an HRV reader, decision maker, DTMF /push/pop notification, and streaming and analytical module.
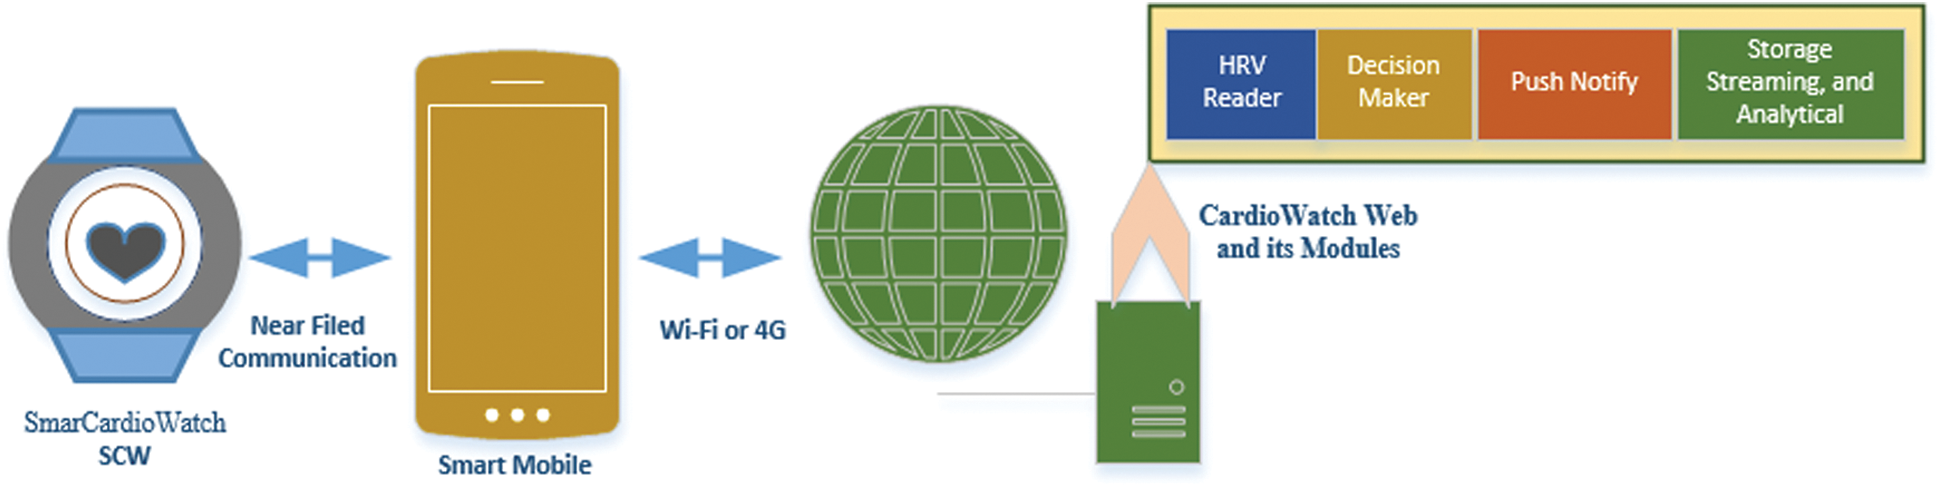
Figure 1: Architectural overview of the proposed framework of CardioWatch
The HRV reader module receives various HRV values from SCW via smartphone. The irregular heartbeat under different conditions is known as arrhythmia. These variations are considered normal; however, if the variations are associated with dizziness, chest pain, or shortness of breath, medical attention is must be sought. The variations in the heart rate under pathological conditions, particularly in patients at the risk of cardiovascular diseases such as MI, can act as an indicator or a warning sign for the underlying pathology of the heart. Therefore, HRV is associated with cardiovascular diseases, particularly in high-risk patients. Reportedly, abnormal HRV predicts sudden cardiac arrest (SCA) after MI [3–6]. These variations are stored in a database for future access and decisions. To make our framework more responsive and less dependent on any given network, we have employed the SQLite database, which is a lighter version of the SQL database and has several features that make it a more robust and relational transactional SQL database engine. In addition, real-time or streaming data are regularly fed to the database, and in the case of heartbeat data, hundreds of rows are fed into the streaming and analytical module. However, due to size and time constraints, only neat datasets were analyzed. For the heart rate, the data on the number of contractions of the heart per minute recorded, respectively. Two sets of data, each ≤2 bytes, contained heart-status messages called H data.
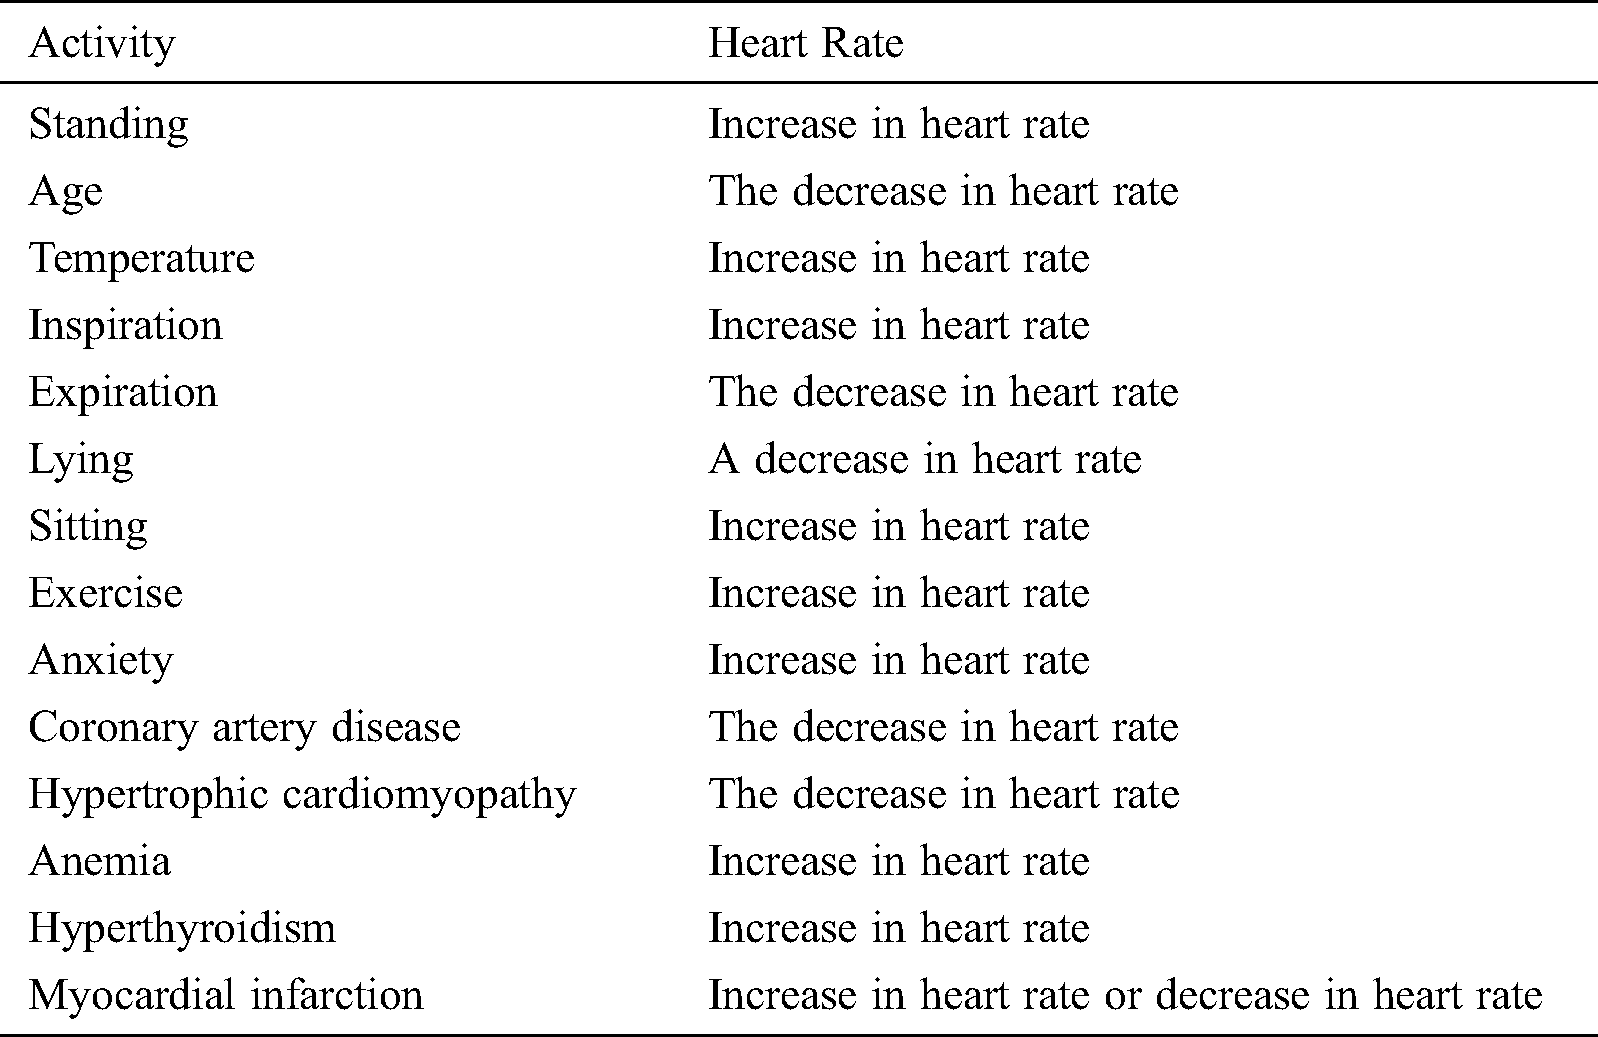
The physiological and pathological conditions of heart rate variation are listed in Tab. 2. The heart rate is a measure of specific changes in the time between two successive heartbeats. The pulse rate is a direct measure of the heart rate. The normal resting pulse rate is between 60 and 100 beats per minute (bpm). The heart rate is controlled by the sympathetic and parasympathetic branches of the autonomic nervous system (ANS). HRV is observed under different physiological and pathological conditions, and HRV is related to the activity of the ANS. HRV, due to ANS dysfunction in conditions such as MI, plays a crucial role in the origin of life-threatening ventricular arrhythmias. Ischemia and necrotic tissue damage resulting from MI are reported to induce alterations in the afferent and efferent fibers of the ANS [14,15].
Heart rate assessments after MI enable risk evaluation. Recent studies have suggested that HRV is a useful predictor during post-MI follow-up in the first year. Patients with a resting heart rate of >80 bpm show a 2-fold higher risk of cardiovascular mortality than those with a resting heart rate of ≤60 bpm. High resting heart rates at the time of MI and during the first year of post-MI follow-up identify patients at a high risk of all-cause and cardiovascular mortality. Studies have shown that the measurement of HRV during the first year of post-MI follow-up facilitates long-term prognosis and the evaluation of risk factors and reduces the mortality rate [16]. In numerous studies, a high resting heart rate has emerged as a new risk factor for mortality, particularly for cardiovascular mortality in patients. A higher heart rate may accompany an increased production of inflammatory molecules [17] Thus, a correlation is observed between the increased resting heart rate and cardiovascular risk [18]. Similarly, reduced HRV among post-MI patients is a well-established risk factor for arrhythmia-related death [19]. A diminished heart rate predicts an increase in arrhythmic cardiac mortality in MI a low heart rate has been reported in survivors after an acute attack of MI, and it is associated with a high risk of all-cause mortality. Furthermore, some studies have suggested that a low heart rate is related to sudden cardiac arrest and coronary artery disease [20,21]. Hence, HRV or pulse rate variability can be used as a prognostic factor for indicating cardiac status as well as for the management of cardiovascular diseases [22].
The heart rate has been reported to increase with variation in temperature [23,24]. Posture has also been reported to affect variations in the pulse rate. The supine position is associated with a decrease in the pulse rate, and the sitting position is associated with an increase in temperature because of changes in the hydrostatic pressure, which affects the influence of the ANS on heartbeat [25,26]. Exercise considerably affects the heart rate. The heart rate and stroke volume increase to approximately 90% of their maximum values during strenuous exercise [27].
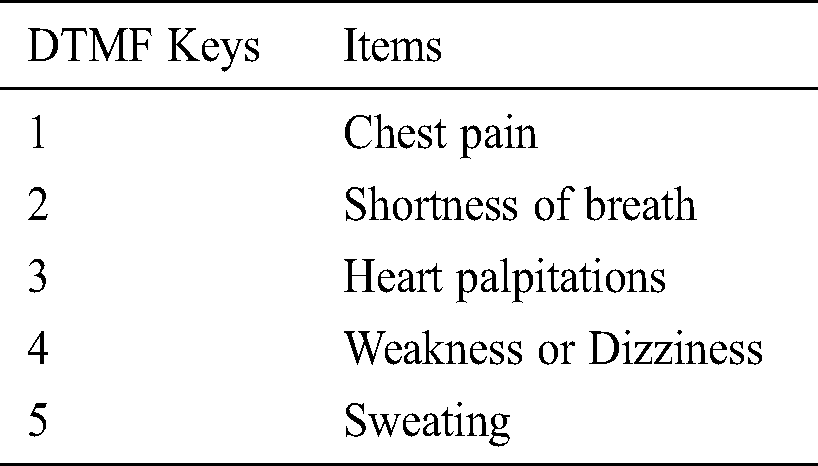
Before the occurrence of any health problem, the heart provides physiological and pathological signals; however, due to the unavailability of hand-held equipment or smart devices, patients may not be able to seek immediate medical assistance to prevent damage to their vital organs. Although many smartwatches are available in the market, very few are usable for the stated study project. These few watches can be used by patients with cardiovascular diseases. These watches can be used under different OSs such as Android and IOS. Among them, Samsung gear has been widely used in scientific studies [28–31]. The push/pop notification module used to know more about the condition of the patient during HRV. The symptoms associated with HRV are listed in Tab. 3.
Table 3: Physiological and pathological conditions of heart rate variation
To know more about HRV, push notifications serve as a channel for establishing instant communication between patient and server. Webserver receives the conditions of patients, along with their activities, to draw a conclusion on the variation. Presently, as smart watches are currently capable of sensing a limited number of activities, we have used push notifications module. If a significantly large amount of data regarding the patient’s activities is required, wearable external smart devices can be a suitable candidate.
Fig. 2 shows webserver architecture, which hosts many key modules, namely decision maker, container, and streamer. The decision maker is the core of the proposed framework because it detects events (fluctuation in heart rate) and MI. The decision-maker is trained to identify the changes in the patient’s inputs, i.e., heart rate and pulse oximeter rate. However, these fluctuations are often found to be misleading, which require training to the decision-maker for adequate differentiation between a false and an actual alarm. Similarly, the inputs from the patients can be understood using Machine learning. Machine learning trained the system and categorized it into supervised, unsupervised, and semi-supervised machine learning. In the present research, machine learning and deep learning techniques are used. Moreover, the input data are labelled, while some are provided with supervision information.
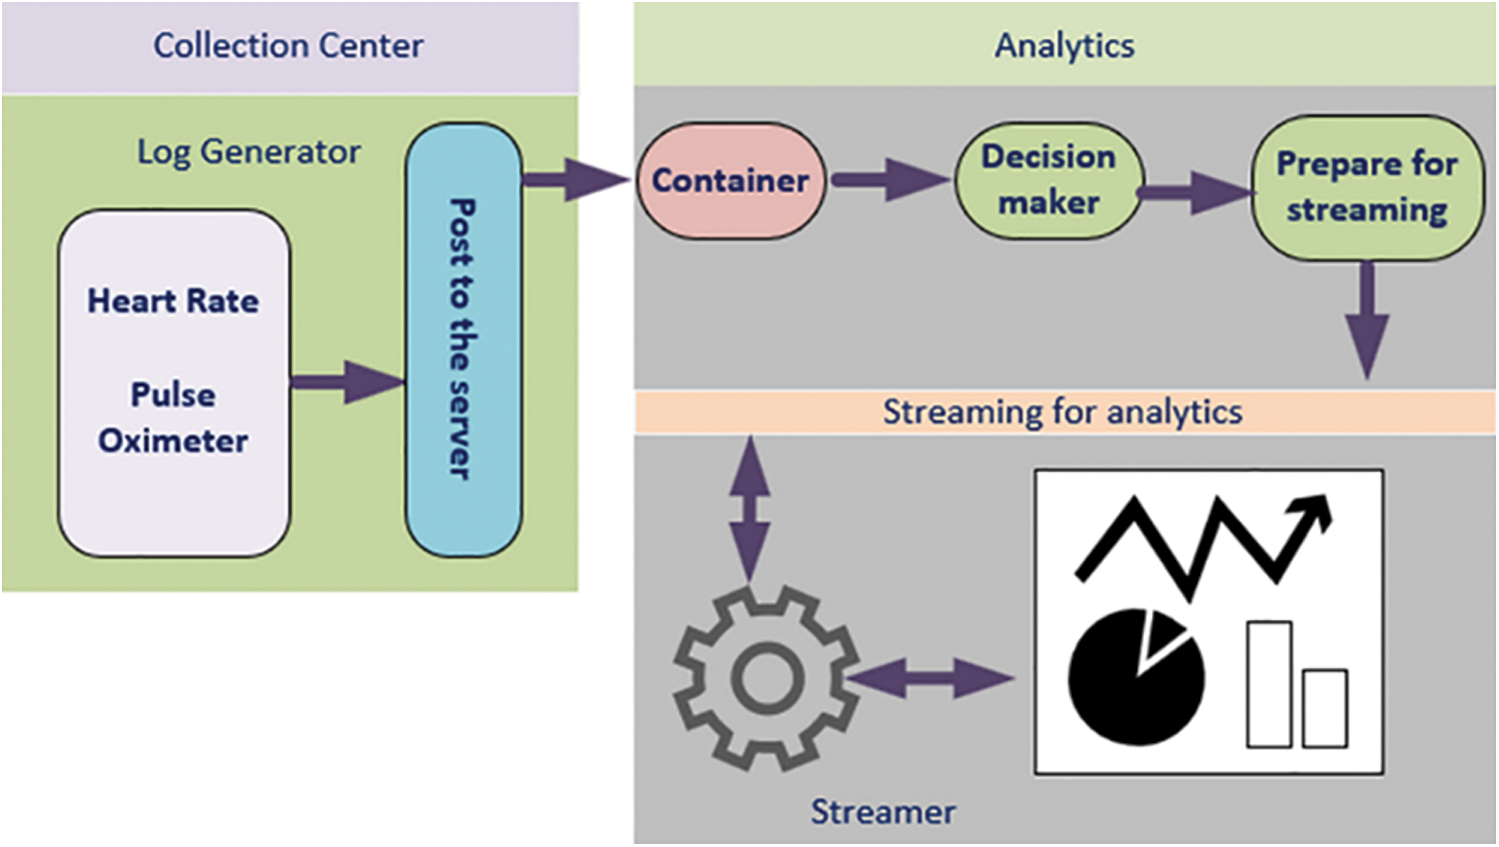
Figure 2: CardioWatch webserver server architecture CardioWatch
Virtual machines (VMs) use hypervisor software for emulating a real computer. Hypervisor software enables any heavy hardware (particularly high-end processors) to host multiple virtual OSs. The software enables resource sharing, such as the central processing unit, random access memory, and other hardware resources of the host machines with VMs. However, hypervisor software sharing of resources is difficult within its group of VMs. Therefore, Dockers have been introduced. Dockers provide containers (application-level OS) with means of sharing resources and vital hardware resources as per the application needs. This implies that containers are better organized than hypervisors. Containers use a single OS (guest) and scale their resources according to the needs of applications. The sharing of resources also reduces post-cross-platform developer issues by allowing the application to bundle its dependencies along with the development environment. In the proposed framework, the container is an application that collects patient data from the smart client (patient with CSW).
The irregular heartbeat under different conditions is known as arrhythmia. In tachycardia, the heart rate exceeds the normal resting rate. It is because variations in the heart rate response to different physiological and pathological conditions, accurately defining the normal heart rate in an individual is difficult. However, the medical heart association defined a heart rate of >100 bpm as tachycardia and a heart rate of <60 bpm as bradycardia. These variations are considered normal; however, if the variations are associated with dizziness, chest pain, or shortness of breath, medical attention is necessary. Variations in the heart rate under pathological conditions, particularly in patients at risk of cardiovascular diseases such as MI, can act as an indicator or a warning sign for the underlying pathology of the heart. Thus, HRV is associated with cardiovascular diseases, particularly in high-risk patients. Reports have suggested that abnormal HRV predicts sudden cardiac arrest after MI.
Fig. 3 shows the architecture for storage, streaming, and analytical environment. Collection centres generate large amounts of data; hence, the proposed module should be to process real-time data. Real-time or streaming data are fed regularly, and in the case of heartbeat data, hundreds of rows are fed into the analytical module every hour. Due to size and time constraints, however, only neat datasets were analyzing. Furthermore, the module must either store data or analyze it in real-time.
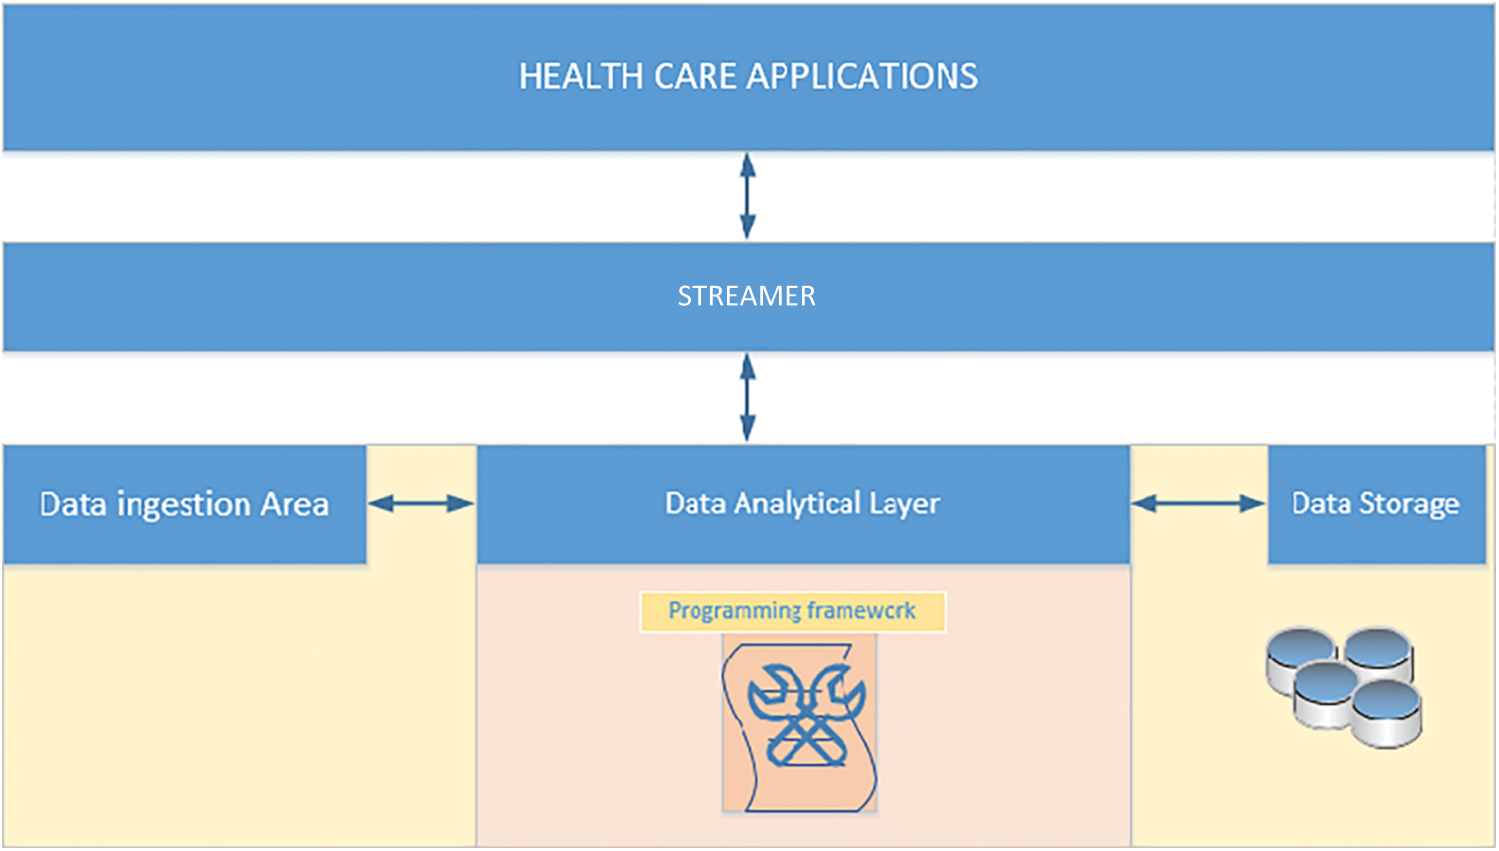
Figure 3: Storage, streaming, and analytical architecture
Internet of Things (IoT) (data generated through Internet-based application) is substantially expanding and is likely to reach around 45 ZB (45*1021 bytes) by 2020 [18]. The data generated will be stored and processed before it is fed to the client machine for analysis. Hence, this setup is both an opportunity and a challenge for the research fraternity to exploit conventional methods and suggest solutions. The storing of the data is challenging along with its analysis due to its different types, the veracity of data, and the privacy of health data. Traditional data storage platforms cannot be used for the huge database. However, Hadoop and NoSQL have emerged as a valuable solution for huge database requirements. A plethora of research papers have contributed immensely and pointed out that the unified data storage techniques will be more suitable for structural and unstructured data [30,31].
This kind of setup has proven to be a more effective service invocation method for IoT based application development. For the heart rate and pulse oximeter, data on the number of contractions of the heart per minute, and data on oxygen saturation are recorded, respectively. Two sets of data, ≤2 bytes in size, are heart-status messages called H data. As these messages are continuously sent, the SCW is an ideal device for sending data on the status of the patient. This module enables the status of the patient to be determined. The heart rate and oxygen saturation are crucial indicators of the patient’s status.
The canonical streaming of real-time H data for further processing involves different forms of data representation, in which a stream of H data is analyzed, and its significance is reported. This description will help health care workers to diagnose and to inform specialized doctors about reports. In the study proposed framework, the streamer splits the data into two, namely heart rate and pulse oximeter. For example, the “heart rate” and “pulse oximeter” data would be categorized into the “heart rate” partition and “oximeter” partition, respectively. The proposed framework will process H efficiently and as early as possible. This is the key difference between the proposed module and other real-time streaming data processing applications, which have been developed to process real-time data into small batches. Hence, this approach will reduce the delay because data rendering and processing are made efficient.
The proposed framework has a real-time source as the server captures and stores it from the streamer. The proposed study architecture has a large buffer to store the real-time heart rate for further processing. However, intelligent ways for processing the data are needed for delivery and message queuing techniques. Also, efficient, lightweight encryption protocols such as data encryption standard (DES) should be used for protecting the communication between the end-user or patient and server.
Each stream is a real-time data which can be further divided into a fixed set of stores where the client or patient store real-time data according to a storing strategy, wherein, only one client is permitted to use data storage or partition. Such setups eliminate data synchronization issues, which lead to difficulty in process oversized partitioned. The study proposed system requires sequential data access, to store data with append time, where an offset is not required. Thus, it increases performance and reduces space overhead.
To test the applicability and effectiveness of the proposed framework system. The heart rate data were collected from the UCI machine learning repository. For more information on this, the dataset can be had from the website itself. This dataset consists of many relevant and irrelevant cardiac parameters with respect to our cardiac watch because of our framework is limited only to the HRV parameter. However, testing purposes, we consider some other for the purpose, we have utilized machine learning and deep learning technique to detect the presence of MI in any given HRV data. The following section provides the details concerning the results that were gathered through the deployment of the system.
For data analysis, we have utilized machine learning (ML) and deep learning (DL) techniques. It is utilized in image classification, object detection, speech recognition, natural language processing, transportation, and medical science. DL becomes more powerful if it is clubbed with CNN (Convolution Neural Network), CNN’s accuracy depends on its hidden mathematical layers and if more layers are employed then human like accuracy can be achieved, hence in this framework, we have utilized CNN along with DL to process and detect MI detection.
In the second set of data analysis, we have applied Support Vector Machines (SVM), Logistic Regression (LR), and decision tree (DT) ML techniques on the UCI machine learning dataset, which focuses on heart diseases such as MI.
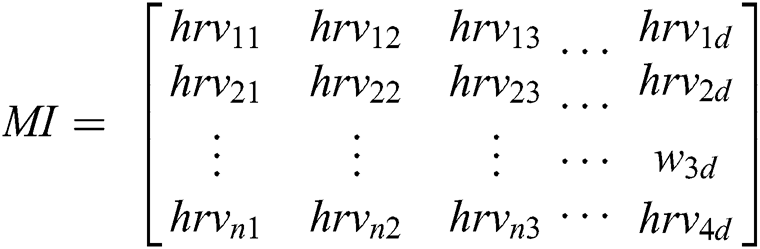
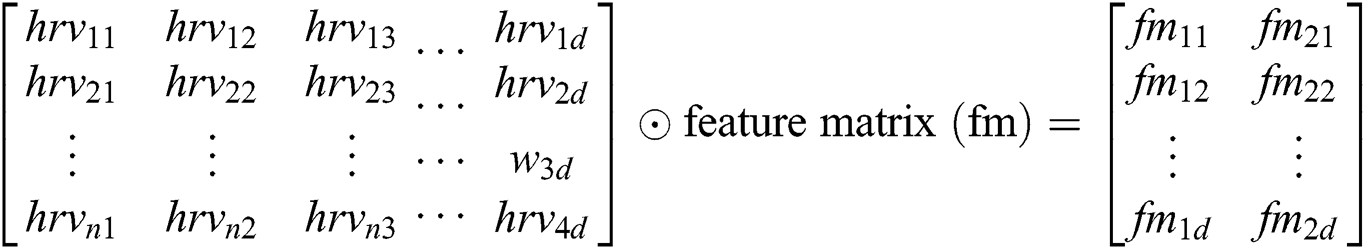
Every HRV data called as hrvd is a list of heart rate collected along with activities a . . We created a set V from the Glove and assigned a unique number for each activities. Each activity extracted from V is represented as
 , these are the HRV data from the different activities denoted
 . Then, set A(hrv) are concatenated to create HRV data, which is called MI data.

The symbol in between HRV data is called concatenation. The HRV data matrix is denoted as MI1:n from HRV 1 to N. Hence, hrvd matrix  is formed for every smartwatch.
3.1.2 Context-Dependent HRV Data Extraction Phase
Feature extraction is formed from the feature matrix performed over the convolution operator. Convolution operation over hrv data will yield featured matrix of different sized kernels because we have divided words (activities) into 1, 2 and 3-grams, then the convolution layer receives different sized kernels, therefore, the padding is required for each hrv activity to make the activity words of the same size. Since we typically use small kernels 2-gram, for any given convolution, we have only a few words, but this can add up as we apply many more convolutional layers. Hence, padding can make the words of the same sized.
In our proposal, we are calculating padding mapping function as follows.
Y is the padding for each activity d dimension vector to produce embedded activities (words).
Features ( ) can be calculated by the equations.
 + … +
+ … + 
 + … +
+ … + 
 + … +
+ … +  .
.
These features are extracted using the convolution operator in the form feature matrix and are passed through the ReLU activation function. This activation function separates the positive and negative features, and these features are stored in matrix F1. With this operation, all features are identified, however, we need to scale only the most important features of MI, and this is performed with the help of max-pooling, as shown in Eq. (5).
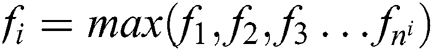
Max pooling is supplied windows size as n1 because we have selected some of the hrv data to be MI data. We have n1 as features of MI with respect to the activities. Then softmax function, as shown in Eq. (6), is applied to the features to receive the probability of each of the features.
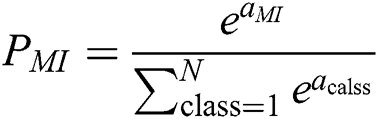
Eq (6),  gives particular MI data carried by the output neuron, and
  is the class of the out of the individual neuron, and it has a variation between YES or NO, so hence it is only N = 2.
CNN uses the LSTM network to retain long sequences of the text and other input data. We have used the LSTM network to discard data that are not relevant to the MI data. Hence, to extract HRV data with respect to the MI is significant, as shown in the figure, LSTM network, to extract hidden MI data from the activities. Our approach uses four gates, input gate, output gate, cell gate, and forget gate. These gates help us to discard not relevant data with respect to MI. Every time, LSTM network receives data and outputs memory gate, which contains memory data. In Eq. (7), it is mandatory to throw away some data. The second iteration, the decision is made on the data to be stored in the memory for future processing; this is accomplished by using tanh function and Sigmoid.
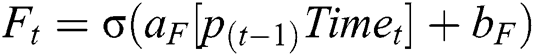
(Note f is used for features and whereas F is used for Forget gate)
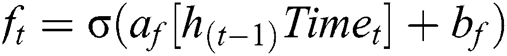
Eq. (8), gives us the MI detected data with the help of sigmoid and tanh functions.
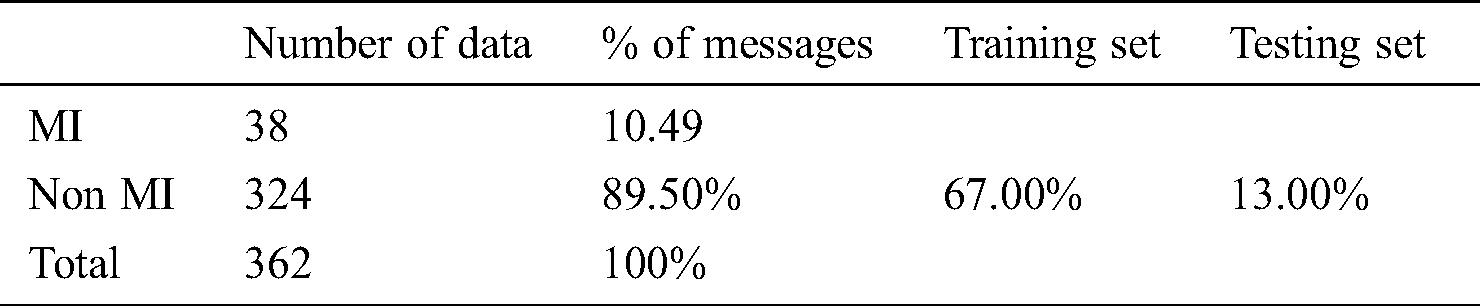
To assess the performance of the SCW, we employed the well-known measurement metrics for the classification techniques such as Precision (P), Recall (R), and F1-Score. Precision P has the following formula to return MI. We have used Tab. 4 for the dataset.
Table 4: Dataset, statics for the present study
Precision (P): It is defined as the fraction of circumstances in which the correct MI is shown in Eq. (8).

Eq. (10), gives, recall is the fraction of the relevant MI that are successfully retrieved.
F1-Score (F1): It is a harmonic mean of precision and recall, as given in Eq. (11).
We conducted our experiments on the proposed CNN module using one and kernel configuration along with Glove, we have used data batch size as 10. Calculated P, R, and F1 values 0.99, 0.76, and 0.92, respectively, for the MI detection. We have modified the parameters of our proposed method and appended extra convolution layers, Tab. 4 shows with and without extra convolution layer results. With this approach, we can improve the MI prediction. For each different layer of CNN, we have calculated the P, R, and F1 values, as shown in Tab. 5.
Table 5: P, R and F1 values with respect to the CNN layers
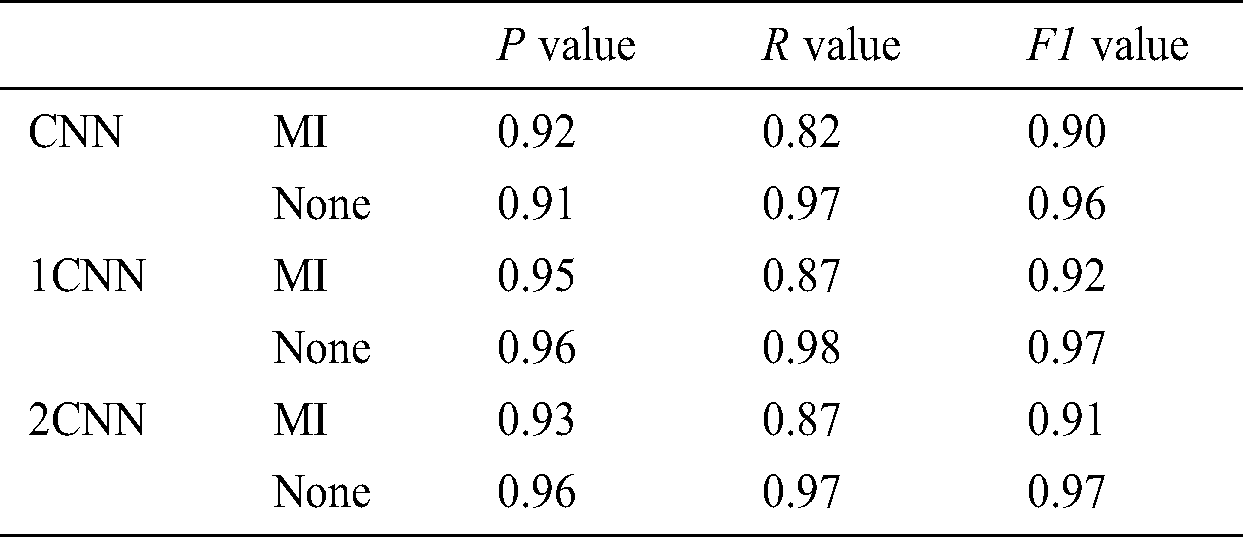
Increased CNN layers allow us to increase cardiac parameters, which results in an increased probability of human like accuracy. However, to a certain level, we can increase the CNN layers, however, supported parameters such as P, R, and F1 will either decrease or increase, and this condition restricts us from stopping the stacking of CNN layers. Hence, there are other parameters that can also be adjusted, such as the dropout parameter, which allows having the best results.
In this section, only one feature was selected and employed SVM, LR, and DT classification techniques. We have used Rapid Miner Graphical User Interface, which allows data scientists to pre-process, classification of dataset attributes, select classification techniques (SVM, LR, and DT), and logs the performance in various ways.
In the pre-processing phase, we have removed data rows who never had values and prepared the data for feature classification. In the classification phase, we have selected heart rate only data because we receive only HRV from the SCW, and in the classification of modeling along with 10-cross fold, verification enabled us to form satisfactory results. We have used accuracy, precision, and F1-score to model evaluation metrics. The performance of the aforementioned ML techniques on various combinations of features was investigated one by one. All the experiment results on performance measures were collected for further analysis. Fig. 4 shows the accuracy, the precision, and the f-measure obtained for each modeling technique.
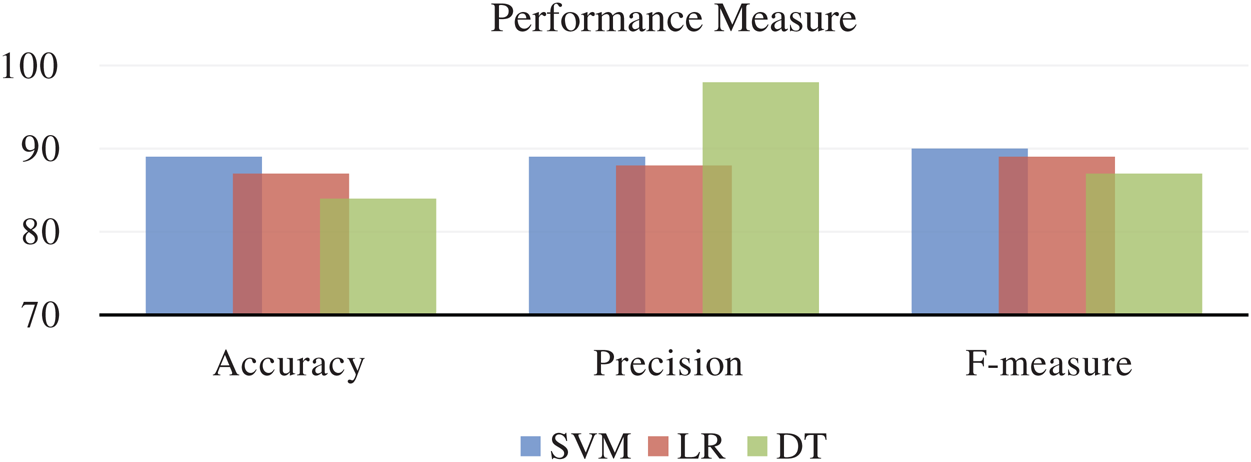
Figure 4: Accuracy, precision, and F1 score: Interpretation of performance measures
The SVM performance in accuracy and f-measure is excellent, whereas DT performs better in precision. Whereas, LR technique is underperformer in all the performance metrics. All these results are measured using only one feature that is HRV. If we include more combinations of the feature at least 4 to 5 features, then the result varies, as shown in Fig. 5.
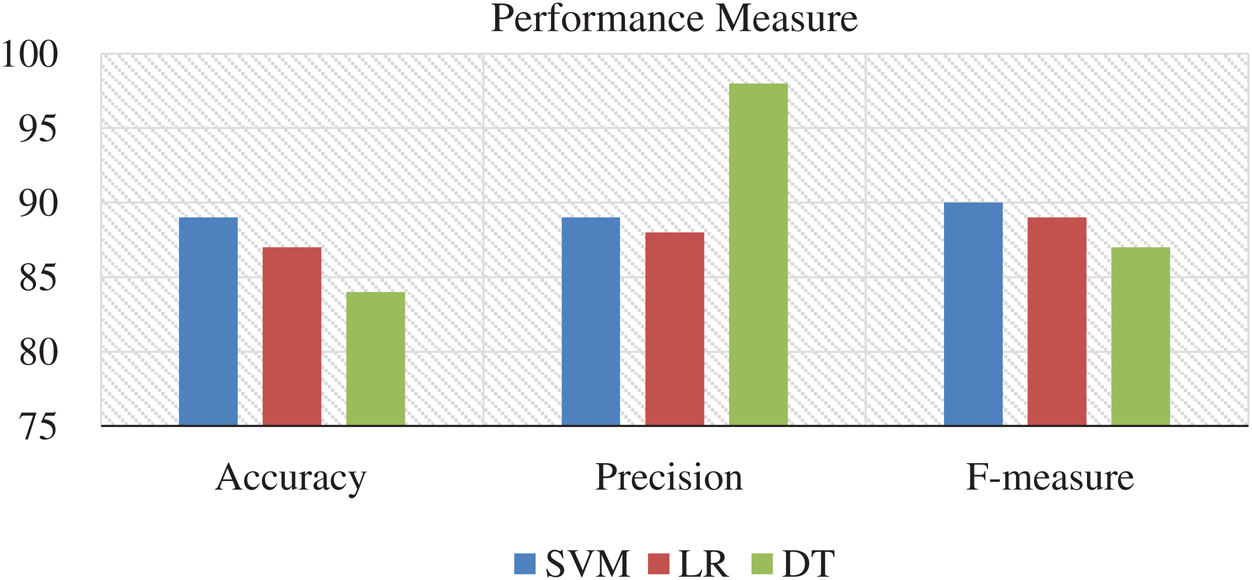
Figure 5: Accuracy, precision, and F1 score: Interpretation of performance measures with a combination of the feature
In the pre-processing phase, we have removed data rows who never had values and prepared the data for feature classification. In the classification phase, we have selected heart rate only data because we receive only HRV from the SCW, and in the classification of modeling along with 10-cross fold, verification enabled us to form satisfactory results. We have used accuracy, precision, and F1-score to model evaluation metrics. The aforementioned results are derived from DL and ML techniques, suggesting that HRV as a vital sign to detect MI in heart disease patients. However, if HRV, along with other features, can result in the best detection of MI disease. Features, such as resting ECG and Blood pressure, can bring more accurate results. More-ever, it is recommended by the American cardiac society that if more 150 beats per minute HRV then the patient is in critical condition and emergence health care is needed, such threshold HRV readings can be fixed for each patient and accordingly SCW can invoke DTMF service to get emergency services from the health care providers. Presently only one smart watch from Apple company reads ECG. Therefore, this smart watch can be a great smart tool to provide and implement our proposed framework to render timely services to save lives who are suffering from MI and living life alone.
The pulse rate is exactly equal to the heart rate and is a direct measure of the heart rate [11]. Studies have reported a correlation between the heart rate or pulse rate and the incidence of hypertension [32]. The primary advantage of the SCW is that it enables the monitoring of high-risk patients with cardiovascular diseases not only in hospitals but also at other locations outside hospitals. However, for ensuring accuracy in the use of HRV for predicting MI, other factors associated with HRV under different physiological conditions should be considered before HRV interpretation [11]. Furthermore, anxiety or panic attacks rapidly increase the heart rate. The effect of stress on HRV is associated with an increase in the heart rate. Stress, anxiety, and other emotions increase the levels of adrenalin and cortisol, which strongly affect the heart rate. Analysis of the correlation between the heart rate and respiration revealed that the heart rate increases with inspiration and decreases with expiration [26]. Patients with coronary artery disease have been reported to exhibit lower heart rates than normal individuals [27].
Communication with a nearby device, which in turn communicates with the health care worker, is a crucial subject in health care. Thus, no watch has been programmed or developed for providing medical care, particularly for patients with cardiovascular diseases. The architecture is found to be effective, which is particularly useful for the patients living alone. Given the annual statistics of the mortality for sudden cardiac arrest (SCA) (i.e., 325000 lives), it is integral that timely measures are provided with easy to use services. The use of the proposed system in this study is likely to assist in the heart rate, which helps take timely actions to prevent the occurrence of any adverse event. In this study, the use of different programs and languages concerning the SCW is shown, while also highlighting the way each contributes to the deployment of SCW. This device can enable individuals, particularly the ones living alone to access their health, identify any adverse MI outcome, and attain medical help. It also facilitates the medical care practitioners and communicates the past details of the patients, which is also easier to maintain. Accordingly, individuals living alone should also indulge in activities that can help subside their detrimental effects, including increased opportunities for social contact, meditation, qigong, tai chi, and yoga. However, accuracy must be ensured when SCW is being used for managing cardiovascular diseases. Previously, only a few studies have focused on the management of cardiovascular diseases. Also, SCWs should be paired with the patient’s mobile phones for power supply and network access. Currently, only a few scientific studies have assessed the competencies of various smartwatches for measuring the heart rate. However, none of these studies have focused on smartwatch accuracy in the context of patients that live alone. Hence, extensive research on the accuracy of smartwatches is necessary before they can be used for providing medical assistance.
Acknowledgement: We thank Deanship of Research, Prince Sattam Bin Abdulaziz University, Wadi Ad Dawaser, Saudi Arabia, for providing an opportunity to conduct research. We would also like to thank Dr. Amanulla Khaji (MD, Cardiology, West Chester Cardiology, West Chester, USA).
Funding Statement: This project is supported by the Deanship of Scientific Research at Prince Sattam Bin Abdulaziz University under the research project # 2019/01/9539.
Conflicts of Interest: The authors declare that they have no conflicts of interest to report regarding the present study.
1. Patlar Akbulut F. and Akan A. (2018). “A smart wearable system for short-term cardiovascular risk assessment with emotional dynamics,” Measurement, vol. 128, pp. 237–246. [Google Scholar]
2. C. S. Bloss, N. E. Peters, M. Boeldt, D. L. Ariniello, J. Y.Kim et al. (2016). , “A prospective randomized trial examining health care utilization in individuals using multiple smartphone-enabled biosensors,” PeerJ, vol. 4, no. 4, pp. e1554. [Google Scholar]
3. T. C. Lu, C. M. Fu, M. Ma, C. C. Fang and A. Turner. (2017). “Healthcare applications of smart watches,” Applied Clinical Informatics, vol. 7, no. 3, pp. 850–869. [Google Scholar]
4. N. K. Valtorta, M. Kanaan, S. Gilbody, S. Ronzi and B. Hanratty. (2016). “Loneliness and social isolation as risk factors for coronary heart disease and stroke: Systematic review and meta-analysis of longitudinal observational studies,” Heart, vol. 102, no. 13, pp. 1009–1016.
5. N. Xia and H. Li. (2018). “Loneliness, social isolation, and cardiovascular health,” Antioxid & Redox Signal, vol. 28, no. 9, pp. 837–851.
6. H. V. Huikuri and P. K. Stein. (2012). “Clinical application of heart rate variability after acute myocardial infarction,” Frontiers in Physiology, vol. 3, no. 41, pp. 1–5. [Google Scholar]
7. Z. Kazmi, H. Zhang, W. Aziz, O. Monfredi, S. A.Abbas et al. (2016). , “Inverse correlation between heart rate variability and heart rate demonstrated by linear and nonlinear analysis,” PLoS One, vol. 11, no. 6, pp. 1–10. [Google Scholar]
8. E. Jovanov. (2015). “Preliminary analysis of the use of smartwatches for longitudinal health monitoring,” in Annual Int. Conf. of the IEEE Engineering in Medicine & Biology Society, Huntsville, USA, pp. 865–868.
9. H. Kalantarian, N. Alshurafa and M. Sarrafzadeh. (2015). “Audio-based detection and evaluation of eating behavior using the smartwatch platform,” Computers in Biology and Medicine, vol. 65, no. 1, pp. 1–9.
10. M. R. Kamdar and M. J. Wu. (2016). “PRISM: A data-driven platform for monitoring mental health,” in Proc. of the Pacific Symposium, Hawaii, USA, pp. 333–344. [Google Scholar]
11. F. Sessa, V. Anna, G. Messina, G. Cibelli, V. Monda et al. (2018). , “Heart rate variability as predictive factor for sudden cardiac death,” Aging (Albany, NY), vol. 10, no. 2, pp. 166–177. [Google Scholar]
12. D. Zhang, X. Shen and X. Qi. (2016). “Resting heart rate and all-cause and cardiovascular mortality in the general population: a meta-analysis,” Canadian Medical Association Journal, vol. 188, no. 3, pp. E53–E63. [Google Scholar]
13. A. Samol, K. Bischof, B. Luani, D. Pascut, M.Wiemer et al. (2019). , “Recording of bipolar multichannel ECGs by a smartwatch modern ECG diagnostic 100 years after einthoven,” Sensors, vol. 19, no. 13, pp. 1–9. [Google Scholar]
14. J. Sztajzel. (2004). “Heart rate variability: A noninvasive electrocardiographic method to measure the autonomic nervous system,” Swiss Medical Weekly, vol. 134, no. 35, pp. 514–522. [Google Scholar]
15. P. Jabre, V. L. Roger, S. A. Weston, F. Adnet, R. Jiang et al. (2014). , “Resting heart rate in first year survivors of myocardial infarction and long-term mortality: A community study,” Mayo Clinic Proceedings, vol. 89, no. 12, pp. 1655–1663. [Google Scholar]
16. A. Sajadieh, O. W. Nielsen, V. Rasmussen, H. O. Hein, S. Abedini et al. (2004). , “Increased heart rate and reduced heart-rate variability are associated with subclinical inflammation in middle-aged and elderly subjects with no apparent heart disease,” European Heart Journal, vol. 25, no. 5, pp. 363–370. [Google Scholar]
17. M. T. Jensen, J. L. Marott, K. H. Allin, B. G. Nordestgaard and G. B. Jensen. (2012). “Resting heart rate is associated with cardiovascular and all-cause mortality after adjusting for inflammatory markers: The Copenhagen City Heart Study,” European Journal of Preventive Cardiology, vol. 19, no. 1, pp. 102–108. [Google Scholar]
18. R. P. Villareal, B. C. Liu and A. Massumi. (2002). “Heart rate variability and cardiovascular mortality,” Current Atherosclerosis Reports, vol. 4, no. 2, pp. 120–127. [Google Scholar]
19. R. E. Kleiger, J. P. Miller, J. T. Bigger Jr. and A. J. Moss. (1987). “Decreased heart rate variability and its association with increased mortality after acute myocardial infarction,” American Journal of Cardiology, vol. 59, no. 4, pp. 256–262. [Google Scholar]
20. G. J. Martin, N. M. Magid, G. Myers, P. S. Barnett, J. W. Schaad et al. (1987). , “Heart rate variability and sudden death secondary to coronary artery disease during ambulatory electrocardiographic monitoring,” American Journal of Cardiology, vol. 60, no. 1, pp. 86–89. [Google Scholar]
21. I. Šipinková, G. Hahn, M. Meyer, M. Tadlanek and J. Hajek. (1997). “Effect of respiration and posture on heart rate variability,” Physiological Research, vol. 46, no. 1, pp. 173–179. [Google Scholar]
22. D. C. Shannon, D. W. Carley and H. E. Benson. (1987). “Aging of modulation of heart rate,” American Journal of Physiology-Heart and Circulatory Physiology, vol. 253, no. 4, pp. H874–H877. [Google Scholar]
23. L. Madaniyazi, Y. Zhou, S. Li, G. Williams, J. J. K. Jaakkola et al. (2016). , “Outdoor temperature, heart rate and blood pressure in Chinese adults effect modification by individual characteristics,” Scientific Reports, vol. 6, no. 1, pp. 195. [Google Scholar]
24. P. Davies and I. Maconochie. (2009). “The relationship between body temperature, heart rate and respiratory rate in children,” Emergency Medicine Journal, vol. 26, no. 9, pp. 641–643. [Google Scholar]
25. J. A. MacWilliam. (1993). “Postural effects on heart-rate and blood-pressure,” Quarterly Journal of Experimental Physiology: Translation and Integration,”, vol. 21, no. 1, pp. 1–33. [Google Scholar]
26. D. A. Burton, K. Stokes and G. M. Hall. (2004). “Physiological effects of exercise continuing education in an aesthesia,” Critical Care & Pain, vol. 4, no. 6, pp. 185–188. [Google Scholar]
27. S. Z. Kazmi, H. Zhang, W. Aziz, O. Monfredi and S. A. Abbas. (2016). “Inverse correlation between heart rate variability and heart rate demonstrated by linear and nonlinear analysis,” PLoS One, vol. 11, no. 6, pp. 1–10. [Google Scholar]
28. H. Kalantarian and M. Sarrafzadeh. (2015). “Audio-based detection and evaluation of eating behavior using the smartwatch platform,” Computers in Biology and Medicine, vol. 65, no. 1, pp. 1–9. [Google Scholar]
29. H. Kalantarian, N. Alshurafa and M. Sarrafzadeh. (2015). “Detection of gestures associated with medication adherence using smartwatch-based inertial sensors,” Institute of Electrical and Electronics Engineers, Sensors Journal, vol. 16, no. 4, pp. 1054–1061.
30. M. K. Hassan, A. I. El Desouky, S. M. Elghamrawy and A. M. Sarhan. (2019). “Big data challenges and opportunities in healthcare informatics and smart hospitals,” in Security in Smart Cities Models, Applications, and Challenges, 13th ed., USA: Springer, pp. 3–26. [Google Scholar]
31. H. Cai, B. Xu, L. Jiang and A. V. Vasilakos. (2017). “IoT-based big data storage systems in cloud computing: perspectives and challenges,” IEEE Internet of Things Journal, vol. 4, no. 1, pp. 75–87. [Google Scholar]
32. R. N. Kazi, M. M. L. El-Kashif and S. M. Ahsan, “Prevalence of salt rich fast food consumption: a focus on physical activity and incidence of hypertension among female students of Saudi Arabia,” Saudi Journal of Biological Sciences, vol. 27, no. 10, pp. 2669–2673, 2020. [Google Scholar]
 | This work is licensed under a Creative Commons Attribution 4.0 International License, which permits unrestricted use, distribution, and reproduction in any medium, provided the original work is properly cited. |