DOI:10.32604/cmc.2020.012887
| Computers, Materials & Continua DOI:10.32604/cmc.2020.012887 | |
| Article |
Early Detection of Diabetic Retinopathy Using Machine Intelligence through Deep Transfer and Representational Learning
1Department of Computer Science and Information Technology, University of Sargodha, Sargodha, 40100, Pakistan and School of Systems and Technology, University of Management and Technology, Lahore, 54782, Pakistan
2Department of Computer Science, COMSATS University Islamabad, Wah Campus, Islamabad, Pakistan
3University Hospital Birmingham, Birmingham, UK
4Shifa International Hospital, Islamabad, Pakistan
5Department of Computer Science and Engineering, Sejong University, Seoul, Korea
*Corresponding Author: Muhammad Raheel Bhutta. Email: raheel.bhutta@sejong.ac.kr
Received: 16 July 2020; Accepted: 11 September 2020
Abstract: Diabetic retinopathy (DR) is a retinal disease that causes irreversible blindness. DR occurs due to the high blood sugar level of the patient, and it is clumsy to be detected at an early stage as no early symptoms appear at the initial level. To prevent blindness, early detection and regular treatment are needed. Automated detection based on machine intelligence may assist the ophthalmologist in examining the patients’ condition more accurately and efficiently. The purpose of this study is to produce an automated screening system for recognition and grading of diabetic retinopathy using machine learning through deep transfer and representational learning. The artificial intelligence technique used is transfer learning on the deep neural network, Inception-v4. Two configuration variants of transfer learning are applied on Inception-v4: Fine-tune mode and fixed feature extractor mode. Both configuration modes have achieved decent accuracy values, but the fine-tuning method outperforms the fixed feature extractor configuration mode. Fine-tune configuration mode has gained 96.6% accuracy in early detection of DR and 97.7% accuracy in grading the disease and has outperformed the state of the art methods in the relevant literature.
Keywords: Diabetic retinopathy; artificial intelligence; automated screening system; machine learning; deep neural network; transfer and representational learning
Glaucoma is a disease that occurs due to irregularity in the production and action of the insulin hormone in the human body. Persistent diabetes causes unadorned damages to the body like retinal disorder, organ failure, and heart ailment. Diabetic Retinopathy (DR) is the most common eye ailment caused due to the high blood sugar level of the human body, which badly indemnities the blood vessels of the retina. In the early stages, diabetic retinopathy causes slight vision issues, or even no symptoms are observed. Eventually, it leads toward irreversible vision loss. In America, one in three diabetic patients is affected by diabetic retinopathy. Meanwhile, the manual process of eye tests requires long time, care, and labor [1]. According to the world health organization (WHO), an estimated 422 million persons are enduring from the diabetes world widely. The global prevalence rate of diabetes has risen from 4.7% to 8.5% [2]. WHO has also projected that people with diabetes will grow from 171 million to 366 million in 2030 [3]. As the number of diabetic patients is increasing day by day, it is estimated that the number of patients suffering from DR will grow to 191.0 million in 2030 [4]. Currently, the prevalence rate of diabetic retinopathy and diabetic macular edema (DME) is 35% and 7%, respectively [5]. Diabetes and its complication come up with a considerable economic loss to the patients and their families. It economically burdens the patient as well as the national economy through medical cost and loss of wages. Therefore, early detection of diabetes and its complications may significantly reduce the risk of preventing vision loss by 90% [1].
Despite the worrying statistics, the main challenge is that diabetic patients do not feel any symptoms at an early stage, and an ophthalmologist has to do a careful examination of retinal images. The scarcity of ophthalmologists and the high cost of the retinal examination are the major challenges of early detection of diabetic retinopathy [6]. Thus, an automated, precise screening system is needed for the early identification of diabetic retinopathy and its severity stages. Diabetic retinopathy mainly causes structural changes in the layers of the retinal tissues. The retina is a thin photosensitive layer of nerve cells, padding the rear wall within the optic nerve. The optic nerve cells receive the light focused by the lens and transform into the neuro-signal and send it to the brain via optic nerves. The brain processes the neuro-signals and makes us able to recognize the objects visually. The various diseases may cause damage to the retina that leads to vision loss. Computer-aided diagnosis mainly utilizes retinal images for classification and identification of the disease. Due to histological imaging of the macula, optical coherence tomography (OCT) imaging has emerged as essential assistance for the detection and diagnosis of retinal pathologies like age-related macular degeneration (AMD) and DME. It is a non-invasive technique used to acquire 3-dimensional retinal images of eye pathologies like DME, choroidal neovascularization (CNV), and DRUSEN. DME is the initial stage of diabetic retinopathy in which macula swells or gets thicken due to blood leaking. The macula is the center of the retina, due to its location, chronicity enduring vision impairment can occur. CNV occurs when the blood vessels from the underside of the retina cause leakage of blood leading to hemorrhages. Hemorrhages can significantly affect vision loss that may lead to irreversible vision loss. Drusen are the yellowish lesion present in the basement of the epithelium membrane as it is shown in Fig. 1.
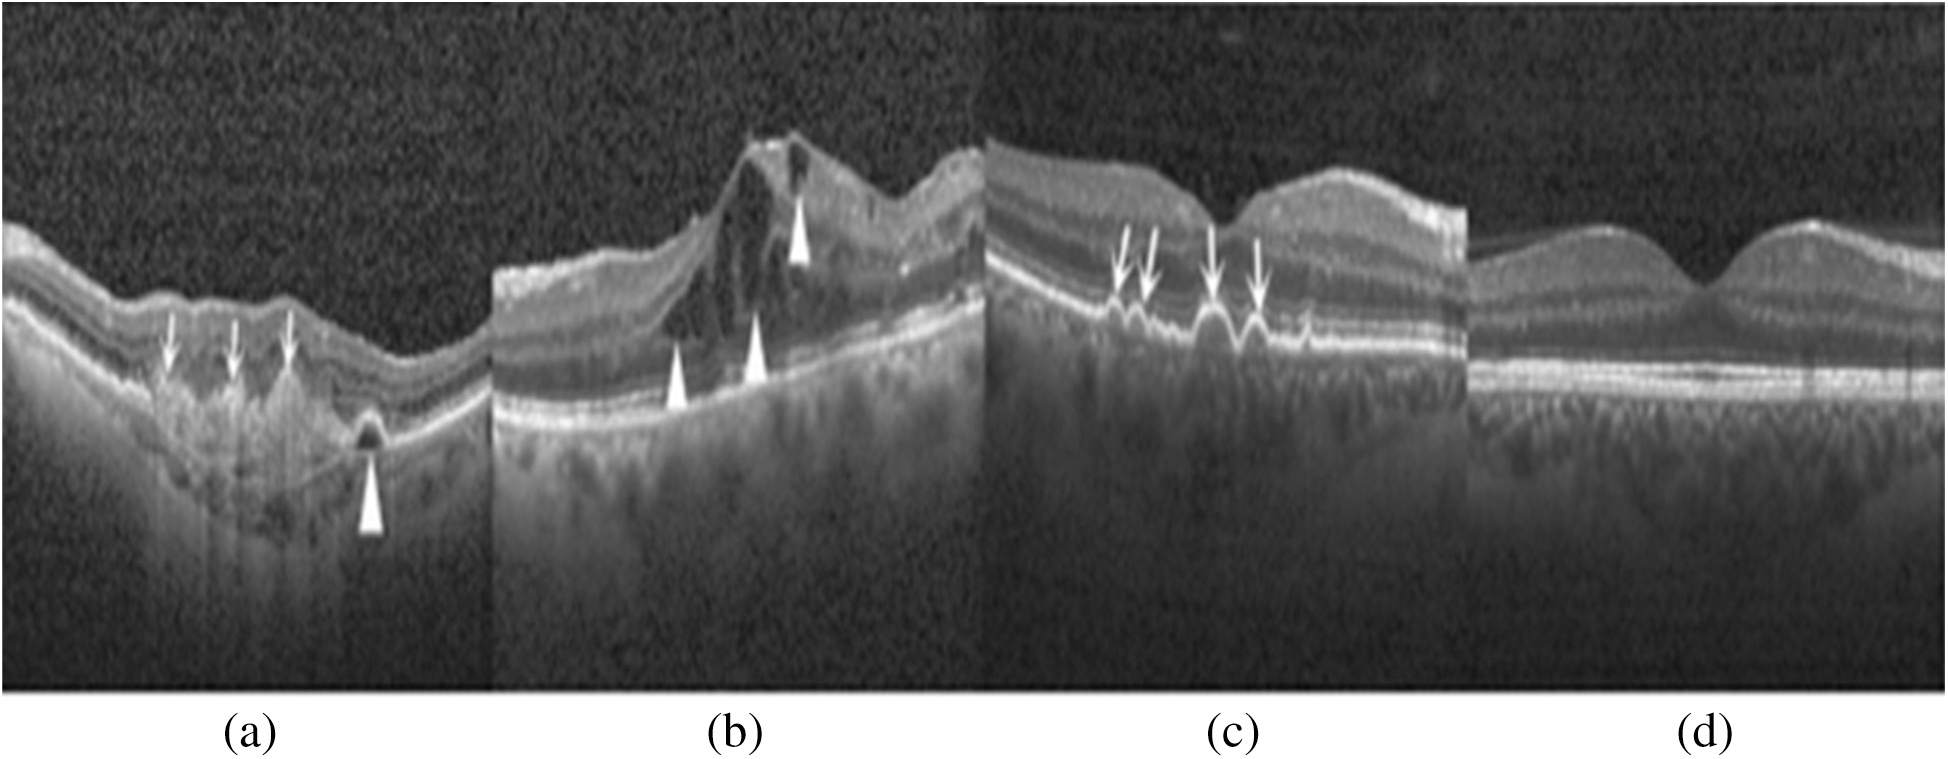
Figure 1: Depiction of retinal layers deformation and different stages of diabetic retinopathy in the OCT image: (a) CNV (white arrows) due to inside blood leakage and retinal detachment (arrowhead); (b) Retinal thickening (arrowhead) due to blood leakage; (c) Multiple yellowish lesions (white arrows); (d) Normal eye retina
Drusen are considered as an assurance of AMD and also be seen in other retinal pathologies. For the past few years, many detection systems were developed by utilizing many deep learning and machine learning techniques. Studies show that many machine learning techniques use the handcrafted feature for classifying the retinal images into the DR affected images and normal images. Researchers utilize these machine learning techniques, K-nearest neighbors (KNN) [7], histogram orient gradient descriptors (HOG) [8], support vector machine (SVM) [9], principal component analysis (PCA) [10], local binary pattern (LBP) [8], Linear Discrement Analysis [11,12] for the development of the diagnostic system. These traditional classifiers give good results, but lack in the generalization of knowledge of other domain areas and also very time-consuming. Taking into account of these disadvantages, ophthalmologists need a fully automated detection system based on machine intelligence.
This research study aims to develop a fully automated eye pathology detection system, using Inception-v4 on the dataset of OCT images to predict and grade the DR at an early stage. The major research contributions are stated below
• The state of the art Inception-v4 neural network has been explored for the detection of retinal ailment.
• The proposed system is highly autonomous, and no engineered features are extricated from the OCT images dataset.
• The proposed system is helpful to determine whether the patient is suffering from the DR’s early symptoms or not. If the patient is suffering from disease, the system will determine the severity stage of the disease.
• The proposed system outperforms existing studies in the relevant literature.
The rest of the paper is organized as follows. Section II presents a brief review of prior methods utilized for the detection of diabetic retinopathy. Section III demonstrates the steps of the proposed methodology and dataset preparation. Section IV presents the results of the proposed system and comparison of the proposed model with prior studies. Section V concludes the research article.
The automatic detection system has been developed using various methods which can be grouped as morphological techniques, machine learning techniques, and deep learning models.
2.1 Morphological Analysis Based DR Detection
The morphological analysis deals with pixel values of the images instead of the numerical values and thus presents better results on binary images. As morphological techniques are mainly concerned with the shapes; therefore, many researchers use them in the medical field for detecting the absurdity [13–17].
In morphological based detection, different segmentation and mathematical morphology are applied for the extraction of the concerned object from the image. Jaafar et al. [14] developed a novel approach for the detection of the exudates based on adaptive thresholding. In this work, researchers unleashed the geometrical features attributed to the eye retina and detected the extrudate using a hybrid approach that was a combination of region-based segmentation and edge detection technique. The blood vessel detection has been considered a very significant step in the diagnosis of DR [10]. For blood vessel detection, the basic closing morphological operator was being used along with two structuring elements. The optic disc is an interocular made up of fibers and tissues and appears as a pink and white disc. In the detection of many retinal diseases, optic disc detection played an important role. By locating optic disc and using its size as a reference, it may help in detecting other anatomical parts e.g., fovea, macula, etc. Segmentation of OD may help to increase the true positive rate during the evaluation of exudate detection. OD may be identified in digital fundus images as a slightly oval-shaped object. Anyhow, its size may differ from patient to patient, and many other approximations can also be made. Detection of OD was considered very relevant to detect other retinal pathologies, e.g., Glaucoma. It was considered as the second most conjoint reason for impaired vision worldwide.
Paing et al. [17] introduced another novel method for lesion detection. Firstly, the pre-processing of images was performed, such as removing noise, smoothing, and grayscale conversion. As the green channel gave more details than the blue and red bands [10,17]. So, the images were converted into the green band by taking the compliment. After the pre-processing step, the OD removal was performed to make the vessels detectable. The OD was removed by morphological opening operation with the Contrast Limited Adaptive Histogram Equalization (CLAHE) instead of morphological opening as opening makes the image blur. For the blood vessel detection, it was necessary to remove the background by performing opening again, but with a disk-shaped structuring element. The filtered images were subtracted from the original image and for exudate and microaneurysms detection. The images were further classified according to their severity level of DR. The DR was categorized into five image classes as normal retinal images, mild NDPR images, moderate NDPR images, severe NDPR images and, the PDR. To classify the images according to clinical grading, necessary distinguishable characteristics such as area, the boundary of vessels, and the count of microaneurysms (MAs) were determined. After feature extraction, the images were fed into an artificial neural network (ANN) for classification.
2.2 Machine Learning Techniques Based DR Detection
Carrera et al. [18] constructed a model for early detection of DR established for the digital processing of retina images. The study was projected to classify and grade the non-proliferative DR images. In the first step, the processing was performed to remove the blood vessels, hard exudates, and microaneurysms from the images for feature extraction, that can be utilized by SVM to measure the severity level of DR images. The proposed model consisted of 400 labeled images that are grouped into 4-classes. The results depicted that the proposed architecture acquired 95% sensitivity and predictive proficiency of 94%. The developed model performed well in the classification task of DRNP (diabetic retinopathy non-proliferative) and can be used as a helping tool in clinical applications. As future work, text analysis can be performed to increase the accuracy and the sensitivity of the retinopathy detector. He et al. [19] introduced a new approach that quantified the spatial and spectral features for diabetic lesion segmentation using multispectral images. The proposed approach employed generalized low-rank approximation of the matrix approach along with the supervised regularization method to explore low dimensional spatial and spectral features in all spectral slices. The segmentation accuracy of the proposed approach was 0.981, and it may be given as an assisting tool in diagnosing DR. Another study by Cao et al. [20] presented a microaneurysm detection-based approach by using machine learning knowledge. Automatic detection of MA’s was considered a difficult task due to the small size of MA’s, noise, the low color disparity between lesion and context of the image, color variation, contrast of fundus images. The model was constructed by utilizing the 24 × 24 pixels patches that were extracted from the database of the retinal image, DIARETDB1. The extracted raw pixel intensities were directly fed into three machine learning classifiers: SVM, deep neural network (DNN), and random forest (RF) classifier. For the dimensionality reduction problem, the principal component classifier (PCA) and random forest feature were mainly explored. With traditional machine learning techniques, the proposed approach outperformed with AUC values ranges from 0.96 to 0.98, the F-measure values also ranged from 0.91 to 0.92 by applying the same dataset DIARETDB1. The proposed approach was also validated on another dataset, diabetic retinopathy online challenge dataset. The experimental results exploited that the performance values remained consistent on both datasets. Which demonstrates that the model was generalized to different datasets.
Chetoui et al. [21] constructed a model for the detection of HEM (hemorrhages, exudate, microaneurysms) that was considered as the early signs of DR. Complete, irreversible blindness can be prevented at the earliest stage by detecting HEM. In this study, different textual based techniques were applied for the detection of DR. Textual based techniques measured the association among feature value and the neighboring pixel value. It was less effective to the illumination variations like noise, color, intensity values. For textual feature extraction, the local ternary pattern (LTP) and local energy-based shape histogram (LESH) were mainly explored. The extracted feature set was directly fed into the SVM classifier to learn those feature which distinguished between the normal eye images and DR affected images. SVM (linear classifier) excerpted the feature vector demonstrating the best fringe to classify the dataset into different categories. It was impossible to distinguish the feature vectors; then the kernel tricks were utilized to project feature vector in high dimensional space. In this study, the images belonged to two classes; one from DR affected images and the other one from the NORMAL image. For the identification of HEM, the feature extracted by LTP and LESH was utilized. The proposed approach was evaluated with standard MESSIDOR dataset, LTP, and LESH performed well in the detection process of the DR. Inclusively, the LESH performed well with an accuracy of 0.904% and AUC of 0.931. Whereas, LTP yields 0.841 value of accuracy.
2.3 Deep Learning Based DR Detection
Jena et al. [22] constructed a deep convolutional model for the identification of DR and grading its severity levels. The proposed layer consisted of six convolutional layers, five max-pooling layers, five ReLU layers, SoftMax activation function. The CNN learned and classified the features directly from the dataset and the feature extraction step was no more needed. The proposed system utilized the high-resolution fundus images (HRF) and produced 91.3% accuracy.
Kwasigroch et al. [23] proposed an automated system using a convolutional neural network (CNN) to detect diabetic retinopathy and its severity stage. The model was trained on approximately 88000 labeled retinal photographs, and a quadratic weighted-kappa metric was used to determine the classification efficiency. The proposed system acquired 82% accuracy in detecting the DR, 51% for assessing its current stage and a decent kappa value of 0.776. Results depicted that the effectiveness of the neural network can be used for a complex medical problem. Another contribution by Gelman et al. [24] in transfer learning was to explore a suite of DNN’s for the classification of DR, DME and two key features of age-related macular degeneration (AMD). The band of 16 DNN’s comprised of Alex Net, 4 derivatives of VGG, 4 variants of DenseNet, 5 variants of ResNet were utilized to assess the operation of transfer learning for classification of diabetic retinopathy. The results depicted that the validation accuracy values of fine-tuning were significantly higher than the fixed feature extractor. The validation accuracy of fine-tuning was 0.97 in contrast to 0.85 for fixed feature extractor. The network’s performance was satisfactory, and the mean accuracy was about 95.1% for all systems.
Another study by Rajan et al. [25] proposed a multi-categorical disease detector system by utilizing deep learning techniques. This study comprised of STARE (structured analysis of the retina) database and detected different retina features like lesion, optic disk, and blood vessels. Thus, CNN was utilized for disease classification. The augmentation and normalization of images have been done to enhance the number of images to prevent the overfitting issue. The blood vessels were extracted using the morphological dilation, erosion, adaptive histogram equalization (AHE), and CLAHE. The optic disk removal was done with the aid of the Canny edge detector and thresholding of the images. The exudates appear due to leakage of blood vessels because of hypertension, diabetes, and vein obstruction. So, these yellowish exudates were mainly detected with Gaussian blurring and binary thresholding. The classification stage encompassed two main stages, training and testing stages. The training phase consisted of determining the representative classes and attributes from the training dataset. Further, the dataset was associated with the class to which it bears a resemblance; then the network determined the disease category of the conforming image.
3 Proposed Research Methodology
By fusing the deep learning knowledge with the medical field, this research aims to develop an automated machine intelligence-based diabetic retinopathy detection system. Firstly, the standard dataset is acquired and segregated. In the next phase, the pre-processing of the dataset is carried out to increase the reliability of the results. The processed dataset is further divided into two data bins for training and testing of the model. The novel Inception-v4 model is constructed and configured to implement the transfer learning. The model is trained and tested to obtain the required results. A detailed flow diagram of the suggested scheme has been shown in Fig. 2.
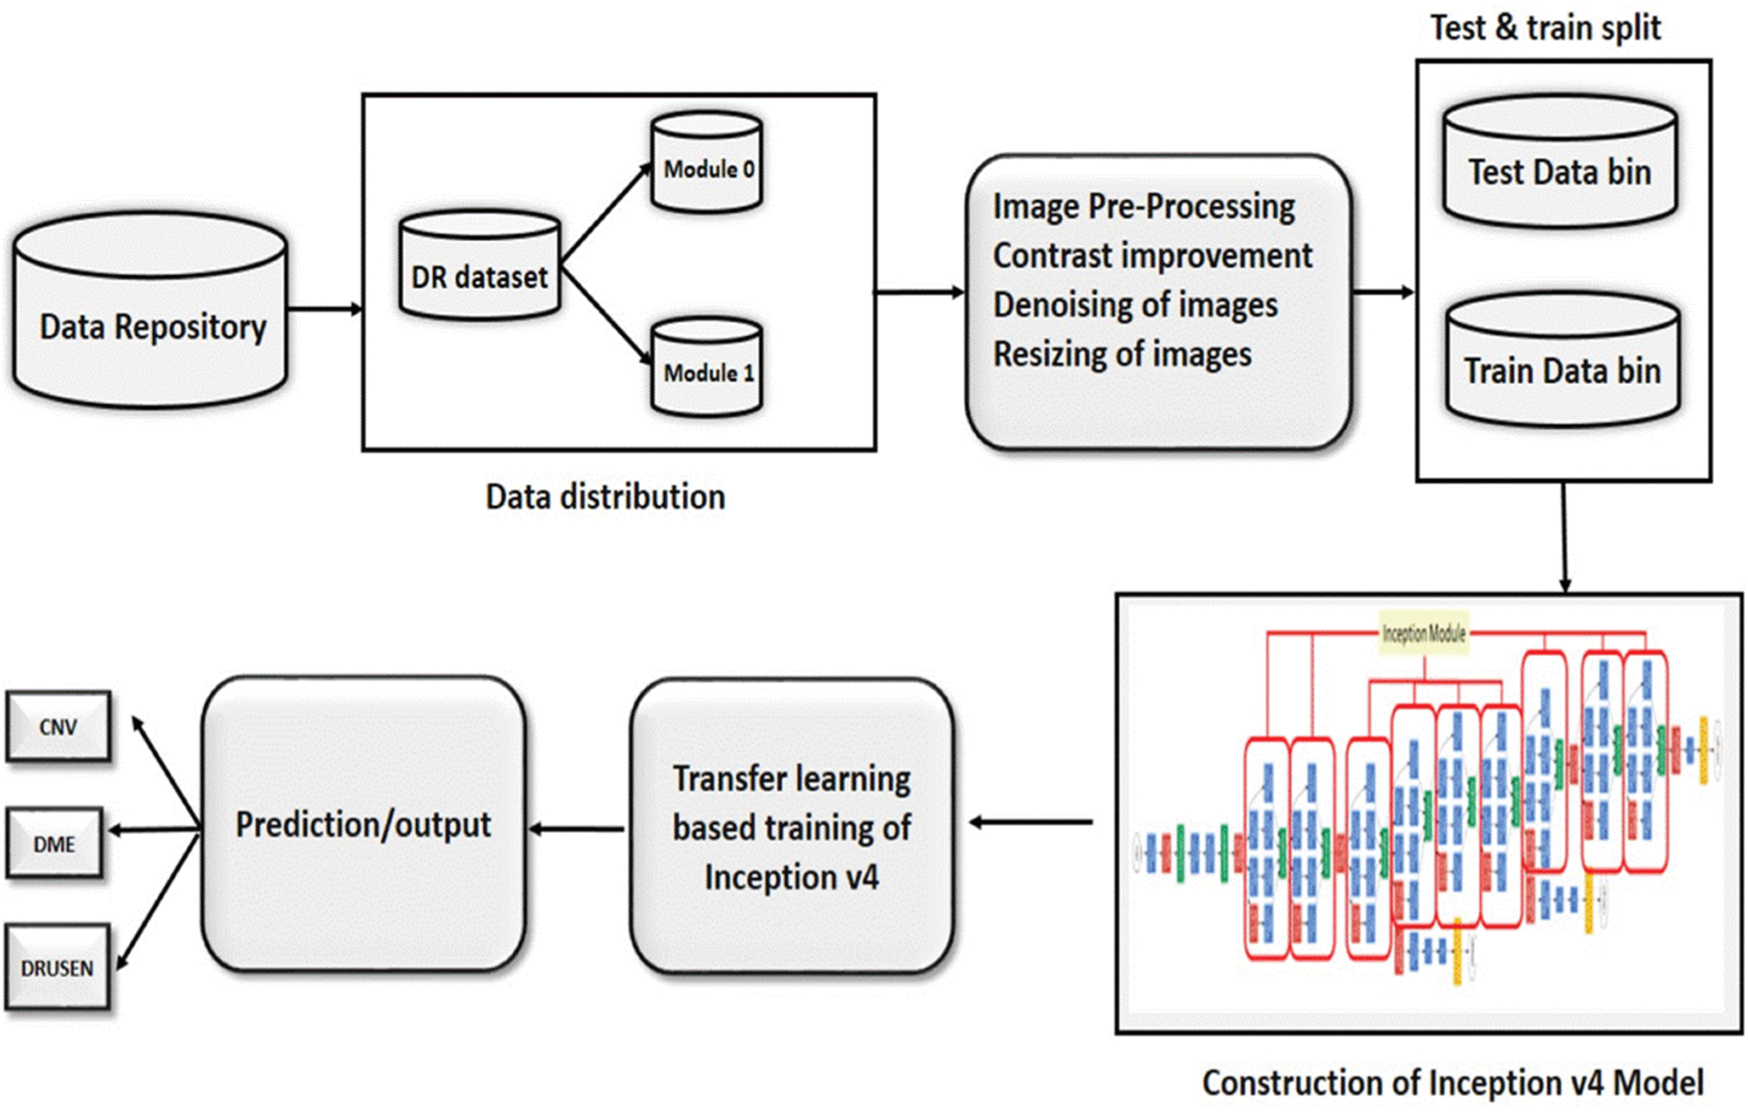
Figure 2: The flow of the proposed methodology
Screening and diagnosis of diabetic retinopathy depend on the detailed examination of the retina by the ophthalmologist or by digital imaging with an appropriate automated system. Due to strict privacy and quality constraints, the benchmark dataset of retinal images is employed for early detection and grading of DR. SD-OCT images was obtained from the Kaggle data repository1. The dataset comprises of 207,130 images, that are segregated into training data (108,312), validation data (1,000 images). The training dataset is further split into 4 distinct classes: class 0 is CNV (37,206 images), class 1 is DME (11,349 images), class 2 is DRUSEN (8,617 images), and class 3 is NORMAL (51,140). The data distribution of the validation dataset is 250 images per class.
SD-OCT dataset is segregated into two modules, module 0: early detection of DR, module 1: Severity grading of DR. AMD and DME has been considered responsible for the presence of DR at an early stage. Accordingly, data distribution in module 0 is such as; class 0: NORMAL images, class 1: diseased images. Module1 is responsible to grade the severity stage of the disease. It contains three classes such as; class 0: CNV images, class 1: DME images, class 2: DRUSEN images.
For the training of the DNN, the input images were pre-processed according to the model’s requirement. The pre-processing is comprised of three steps.
• Contrast enhancement
• Denoising the images
• Image resizing
It is an image enhancement process for better visualization. CLAHE [26] is a digital image processing technique in which the image visibility is improved by enhancing the contrast of local regions of images. The OCT images were highly saturated as can be seen in the following Fig. 3(a). CLAHE works on small patches of the image called tiles. The contrast improved tiles are combined using the bilinear interpolation to reduce the effect of artificial boundaries.
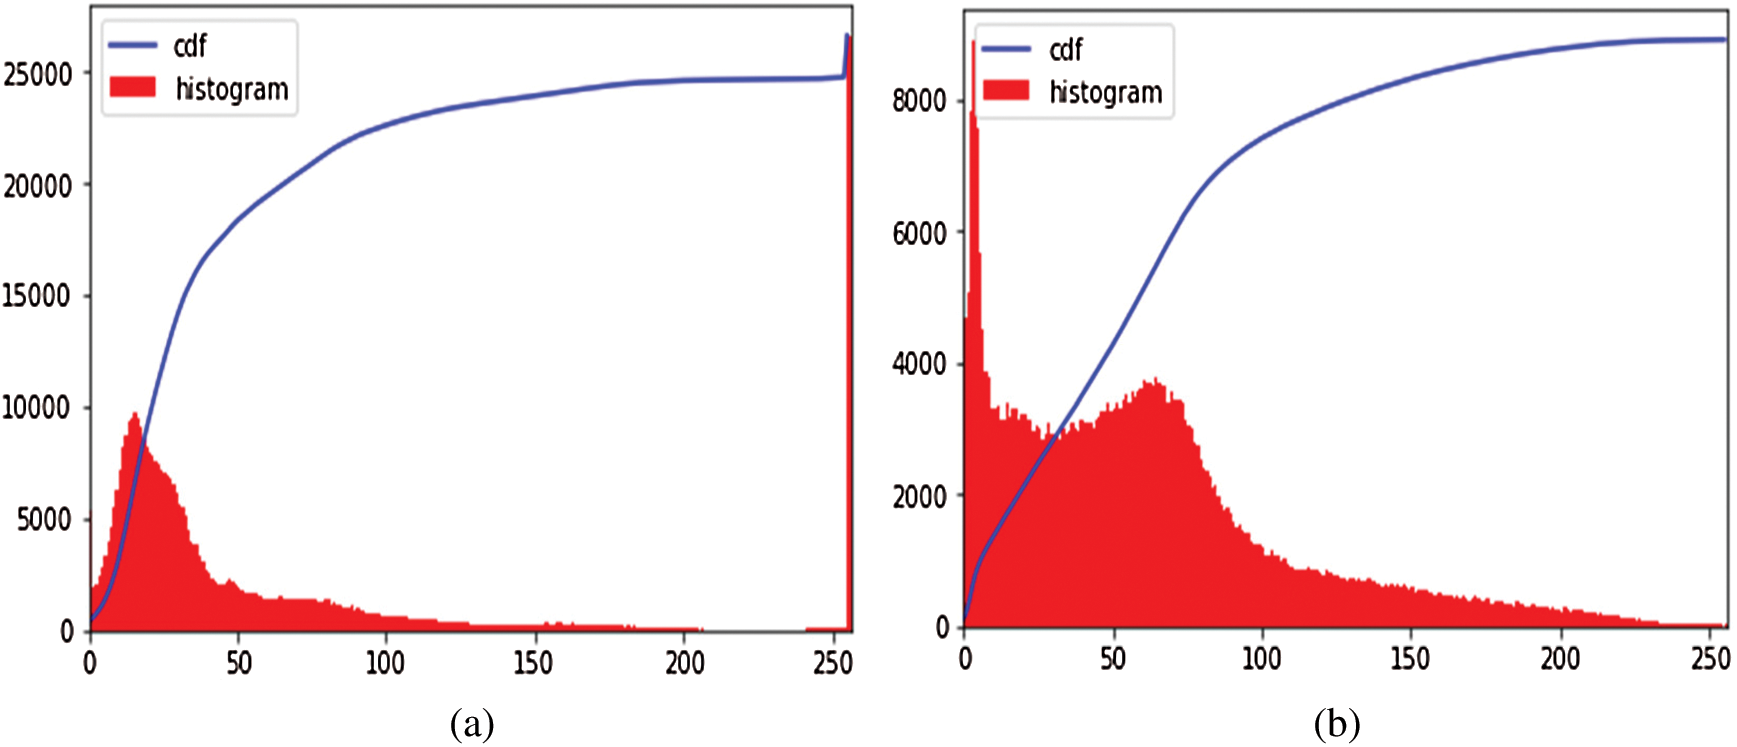
Figure 3: Image preprocessing step: (a) Histogram of the original image; (b) Effect of applying CLAHE
After normalization of saturated images, the denoising was performed on the highly noisy OCT images. To retain the salient features of the image, the bilateral filter [27] has been employed. It is a non-iterative, non-linear, and local algorithm that works at both the range and domain of the image. It can distinguish the resemblance of gray levels, and the geometric intimacy of the neighboring pixels. The effect of image denoising is shown in Fig. 4.
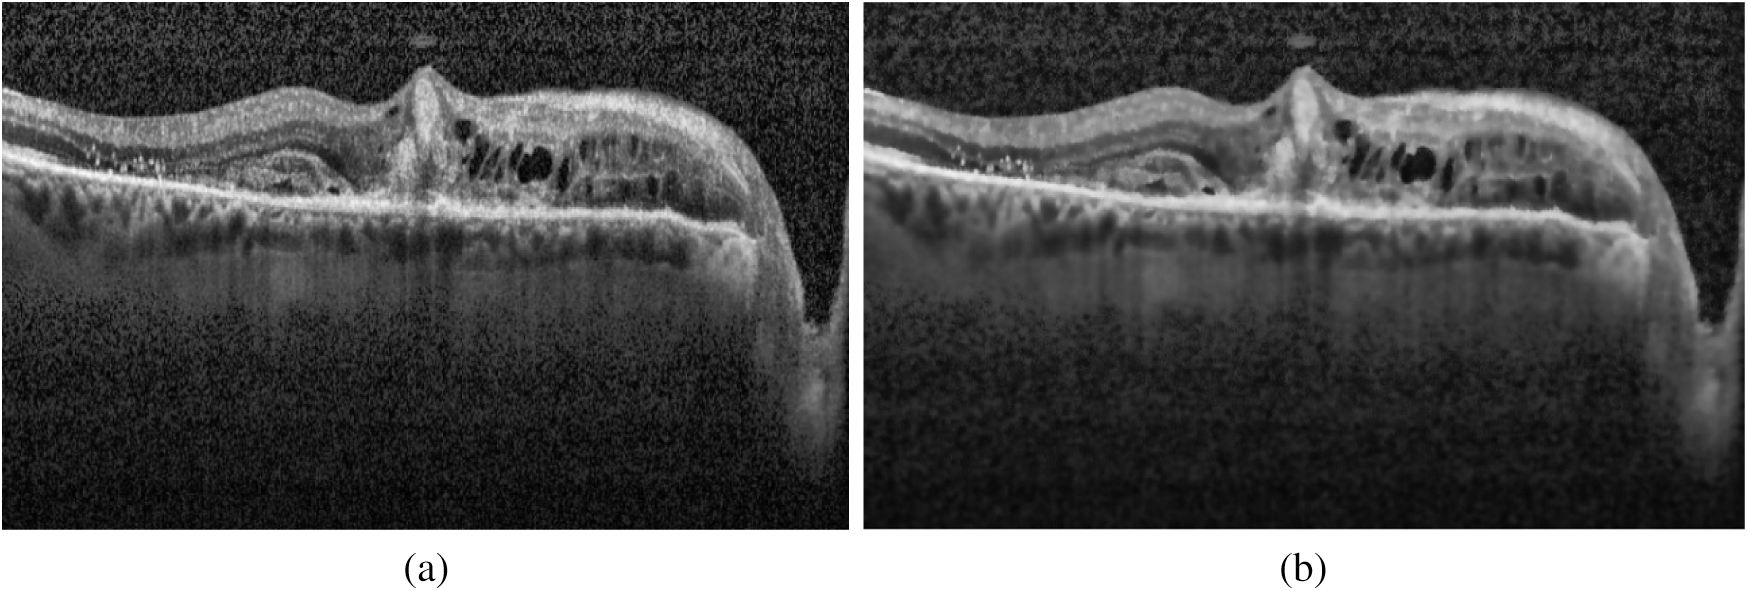
Figure 4: Effect of applying the bilateral filter for removing noise: (a) Original image; (b) Denoised image
The OCT images were required resizing to the expected input size for the DNN. The images were resized to have the dimensions 299 × 299. Inception-v4 accepts only this image dimension.
3.4 Deep Transfer Learning Method Based on Inception-v4
This section discusses the Inception-v4 model and configuration detail of applying transfer learning on Inception-v4.
Inception-v4 neural model has experimented for the development of the proposed automated system. This neural model has been evolved from GoogLeNet and Inception-v1 [28]. The Inception-v4 has more inception modules that make it a uniform simplified architecture. Thus, the Inception-v4 model has been opted for the detection of diabetic retinopathy due to its outstanding performance in ILSVRC 2017, reducing error as low as 3.08% with three residual networks [29]. The model has also achieved better accuracy than inception-v3 and GoogLeNet.
3.4.2 Applying Deep Transfer Learning on Inception-v4
By employing a relatively small dataset of OCT images, the Inception-v4 model has opted for performing the classification task. Firstly, the Inception-v4 was pre-trained on the ImageNet dataset, further fine-tuned on the limited specific dataset of DR. Two deep transfer learning strategies were applied on the selected model, one as fixed feature extractor configuration and other as fine-tuning configuration In fine-tuning, instead of random initialization, the convolutional layers were initialized with the pre-trained weights. The last layers were randomly initialized to increase the generalization of the model shifting from ImageNet images to OCT images. In the fixed feature extractor configuration, all layers were frozen except the last FC layer, which is modified according to classification problem and dataset.
4 Experimental Setup and Dataset
The proposed system has been developed using python 3.7, PyTorch version 1.3 on core i7 windows environment. In fine-tunning configuration, SGD (stochastic gradient descent) optimizer is used along with learning rate 0.001, momentum 0.9, and weighting decay of 10-6. In the fixed feature extractor configuration, the RMSprop optimizer is used with the cross-entropy loss function. Binary cross-entropy and categorical cross-entropy are employed for module 0, module 1, respectively. The classification of diabetic retinopathy can be measured with statistical measures. For measuring the performance of the proposed diagnostic system, the accuracy, specificity, sensitivity, F1-score, Cohen’s kappa score, and AUROC were determined. The equations used for measuring the accuracy, specificity, and sensitivity are stated below.
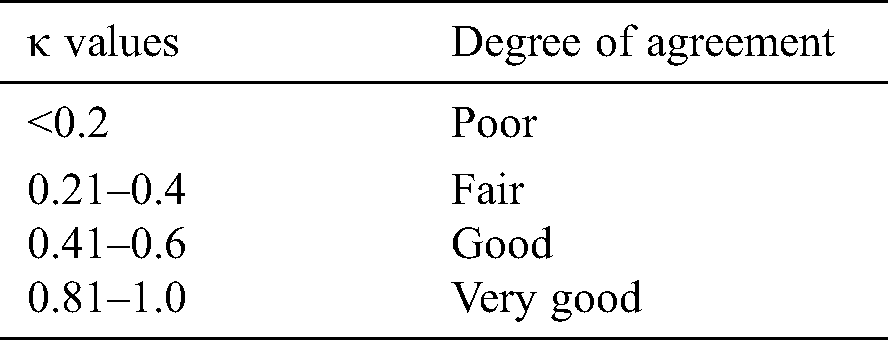
Cohen’s kappa coefficient (κ) is a statistical tool that estimates the inter-rater agreement for categorical items. Kappa is considered a more robust measure of inter-rater agreement than the simple average method. A generally agreed scale is shown in Tab. 1.
Table 1: Kappa categories of agreement
The performance efficiency of Inception-v4 model was evaluated on OCT images. In fine-tune ConvNet configuration, the model has achieved 96.6% and 97.7% accuracy on module 0 and module 1, respectively. As can be seen in Figs. 5–6, the model training graphs are plotted that depicts the training and validation accuracy and loss values. In Fig. 5a, it is visible that the trend of accuracy is rising while In Fig. 5b shows the model loss or error and the trend is generally downward. Similarly, In Fig. 5c shows rising trend of accuracy for module 1 while the In Fig. 5d shows the training loss of module 1 which is similar to In Fig. 5b. Moreover, Fig. 6 is even more interesting. Here we can see for module 0, accuracy trend is increasing as we increase the number of epochs. The higher the number of epochs, the more learning is there. So, for 24 epochs, we have 83% accuracy and after 48 epochs the accuracy reaches 98%. The similar trend is also observed in module 1 as well.
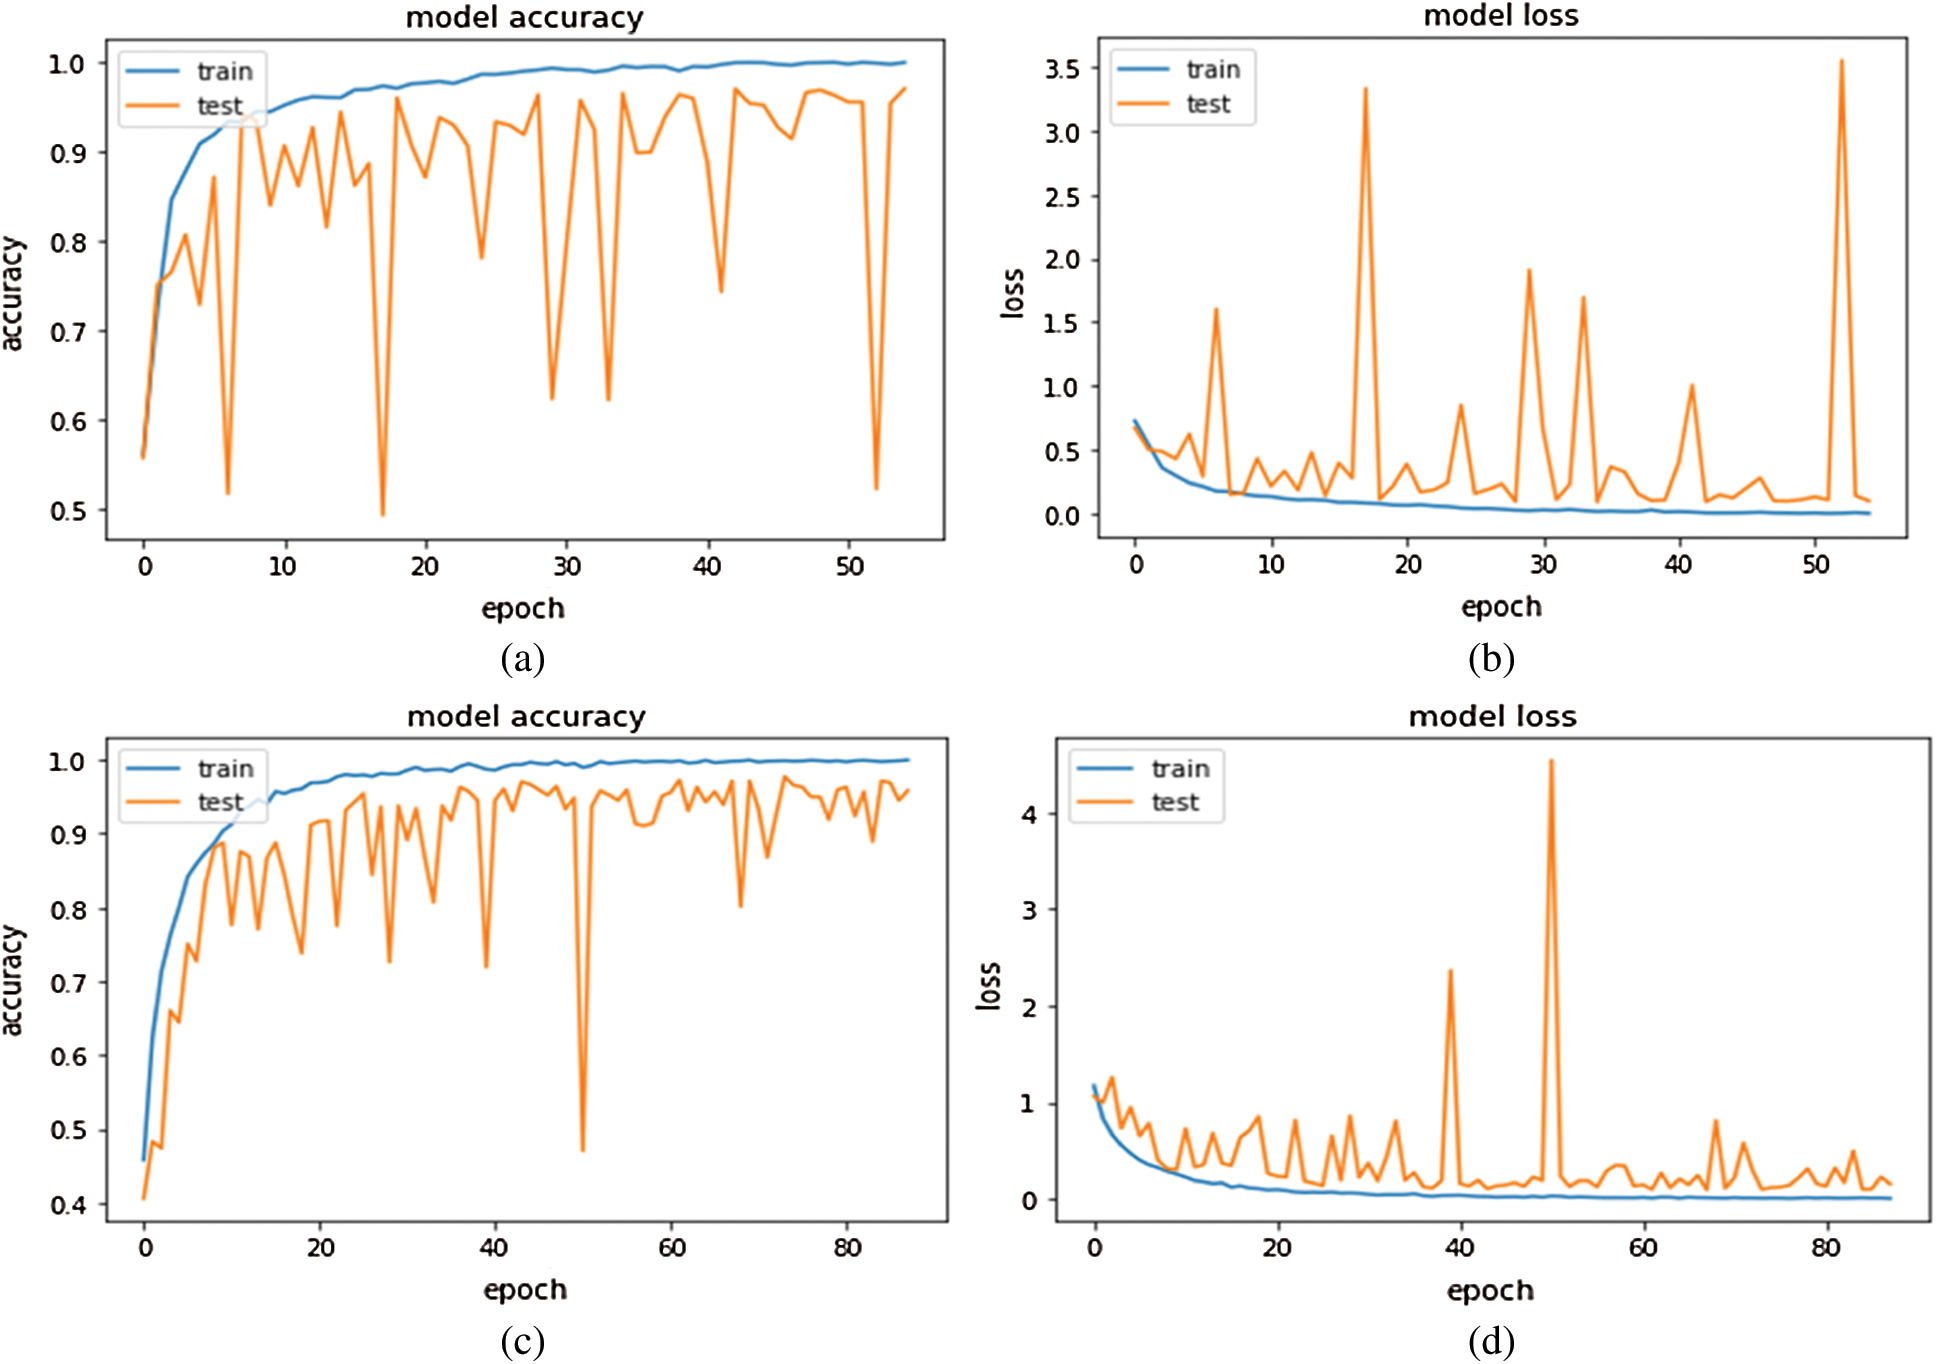
Figure 5: Inception-v4 fine-tune ConvNet configuration training graphs: (A) training accuracy graph Module 0; (B) training loss graph on Module 0; (C) training accuracy graph on Module 1; (D) training loss graph on Module 1
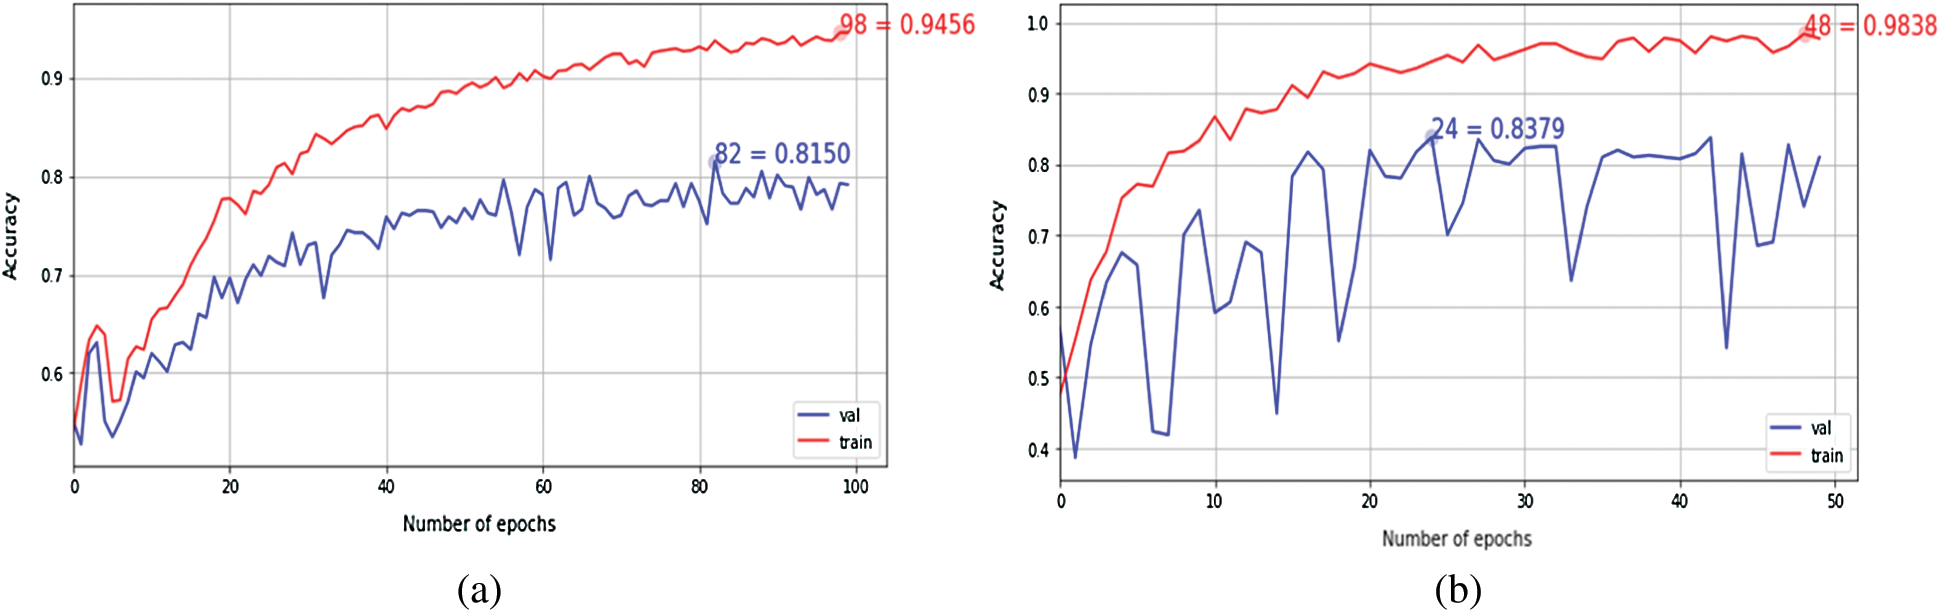
Figure 6: The Keras learning curves of fixed feature extractor: (a) Module 0; (b) Module 1
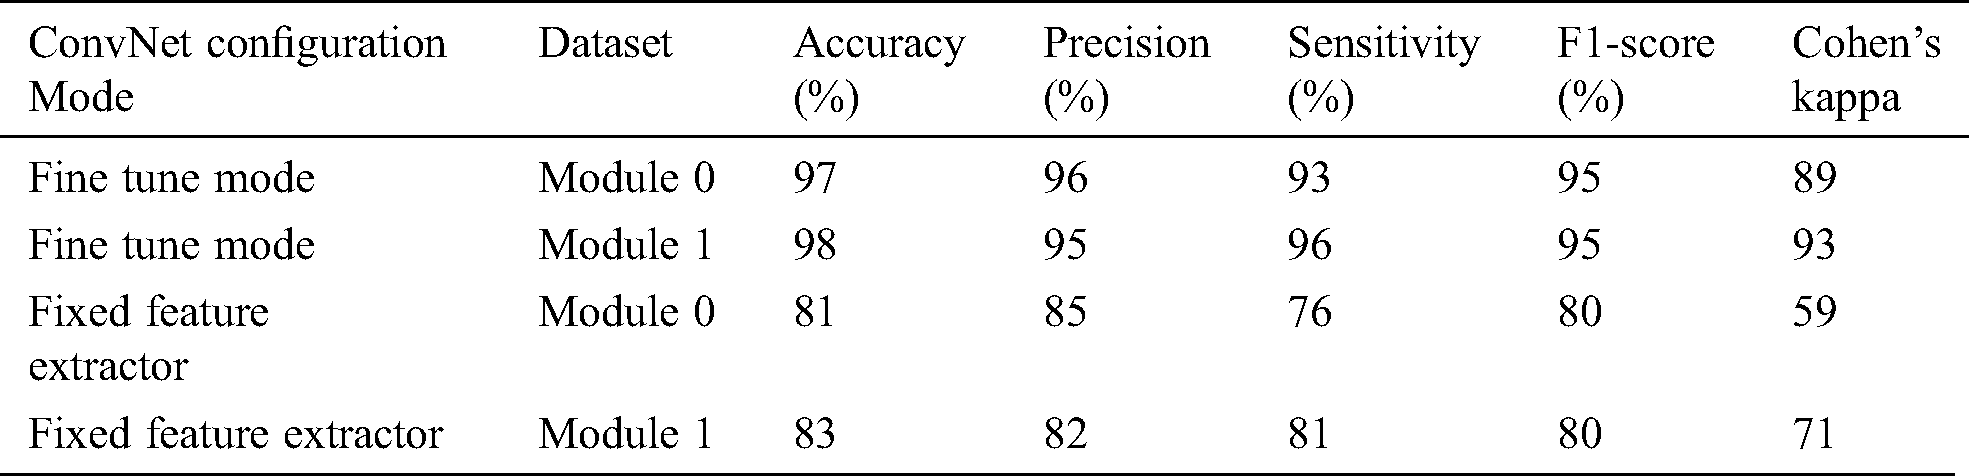
The fixed feature extractor configuration also experimented on the same OCT images, the model has achieved 81% and 83% accuracy on module 0 and module 1, respectively. Cohen’s kappa value was also measured for both transfer learning-based configurations. Tab. 2 summarizes the results obtained by the proposed system.
Table 2: Summary of Inception-v4 performance metrics
To measure the distinguishable property of classes, AUROC was measured for each configuration. In fine-tune configuration, the model has achieved 0.99 AUC value on module 0, and 1.00 value on module 1 as shown in Fig. 7. The fixed feature extractor configuration has achieved 0.83,0.84 AUC values of binary classes in module 1. It has also achieved 0.90, 0.82, and 0.87 AUC values on CNV, DME, and DRUSEN class of module 1. In ROC, the dotted bottom line at 0.5 shows random classifier while value 1 shows the perfect classifier. The higher the curves, the better the classifier is. So, the results in Fig. 7 show that for module 1, the ROC curves cover an area as high as 99% which shows the optimal results for our proposed approaches.
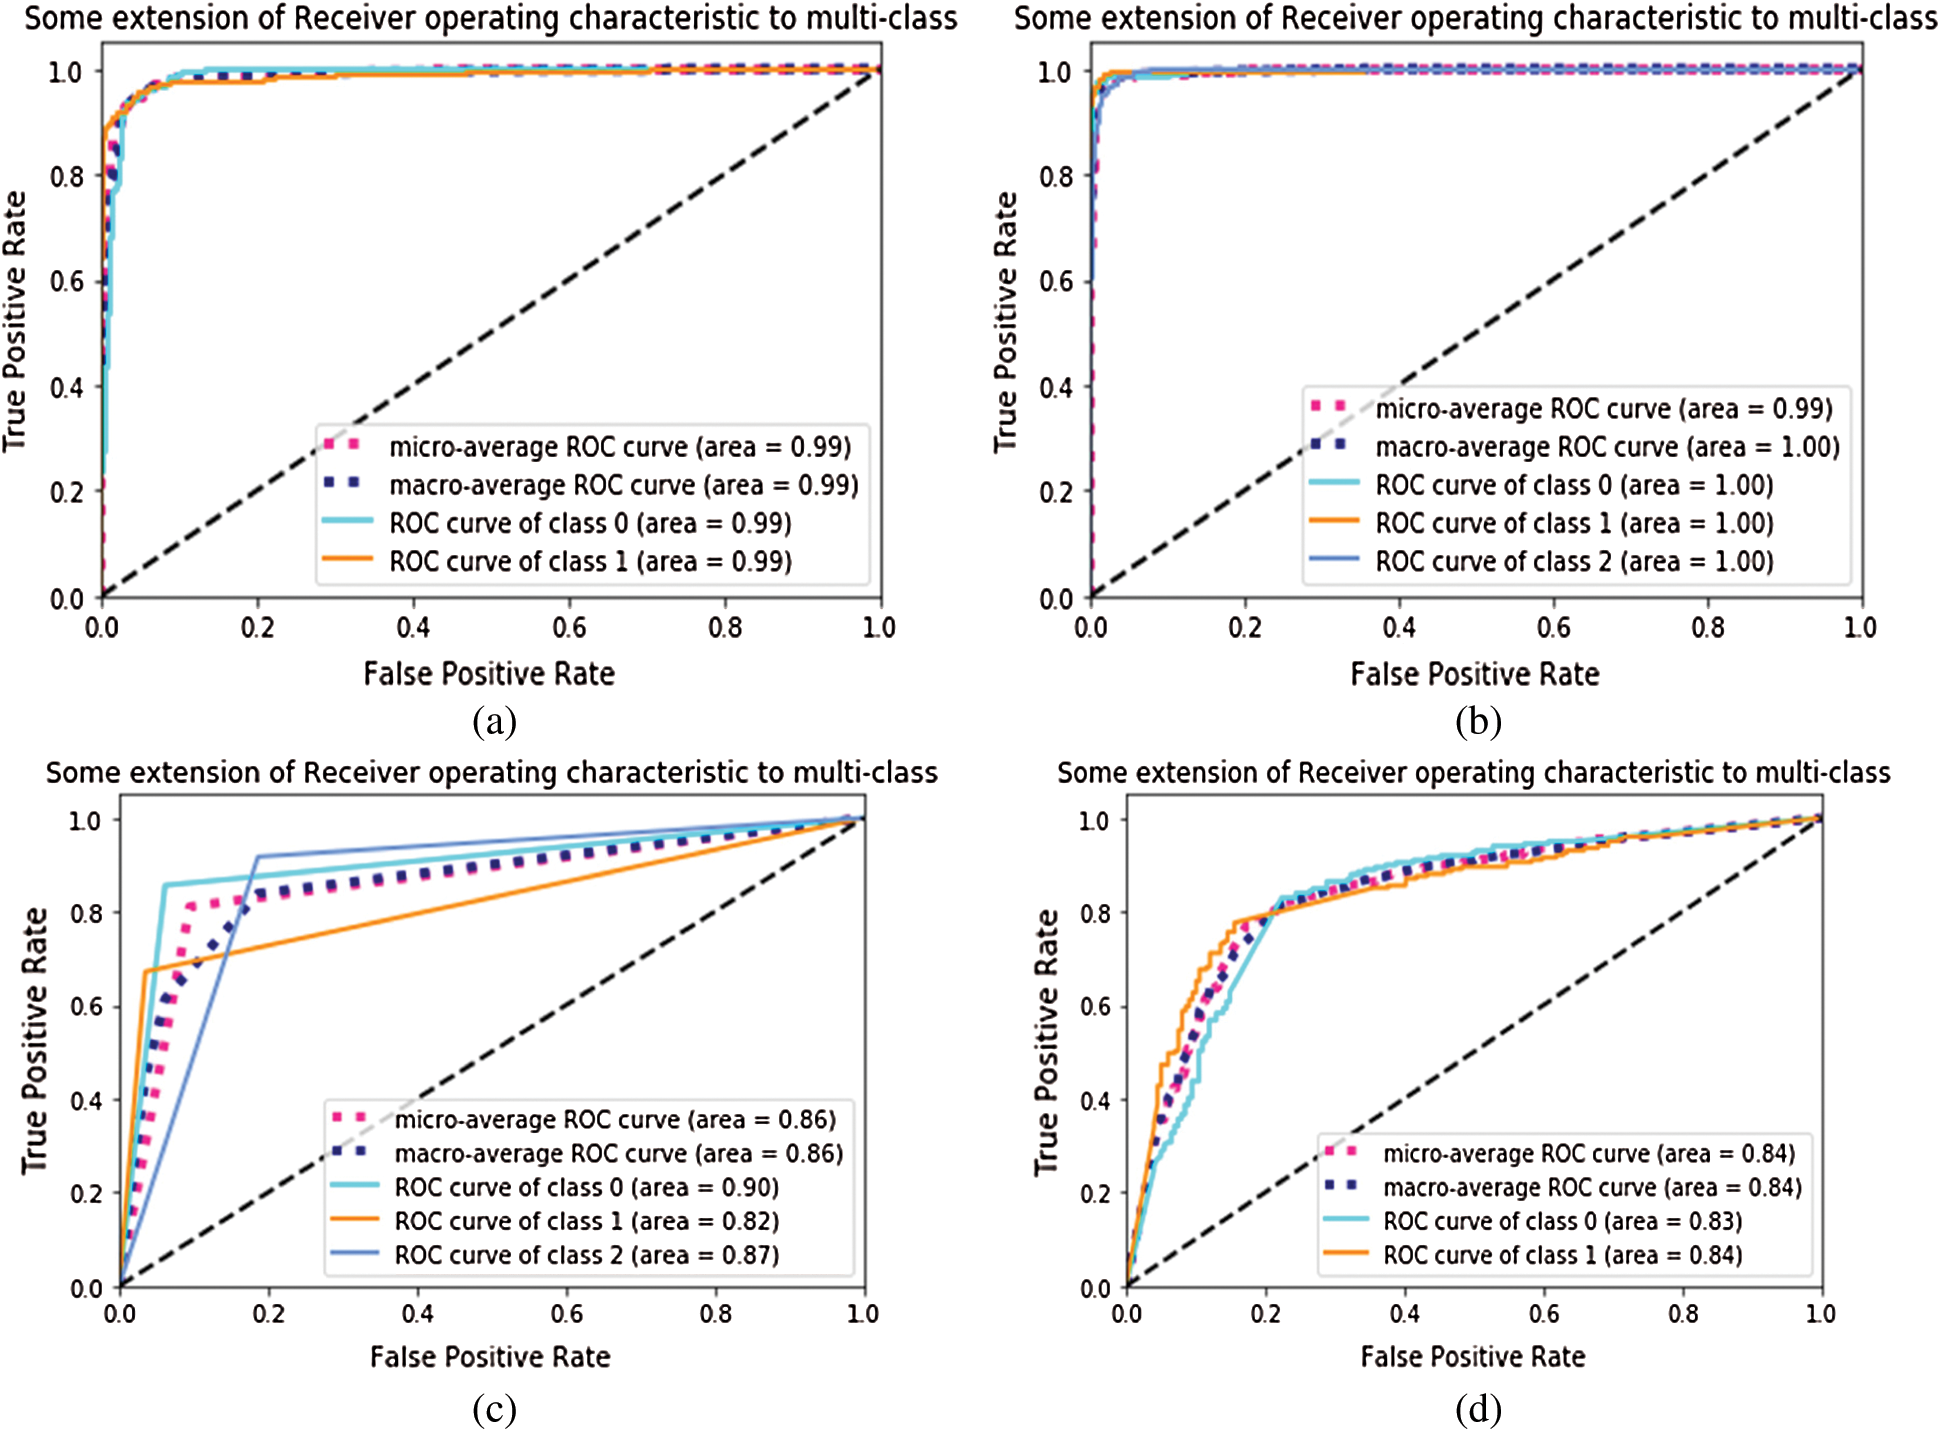
Figure 7: AUROC of Inception-v4: (a) fine-tune ConvNet experimented on Module 0; (b) fine-tune ConvNet experimented on Module 1; (c) fixed feature extractor ConvNet experimented on Module 1; (d) fixed feature extractor ConvNet experimented on Module 0
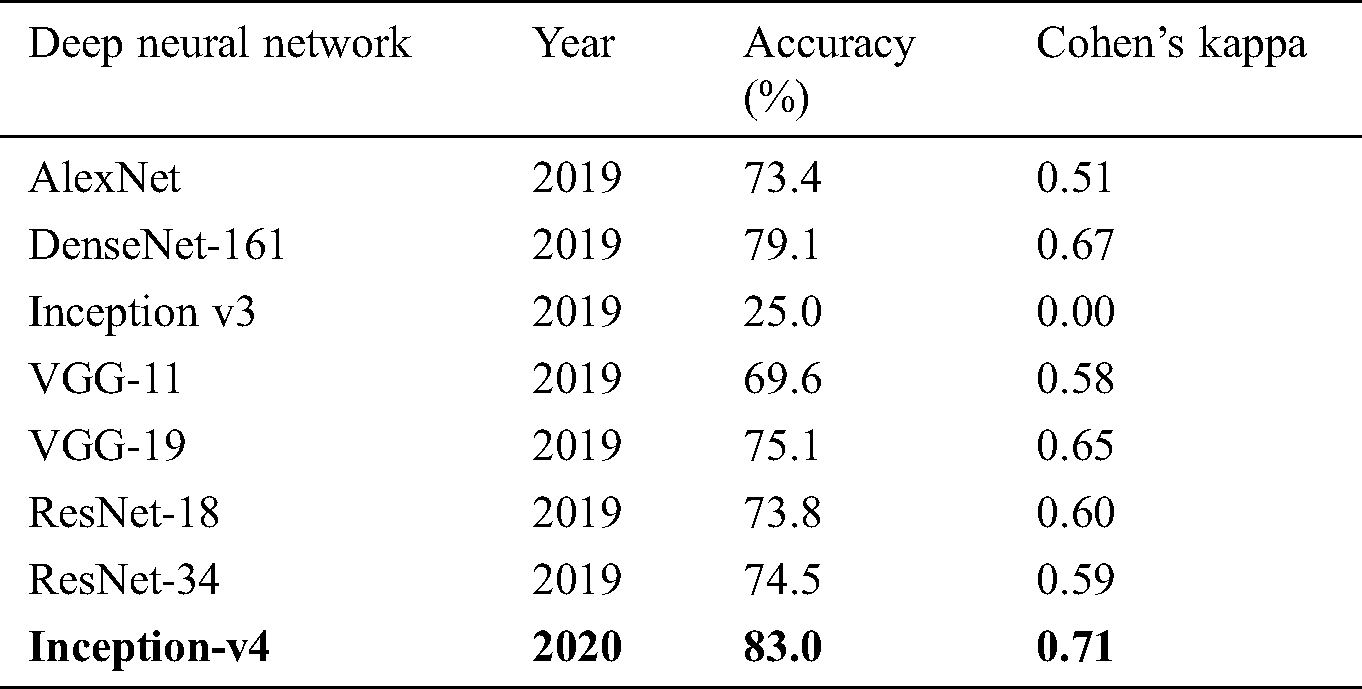
The confusion matrices were also plotted to visualize the true positive and false negative as can be seen in Fig. 8. The results depict that the proposed model holds good distinguishing property between classes and inter-rater agreement for the categorical property. By comparing the proposed system performance with prior work in this domain, it can be concluded that the proposed system got better accuracy values than the other system. A brief comparison with other research studies is listed in Tabs. 3–4.
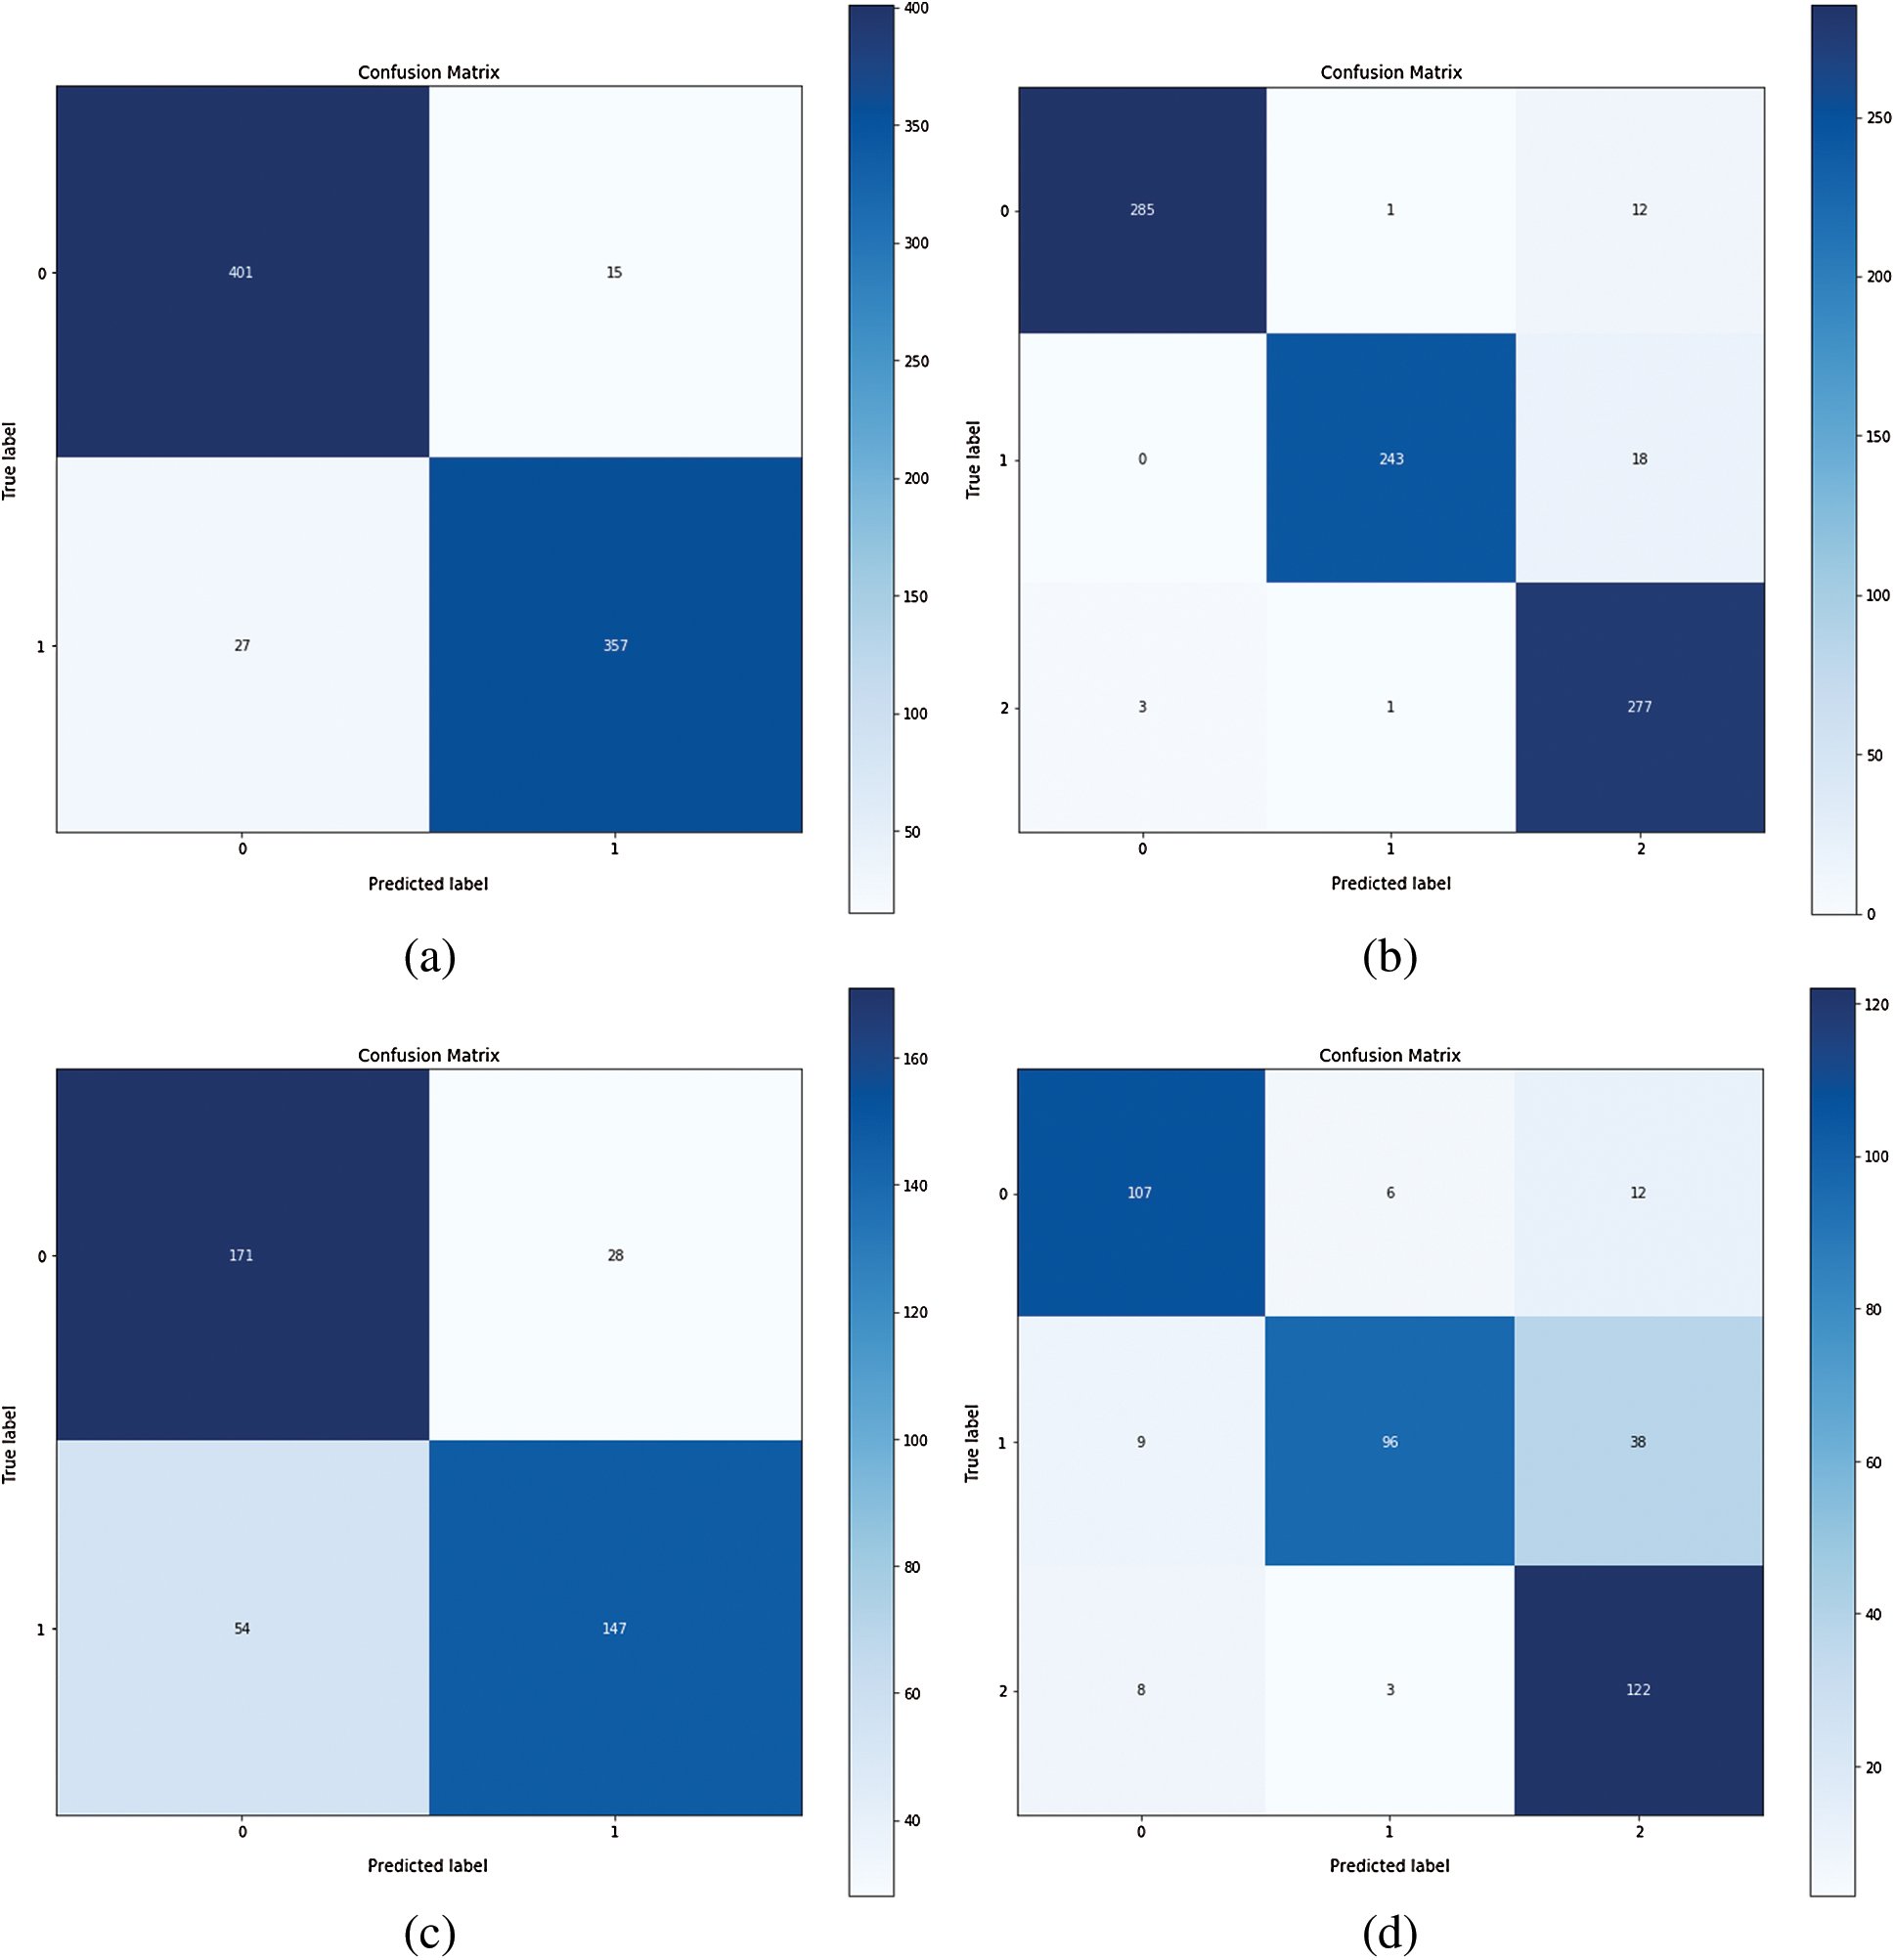
Figure 8: Confusion matrix of Inception-v4: (a) fine-tune ConvNet experimented on Module 0; (b) fine-tune ConvNet experimented on Module 1; (c) fixed feature extractor ConvNet experimented on Module 0; (d) fixed feature extractor ConvNet experimented on Module 1
Table 3: Comparison of proposed work of fine-tuning the ConvNet with prior work
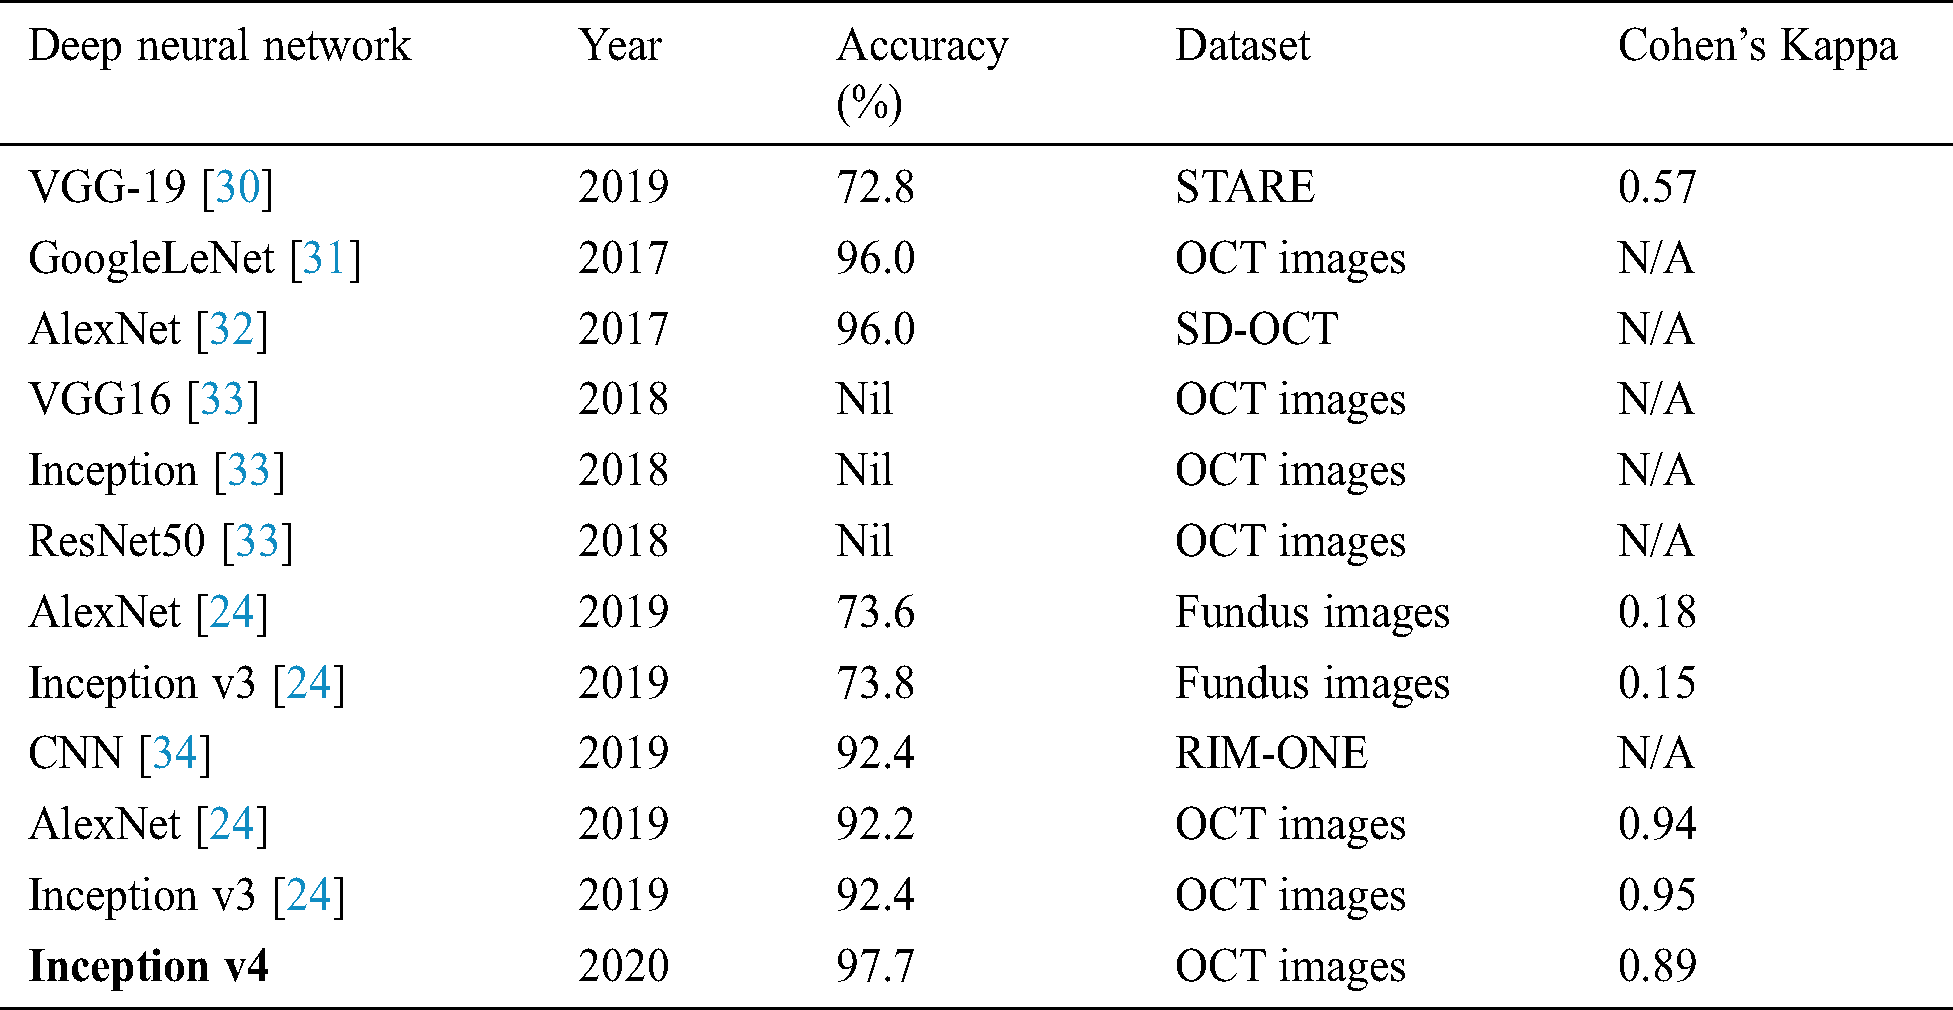
Table 4: Comparison of fixed feature extractor configuration experimented on OCT images with the prior study
The experiment results concluded that fine-tune configuration mode has achieved higher training and validation accuracy values than the feature extractor mode configuration. Specifically, the validation accuracy was much higher in fine-tune ConvNet (97.7%, 96.6%) compared with the feature extractor ConvNet (83.0%, 81.0%). Similarly, the weighted kappa values were also higher for fine-tune mode (0.93, 0.89) compared to fixed extractor mode (0.59, 0.71). The diabetic retinopathy classification task was highly critical due to noisy, saturated, and limited data. Despite all these issues, the proposed model has achieved superior performance than prior studies. It can be concluded that the proposed system can assist the ophthalmologist in making accurate diagnostic decisions.
To increase the reliability, the potential future studies can focus to develop more sophisticated denoising models for efficient removal of the noise from the OCT images. To obtain better generalizability, researchers are encouraged to replicate the research technique to other available benchmark datasets and compare the performance.
Funding Statement: This work was supported by the National Research Foundation (NRF) of Korea under the auspices of the Ministry of Science and ICT, Republic of Korea (Grant No. NRF-2020R1G1A1012741) received by M.R. Bhutta. https://nrf.kird.re.kr/main.do.
Conflicts of Interest: The authors declare that they have no conflicts of interest to report regarding the present study.
1. H. H. Vo and A. Verma. (2016). “New deep neural nets for fine-grained diabetic retinopathy recognition on hybrid color space,” in Int. Sym. on Multimedia. IEEE Conf., San Jose, CA, USA, pp. 209–215. [Google Scholar]
2. G. Roglic and World Health Organization. (2016). Global Report on Diabetes. Geneva, Switzerland: World Health Organization. [Google Scholar]
3. S. Wild, G. Roglic, A. Green, R. Sicree and H. King. (2004). “Global prevalence of diabetes: Estimates for the year 2000 and projections for 2030,” Diabetes Care, vol. 27, no. 5, pp. 1047–1053. [Google Scholar]
4. D. S. W. Ting, G. C. M. Cheung and T. Y. Wong, “Diabetic retinopathy: Global prevalence, major risk factors, screening practices and public health challenges: A review: Global burden of diabetic eye diseases,” Clinical & Experimental Ophthalmology, vol. 44, no. 4, pp. 260–277, 2016. [Google Scholar]
5. D. S. Dhoot, K. Baker, N. Saroj, R. Vitti, A. J. Berliner et al. (2018). , “Baseline factors affecting changes in diabetic retinopathy severity scale score after intravitreal aflibercept or laser for diabetic macular edema,” Ophthalmology, vol. 125, no. 1, pp. 51–56. [Google Scholar]
6. S. Mohammadian, A. Karsaz and Y. M. Roshan. (2017). “Comparative study of fine-tuning of pre-trained convolutional neural networks for diabetic retinopathy screening,” in 24th National and 2nd Int. Iranian Conf. on Biomedical Engineering, Tehran, pp. 1–6. [Google Scholar]
7. B. Wu, W. Zhu, F. Shi, S. Zhu and X. Chen. (2017). “Automatic detection of microaneurysms in retinal fundus images,” Computerized Medical Imaging and Graphics, vol. 55, pp. 106–112. [Google Scholar]
8. S. Honnungar, S. Mehra and S. Joseph, “Diabetic retinopathy identification and severity classification,” Stanford University, 2016. [Google Scholar]
9. P. Yadav and N. P. Singh. (2019). “Classification of normal and abnormal retinal images by using feature-based machine learning approach, ” in Recent Trends in Communication, Computing, and Electronics. Singapore: Springer Singapore, pp. 387–396. [Google Scholar]
10. D. K. Prasad, L. Vibha and K. R. Venugopal. (2015). “Early detection of diabetic retinopathy from digital retinal fundus images,” in IEEE Conf. on Recent Advances in Intelligent Computational Systems, Trivandrum, pp. 240–245. [Google Scholar]
11. M. R. Bhutta, M. J. Hong, Y. H. Kim and K. S. Hong. (2015). “Single-trial lie detection using a combined fNIRS-polygraph system,” Frontiers in Psychology, vol. 6, pp. 709. [Google Scholar]
12. K.-S. Hong, M. R. Bhutta, X. Liu and Y. I. Shin. (2017). “Classification of somatosensory cortex activities using fNIRS,” Behavioural Brain Research, vol. 333, pp. 225–234. [Google Scholar]
13. G. Mahendran, R. Dhanasekaran and K. N. Narmadha Devi. (2014). “Morphological process based segmentation for the detection of exudates from the retinal images of diabetic patients,” in IEEE Int. Conf. on Advanced Communications, Control and Computing Technologies, Ramanathapuram, India, pp. 1466–1470. [Google Scholar]
14. H. F. Jaafar, A. K. Nandi and W. Al-Nuaimy. (2011). “Detection of exudates from digital fundus images using a region-based segmentation technique,” in Signal Processing Conf. 19th European Conf., EUSIPCO 2011, Barcelona, pp. 1020–1024. [Google Scholar]
15. S. Kaur and K. S. Mann. (2019). “Optimized technique for detection of diabetic retinopathy using segmented retinal blood vessels,” in Int. Conf. on Automation, Computational and Technology Management, London, UK, pp. 79–83.
16. N. Nur and H. Tjandrasa. (2018). “Exudate segmentation in retinal images of diabetic retinopathy using saliency method based on region,” Journal of Physics: Conference Series, vol. 1108, 012110.
17. M. P. Paing, S. Choomchuay and M. D. Rapeeporn Yodprom. (2016). “Detection of lesions and classification of diabetic retinopathy using fundus images,” in Biomedical Engineering. 9th Int. Conf., BMEiCON 2016, Laung Prabang, Laos, pp. 1–5. [Google Scholar]
18. E. V. Carrera, A. Gonzalez and R. Carrera. (2017). “Automated detection of diabetic retinopathy using SVM,” in 24th Int. Conf. on Electronics, Electrical Engineering and Computing, Cusco, Peru, pp. 1–4. [Google Scholar]
19. Y. He, W. Jiao, Y. Shi, B. Zhao, W. Zou et al. (2019). , “Segmenting diabetic retinopathy lesions in multispectral images using low-dimensional spatial-spectral matrix representation,” IEEE Journal of Biomedical and Health Informatics, vol. 24, no. 4, pp. 1. [Google Scholar]
20. W. Cao, N. Czarnek, J. Shan and L. Li. (2018). “Microaneurysm detection using principal component analysis and machine learning methods,” IEEE Transactions on Nanobioscience, vol. 17, no. 3, pp. 191–198. [Google Scholar]
21. M. Chetoui, M. A. Akhloufi and M. Kardouchi. (2018). “Diabetic retinopathy detection using machine learning and texture features,” in IEEE Canadian Conf. on Electrical & Computer Engineering, Quebec City, QC, pp. 1–4. [Google Scholar]
22. M. Jena, S. P. Mishra and D. Mishra. (2018). “Detection of diabetic retinopathy images using a fully convolutional neural network,” in 2nd Int. Conf. Data Science and Business Analytics, Changsha, pp. 523–527. [Google Scholar]
23. A. Kwasigroch, B. Jarzembinski and M. Grochowski. (2018). “Deep CNN based decision support system for detection and assessing the stage of diabetic retinopathy,” in IEEE Conf. on Interdisciplinary PhD Workshop, Swinoujście, pp. 111–116. [Google Scholar]
24. R. Gelman. (2019). “Evaluation of transfer learning for classification of: (1) Diabetic retinopathy by digital fundus photography and (2) Diabetic macular edema, choroidal neovascularization and drusen by optical coherence tomography,” M.S. thesis, Department of Mathematics, New York University, New York City, New York. [Google Scholar]
25. K. Rajan and C. Sreejith. (2018). “Retinal image processing and classification using convolutional neural networks, ” in Int. Conf. Computational Vision and Bio-Engineering, Palladam, vol. 30, Springer, pp. 1271–1280. [Google Scholar]
26. G. Yadav, S. Maheshwari and A. Agarwal. (2014). “Contrast limited adaptive histogram equalization based enhancement for real time video system,” in Int. Conf. on Advances in Computing, Communications and Informatics, Delhi, India, pp. 2392–2397. [Google Scholar]
27. B. K. Shreyamsha Kumar. (2013). “Image denoising based on gaussian/bilateral filter and its method noise thresholding,” Signal, Image and Video Processing, vol. 7, no. 6, pp. 1159–1172. [Google Scholar]
28. C. Szegedy, W. Liu, Y. Jia, P. Sermanet, S. Reed et al. (2015). , “Going deeper with convolutions,” in IEEE Conf. on Computer Vision and Pattern Recognition, Bostan, pp. 1–9. [Google Scholar]
29. C. Szegedy, S. Ioffe, V. Vanhoucke and A. A. Alemi. (2017). “Inception-v4, Inception-ResNet and the impact of residual connections on learning,” in 31th IAAA Conf. on Artificial Intelligence, CA, USA, pp. 7. [Google Scholar]
30. J. Y. Choi, T. K. Yoo, J. G. Seo, J. Kwak, T. T. Um et al. (2017). , “Multi-categorical deep learning neural network to classify retinal images: A pilot study employing small database,” PLoS One, vol. 12, no. 11, e0187336.
31. S. P. K. Karri, D. Chakraborty and J. Chatterjee. (2017). “Transfer learning based classification of optical coherence tomography images with diabetic macular edema and dry age-related macular degeneration,” Biomeical Optical Express, vol. 8, no. 2, pp. 579.
32. G. C. Y. Chan, A. Muhammad, S. A. A. Shah, T. B. Tang, C. K. Lu. (2017). et al., “Transfer learning for diabetic macular edema (DME) detection on optical coherence tomography (OCT) images,” in IEEE Int. Conf. on Signal and Image Processing Applications, Kuching, pp. 493–496.
33. M. Christopher, A. Belghlith, C. Bowd, J. A. Proudfoot, M. H. Goldbaum et al. (2018). , “Performance of deep learning architectures and transfer learning for detecting glaucomatous optic neuropathy in fundus photographs,” Scientific Reports, vol. 8, no. 1, pp. 262.
34. M. Al Ghamdi, M. Li, M. Abdel-Mottaleb and M. A. Shousha. (2019). “Semi-supervised transfer learning for convolutional neural networks for glaucoma detection,” in IEEE Int. Conf. on Acoustics, Speech and Signal Processing, Brighton, UK, pp. 3812–3816.
 | This work is licensed under a Creative Commons Attribution 4.0 International License, which permits unrestricted use, distribution, and reproduction in any medium, provided the original work is properly cited. |