DOI:10.32604/cmc.2020.013215
| Computers, Materials & Continua DOI:10.32604/cmc.2020.013215 | |
| Article |
Fuzzy Based Decision Making Approach for Evaluating the Severity of COVID-19 Pandemic in Cities of Kingdom of Saudi Arabia
1Department of Computer Engineering, College of Computer and Information Systems, Umm Al-Qura University, Makkah, Saudi Arabia
2Department of Computer Science, College of Computer and Information Systems, Umm Al-Qura University, Makkah, Saudi Arabia
*Corresponding Author: Abdullah Baz. Email: aobaz01@uqu.edu.sa
Received: 30 July 2020; Accepted: 15 August 2020
Abstract: The World Health Organization declared COVID-19 a pandemic on March 11, 2020 stating that it is a worldwide danger and requires imminent preventive strategies to minimise the loss of lives. COVID-19 has now affected millions across 211 countries in the world and the numbers continue to rise. The information discharged by the WHO till June 15, 2020 reports 8,063,990 cases of COVID-19. As the world thinks about the lethal malady for which there is yet no immunization or a predefined course of drug, the nations are relentlessly working at the most ideal preventive systems to contain the infection. The Kingdom of Saudi Arabia (KSA) is additionally combating with the COVID-19 danger as the cases announced till June 15, 2020 reached the count of 132,048 with 1,011 deaths. According to the report released by the KSA on June 14, 2020, more than 4,000 cases of COVID-19 pandemic had been registered in the country. Tending to the impending requirement for successful preventive instruments to stem the fatalities caused by the disease, our examination expects to assess the severity of COVID-19 pandemic in cities of KSA. In addition, computational model for evaluating the severity of COVID-19 with the perspective of social influence factor is necessary for controlling the disease. Furthermore, a quantitative evaluation of severity associated with specific regions and cities of KSA would be a more effective reference for the healthcare sector in Saudi Arabia. Further, this paper has taken the Fuzzy Analytic Hierarchy Process (AHP) technique for quantitatively assessing the severity of COVID-19 pandemic in cities of KSA. The discoveries and the proposed structure would be a practical, expeditious and exceptionally precise evaluation system for assessing the severity of the pandemic in the cities of KSA. Hence these urban zones clearly emerge as the COVID-19 hotspots. The cities require suggestive measures of health organizations that must be introduced on a war footing basis to counter the pandemic. The analysis tabulated in our study will assist in mapping the rules and building a systematic structure that is immediate need in the cities with high severity levels due to the pandemic.
Keywords: Kingdom of Saudi Arabia; COVID-19; severity assessment; fuzzy AHP; dynamics of infection
The very first case of COVID-19 pandemic was detected in Wuhan, China from unknown source in December 2019. Initially, COVID-19’s seemed more like influenza and the expert’s team did not place it in the league of avian influenza, Severe Acute Respiratory Syndrome (SARS-CoV), and Middile East Respiratory Syndrome Coronavirus (MERS-CoV) [1]. However, when the number of cases rapidly increased due to person to person transmission then, the WHO suggested that novel Coronavirus was far more dangerous than SARS, and MERS-Cov. As per the current status in the world, almost every person is suffering from the COVID-19 pandemic, directly or indirectly; if not by the infection, people are suffering because their lifestyles and incomes have been severely crippled. The pandemic has also affected the mental health and general well-being of people as well. This virus’s spread is harmful and disastrous for any country or region. The current situation in the world is horrifying as COVID-19 afflicts more people with the death toll increasing alarmingly.
Moreover, COVID-19 is much more dangerous because no country has a standard and validated medication or vaccine to contain the virus and cure the patients. Various concepts and methodologies, though, are under research and the specialists across the globe are working on possible breakthroughs in developing a vaccine or an effective drug. Medical and engineering researchers and experts find that the nature of COVID-19 virus is much resilient and its most easy vector for infection is human to human interaction. Practitioners also find that international flight travel, bus travel and unhealthy meat consumption, etc., increases the possibilities of contacting the infection [2]. In the context of corona virus spread, KSA has implemented effective measures and strategies to countermine the threat of COVID-19 [3].
Further in this row, our proposed study will be a definite help to the Saudi researchers and experts in gauging the corona virus spread in KSA’s most populated cities. The data generated by the proposed methodology can be an accurate reckoner for the strategists to launch the best possible containment measures in the densely populated regions, thus reducing the extent of devastation. Different cities in the KSA have varying attributes in terms of men-women ratio, children count, geographical condition, environmental situation, etc. Similarly, availability of resources like hospitals, medical facilities, etc., in KSA also differs from region to region. Hence in the backdrop of these facts, the proposed study tries to bridge the gap between the identification of infected cities based on their risk ratio and prioritizing them for helping cities effectively. This can be done through the empirical analysis profiled in our research which is based on step-wise medical enhancement that the experts can employ.
The study has taken twenty four most populated cities for the research whose population lies between 100,000 to 4,300,000 [4]. Further, four cities have more than 1,000,000 people and twenty cities have between 100,000 and 1,000,000 people. Such an examination activity would likewise be powerful option in contrast to the neurosis and disarray among individuals with respect to the spread of the pandemic. Currently, the most suitable and effective measure against corona spread is identifying the susceptible persons as well as cities and then turn them into a containment zone, and seal all types of activity in the area. Similarly in this study, the authors have identified and selected various infected cities of KSA and then prioritized them accordingly by using the selected methodology. Multi-Criteria-Decision-Making methodology is adopted and implemented for analyzing the various cities and their priority in proposed study [5–7].
MCDM is the most effective and easy way to solve issues related to decision making in different contexts. Many researchers implemented the MCDM technique for various topics [8–10]. Methodologies that are adopted by these studies are based on the behavioral analysis of MCDM technique [11,12]. There are many methods that provide priority through MCDM techniques where there are many methods that are used to identify indicators value in methodology [13,14]. Fuzzy AHP procedure was utilized in this paper to assess the severity of COVID-19 pandemic in Saudi Arabian cities. The remainder of this article is arranged as follows: The subsequent portion is a profile of the regions, states and top populated cities of Saudi Arabia; The third section portrays the technique for evaluation for example Fuzzy AHP. The fourth section applies the method for obtaining the results. Section five presents the conclusion.
2 Regions and Cities of Kingdom of Saudi Arabia
Our research was developed by perusing and calculating the data collected through experts, literature surveys, medical, web sites and reports [15,16]. The identification of collected data indicates various risk factors in cities that may be the cause of corona spread in Saudi Arabia. For instance, authors identified that medical experts strongly believe that the immune system of the citizens of KSA is not as strong as it should be to combat the virus [17]. A weak immune system can be easily infected and is less likely to respond to any treatment, thus increasing the danger of mortality. In addition, for providing a more convincing and verified base for the proposed study, the authors selected the relevant literature that combines the medical utilities and conditions with modern technical resources for producing effective outcomes. Notably, Saudi Arabia has five primary regions and 13 states in all [18,19]. Every locale is separated into Governorates and the Area Capitals, which have the status of district.
The total population of KSA is 33,413,660, which represents 0.43% of global population and is ranked 41st worldwide [4,20]. The density ratio is 15.322 per square KM. The average life of male and female in KSA is 75.7 and 74.2, respectively. 83.7% of the population of KSA lives in urban demographical land of country. A study also describes that the 50% of the population in KSA is young and their age lies between 24–54 years [19,20]. The average temperature in summer is 45°C (113°F), but in some special cases the temperature may even rise to 54°C (129°F). On the other hand, in winters, the temperature can be as low as 0°C (32°F) [21]. In spring and other weather, the average temperature of KSA is usually around 29°C (84°F). Condition of rain in KSA is much weaker than any other country in world [19,21].
There are 4 cities with more than a million people in Saudi Arabia; forty five major cities have population between ten thousands and hundred thousand people. Riyadh is the capital and largest city of the KSA. The authors have taken twenty four most populated cities of KSA. This is because more the density of the population of a city, greater are the chances of the pandemic’s spread in it. Further other attributes such as number of hospitals, population, time of lockdown has been kept in mind while opting for these cities. Fig. 1 below describes the hierarchy of twenty four top most populated and vulnerable cities of Saudi Arabia along with their respective states.
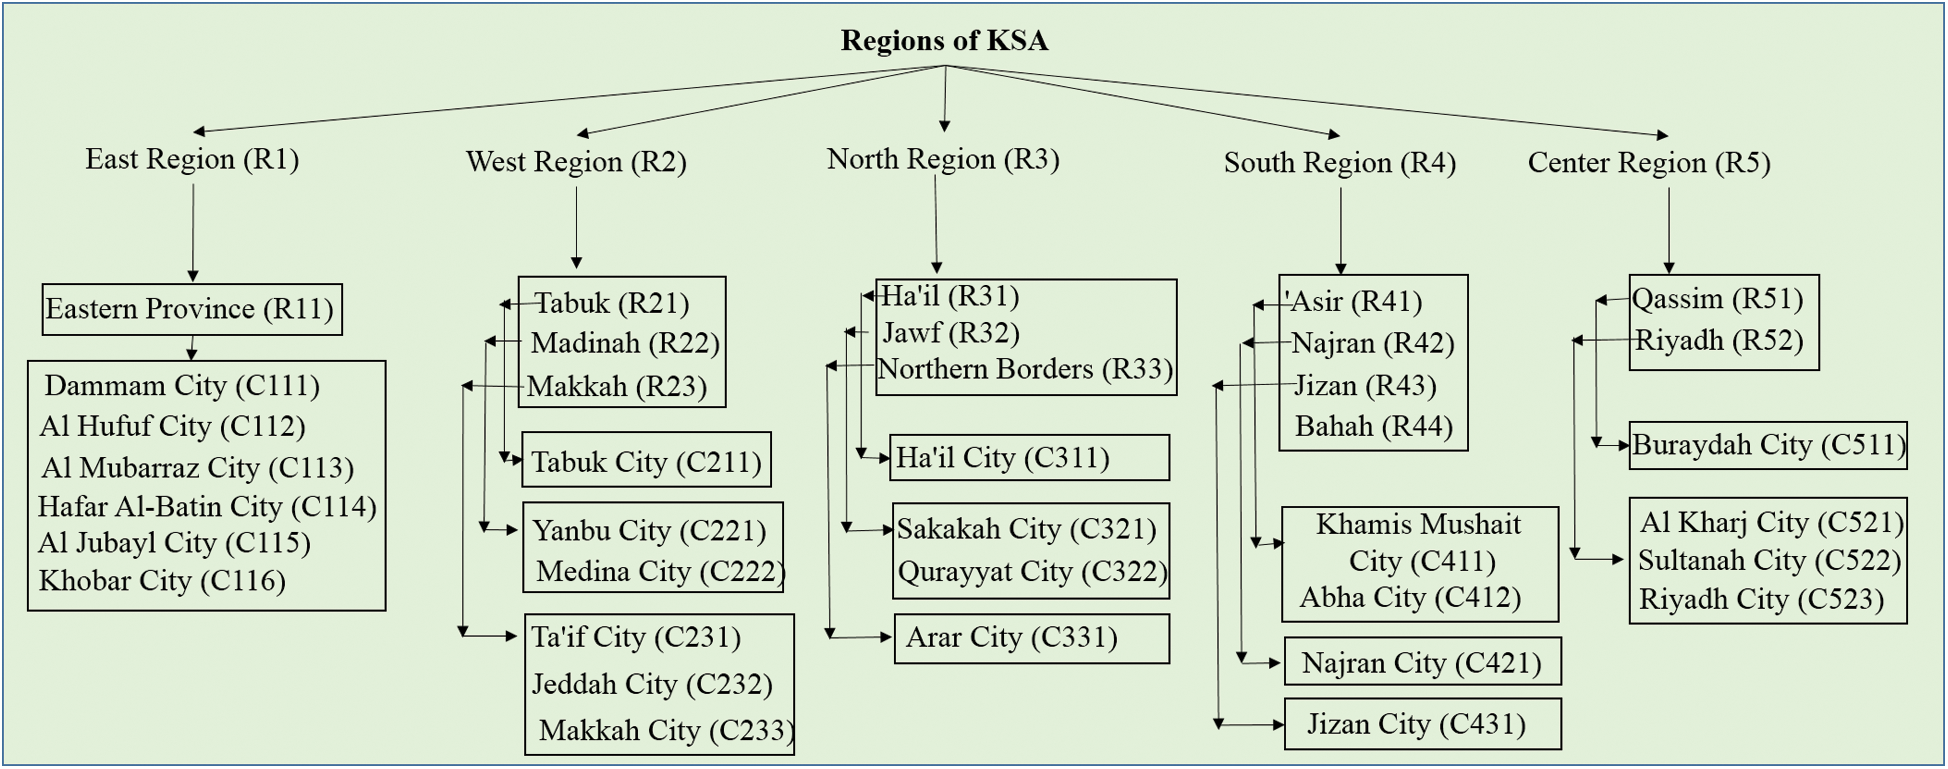
Figure 1: Tree structure of Saudi Arabian regions
Population of these twenty four cities is more than one million [4]. Other details of the cities and their respective states have been discussed as follows:
East Region (R1): Eastern Province (R11) is the only state that belongs from the east region of KSA. Eastern Province has the country’s largest land acquisition (259,662 square meters). It is also the third largest populated state of Saudi Arabia with 4,900,325 people. In this Province, six cities have more than 100,000 people. Dammam City (C111), Al Hufuf City (C112), Al Mubarraz City (C113), Hafar Al-Batin City (C114), Al Jubayl City (C115), and Khobar City (C116) have 768602, 293179, 290802, 271642, 237274, and 165799 people, respectively. In the context of resources, this state has 20 hospitals and 2400 beds in terms of medical facilities and is more prepared to handle emergencies due to the pandemic.
West Region (R2): West region of KSA is divided into three main states that are: Tabuk (R21), Madinah (R22) and Makkah (R23). A detailed description of all these states is written below:
• Tabuk (R21)–has 56,399 square meter area in the terms of geographical construction. The population of the state is 910,030. In this Province, there is only Tabuk city (C211) and it has more than 100000 people i.e., 455450. In the context of resources and preparedness for the pandemic, the region has only one main hospital along with 300 beds.
• Madinah (R22) is spread over 58,680 square meter area in the terms of geographical construction. The population of the state is 2,132,679. In this Province, two cities have more than 100,000 people. Yanbu City (C221) and Medina City (C222) have 200161, and 1,300,000 people, respectively. In the context of resources, the region has seven main hospitals along with 3500 beds (approximately).
• Makkah (R23) has an area of 59,131 square meters terms of geographical construction. The population of the state is 8,557,766. In this Province, three cities have more than 100,000 people. Ta'if City (C231), Jeddah City (C232), Makkah City (C233) have 530848, 2867446, and 1323624 people, respectively. In the context of resources, the region has forty main hospitals along with 7000 beds (approximately). This state is also the abode of the largest holy place of Muslims called the Makkah City. Thus the city is at a higher risk of virus spread.
North Region (R3): This region is divided into three main states that are: Ha’il (R31), Jawf (R32) and Northern Borders (R33). A detailed description of all these states is written below:
• Ha’il (R31) has 40,111 square meter area in the terms of geographical construction. The population of the state is 597,144. In this Province, only Ha’il City (C311) has more than 100,000 people with the population of 267005. In the context of resources to deal with contingencies in times of the pandemic, the region has 5 main hospitals along with 1000 beds (approximately).
• Jawf (R32) is spread over 38,692 square meter area in the terms of geographical construction, the population is 508,475. In this Province, two cities have more than 100,000 people. Sakakah City (C321) and Qurayyat City (C322) have 128332, and 102903 people, respectively. In the context of resources, the region has two main hospitals along with 350 beds (approximately).
• Northern Borders (R33) acquire 43,165 square meter area in the terms of geographical construction and the population of the state is 375,310. In this Province, only Arar City (C331) has more than 100,000 people i.e., 148540. The region has 10 main hospitals along with 900 beds (approximately) in all.
South Region (R4): The South region of KSA is divided into four main states that are: ‘Asir (R41), Najran (R42), Jizan (R43) and Bahah (R44). A detailed description of all these states is written below:
• ‘Asir (R41) has an area of 29,611 square meters and the population of the state is 2,211,875. In this Province, two cities have more than 100,000 people. Khamis Mushait City (C411) and Abha City (C412) have 387553, and 210886 people, respectively. In the context of resources, the region has ten main hospitals along with 1250 beds (approximately).
• Najran (R42) has an area of 57,727 square meters. The population of the state is 505,652. In this Province, only Najran City (C421) has more than 100,000 people with the population of 258,573. The region has three main hospitals along with 500 beds (approximately).
• Jizan (R43) has an area of 4,506 square meters and the population of the state is 1,567,547. In this Province, only Jizan City (C431) has more than 100,000 people with a population of 105,198. The region has eight main hospitals along with 3000 beds (approximately).
• Bahah (R44) acquires 3,831 square meter area in the terms of geographical construction. The population of the state is 476,172. This Province has no more than 100,000 people in a single city. In the context of resources to manage the emergencies of the pandemic, the region has two main hospitals along with 400 beds (approximately).
Center Region (R5): The central region of KSA is divided into two main states that are: Qassim (R51) and Riyadh (R52). A detailed description of all these states is written below:
• Qassim (R51) has an area of 22,412 square meters and the state’s population is 1,215,858. In this Province, only Buraydah City (C511) has more than 100,000 people with a population of 391,336. The region has ten main hospitals along with 1200 beds (approximately).
• Riyadh (R52) is a central point and capital of the country with an area of 156,080 square meters. The total population is 8,216,284. In this Province, three cities have more than 100,000 people. Al Kharj City (C521), Sultanah City (C522), and Riyadh City (C523) have 425300, 946,697, and 4,205,961 people, respectively. The region has thirty eight main hospitals along with 6000 beds (approximately).
The adopted methodology for assessment is Fuzzy-AHP (Analytical Hierarchy Process). Fuzzy-AHP is a MCDM approach that works on a hierarchal tree and provides accurate and effective results [22,23]. In addition, first step for assessment through this methodology is to construct a hierarchy of various factors that need to be assessed by fuzzy-AHP. The factors to be assessed in this study have already been tabulated in Fig. 1. The factors have been converted into the values of Triangular Fuzzy Numbers (TFN) for calculation. Thereafter, pair-wise comparison matrix has been constructed by using Eqs. (1)–(4) [24–26]. This type of procedure for assessment was adopted from Kumar et al. [27].
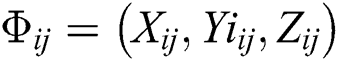
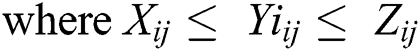
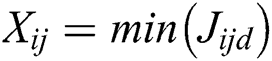
Agrawal et al. [28] have also used the fuzzy-AHP methodology for analyzing the healthcare issues and factors effectively. For this proposed study, authors adopted the TFN value for effective and easy calculation process. TFN value always lies between 0 and 1 [29–31]. In addition, linguistic values of lower, medium and upper limit are divided through numeric values: 1, 2, 3…..9. Value of Φij is evaluated via geometrical mean process of experts’ opinion. Equations that are used in calculation are:
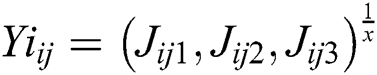
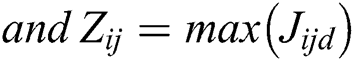
The geometric mean is determined by duplicating and including two fuzzy numbers. Scientific articulations (5–7) are utilized to compute geometric mean. We determined the geometric methods by these scientific explanations:


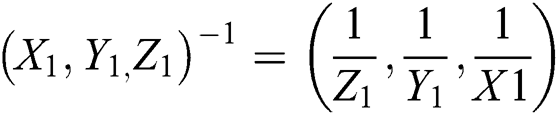
Jijk illustrates the significance of the expert’s opinion k. Additionally, I and J represent the parameters experimented by experts. Further, defuzzification process is evaluated after constructing comparison pair matrix and converting the TFN values. All these processes are evaluated through Eqs. (8)–(10) [32,33].
 Such that,
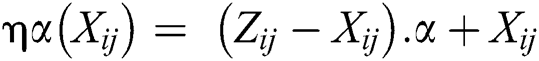
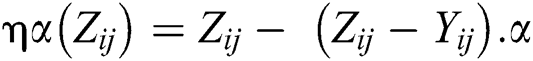
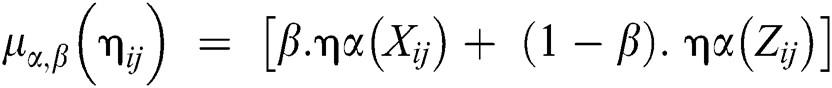
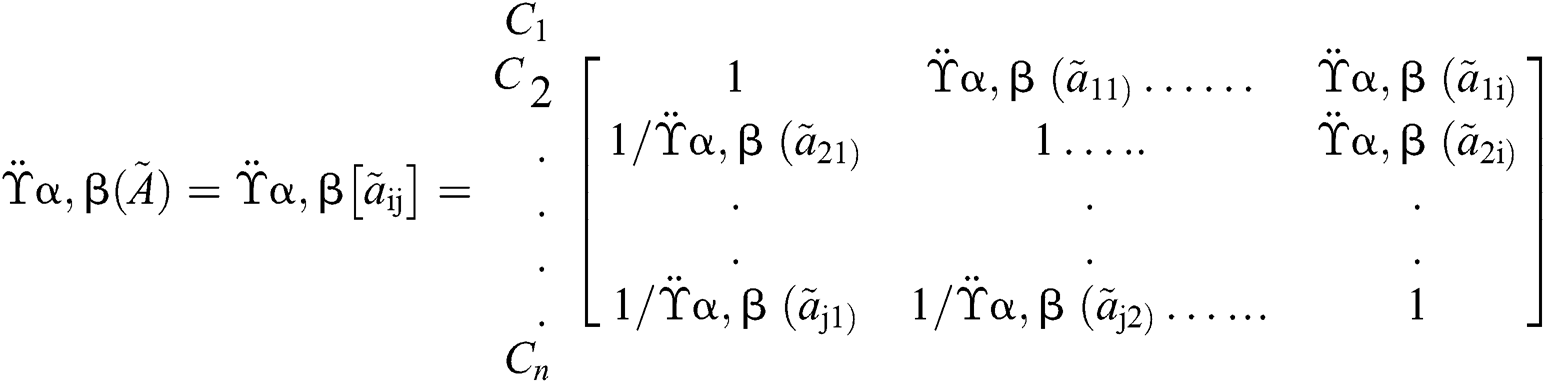
Here, α and β are adopted for representing the experts’ choices. 0 and 1 is the range of these two values. Equation  (Ã) represents the condition whether the value is part of set or not. Authors use Eq. (11) for describing single pair-wise comparison matrix.
C1 C2 ……………………..…..… Cn
The following stage is to assess the pair-wise examination network’s Eigen worth and Eigenvector. Assuming that μ indicates the Eigenvector, while λ means the Eigenvalue of fuzzy pair-wise correlation grid ηij, then
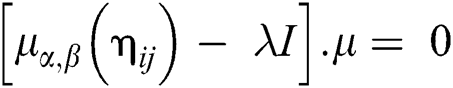
Numerical proclamation (12) depends on straight vector change, in which I corresponds to the unit network. By applying scientific proclamations (1–12), the loads of explicit models might be procured against the various potential rules.
AHP procedure is used to construct judgment in multi criteria situation. In the recent years it is evident and clearly displayed that many researchers and experts are using AHP methodology for constructing precise decision on calculated and evaluated results [10–12,33–35]. This is a significant strategy ordinarily utilized by the experts to finish a need based investigation. To manage the delays and ambiguities that might arise due to the experts’ choices, we opted for an improved type of AHP, which is known as the fuzzy AHP. In the context of COVID-19 pandemic, there is no specific treatment yet and each expert is doing his/her best to treat the victims.
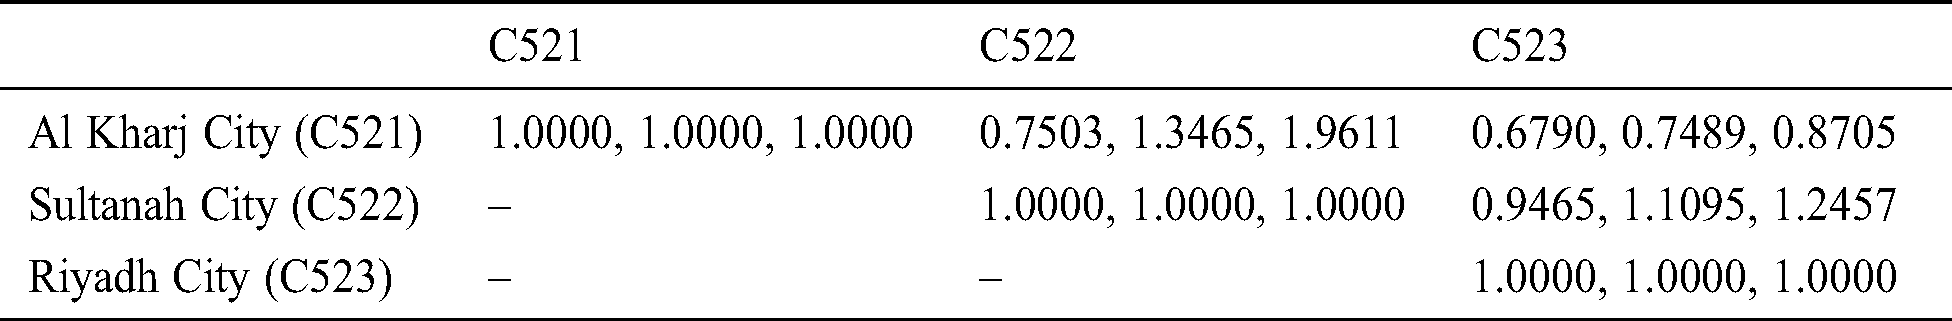
In such a varied scenario, fuzzy-AHP method plays an even more significant role in treatment procedure against COVID-19. The procedure has the ability to produce and evaluate the sensitivity and priority of infection dynamics. To achieve the desired goals, the authors assessed the risk and severity of every categorized region of KSA. Furthermore, this proposed study’s intent is to provide a severity assessment of Saudi cities. This was evaluated by the authors on the basis of the experts’ opinions. We have taken the opinions of 25 experts for this assessment. Further, through the Eqs. (1)–(12) described in the methodology section of this paper, we constructed Tabs. 1–11 of comparison pair-wise matrix and evaluated the ranking of hierarchy described in Fig. 1.
Table 1: Saudi Arabian main regions at level 1
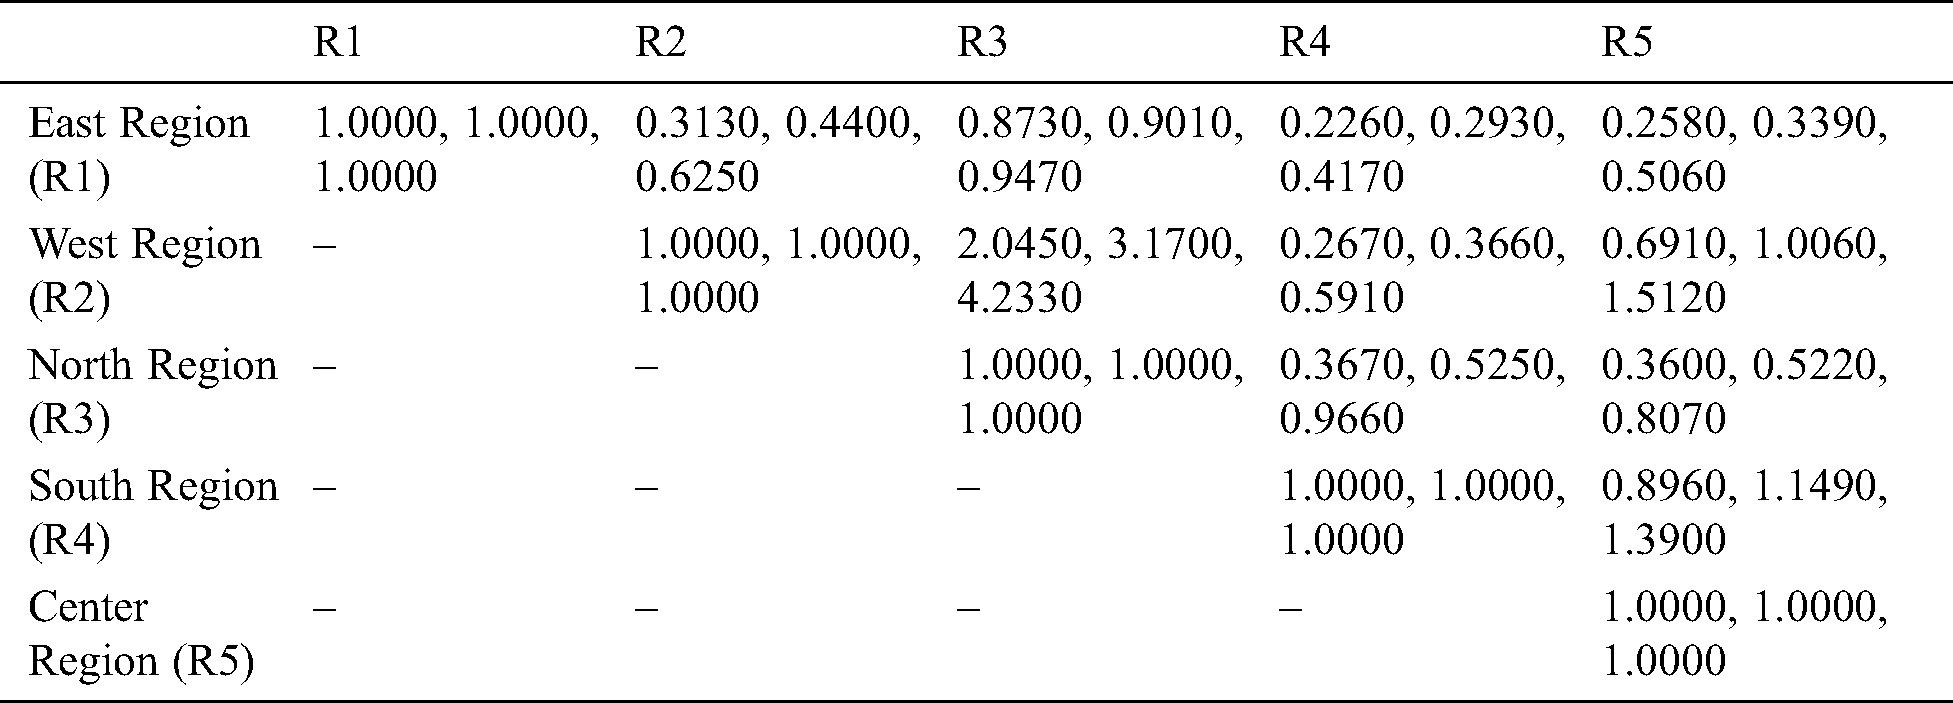
Table 2: Saudi Arabian west regions at level 2
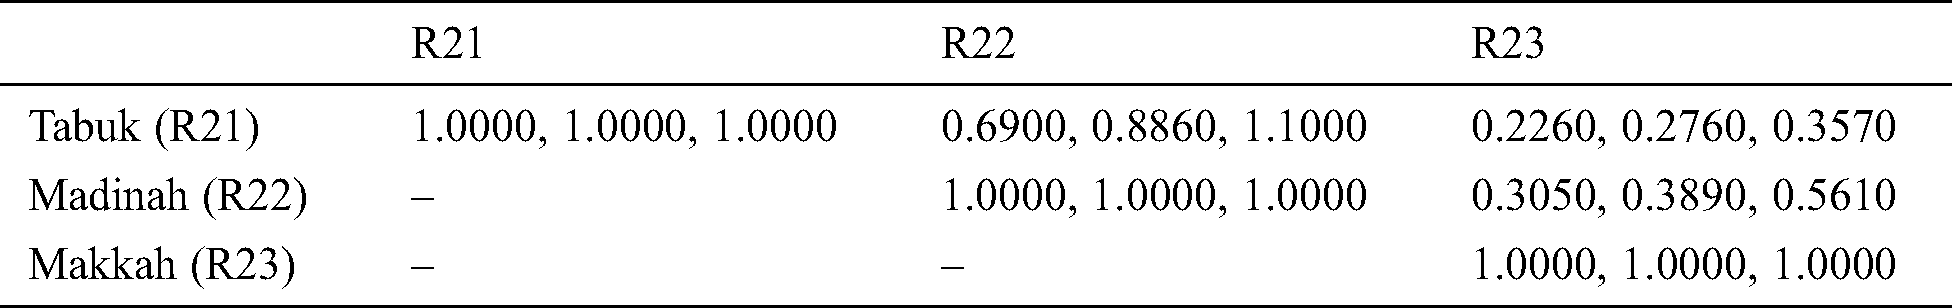
Table 3: Saudi Arabian north regions at level 2
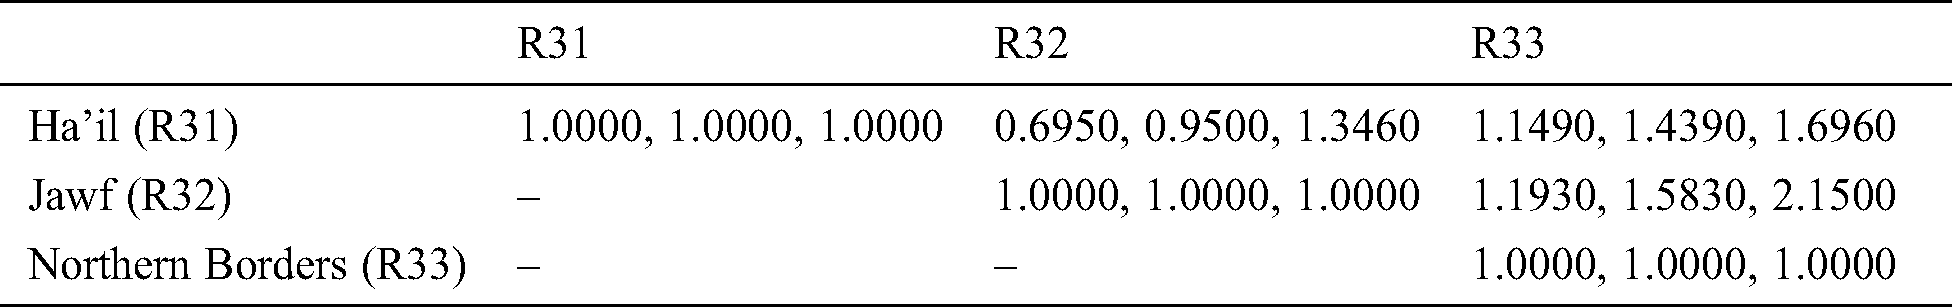
Table 4: Saudi Arabian south regions at level 2
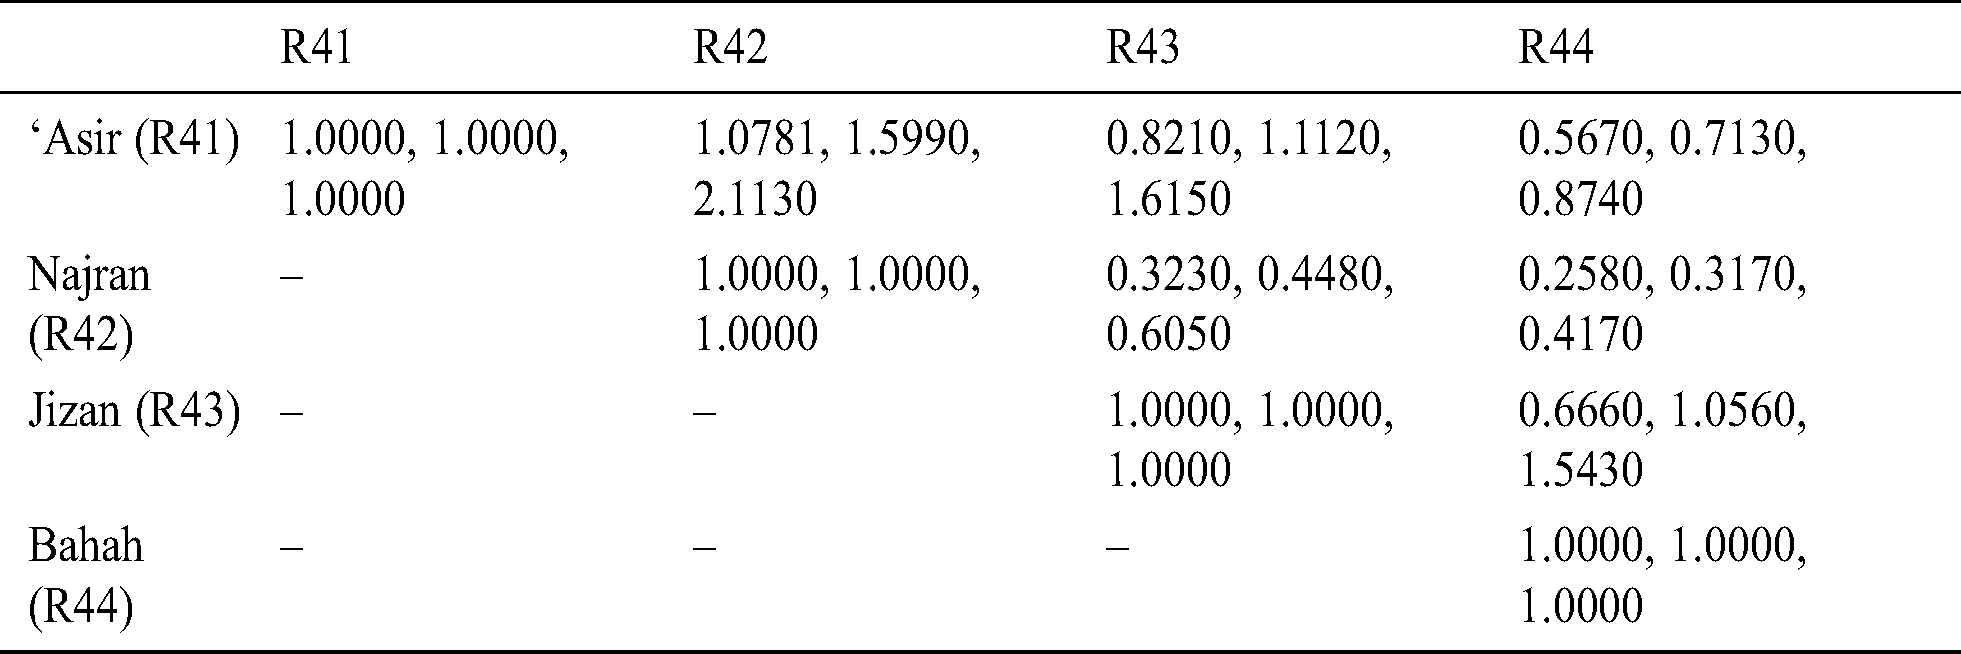
Table 5: Saudi Arabian central regions at level 2
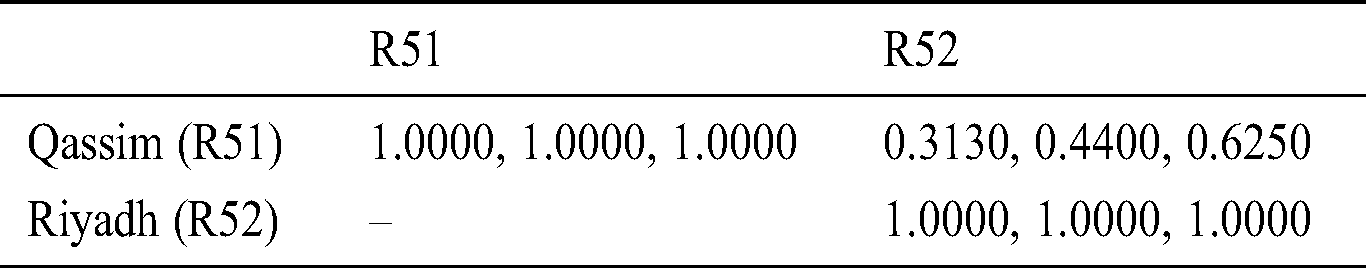
Table 6: Eastern province cities at level 3
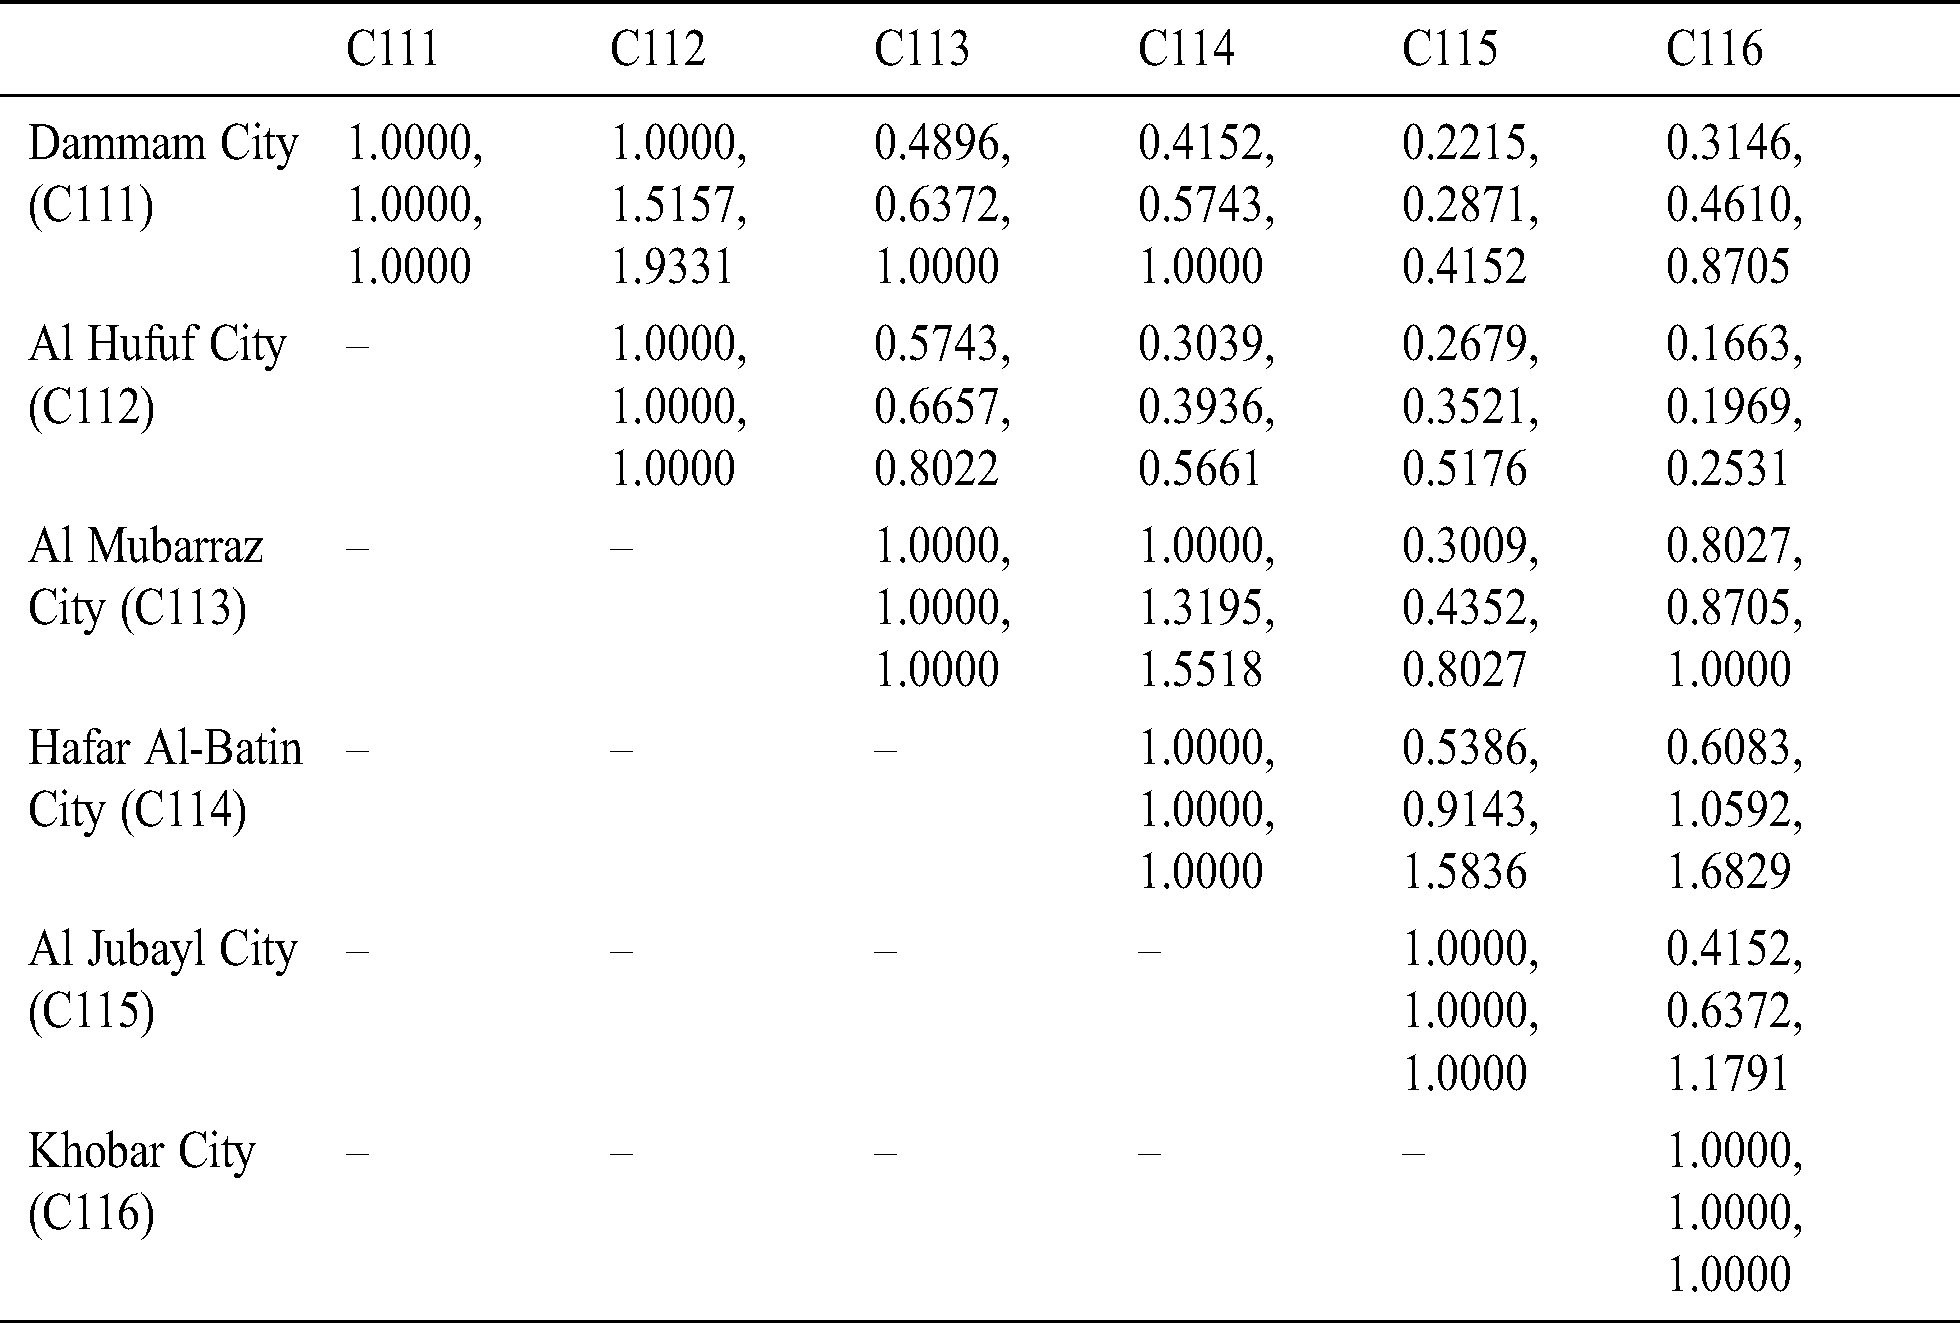
Table 7: Madinah province cities at level 3
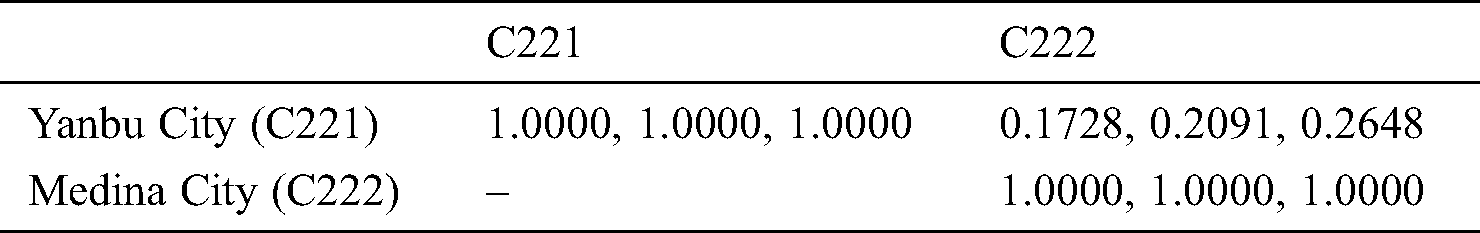
Table 8: Makkah province cities at level 3
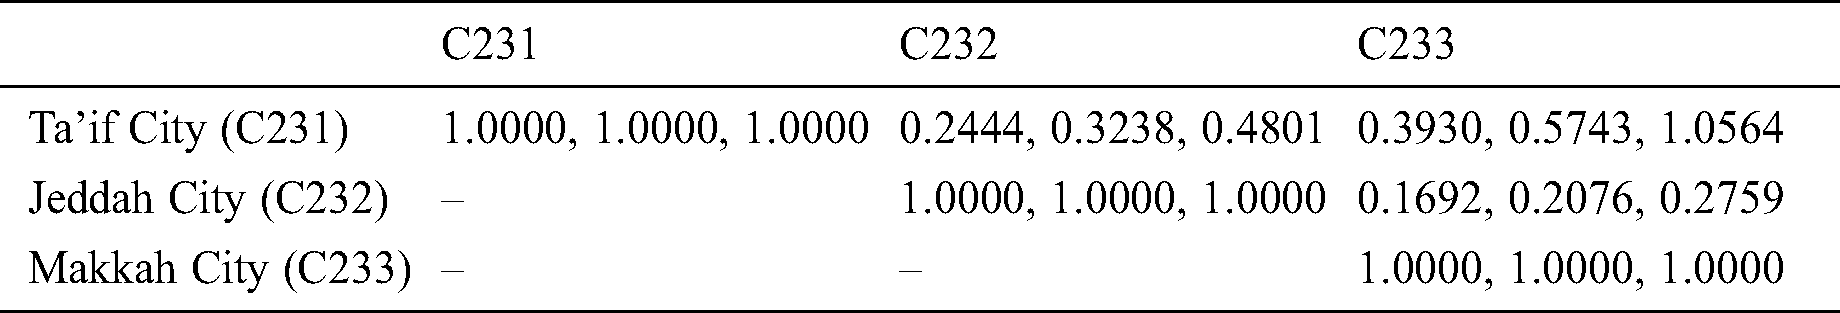
Table 9: Jawf province cities at level 3
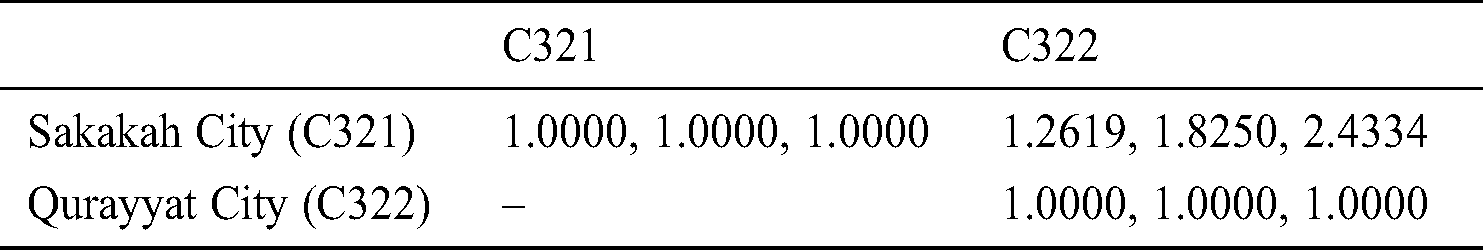
Table 10: ‘Asir province cities at level 3
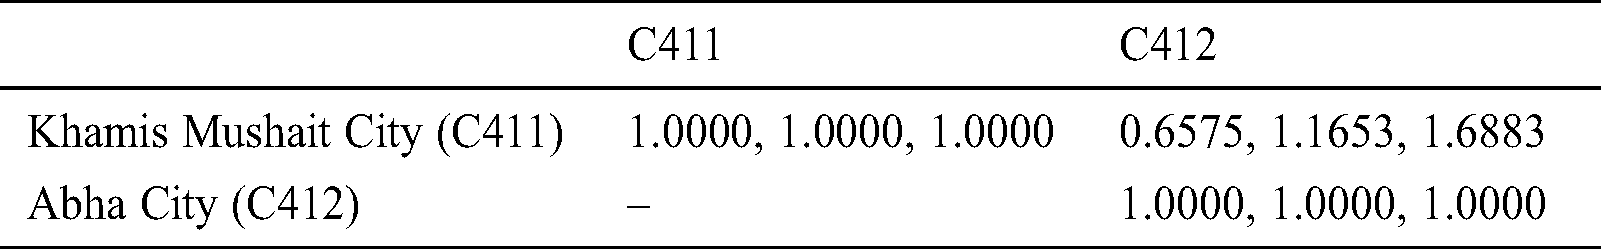
Table 11: Riyadh province cities at level 3
For developing a fuzzy pair-wise correlation matrix, conditions (4–6) are utilized for defuzzification. In the subsequent stage, we assessed the consistency ratio of each matrix [13,14,24,25,34–36]. Eq. (8) is utilized to compute the eigenvalue and eigenvector. With the assistance of Eqs. (1)–(8), we evaluated the defuzzified values of each matrix that are depicted from Tabs. 12–22 and Figs. 2–12. In addition, Tab. 23 shows the dependent weights of Saudi Arabian regions through the hierarchy. With the help of Tab. 23 and Tabs. 17–22, we estimated dependent weights of Saudi Arabian cities through the hierarchy in Tab. 24. Finally, normalized weights and final ranking of the Saudi Arabian regions and cities was obtained. This has been shown in Tab. 25, Fig. 13 and Tab. 26, Fig. 14, respectively.
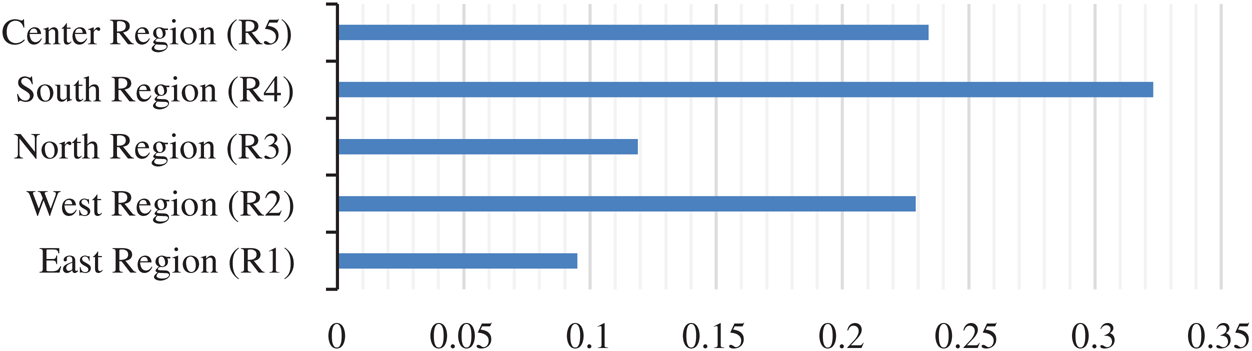
Figure 2: Graphical representation of local weights for Saudi Arabian main regions
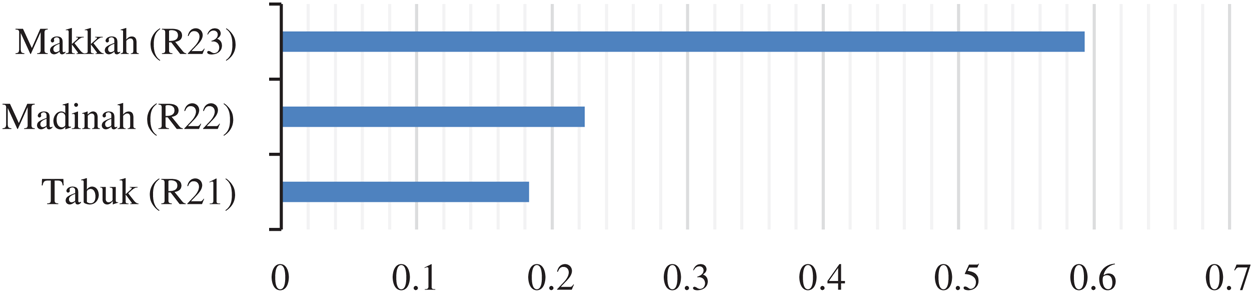
Figure 3: Graphical representation of local weights for Saudi Arabian west regions
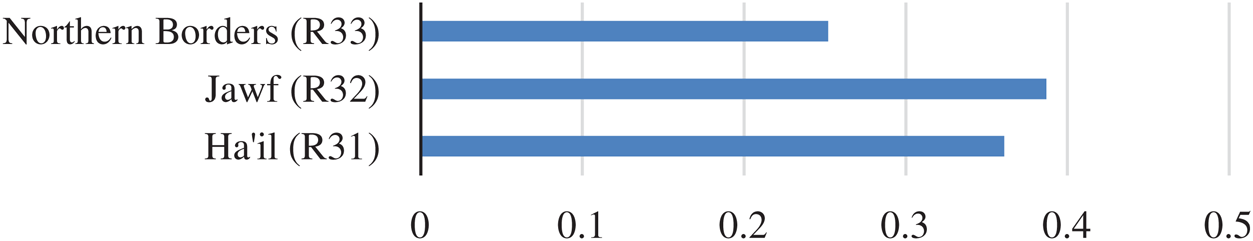
Figure 4: Graphical representation of local weights for Saudi Arabian north regions
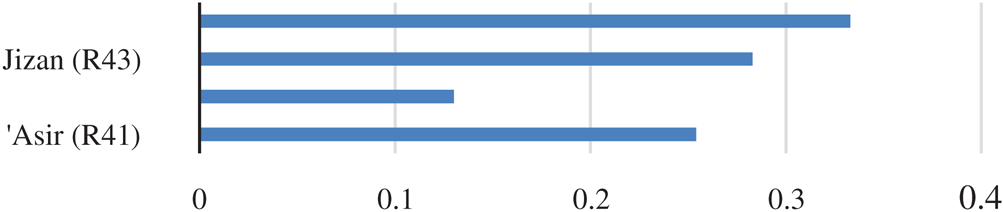
Figure 5: Graphical representation of local weights for Saudi Arabian south regions
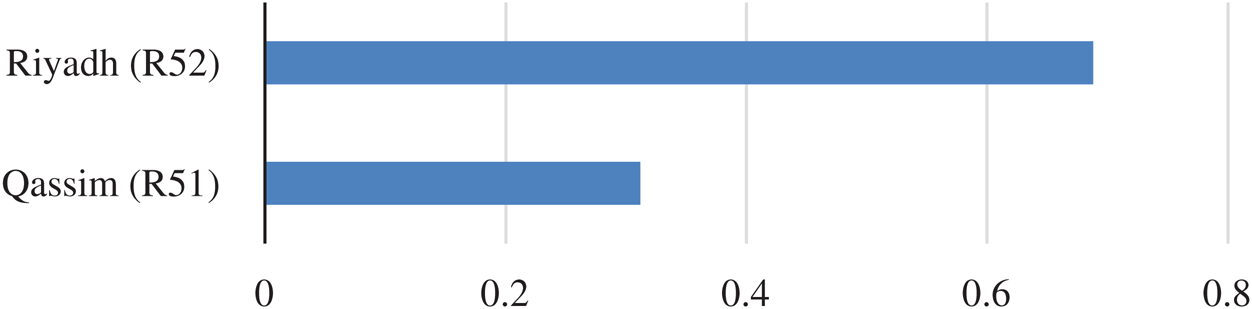
Figure 6: Graphical representation of local weights for Saudi Arabian central regions
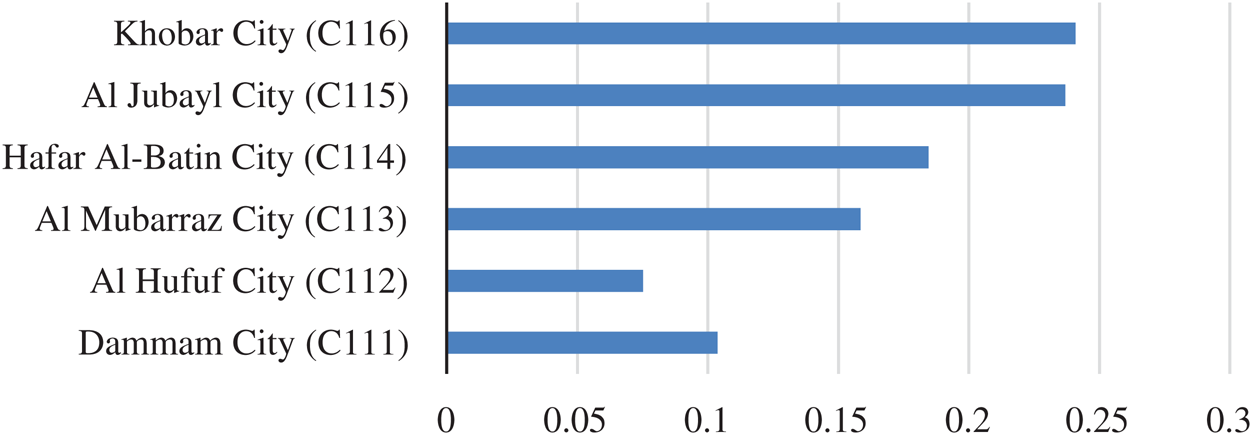
Figure 7: Graphical representation of local weights for eastern province cities
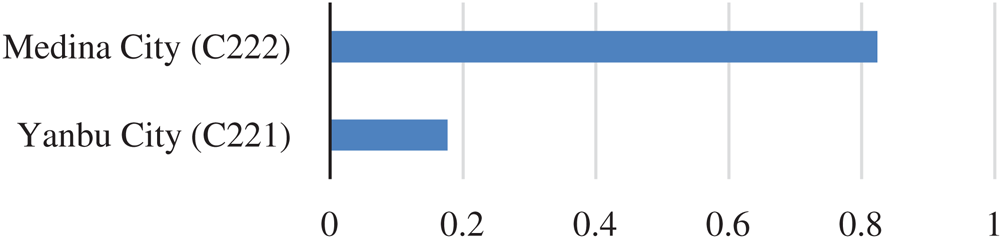
Figure 8: Graphical representation of local weights for madinah province cities
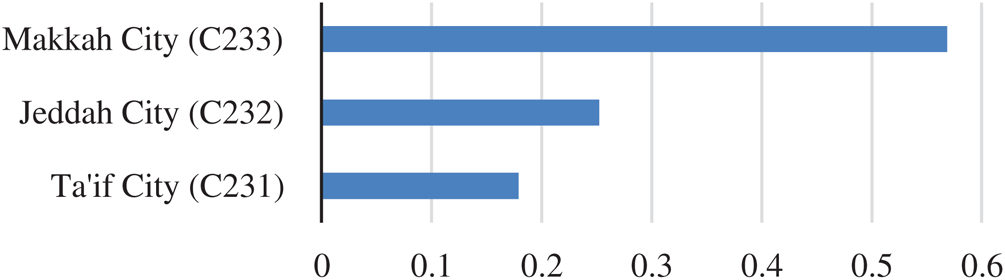
Figure 9: Graphical representation of local weights for makkah province cities
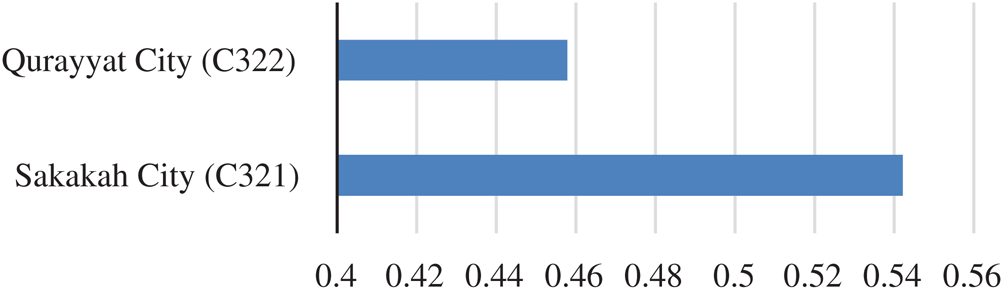
Figure 10: Graphical representation of local weights for jawf province cities
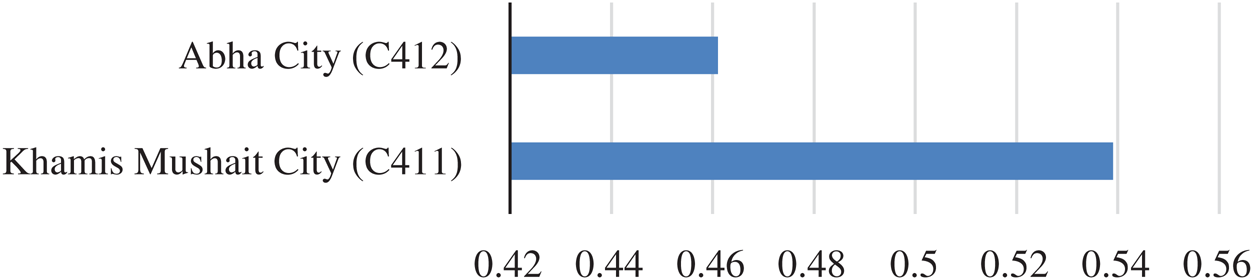
Figure 11: Graphical representation of local weights for ‘Asir province cities
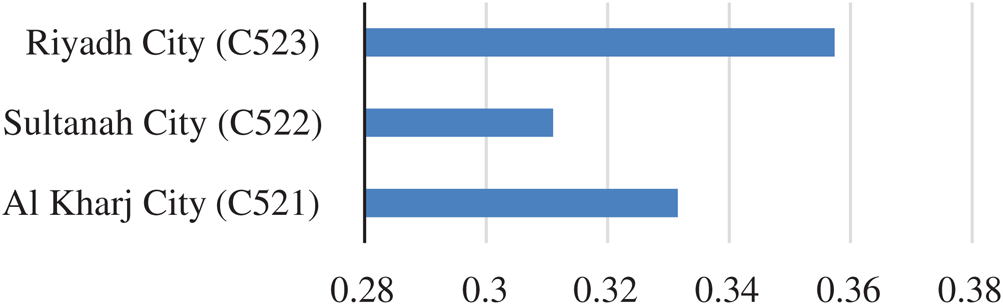
Figure 12: Graphical representation of local weights for Riyadh province cities
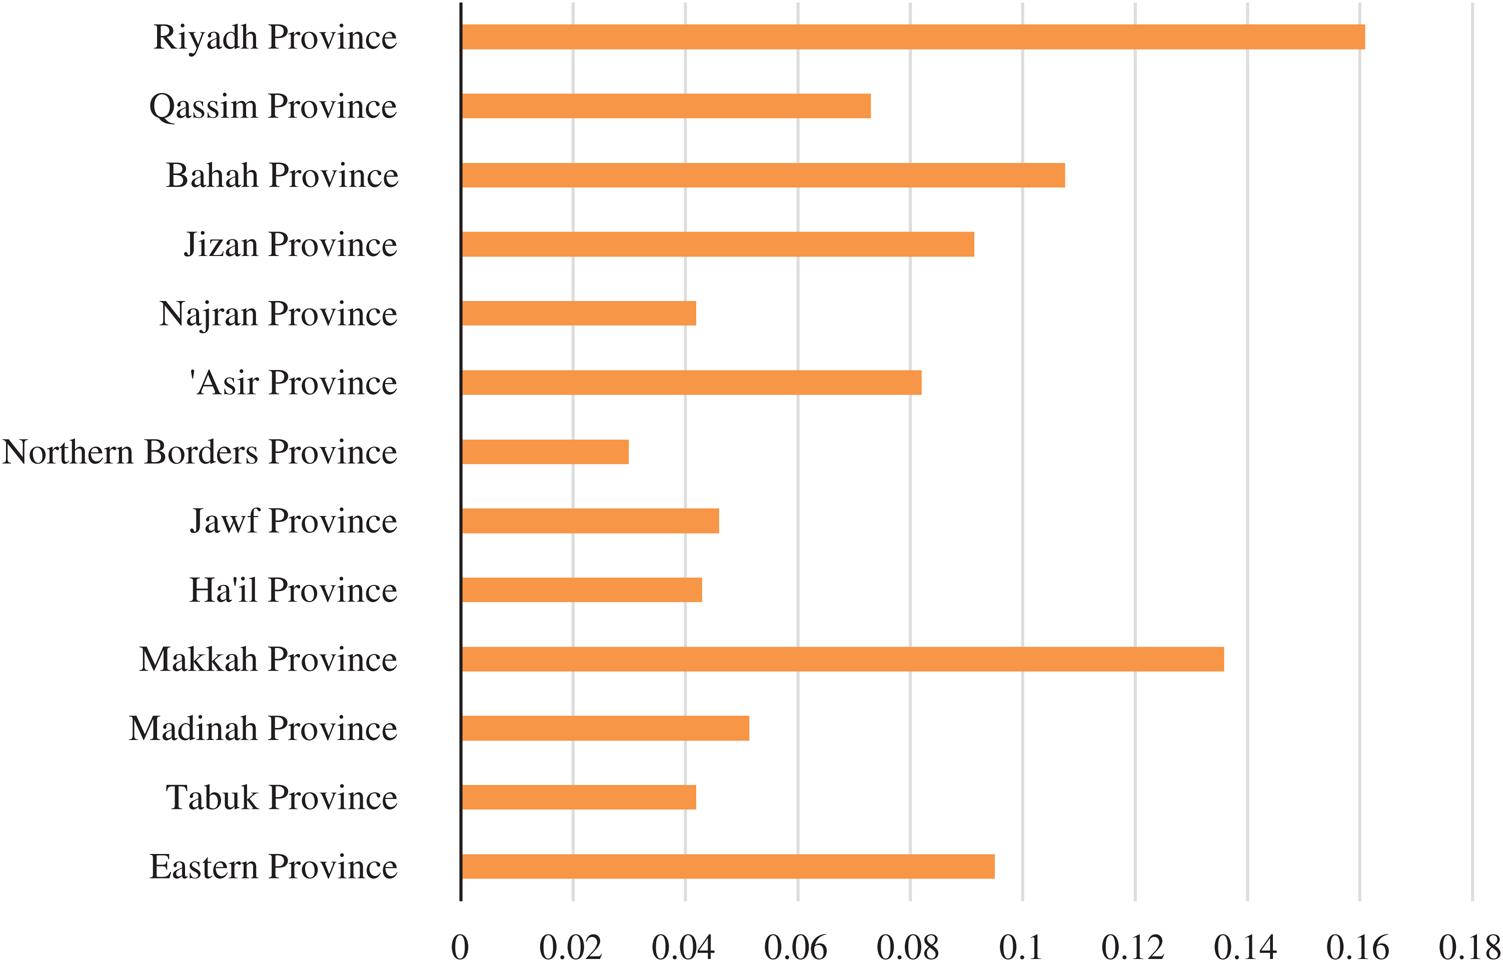
Figure 13: Graphical representation of final weights for Saudi Arabian regions
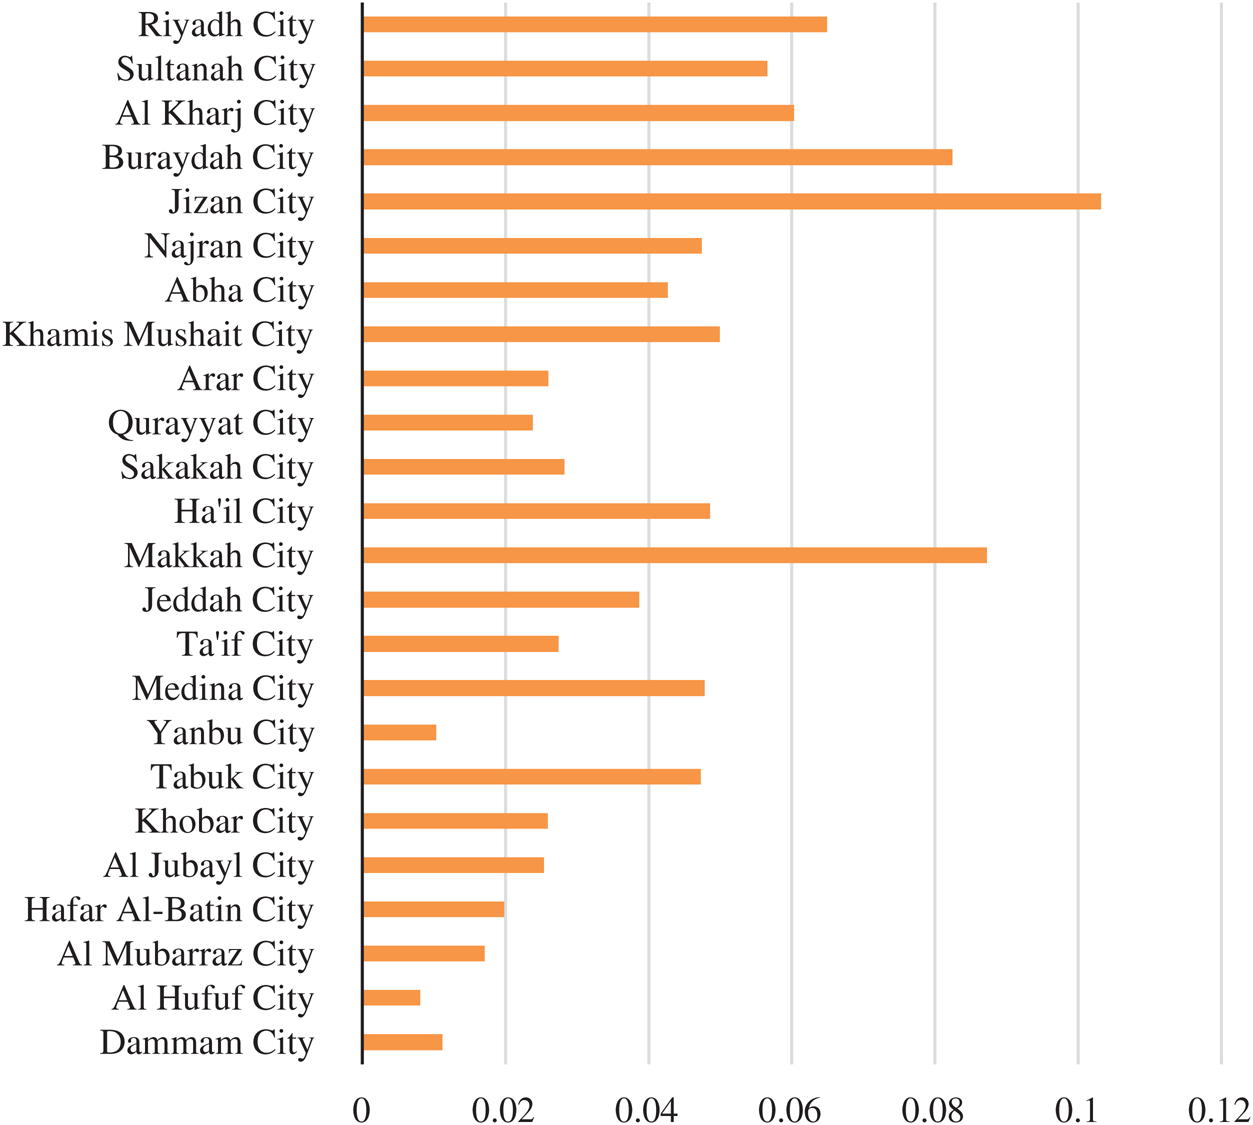
Figure 14: Graphical representation final weights for Saudi Arabian cities
Table 12: Local weights for Saudi Arabia’s main regions at level 1
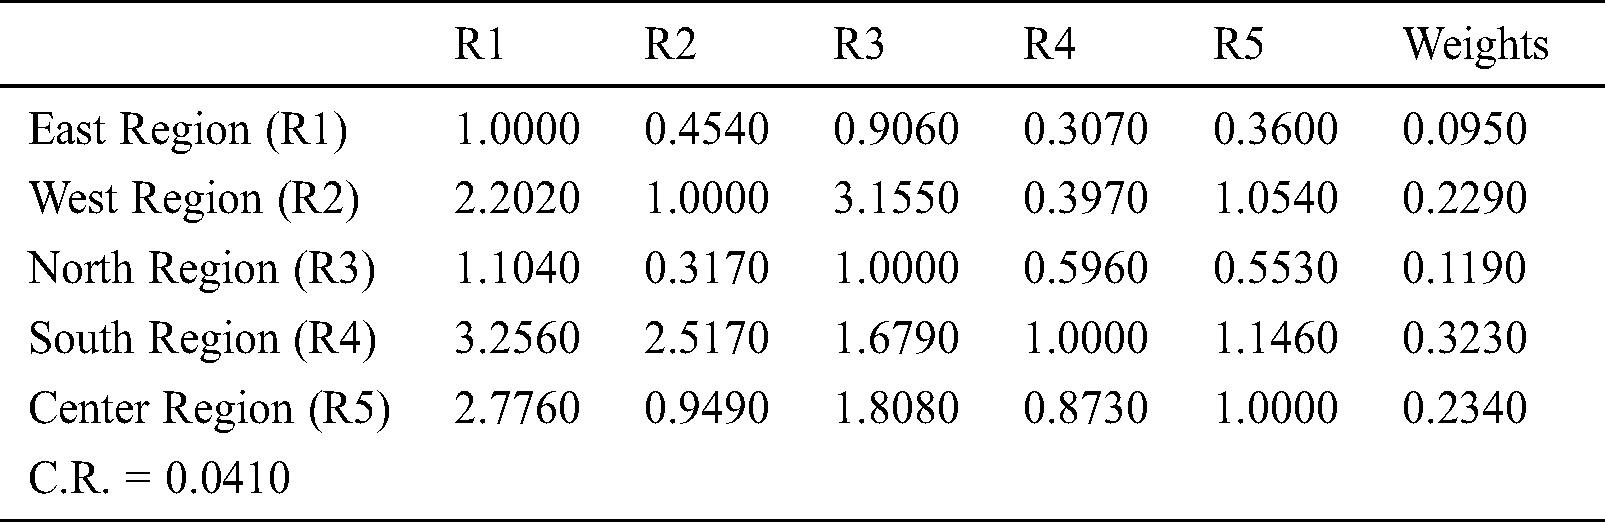
Table 13: Local weights for Saudi Arabian west regions at level 2
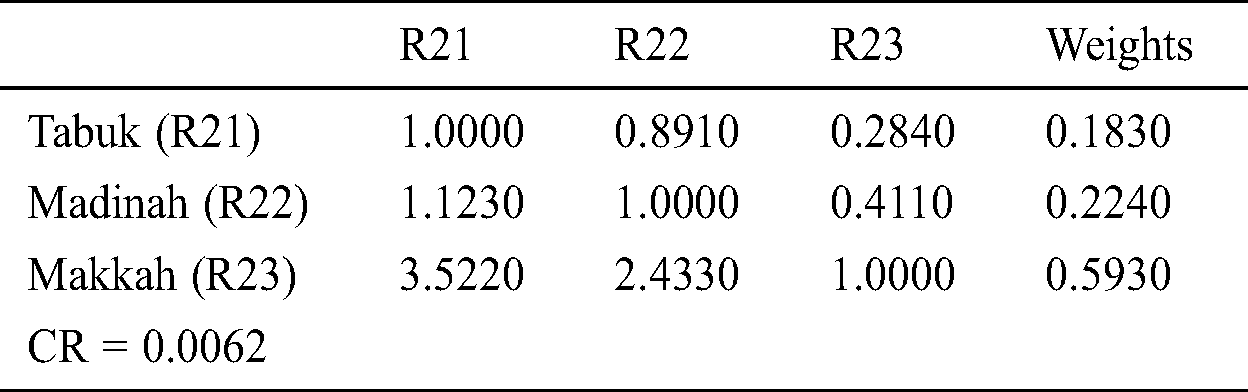
Table 14: Local weights for Saudi Arabian north regions at level 2
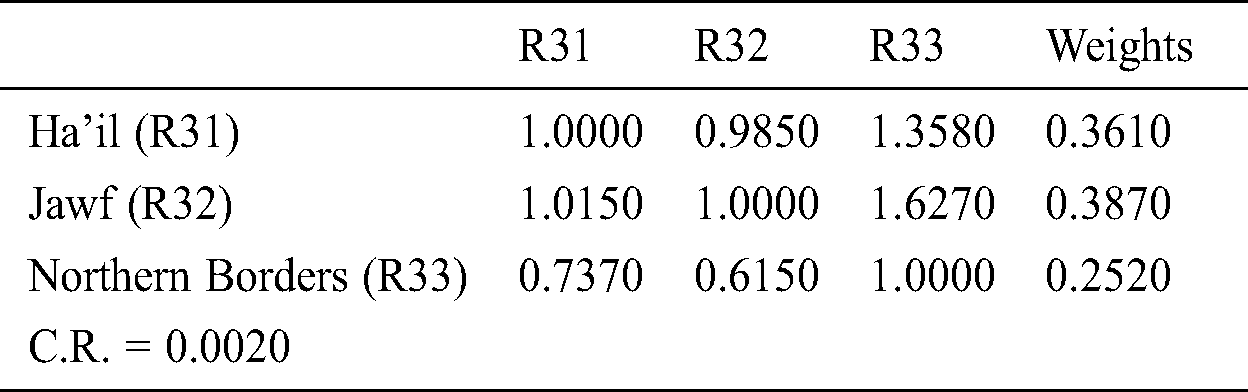
Table 15: Local weights for Saudi Arabian south regions at level 2
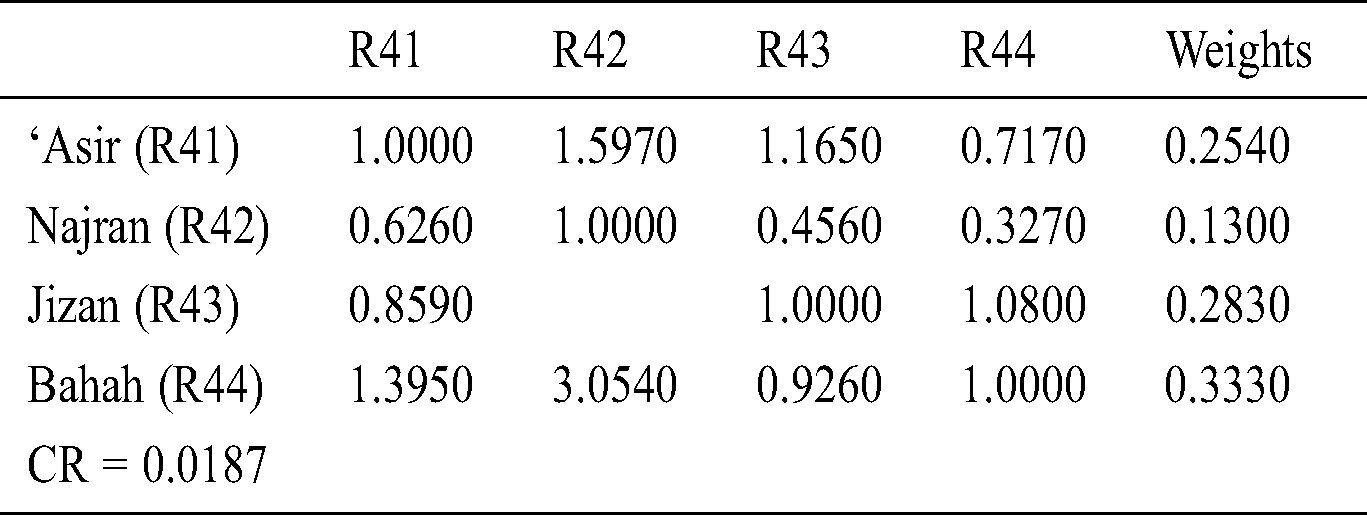
Table 16: Local weights for Saudi Arabian central regions at level 2
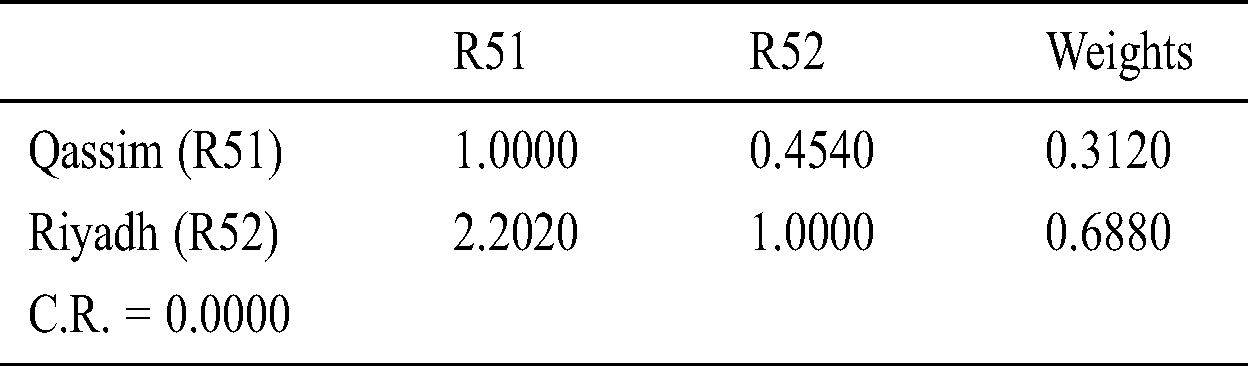
Table 17: Local weights for eastern province cities at level 3
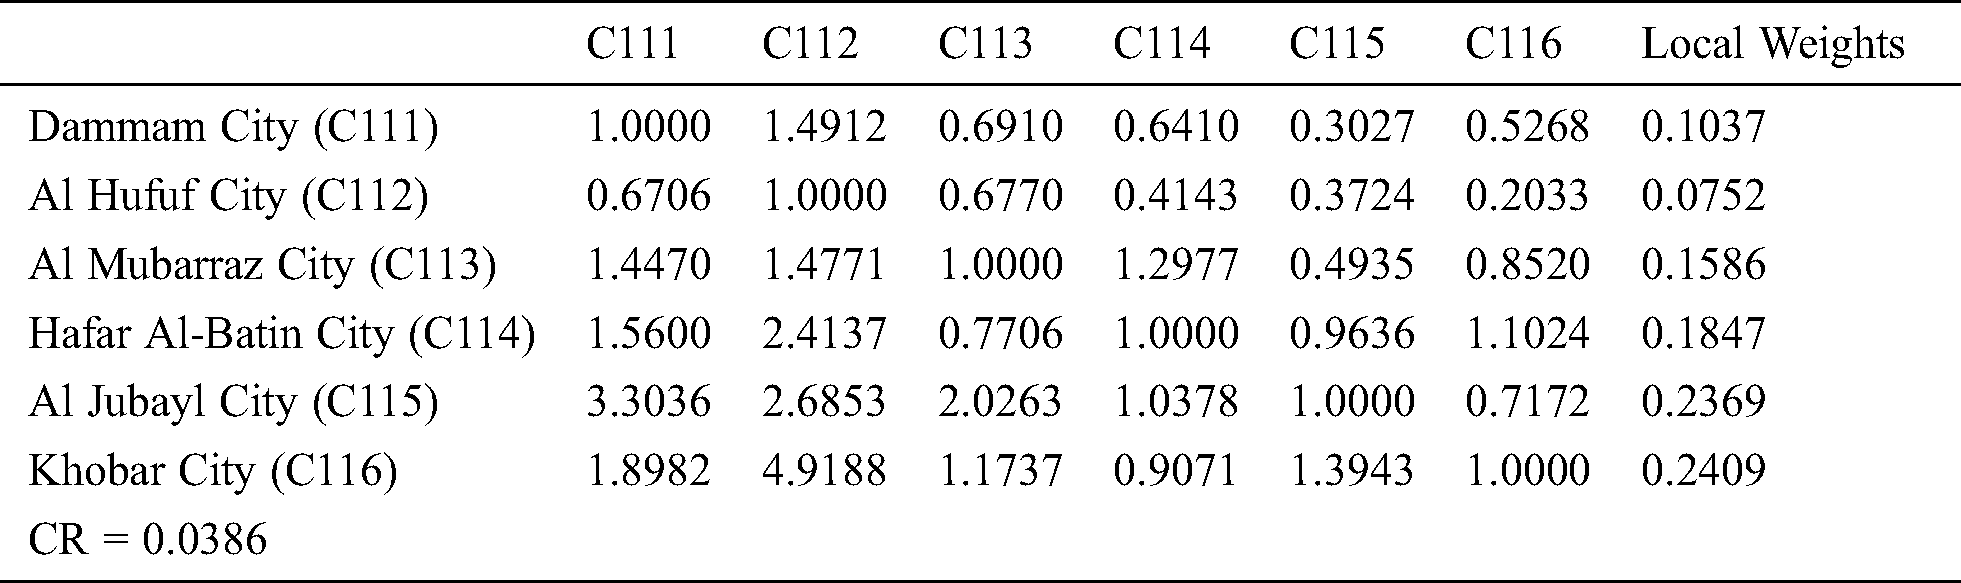
Table 18: Local weights for madinah province cities
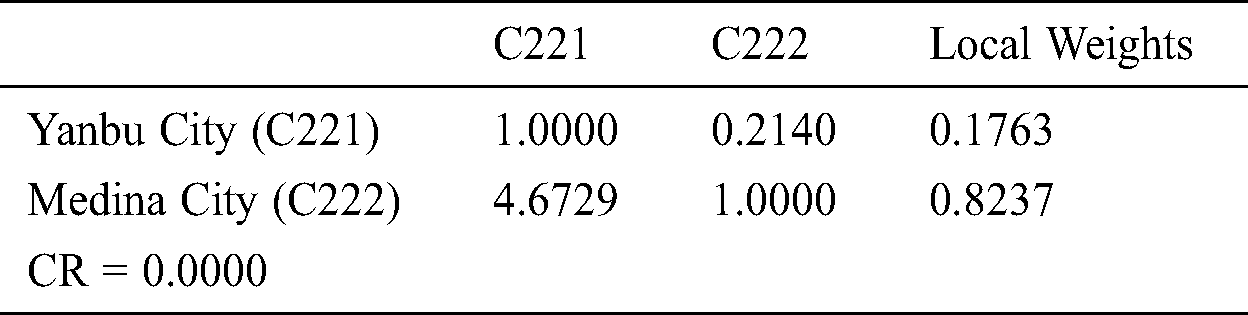
Table 19: Local weights for makkah province cities
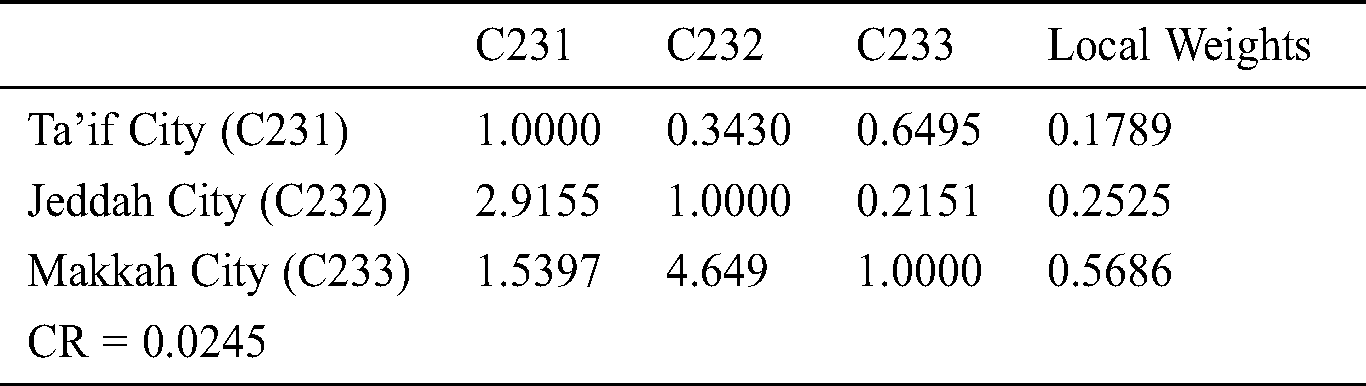
Table 20: Local weights for jawf province cities
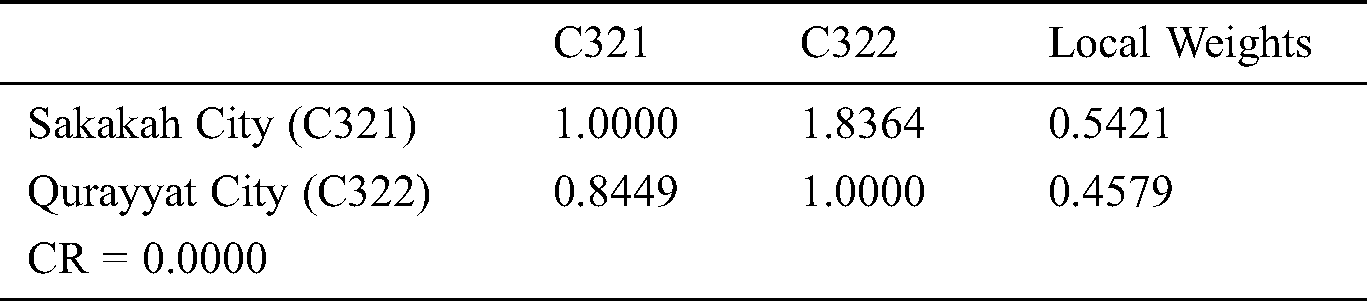
Table 21: Local weights for ‘Asir province cities
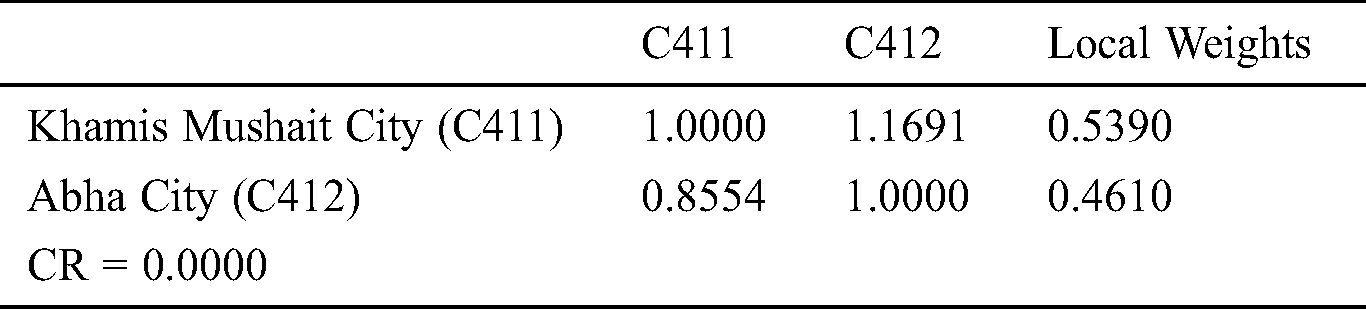
Table 22: Local weights for Riyadh province cities
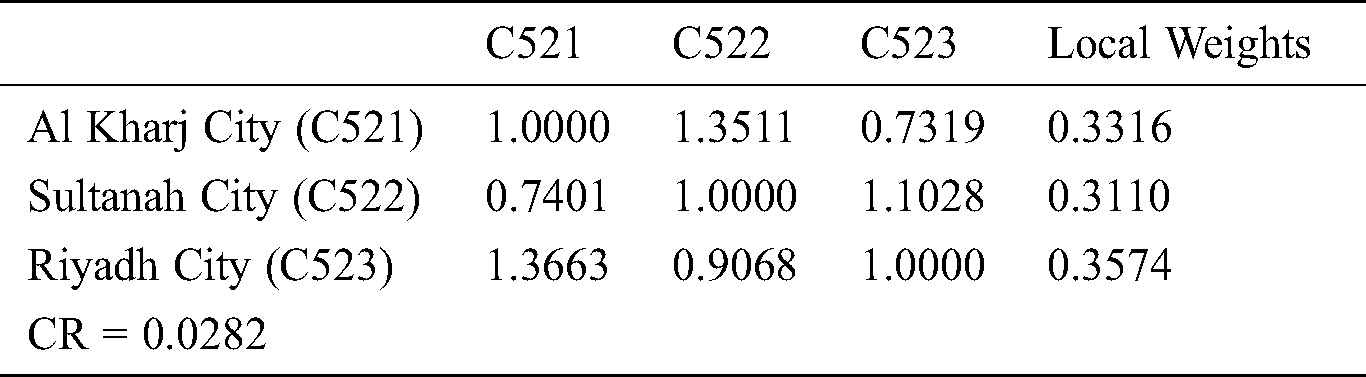
Table 23: Dependent weights of Saudi Arabian regions through the hierarchy
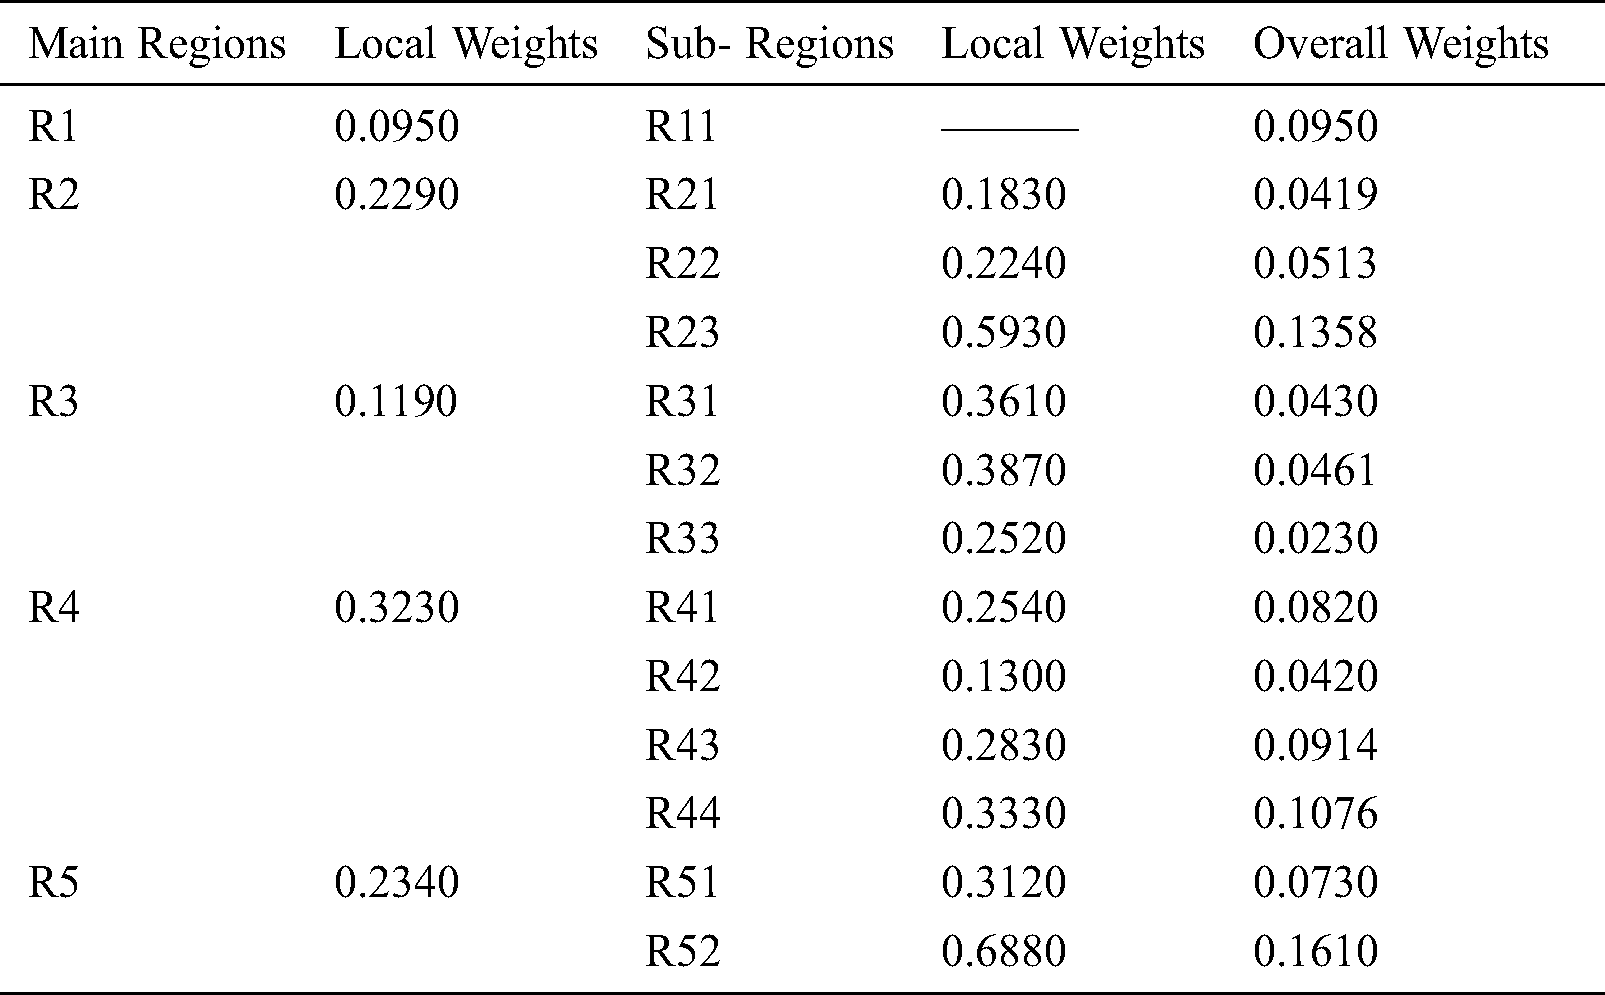
Table 24: Dependent weights of Saudi Arabian cities through the hierarchy
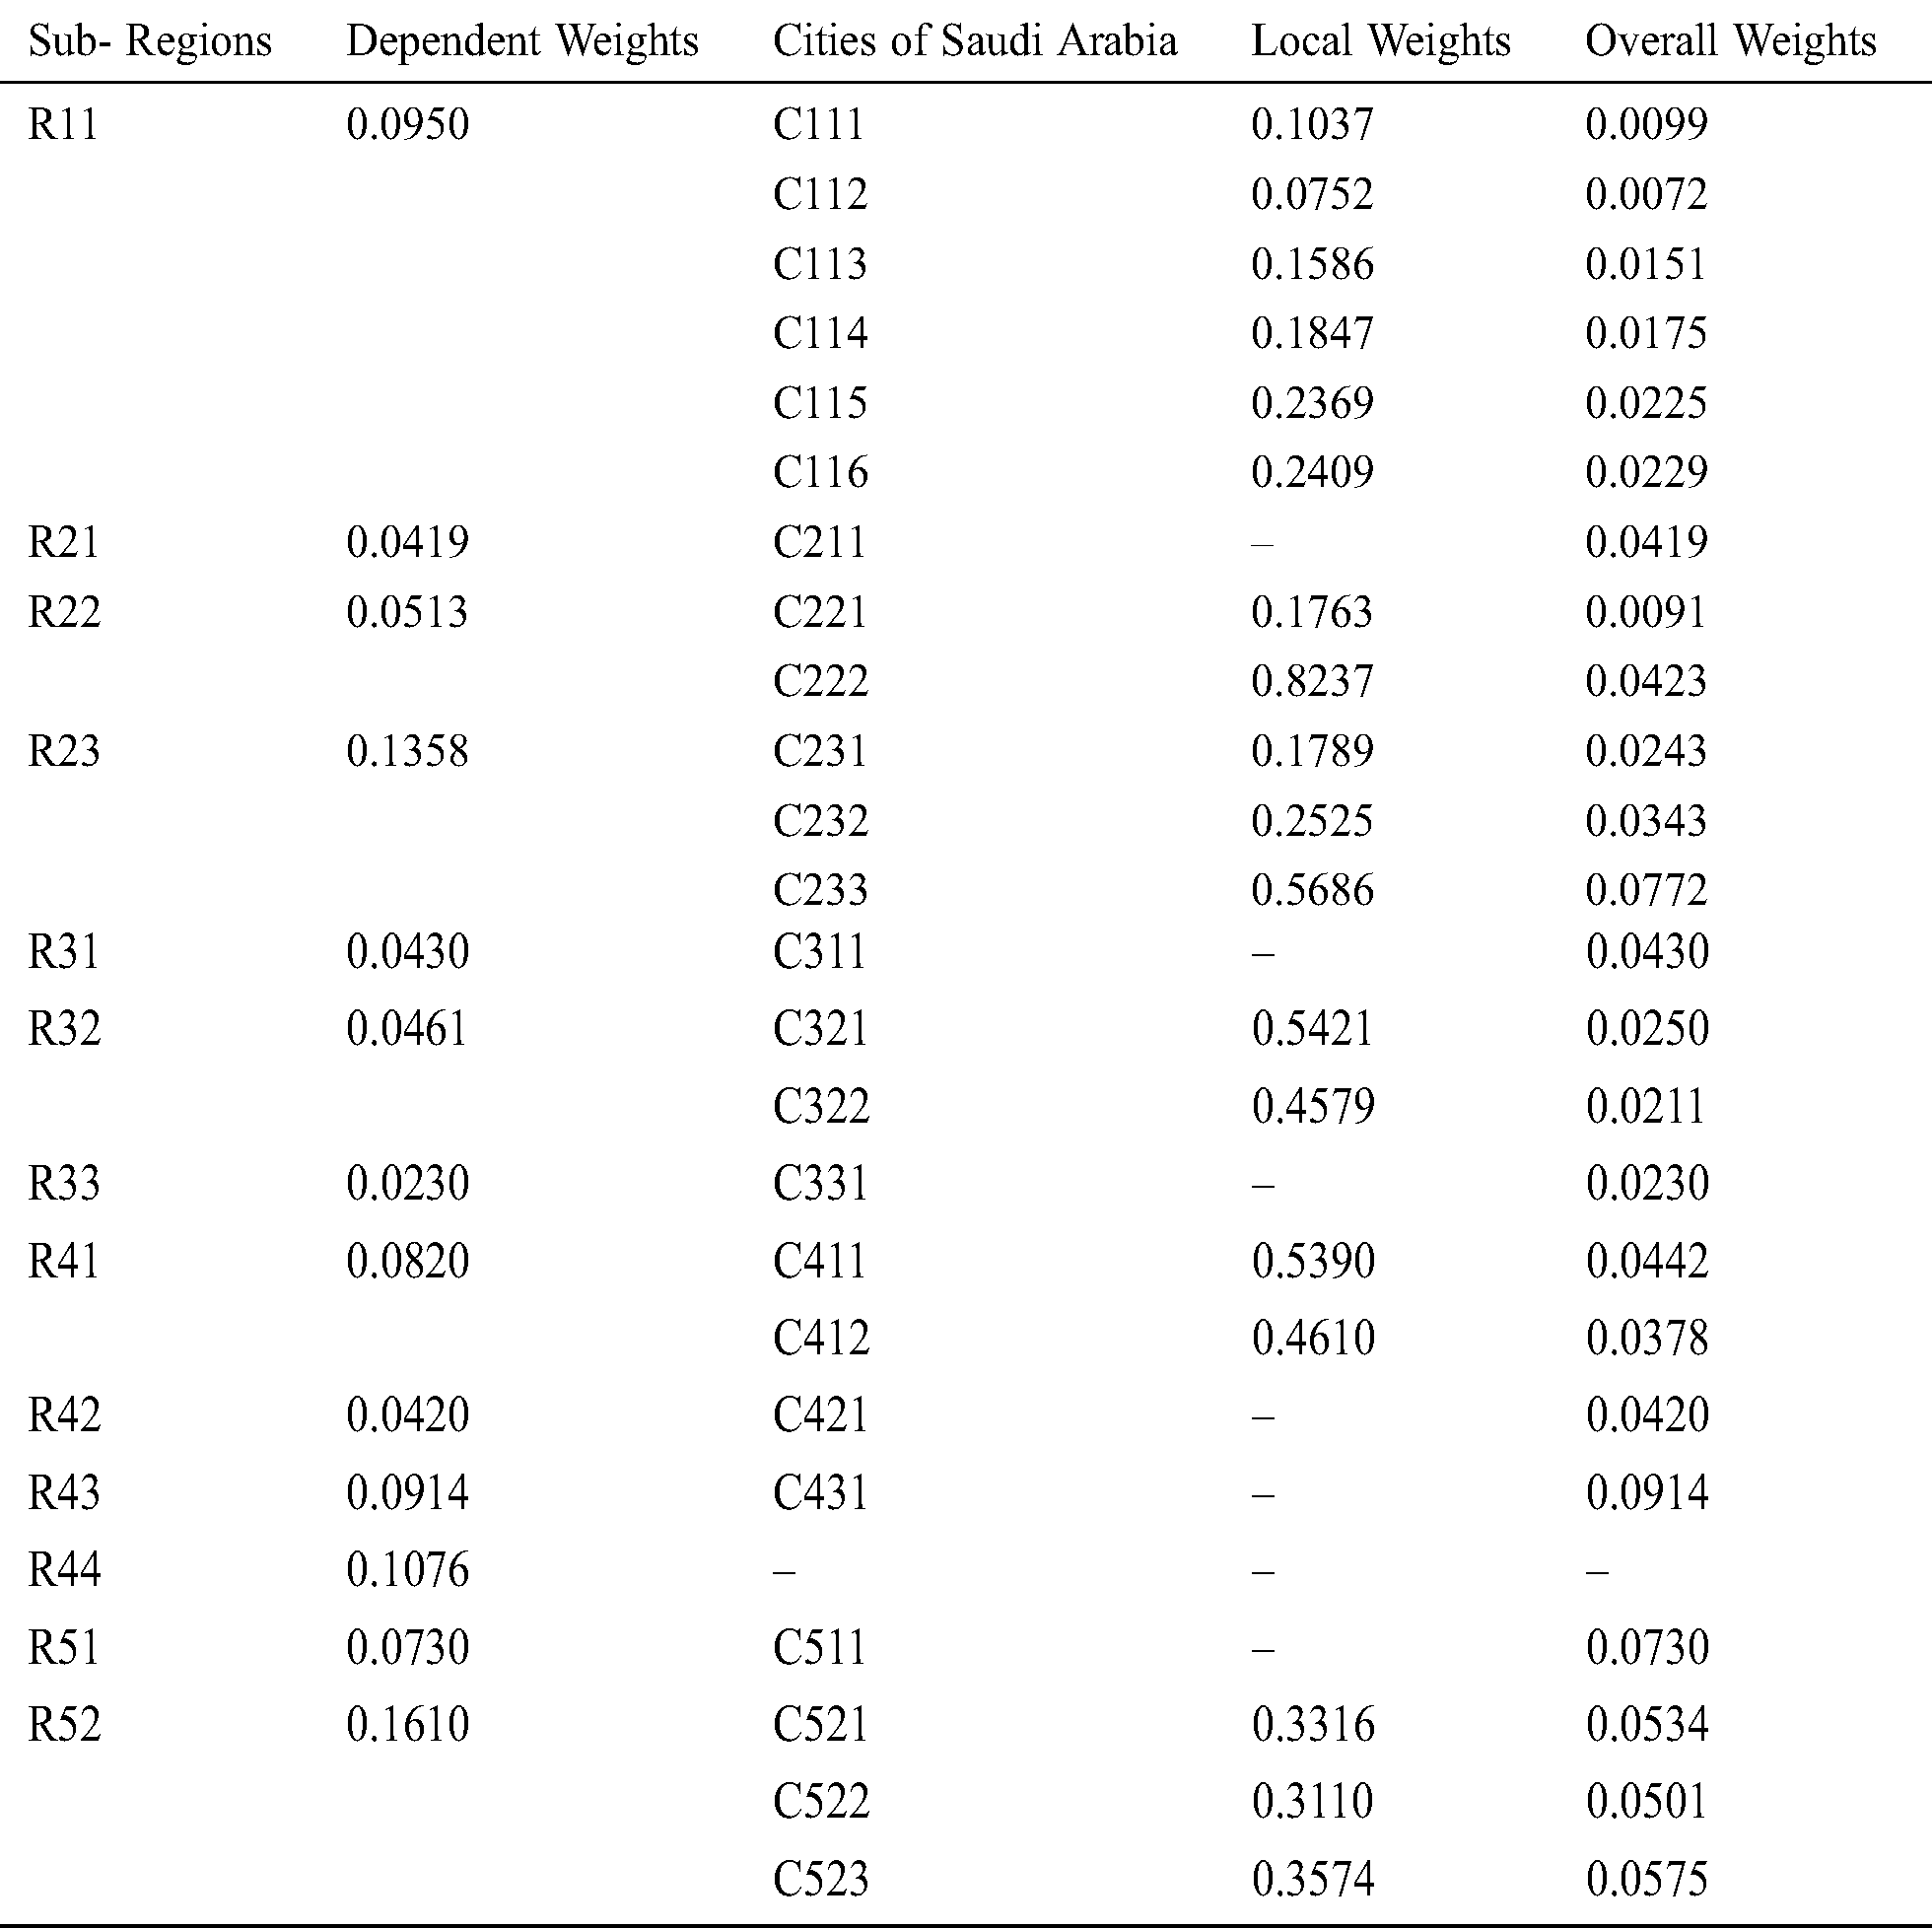
Table 25: Overall weight of Saudi Arabian regions and ranks
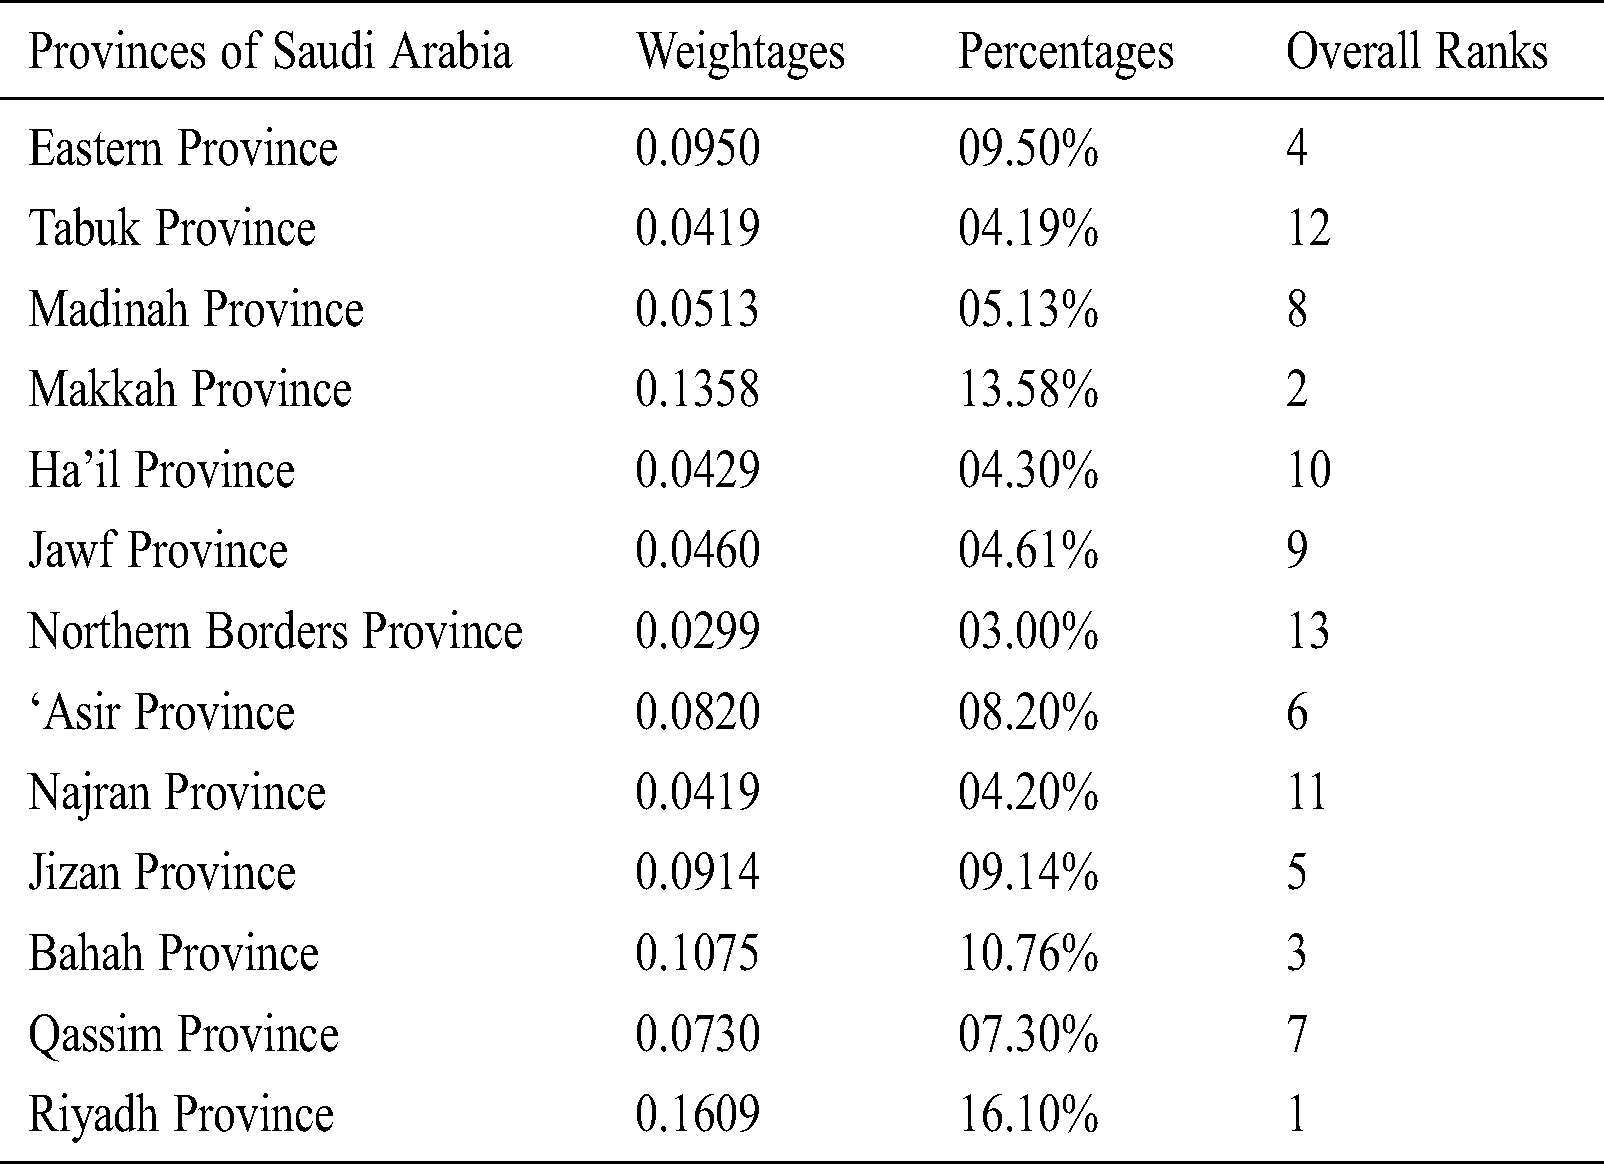
Table 26: Overall weight of Saudi Arabian cities and ranks
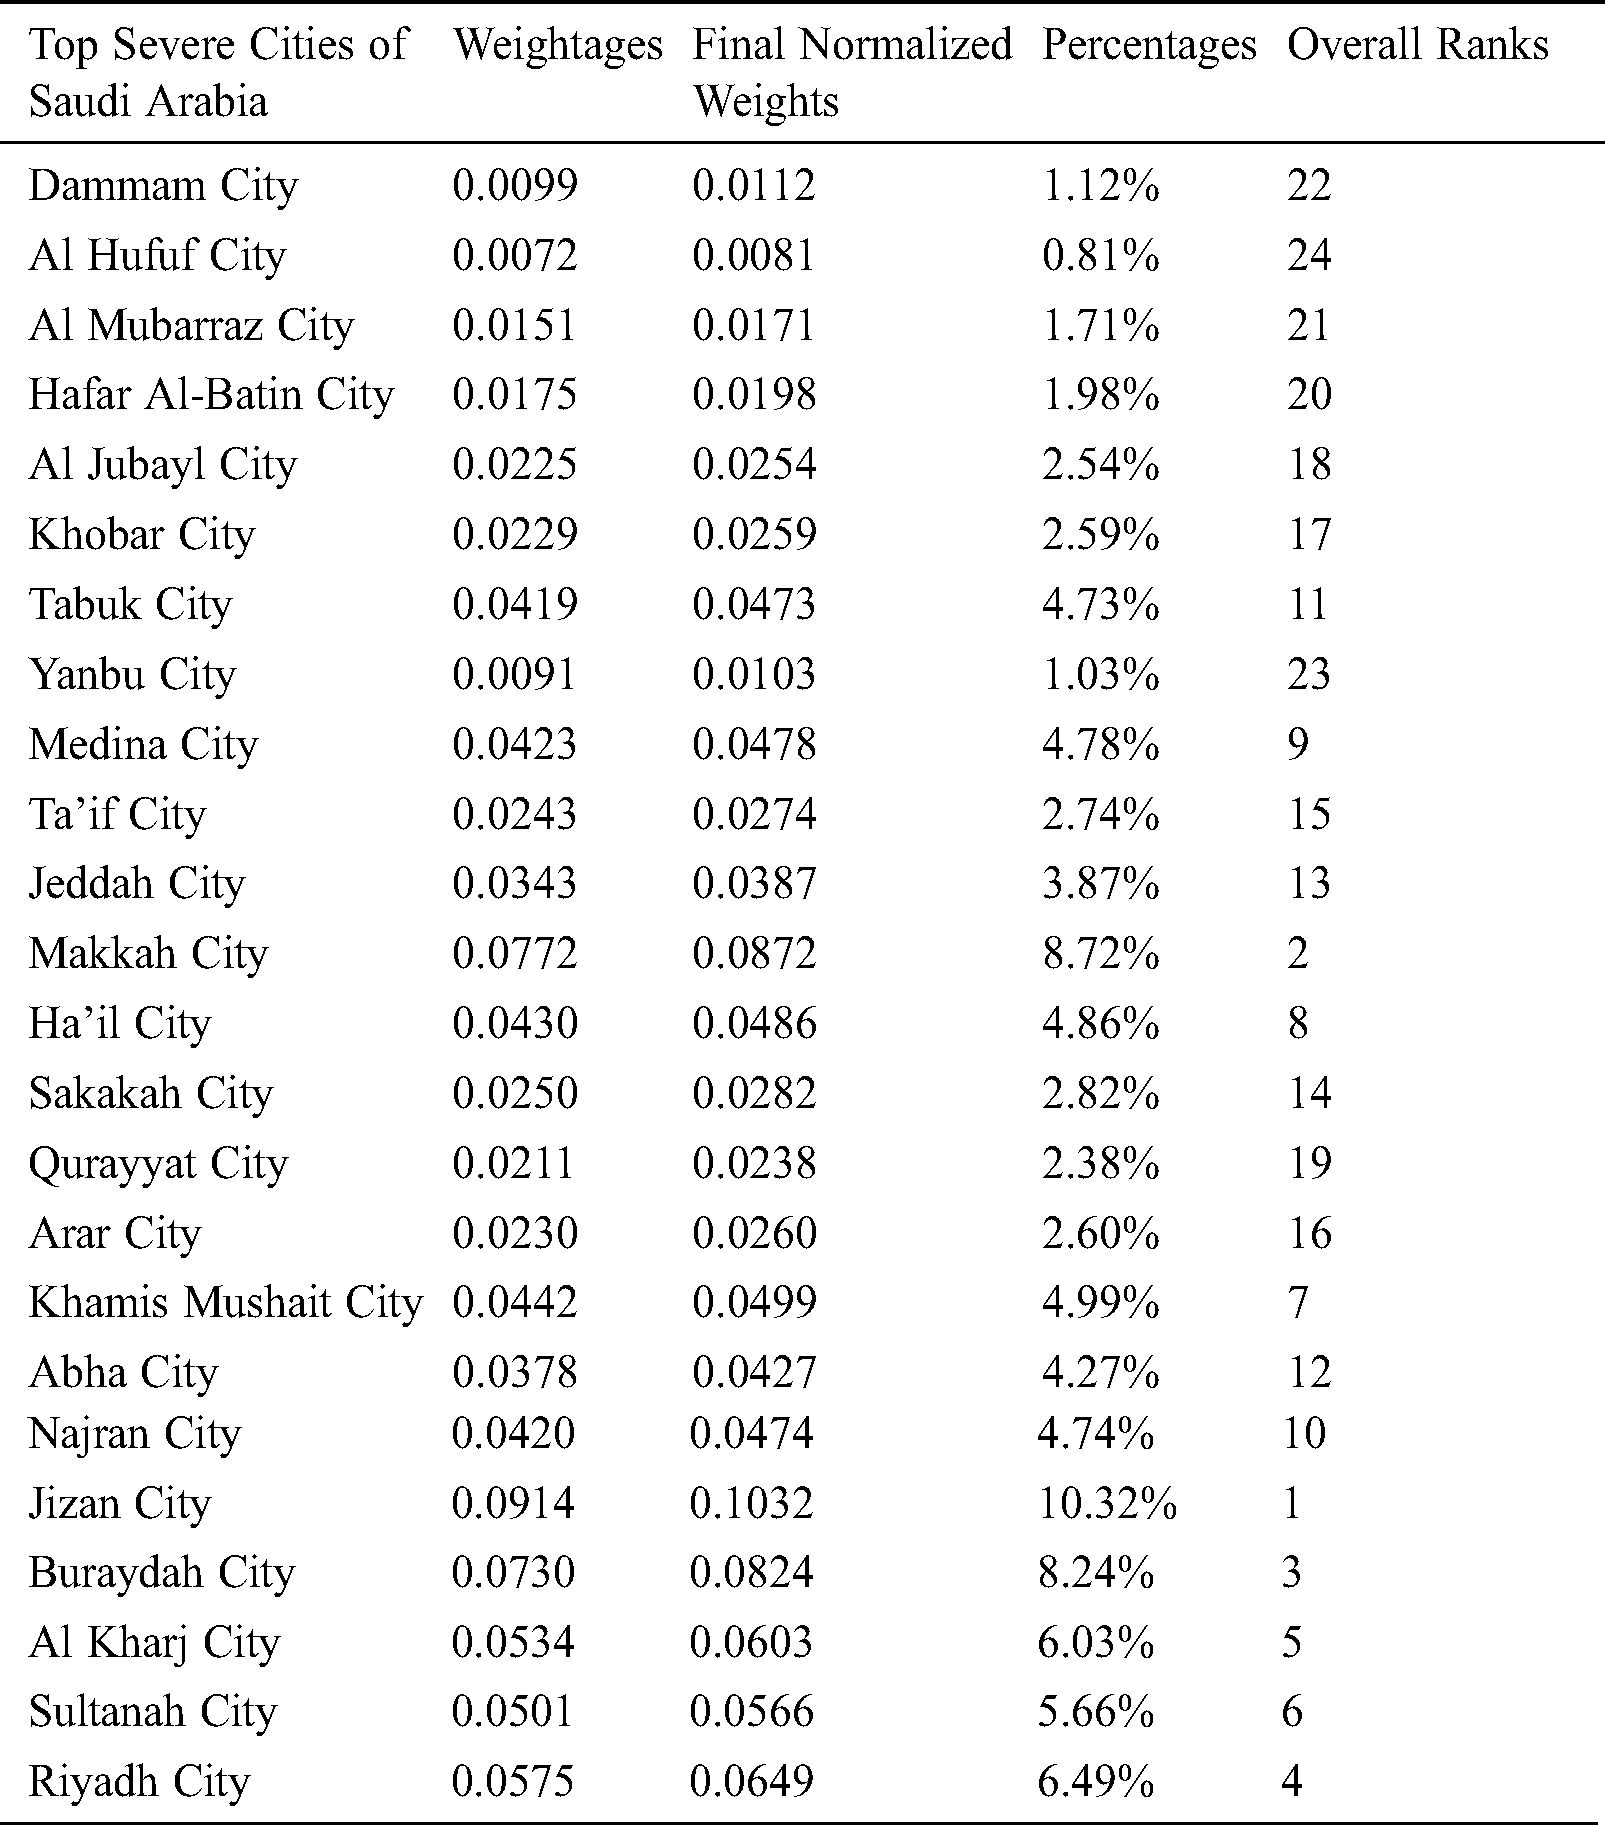
Tab. 25 and Fig. 13 shows that Riyadh with 16.10% and Makkah with 13.58% are most severe regions of contacting the pandemic and might emerge as the possible hotspots of Coronavirus cases. On the other hand, Tabuk with 4.19% and Northern Border with 3% are less severe regions. The minimum severity does not conclude that these regions will not be affected with COVID-19, but due to the higher populations that reside in Riyadh and Makkah, the two cities are at grave risk. Thus, the pace of effectualising containment strategies in these regions needs to be accelerated and must be highly inclusive so that all the residents of the two regions are benefitted at the right time. Further, the evaluated results in the Tab. 26 and Fig. 14 show that Jizan city with 10.32% and Makkah city with 8.72% are at the most severe. On the other hand, Yanbu city with 1.03% and Al Hufuf city with 0.81% are less severe cities. Furthermore, the high prioritized cities can emerge as the potential hotspots for COVID-19 if the preventive measures are not accelerated through effective mechanisms. The pace of effectuating control techniques in these areas should be quickened and should be exceptionally comprehensive so as to benefit all the affected ones.
It is not shocking that Saudi Arabia is also one of the world’s most populous nations; it is the 14th most populated country in the world. Riyadh is the largest city in the country with a population of more than 4 million people, a major contribution to the nation’s entire population. The pandemic COVID-19 spreads rapidly by human to human transmission. Hence, densely populated cities of KSA are obviously at a higher level of risk due to the pandemic. To evaluate the severity of this pandemic in populous cities of KSA, we selected 24 cities and weighted their severity by using Fuzzy AHP methodology. As Saudi Arabia heightens its endeavors to control the deadly disease, a few hazard appraisal components and speculations have been stayed upon and proposed in various research attempts. In any case, our exploration examination endeavored to build up another model for assessment of the states at high risk due to the COVID-19 pandemic.
The upside of this new model is that it can dispassionately and psychologically dissect the spread of Coronavirus in various locales of Saudi Arabia. After an assortment of information for all the districts, authors applied the Fuzzy AHP system for seeing states that are likely as under the most elevated hazard classification due to COVID-19. Results unmistakably show that Jizan City and Makkah City are the most susceptive targets. The decisive research confirmations drawn from our investigation look to be a viable commitment in the Kingdom of Saudi Arabia’s mission of containing COVID-19. The limitation of this work is that only 24 populous cities have been taken in this paper. The severity of the pandemic can be evaluated with big data of other densely populated cities. Furthermore, the proposed approach offers integration of potential approaches that can provide more focus to healthcare services and methods that would efficiently and quickly reduce the spread of COVID-19. The present research has the following practical/ scientific utilities:
• The results from the above computation show that the most vulnerable cities for COVID-19 are Jizan City and Makkah City.
• The proposed research provides a systematic methodology for estimating the severity and could be used as a way for mitigating the risk associated with COVID-19 pandemic.
• With the means to accurately identify the possible Corona hotspots, this research analysis will also aid in reducing the damage caused by the pandemic to a great extent. A timely detection of susceptible zones can help the medical fraternity and the Government to institute quarantine and isolation safeguards at the right juncture and stem the loss of lives due to the contagion.
• The study can be used for enlisting suggestions for managing the impact of COVID-19 in KSA.
The limitations of this work are as follows:
• There are multiple MCDM methods available. Moreover, hybrid methods of MCDM give more precise results than Fuzzy AHP that we have enlisted in our research.
• The dataset used in this work is limited, and the same methodology may give much better results with big datasets.
• Some variables such as α and β may affect the results. Hence the consideration of these variables might be reckoned as yet another limitation of this work.
Acknowledgement: This work was funded by Research and Development Grants Program for National Research Institutions and Centers (GRANTS), Target Research Program, Infections Diseases Research Grant Program, King Abdulaziz City for Science and Technology (KACST), Kingdom of Saudi Arabia, grant number (5-20-01-007-0028).
Funding Statement: King Abdul-Aziz City for Science and Technology (KACST), Kingdom of Saudi Arabia.
Conflicts of Interest: The authors declare that they have no conflicts of interest to report regarding the present study.
1. COVID-19 Coronavirus Epidemic Has a Natural Origin, Science Daily, 2020. [Online]. Available: https://www.sciencedaily.com/releases/2020/03/200317175442.htm. [Google Scholar]
2. Coronavirus cases, COVID-19 Coronavirus Pandemic, Worldometers, 2020. [Online]. Available: https://www.worldometers.info/coronavirus/. [Google Scholar]
3. Corona tracker-Saudi Arabia overview, Corona Tracker, 2020. [Online]. Available: https://www.coronatracker.com/country/saudi-arabia/. [Google Scholar]
4. Largest cities in Saudi Arabia, Mongabay, Population Data, 2020. [Online]. Available: https://population.mongabay.com/population/saudi-arabia/. [Google Scholar]
5. K. Sahu and R. Shree. (2015). “Stability: Abstract roadmap of security,” American International Journal of Research in Science, Engineering & Mathematics, vol. 2, no. 9, pp. 183–186. [Google Scholar]
6. S. A. Khan, M. Alenezi, A. Agrawal, R. Kumar and R. A. Khan. (2020). “Evaluating performance of software durability through an integrated fuzzy-based symmetrical method of ANP and TOPSIS,” Symmetry, vol. 12, no. 4, pp. 1–15. [Google Scholar]
7. R. Kumar, S. A. Khan and R. A. Khan. (2016). “Durability challenges in software engineering,” Crosstalk, vol. 29, no. 5, pp. 29–31. [Google Scholar]
8. A. Agrawal, M. Zaroor, M. Alenezi, R. Kumar and R. A. Khan, “Security durability assessment through fuzzy analytic hierarchy process,” PeerJ Computer Science, vol. 8, pp. 1–43, 2019. [Google Scholar]
9. K. Sahu, R. Shree and R. Kumar. (2014). “Risk management perspective in SDLC,” International Journal of Advanced Research in Computer Science and Software Engineering, vol. 4, no. 3, pp. 1247–1251. [Google Scholar]
10. K. Sahu and R. K. Srivastava. (2018). “Soft computing approach for prediction of software reliability,” ICIC Express Letters, vol. 12, no. 12, pp. 1213–1222. [Google Scholar]
11. R. Kumar, A. Irshad Khan, Y. B. Abushark, M. M. Alam, A. Agrawal et al. (2020). , “An integrated approach of fuzzy logic, AHP and TOPSIS for estimating usable-security of web applications,” IEEE Access, vol. 8, pp. 50944–50957. [Google Scholar]
12. K. Sahu and R. K. Srivastava. (2020). “Needs and importance of reliability prediction: An industrial perspective,” Information Sciences Letters, vol. 9, no. 1, pp. 33–37. [Google Scholar]
13. K. Sahu and R. K. Srivastava, “Revisiting software reliability,” Data Management, Analytics and Innovation (Advances in Intelligent Systems and Computing). Springer, vol. 108, pp. 221–235, 2019. [Google Scholar]
14. A. Agrawal, M. Alenezi, R. Kumar and R. A. Khan. (2019). “Measuring the sustainable-security of web applications through a fuzzy-based integrated approach of AHP and TOPSIS,” IEEE Access, vol. 7, pp. 153936–153951. [Google Scholar]
15. A. Rachah and D. F. M. Torres. (2015). “Mathematical modelling, simulation, and optimal control of the 2014 Ebola outbreak in west Africa,” Discrete Dynamics in Nature and Society, vol. 2015, no. 2, pp. 1–9. [Google Scholar]
16. I. G. Arpin, M. Habib, F. Al-Ayoubi, G. Sutherland, A. Dobrescu et al. (2018). , “Modelling the burden of cardiovascular disease in Saudi Arabia and the impact of reducing modifiable risk factors,” Journal of the Saudi Heart Association, vol. 30, no. 4, 365. [Google Scholar]
17. COVID-19: Saudi Arabia expects 200,000 cases if measures not followed, Gulf News, 2020. [Online]. Available: https://gulfnews.com/world/gulf/saudi/covid-19-saudi-arabia-expects-200000-cases-if-measures-not-followed-1.1586263454490. [Google Scholar]
18. Provincial System, The Embassy of The Kingdom of Saudi Arabia NW Washington, 2020. [Online]. Available: https://www.saudiembassy.net/provincial-system. [Google Scholar]
19. About Saudi Arabia, Statoids, 2015. [Online]. Available: http://www.statoids.com/usa.html. [Google Scholar]
20. The total population, The General Authority for Statistics, 2020. [Online]. Available: https://www.stats.gov.sa/en/indicators/1. [Google Scholar]
21. The world fact book-Saudi Arabia, Central Intelligence Agency, 2020. [Online]. Available: https://www.cia.gov/library/publications/the-world-factbook/geos/sa.html. [Google Scholar]
22. R. Kumar, M. Zaroor, M. Alenezi, A. Agrawal and R. A. Khan. (2019). “Measuring security durability of software through fuzzy-based decision-making process,” International Journal of Computational Intelligence Systems, vol. 12, no. 2, pp. 627–642. [Google Scholar]
23. K. Sahu and Rajshree. (2015). “Software security: A risk taxonomy,” International Journal of Computer Science & Engineering Technology, vol. 7, no. 3, pp. 36–41. [Google Scholar]
24. K. Sahu and Rajshree. (2015). “Helpful and defending actions in software risk management: A security viewpoint,” Integrated Journal of British, vol. 4, pp. 1–7. [Google Scholar]
25. A. H. Seh, M. Zarour, M. Alenezi, A. K. Sarkar, A. Agrawal et al. (2020). , “Healthcare data breaches: Insights and implications,” Healthcare, vol. 8, no. 133, pp. 1–18. [Google Scholar]
26. J. Kaur, A. I. Khan, Y. B. Abushark, M. M. Alam, S. A.Khan et al. (2020). , “Security risk assessment of healthcare web application through adaptive neuro-fuzzy inference system: A design perspective,” Risk Management and Healthcare Policy, Dove Press, vol. 13, pp. 355–371. [Google Scholar]
27. R. Kumar, A. Baz, H. Alhakami, W. Alhakami, M. Baz et al. (2020). , “A hybrid model of hesitant fuzzy decision-making analysis for estimating usable-security of software,” IEEE Access, vol. 8, no. 4, pp. 72694–72712. [Google Scholar]
28. A. Agrawal, A. H. Seh, A. Baz, H. Alhakami, W. Alhakami et al. (2020). , “Software security estimation using the hybrid fuzzy ANP-TOPSIS approach: Design tactics perspective,” Symmetry, vol. 12, no. 4, pp. 1–21. [Google Scholar]
29. R. Kumar, A. K. Pandey, A. Baz, H. Alhakami, W. Alhakami et al. (2020). , “Fuzzy-based symmetrical multi-criteria decision- making procedure for evaluating the impact of harmful factors of healthcare information security,” Symmetry, vol. 12, no. 664, pp. 1–23. [Google Scholar]
30. A. Algarni, M. Ahmad, A. Attaallah, A. Agrawal, R. Kumar et al. (2020). , “A fuzzy multi-objective covering-based security quantification model for mitigating risk of web based medical image processing system,” International Journal of Advanced Computer Science and Applications, vol. 11, no. 1, pp. 481–489. [Google Scholar]
31. R. Kumar, S. A. Khan, A. Agrawal and R. A. Khan. (2018). “Measuring the security attributes through fuzzy analytic hierarchy process: Durability perspective,” ICIC Express Letters-An International Journal of Research and Surveys, vol. 12, no. 6, pp. 615–620. [Google Scholar]
32. M. Alenezi, R. Kumar, A. Agrawal and R. A. Khan. (2019). “Usable-security attribute evaluation using fuzzy analytic hierarchy process,” ICIC Express Letters-An International Journal of Research and Surveys, vol. 13, no. 6, pp. 453–460. [Google Scholar]
33. R. Kumar, S. A. Khan, A. Agrawal and R. A. Khan. (2018). “Security assessment through fuzzy Delphi analytic hierarchy process,” ICIC Express Letters-An International Journal of Research and Surveys, vol. 12, no. 10, pp. 1053–1060. [Google Scholar]
34. A. Agrawal, M. Alenezi, S. A. Khan, R. Kumar and R. A. Khan, “Multi-level fuzzy system for usable-security assessment,” Journal of King Saud University-Computer and Information Sciences, Elsevier, (in presspp. 1–9, 2019. [Google Scholar]
35. M. A. Mohammed, K. H. Abdulkareem, A. S. Al-Waisy, S. A. Mostafa, S. Al-Fahdawi et al. (2020). , “Benchmarking methodology for selection of optimal COVID-19 diagnostic model based on entropy and TOPSIS methods,” IEEE Access, vol. 8, pp. 99115–99131. [Google Scholar]
36. A. Baz, H. Hakami and E. Sharef. (2020). “A framework of computational model for predicting the spread of COVID-19 pandemic in Saudi Arabia,” International Journal of Intelligent Engineering and Systems, vol. 13, no. 4, pp. 526–540. [Google Scholar]
 | This work is licensed under a Creative Commons Attribution 4.0 International License, which permits unrestricted use, distribution, and reproduction in any medium, provided the original work is properly cited. |