DOI:10.32604/cmc.2020.013466
| Computers, Materials & Continua DOI:10.32604/cmc.2020.013466 | |
| Article |
Click through Rate Effectiveness Prediction on Mobile Ads Using Extreme Gradient Boosting
College of Computer Science and Information Technology, Imam Abdulrahman bin Faisal University, Dammam, 34221, Saudi Arabia
*Corresponding Author: Nida Aslam. Email: naslam@iau.edu.sa
Received: 18 August 2020; Accepted: 12 September 2020
Abstract: Online advertisements have a significant influence over the success or failure of your business. Therefore, it is important to somehow measure the impact of your advertisement before uploading it online, and this is can be done by calculating the Click Through Rate (CTR). Unfortunately, this method is not eco-friendly, since you have to gather the clicks from users then compute the CTR. This is where CTR prediction come in handy. Advertisement CTR prediction relies on the users’ log regarding click information data. Accurate prediction of CTR is a challenging and critical process for e-advertising platforms these days. CTR prediction uses machine learning techniques to determine how much the online advertisement has been clicked by a potential client: The more clicks, the more successful the ad is. In this study we develop a machine learning based click through rate prediction model. The proposed study defines a model that generates accurate results with low computational power consumption. We used four classification techniques, namely K Nearest Neighbor (KNN), Logistic Regression, Random Forest, and Extreme Gradient Boosting (XGBoost). The study was performed on the Click-Through Rate Prediction Competition Dataset. It is a click-through data that is ordered chronologically and was collected over 10 days. Experimental results reveal that XGBoost produced ROC-AUC of 0.76 with reduced number of features.
Keywords: Advertisement; XGBoost; random forest; K-nearest-neighbor; logistic regression; click through rate
Bringing business online is the easiest way to gain profits in this era, since it is affordable and accessible globally. Because of online business’ expansion, it is easy for a business page to get lost among millions of other, possibly competitor, businesses. This is the reason why online advertisements become rather necessary for the success of a business. Nevertheless, advertisements have the same problem of possibly getting lost or ignored, This may be caused by widespread clickbait ads that can harm the client’s device and steal personal information. Therefore, it is important to get user’s trust and interest, so that the advertisement is clicked indeed, resulting in a more successful business. To complicate the measurement of ad success, there are multiple success metrics applicable to the clicking of advertisements. Our study has chosen the “Click Through Rate” metric for evaluation.
The Click Through Rate is determined by the number of times the online advertisement has been clicked by a potential client: the more clicks, the more successful the ad is. As mentioned earlier, it is difficult to gain clicks: on average CTR is 0.2%, and this number is computed versus ad views. Thus, it is important to measure the fruitfulness of the advertisement’s subject, specification, etc. to inform business marketers which ads work well and which not [1].
CTR can be predicted using this simple equation: 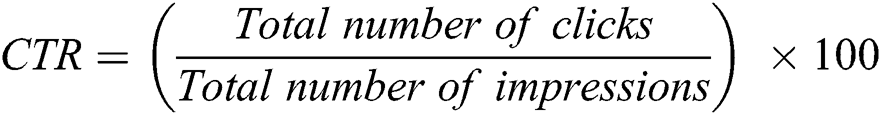 , where impressions means how many times the ad was viewed. Why is CTR
  number of clicks? CTR is calculated only if the user clicked on the add and was interested in it. The number of clicks only does not say much about the success of the advertisement. Machine learning helps to predict the most likely clickable ads, where the machine learns from already labeled datasets. For small businesses with a limited budget on advertisements, using a machine learning CTR implementation will help preserve more money on advertisements to predict the most successful advertisement even before the actual campaign is getting started [2].
The remainder of the paper contains 5 sections. Section 2 contains a literature review on studies related to ad click prediction. Section 3 describes the proposed machine learning techniques XGBoost, Random Forest, KNN, and Logistic Regression classifiers. Section 4 details the empirical study which consists of data description and the experimental setup. Results of feature selection, optimization, and research outcomes are discussed in Section 5. Finally, the study is concluded in section 6.
2 Review of Related Literature
Advertisements have a massive influence on attracting targeted customers, not to mention that the way advertisments are presented affects actual sales. Moreover, mobile advertisements, specifically, are crucial in an environment with time critical competition: who is the first to post an advertisement and who will make profit. For a regular, ongoing advertisement, the historical click information is used to predict the Ads’ CTR, but this method does not work in case of a new advertisement CTR prediction, because there is not enough historical data for these new advertisements.
2.1 Machine Learning Based Approach
Fang et al. [3] present an approach to predict the Click-Through Rate of new ads. The Bayesian Network was used as a framework to establish a model to predict the new ads’ CTR. The first step was to establish the Keyword Similarity model by constructing a Bayesian network of keywords set that describe the ads in specific domains, abbreviated as keyword Bayesian Network (KBN). The second step was to approximate inferences of KBN by discovering the keywords of the ads with known CTRs that was similar to the new ad keywords. Thus, these similarities can be used to find the ads that are related to the new ad. Based on the KBN inference’s outcomes, similar ads that are described by similar keywords will play a role to predict the new ad CTR using the known ads’ CTRs. The experiments were conducted on a test dataset with 27512 keywords. The dataset was constructed by merging all the ads’ keywords. The results revealed the following. (i) The KBN construction method is feasible in case of small number of keywords along with a specific configuration of the hardware. (ii) The KBN inferences were precise to a certain extent with an accepted error average. (iii) As a result, the CTR prediction method of new ads was accurate on average. To improve the proposed method in this study, some future work should be done and that includes improving the KBN constructing method by including the data-intensive computing techniques and improve CTR prediction method accuracy in general. Similarly, as compared to the previously mentioned study, Kondakindi et al. [4] used the same dataset to train and test the model with some modification, such as adding new fields, and remove useless fields. The study used a logistic regression algorithm with proper data pre-processing and achieved the best score for logloss of 0.3938 and got good ranking in the Kaggle competition.
Furthermore, another study made by Dembczynski et al. [5] used decision rules for the CTR prediction of new advertisements. Moreover, they give recommendations to enhance the quality of the advertisements. The study uses the Beyond Search dataset, which was collected by Microsoft and contains 386,857,679 records that describe the quality features of the advertisements. The study consists of two parts. First, the CTR was estimated for existing ads using the maximum likelihood estimation (MLE). This enabled the system to learn all model parameters directly from real historical data. After generating the mathematical function, they compared the results of the proposed model with the naïve Bayes model. The second part was to predict the CTR value for first viewing ads. In order to predict the CTR, they used an algorithm for learning an ensemble of decision rules. The dataset was divided into training, validation and testing sets in the proportion of 25%, 25% and 50% respectively. However, the study suffers from the limitation that the dataset used in the study only contains the quality feature while the contents of the advertisement was missing and therefore, the recommendations are meaningless.
Shi et al. [6] developed a model to predict the CTR and average cost per click (CPC) of a keyword, using several machine learning methods such as Logistic Regression, Random Forest, and Gradient Boosting. The dataset features were categorized into two types: contextual features and historical features. For CTR prediction, the historical features are more useful than the contextual features. The result of the study indicates that linear regression and Random Forest performed well for the CTR prediction, while the Gradient Boosting produced the worst result for both the CTR prediction and the average CPC prediction.
Gai et al. [7] proposed the Pies-wise Linear Model (LS-PLM), which is considered to be a solution for the nonlinear, large scale, and sparse data problem in the CTR prediction domain. The model (LS-PLM) focuses on applications of large scale CTR prediction. It uses a divide-and-conquer approach by dividing the feature space to local sectors and fitting the linear-classification model in every sector. The combinations of weighted linear predictions were generated as a result of this process. The experimental results were found by implementing the algorithm on seven datasets that were generated from a system of mobile display advertising products on different days. The Logistic Regression (LR) Model was also used with the same dataset in order to compare its performance with the proposed model. The aim of the experiments was to evaluate LS-PLM performance, and these experiments revealed that the Pies-wise Linear Model outperformed Logistic Regression and can be employed in CTR prediction systems.
Xiong et al. [8] proposed a model to predict advertising CTR based on users’ behaviors, the prediction was via the logistic regression model. Firstly, the features were converted into meaningful numerical parameters to reduce sparsity and redundancy. Secondly, a down sampling-based algorithm addressed the class imbalance problem. Then, heuristic thinking was used to classify the features, and gradient trees were used to characterize the inductive features. In this work the dataset was an advertising log file based on Tencent SOSO. The performance of the proposed model was higher than the baseline methods with 0.05% R2 and 50.5% RMSE on average. Furthermore, Saraswathi et al. [9] used CTR prediction to find the interest of website viewers in a particular advertisement. The combination of features of various machine learning techniques such as the Naive Bayes Classifier, Logistic Regression, SVM, and Decision Tree. The dataset was gathered by the data scientist and included several features. The model focused on human features like Frequent Time Spent on the Website, Lifetime, Field Revenue, Frequent Internet Usage, and Gender. The accuracy rate was 96% which was much higher than the standard models.
2.2 Deep Learning Based Approach
Deep Learning has also been widely used in the prediction of the Click Through Rate. Edizel et al. [10] developed a Deep Character-Level Click-Through Rate Prediction (LCTR) model for the presence or absence of clicks as labels on binary classification. The study works on two layers i.e. word and character level. The study develops a deep learning model to predict the query and the advertisement CTR with the input into the system as the query. The output of the system is the prediction of the CTR. Both word and character level approaches produced significant results in comparison to the baseline model. The performance of the model highly depends on the feature selection and the word2vec-based approach. The study proved the significance of deep learning for the CTR prediction.
Similarly, Guo et al. [11] also introduced the DeepFM model to integrate the strength of the factorization machines for recommendation and the deep learning for feature learning in a new neural network architecture. The experiments were conducted on two real-world datasets: the Criteo dataset with 90% of the data for training, while the remaining 10% was used for testing, and 7 consecutive days of users’ records from a commercial App for training and 1-day record for testing. DeepFM trained a deep component and an FM component jointly. It gained performance improvement due to several advantages such as: (1) The system does not need any pre-training; (2) The system learns both high and low-order feature interactions; (3) The system introduced a sharing strategy of feature embedding to avoid feature engineering.
Zhang et al. [12] presented a study to address two problems related to advertisement CRT prediction: imbalanced advertising data distribution that leads to inaccurate prediction results, and the dearth of real-time bidding (RTB) for advertisement. The study implemented a Weighted-ELM and an Adaboost Algorithm. The algorithm was implemented using a dataset provided by a Chinese advertising organization that contains an original data log. The Weighted-ELM algorithm was used due to extreme imbalance proportion of negative and positive samples. The experimental results were found by implementing the algorithm on 1% of the training data since it is too large and imbalanced. The positive represents the click records and the negative represents the non-click records, and the proportion of the samples was 3:1000. Two common models were selected, the Support Vector Machine and the Logistic Regression, to conduct a comparison with the ELM model, and the results revealed that ELM performed better on the test dataset. In conclusion, the proposed WELM-Adaboost Algorithm has better performance than the Support Vector Machine and the Logistic Regression models. Further studies on the deep neural network could assist in improving the CTR prediction methods.
Moreover, Wang et al. [13] proposed a feature learning method for advertising data based on deep learning. K-means was used to aggregate similar objects into the same cluster. The study introduced a hybrid model Attention Stacked Autoencoder (ASAE) for advertising CTR estimation. The ASAE model trains a deep component and Factorization machines (FM) component together. Extensive experiments were conducted on two datasets (Frappe and SIGKDD) and then they compared the results with 5 baseline Models. The ASAE model showed a better performance and that due to the following reasons: (1) It does not need any pretraining; (2) It learns both high- and low-order feature interactions; (3) it takes advantage of the attention mechanism in neural network modelling and enhances FM to make feature interactions contribute effectively to the prediction.
Similarly, Zhou et al. [14] proposed an advertising CTR prediction approach based on a combination of a deep neural network with fuzzy logic theory. In this work the following algorithms LR, FM, GBDT+FM, and DBNLR were used as a baseline for performance comparison. The FDNN method has the best performance and LR has the worst performance. LR works well compared with other machine learning methods [6,12]. Another study made by Jiang et al. [15] was performed using the combination of fuzzy logic and deep neural network. The study outperformed several studies that used deep neural networks and is more robust to noise.
Cacheda et al. [16] presented a study that used 3 models: (1) Logistic regression (LR) machine learning model that used a hashing function to minimize the features number; (2) Factorization Machines (FMs) with only two features; (3) The Field-weighted Factorization Machines (FwFMs). Those models were based on two data sets: Criteo CTR data set and Oath CTR dataset. The results show that the FwFMs model has better performance than the other two models, with significantly minimal features. Surprisingly, weighting fields using Factorized machine algorithm outperformed the model that used LR. In addition another study made by Chen et al. [17] used a dataset from Kaggle–Avazu of time-series mobiles adverisements. The study proposed Deep Belied Nets (DBN) which is a fusion model assessment; DBN was powerful, yet simple to deal with. After that, the DBN method was compared with Logistic Regression (LR) and Support Vector Regression. Finally, results showed that the DBN model outperformed the other two methods.
Furthermore, another study was made to capture the user’s interest to the right advertisment for the specific users by using an attentive deep interest (ADI) based model [18]. In addition, four real-world datasets were used to train (Frappe and MovieLens) and test (Books and Electronics) the different models. Moreover, seven methods were compared to explore if ADI has the best results. The study concluded that ADI achieved the best results compared to the other. The study is very useful since it compares seven different deep learning algorithms.
In addition, FiBiNET model was proposed that focused on the importance of features by combining a shallow model and a deep neural network into a deep model [19]. The FiBiNET consists of 6 layers. Two public datasets were used [Criteo and Avazu] to compare between the different models. In conclusion, the FiBiNET model outperformed the traditional machine learning algorithms since it pays more attention to the importance of features. Compared to the previous studies, the study used the most complicated algorithm of them all since it is using 6 layers deep learning algorithms.
All the previous studies reveal the significance of the CTR and the integration of machine learning and the deep learning for the prediction of CTR. Various businesses take CTR as an essential aspect of their advertisements’ campaigns. Machine Learning communities are still exploring new possibilities regarding this subject since it is still a hardcore subject in the field of business. From that perspective, we aimed to fulfill the study that produced better outcome (AUC_ROC) with the reduced number of features. We attempted to test various machine learning algorithms to achieve the most accurate results to benefit the interested parties.
3 Description of the Proposed Techniques
The objective of preprocessing is to achieve a noise free dataset to get the best result from the models. In this stage all records were checked if there were null values or duplicated records. All the duplicated records were dropped to reduce the noises of the dataset. There were no null values in the dataset. The dataset suffered from an imbalanced class distribution and this was treated by data under sampling. Then, labeling encoder was used to convert all string data into numerical data, so it can be fed into the ML algorithms.
The study used four supervised machine learning techniques to predict the click on a specific mobile ad, namely KNN, Logistic Regression, Random Forest, and XGBoost. The proposed methodology contains 2 additional steps for each classifier: (1) Feature selection to choose suitable features for each algorithm. (2) Parameter optimization to choose the parameters that improve the ROC–AUC score for a given algorithm. For each classifier, a different feature selection and optimization technique was applied.
K-Nearest Neighbors classification works by observing the dataset and assigning unlabeled records to a class of the most similar labeled records. KNN mainly depends on the k value which is the number of the most similar neighbors, and it has a significant effect on the algorithm performance. Firstly, KNN starts by choosing the k value, then it finds the closest neighbors by calculating the distance using Eq. 1, the Euclidian distances formula, and finally the process that votes for labels [20].

where x and y are entities to be compared with n attributes.
For KNN, we used a univariate feature selection technique, to select the best features in the dataset. The technique works by assigning a score for each feature based on some univariate statistical tests. Each feature is compared to the class label to check if there is an important relationship between them.
In machine learning, Logistic Regression (LR) is a statistical method that is a popular classification technique to predict the probability of occurrence of a binary event using a logistic function. Moreover, it can handle any number of numerical and/or categorical variables. The logistic function is a sigmoid function, which takes any real value between zero and one [21]. It is defined as:
where x is linear function:
For Logistic Regression Recursive our feature selection relies on feature elimination (RFE). It is a feature selection method used for fitting the model and removing the weakest features repeatedly, until the specified number of features is reached. Because REF requires that an indicated number of features are kept, cross-validation is utilized with RFE to score distinctive feature subsets and select the best scoring collection of features [22].
Random Forest is one of the supervised machine learning algorithms based on ensemble learning. Random Forest combines multiple decision trees resulting in a forest of trees. It can be used for both classification and regression and it has a robust behavior in the features selection phase. Each individual decision tree in the random forest specifies the prediction class and the class with the most votes becomes the final predicted class.
The Random Forest function is represented as follows [20]:
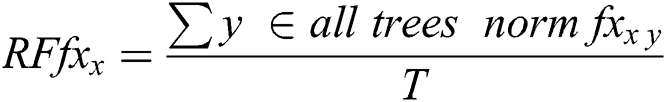
where
•  X sub(x) = the importance of feature x calculated from all trees in the Random Forest model
• normfi sub(xy) = the normalized feature importance for x in tree y
• T = total number of trees
The primary goal of feature selection is to extract the important features to achieve the maximum classification performance. We used an extra tree classifier model to estimate the importance of each feature.
For the Random Forest classifier we used two optimization techniques which are K-fold cross-Validation and Grid Search CV. Cross-validation (CV) is one of the techniques used to measure the effectiveness of the built model. It is also a resampling procedure. Grid search is the process of performing hyperparameter tuning in order to define the best combination of parameters values.
Extreme Gradient Boosting tree (XGBoost) is an ensemble Machine Learning technique based on decision trees with enhancements. This algorithm is built for supervised learning techniques, such as Classification and Regression. The benefit of the algorithm is the enhancement of performance, regularization to avoid overfitting, and built-in cross-validation to choose the optimal number of iterations [23]. The algorithm consists of two main parts: Loss function and Regularization term.
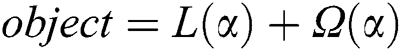
Loss function, usually evaluated by the mean squared error, is used to ensure the ability of the model to predict with the given training data.
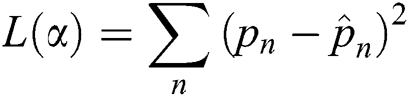
where  is the actual label of the training data and
  is the predicted label of the given training data.
As mentioned before, the regularization term is a term to avoid overfitting and there are various regularization functions that XGBoost can provide.
XGBoost makes decisions by creating weighted ensembled decision trees. XGBoost uses a CART tree which differs from the usual decision tree, since it adds the real score prediction instead of the decision value only. To validate the prediction, XGBoost creates multiple trees to make its decision and sums the total of each tree to come up with the most accurate prediction  The concept above can be written mathematically as:
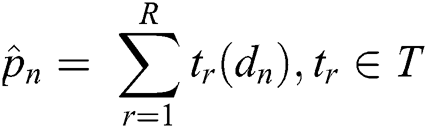
where R is the number of total CARTs,  is the current tree (CART),
  is the training data without labels, and
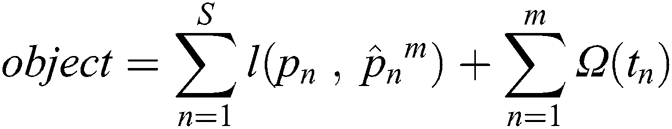
  is the set of all possible trees. Since exploring multiple decision trees is computationally expensive, XGBoost uses a Talyor Function to calculate the value of the loss function for each tree beforehand to optimize the calculation.
The final equation of XGBoost is shown as follows.
XGBoost, as any tree algorithm, has a feature importance function which can tell the importance of each feature based on the given trained model. This function is helpful to know the logic of the model, then, eventually, to improve its performance by removing the least important features.
Parameter optimization for the XG-Boost was done using Grid search as in Logistic Regression and Random Forest. Grid search takes a model, the value of different parameters and then chooses the optimal values of those parameters.
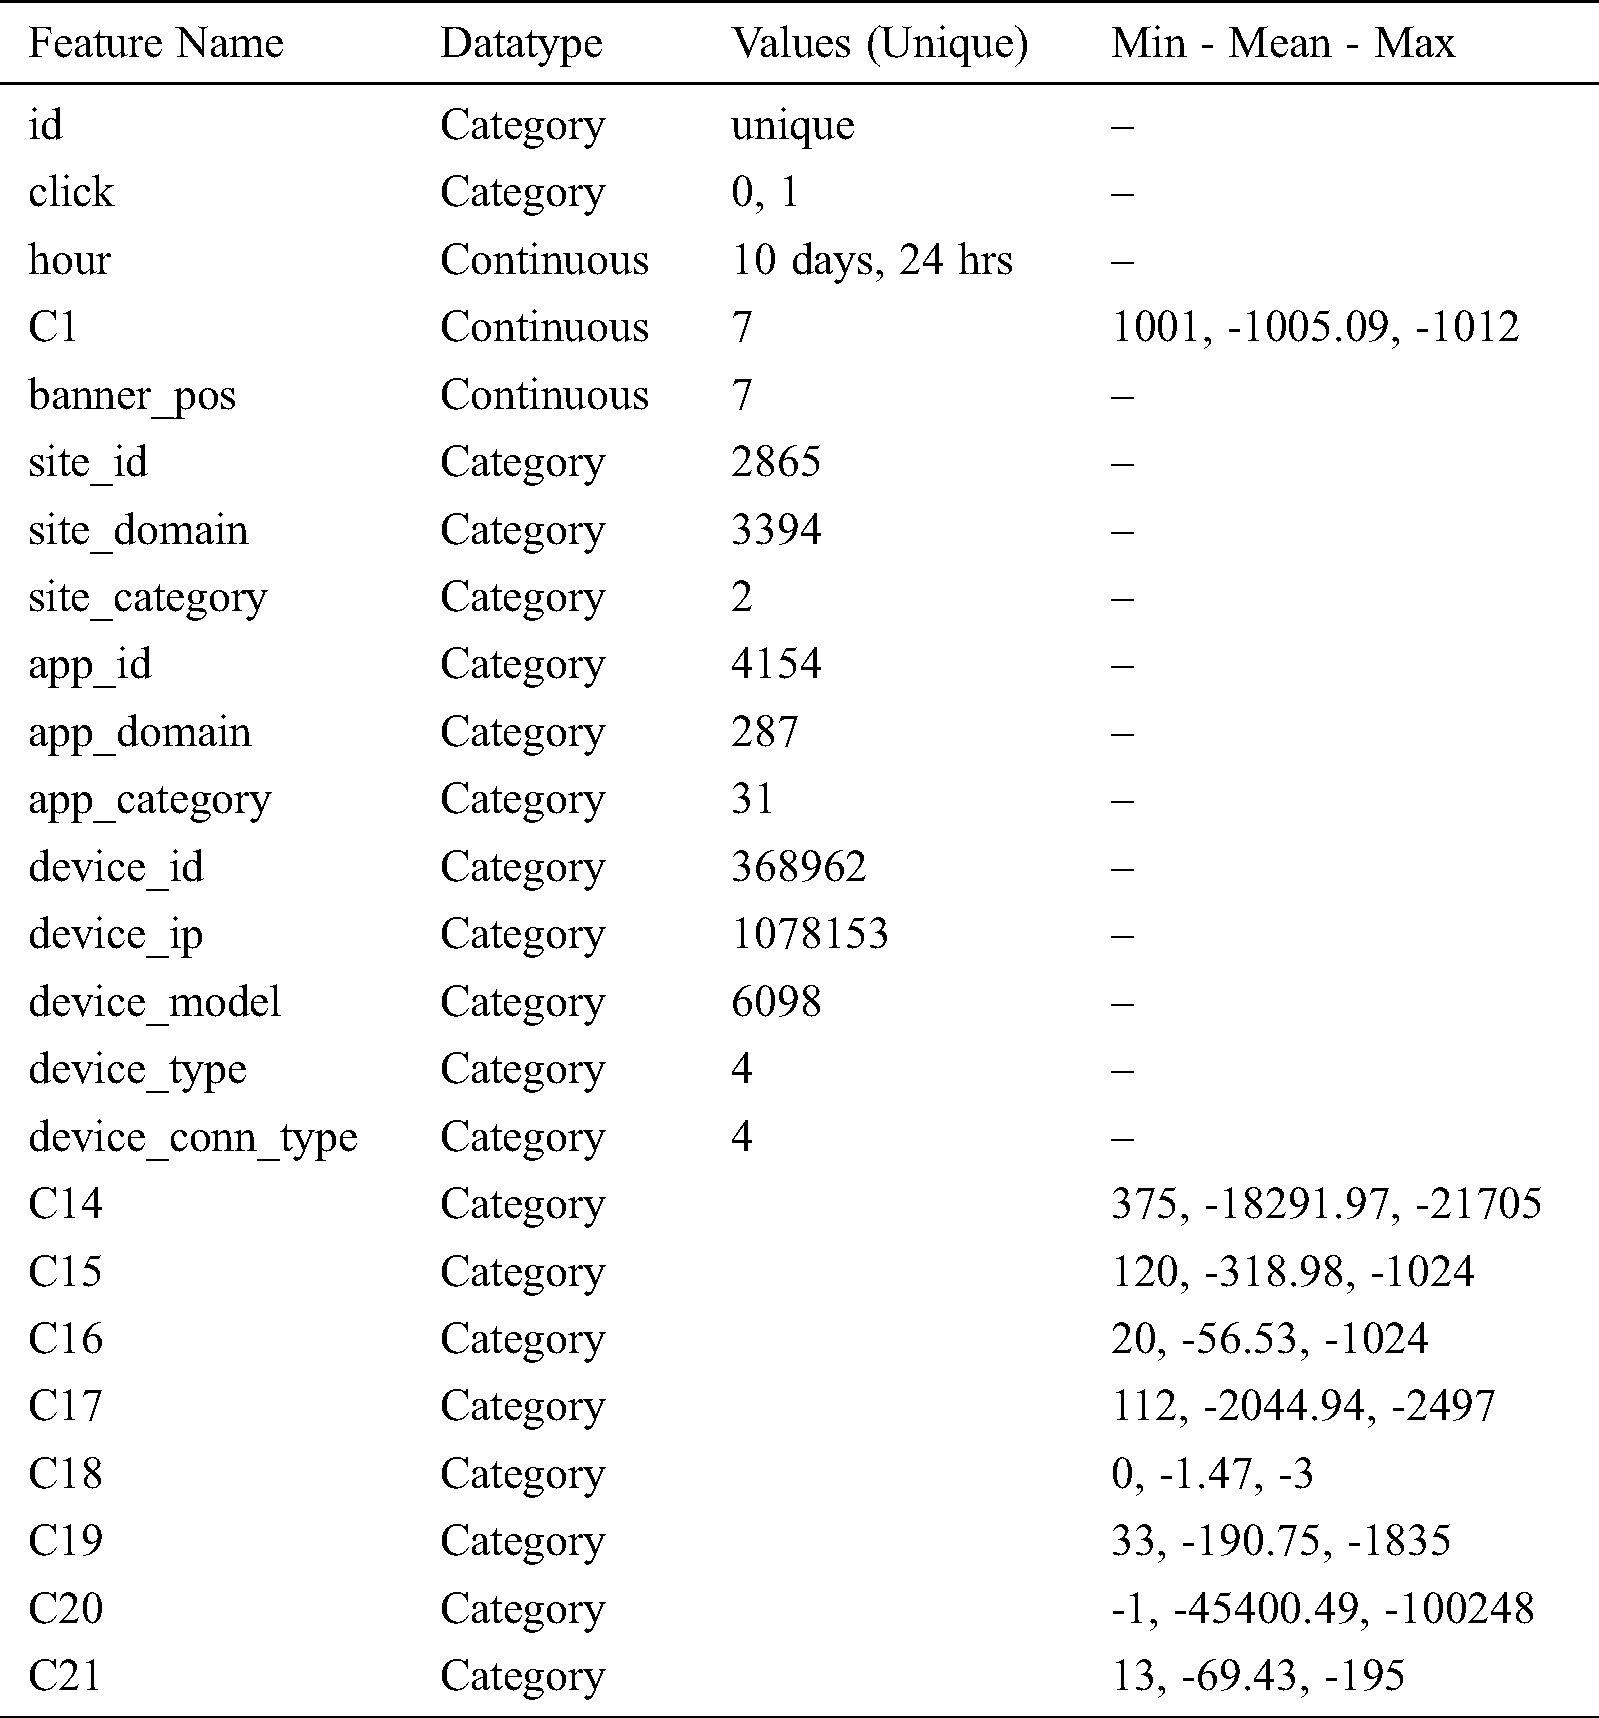
The dataset used in our study is the Click-Through Rate Prediction Competition Dataset from the Kaggle data science community [24]. The original data was collected from Avazu. The total training dataset contains information about 40 million mobile advertisements in 10 days. In our experiments, as a sample, we used 1,048,574 samples with 24 features. The target of the dataset is the click defined by binary values; 0 means no click occurred and 1 means a click occurred. The number of no-clicks is 881,069 while the number of clicks is 167,498, which indicates that the dataset is highly imbalanced. The dataset was used in the Kaggle online competition. As such, the data was partially preprocessed since there were 0 missing values per features and the data types of these records were either categorical and continuous. The statistical analysis of the dataset is presented in Tab. 1. The datatype, mean, maximum, and minimum values of the dataset features are given for each feature.
Table 1: Statistical analysis of the dataset
The study was implemented in Python, with Jupyter IDE. The study used a subset of the dataset with 1,048,574 records. Since the dataset is imbalanced, we had to apply the under-sampling technique to solve the issue. After that, the dataset was encoded using a hash function to convert object type columns to integer type, so it can be fed into machine learning algorithms. Next, the dataset was split into 80% for training and 20% for testing. Finally, four algorithms were trained and tested using feature selection methods and parameter optimization to see which one give the best outcome. These are:
Before implementing any enhancement techniques, KNN gave an acceptable score. After that, the univariate feature selection technique was used, but it gave a bad performance, so all the features in the dataset were used to implement the KNN. After feature selection, KNN optimization was done manually by increasing the k value and trying several values between 5 and 51 to achieve the best performance, but the ROC–AUC score started to decrease when the k value was 31 or more as shown in the Fig. 1.
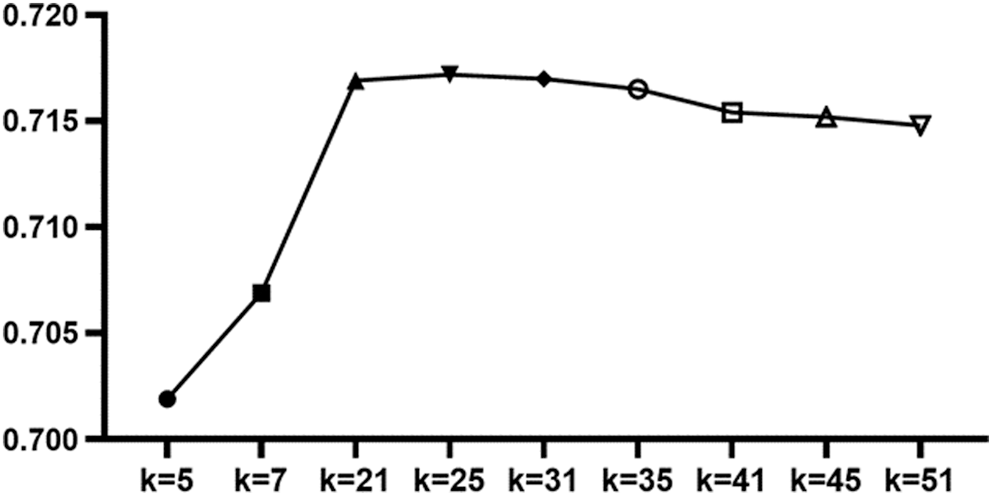
Figure 1: K values and AUC–ROC scores
The optimal value for k =25 gave the highest score of ROC–AUC.
Before feature selection, Logistic Regression gave an acceptable ROC–AUC score. Then Recursive Feature Elimination (RFE) feature selection with Cross-Validation were used to remove the least important features. The remaining features were used to apply Logistic Regression, the ROC–AUC score almost remained the same. Fig. 2 below illustrates the output of features after applying the feature selection technique on LR:
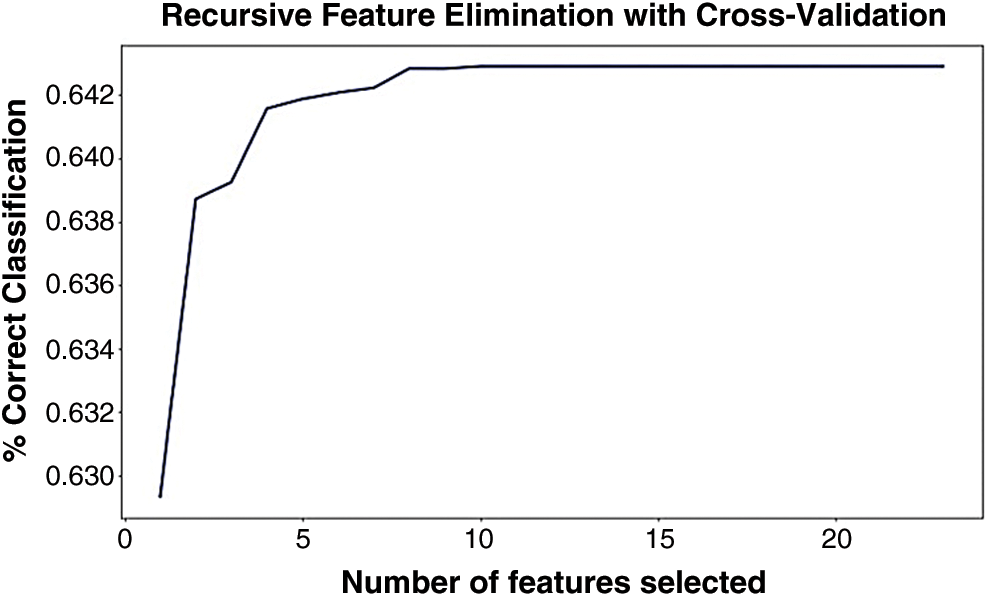
Figure 2: Recursive feature elimination with cross validation with LR
The parameters that used to enhance the LR performance are “C = 300” and “penalty = 12”, Grid search was used to choose the best combination of the two parameters. Applying Grid search did not provide the expected results since the ROC–AUC score did not change. Fig. 3 provides more clarity regarding applying Grid search on LR.
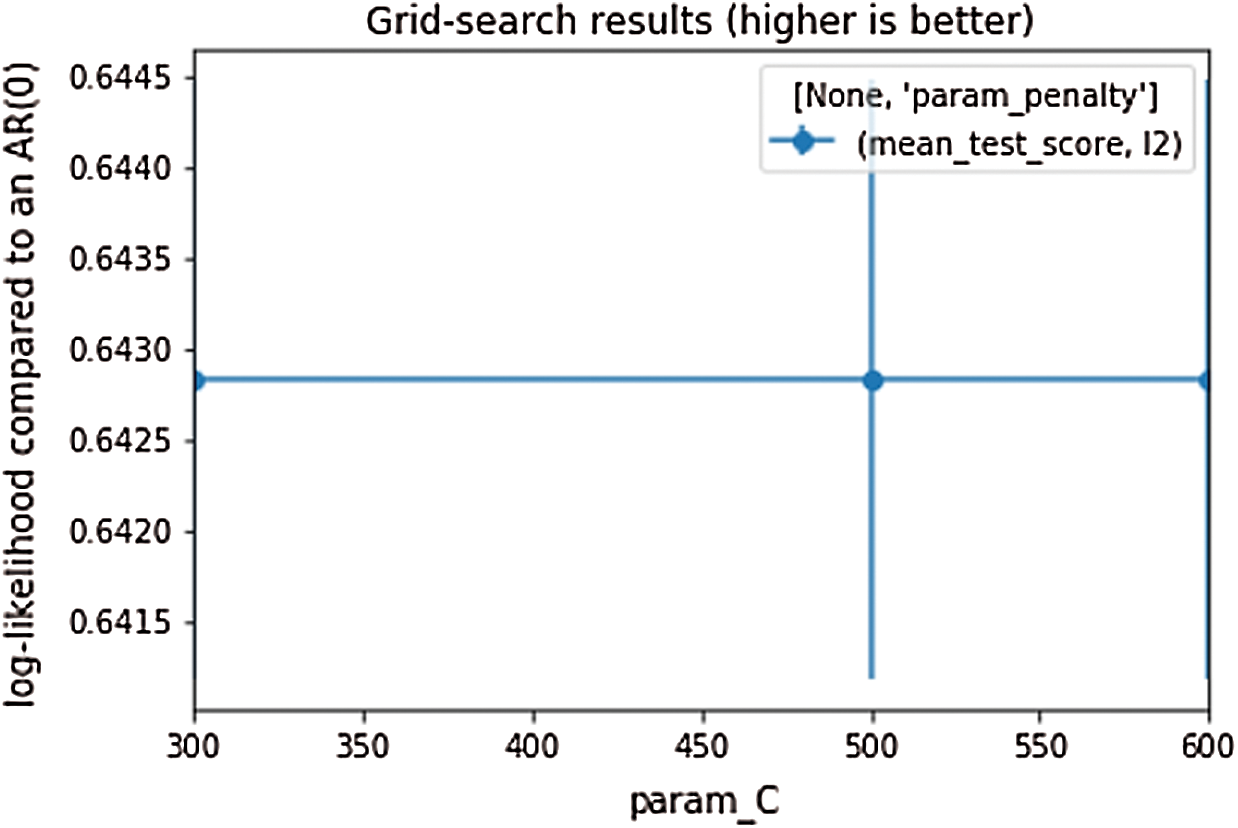
Figure 3: Grid search for LR
Before feature selection, Random Forest gave a high potential in CTR prediction. To start the feature selection experiment, we used the feature importance method to find the most important features in ascending order, as shown in Fig. 4. The six least important features were dropped, one by one, until the performance increased.
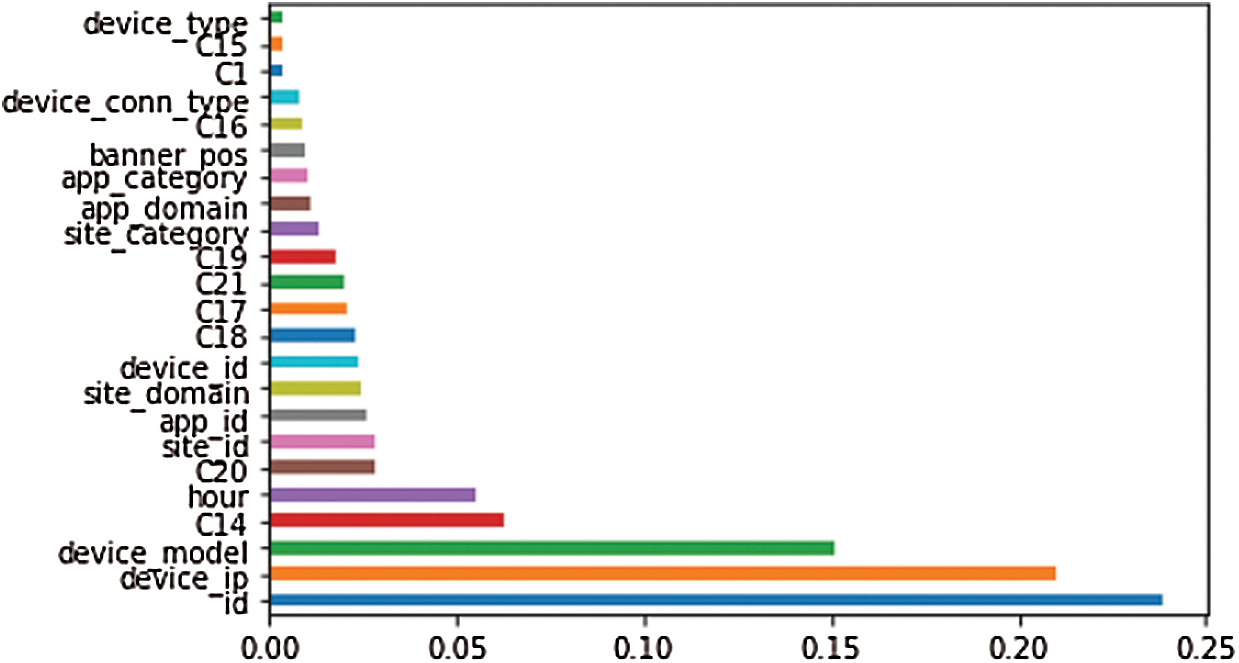
Figure 4: Feature importance random forest
After feature selection, parameter optimization was done using K-fold validation and Grid search. When K-fold validation was used with 10 folds were used to split the dataset and trained the model. After using the 10-Fold cross-validation the ROC_AUC score decreased. When Grid search was implemented, two hyperparameters (i.e., max_depth=14, and n_estimators=200) were used to improve the performance of the algorithm. After training the model, the ROC_AUC score became better as shown in the Fig. 5.
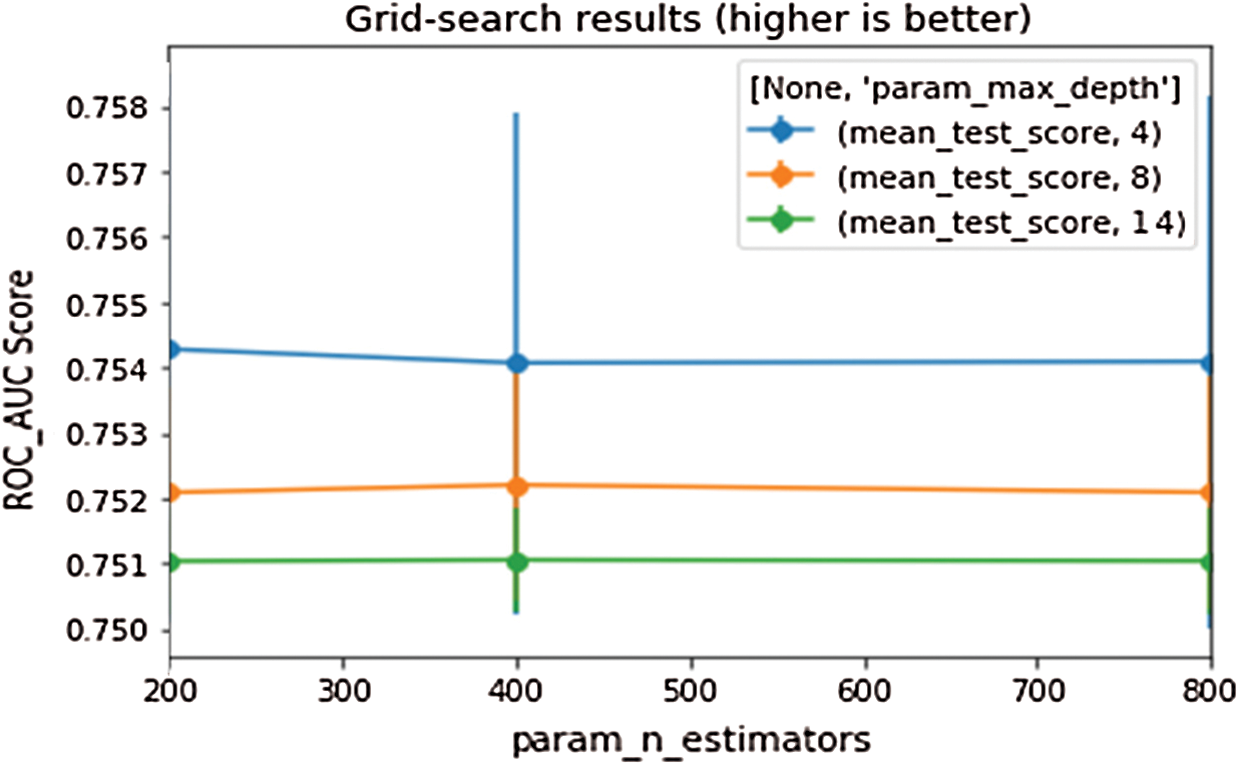
Figure 5: Grid search with random forest
Before feature selection, XGBoost also showed a high potential in CTR prediction. Feature importance method was implemented as Random Forest. After performing the function, the output of features in ascending order are shown in Fig. 6. The algorithm’s ROC_AUC score improved after deleting the four least important features.
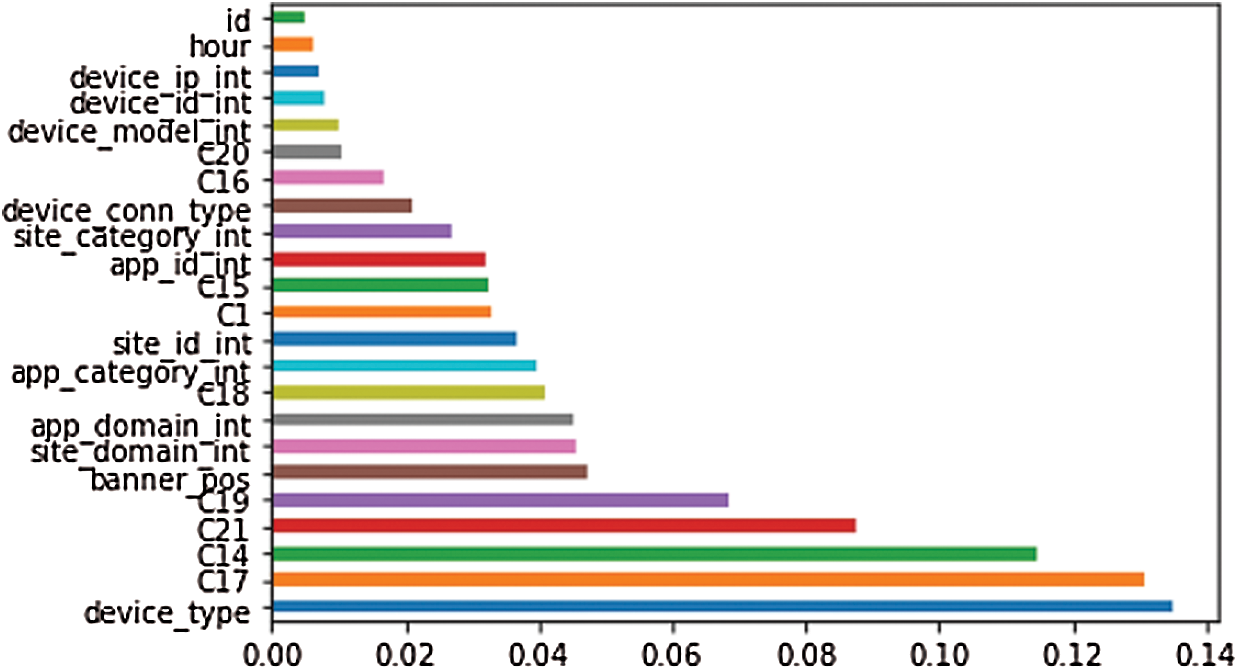
Figure 6: Feature selection XGBoost
The experiment was then conducted for parameter optimization. The Grid search mechanism was used. Two parameters in XGBoost were used to improve the performance of the algorithm, namely: max_depth=6 and n_estimators=200. Max_depth is the parameter that controls overfitting, in which the algorithm can learn more relationships with more depth. N_estimators is the number of decision trees that can be created to choose the correct label [25]. As a result the XGBoost algorithm was enhanced, as shown in the Fig. 7 below.

Figure 7: Grid search with XGBoost
The evaluation parameter used in our study to explore the effectiveness of the proposed study was the ROC–AUC score, since it is the most used measure in binary classifications with two parameters: False Positive Rate (FPR) and True Positive Rate (TPR). This measure can tell whether the given algorithm is able to differentiate between different class labels [26]. Tab. 2 below shows the results and discussions of various experiments performed on the same dataset. The selection criteria for the benchmark studies is based on the particular dataset. All the studies in the benchmark used the same dataset like us. The table is a benchmark to compare the achievements of previous studies with the results achieved in this study.
Table 2: Comparison between previous studies and the proposed study
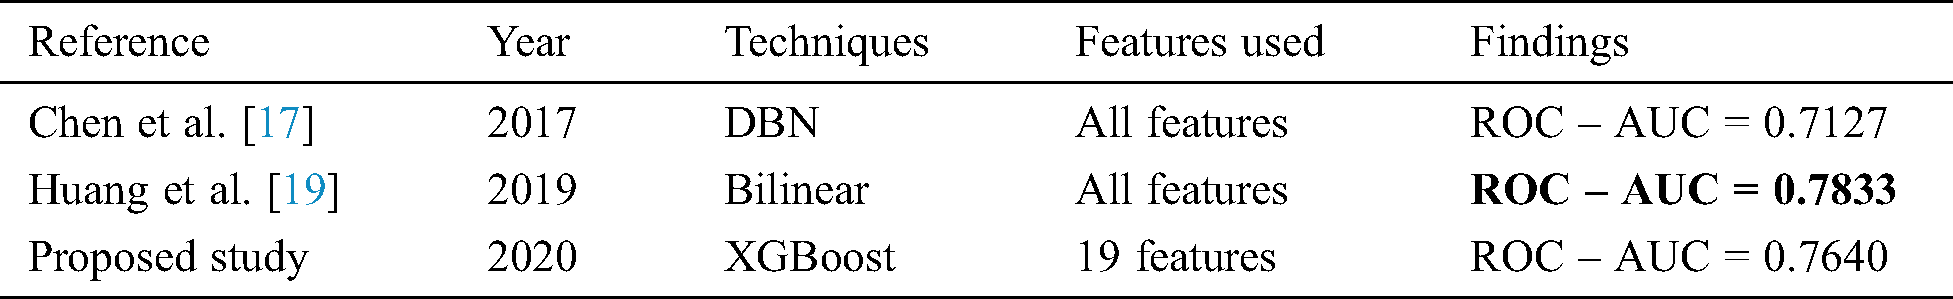
Compared to Chen et al. [17] the our model performed better (see Fig. 8): they used 3,710,696 records of the dataset, while we used 334,996 after imbalance elimination. However, the proposed model does not achieve the maximum score as Huang et al. [19] models, and the reasons behind this is that they used a deep neural network technique with 6 layers and with all the features in the dataset, technique that is complex but most importantly computational intensive. The proposed study used less features as compared Huang’s study.
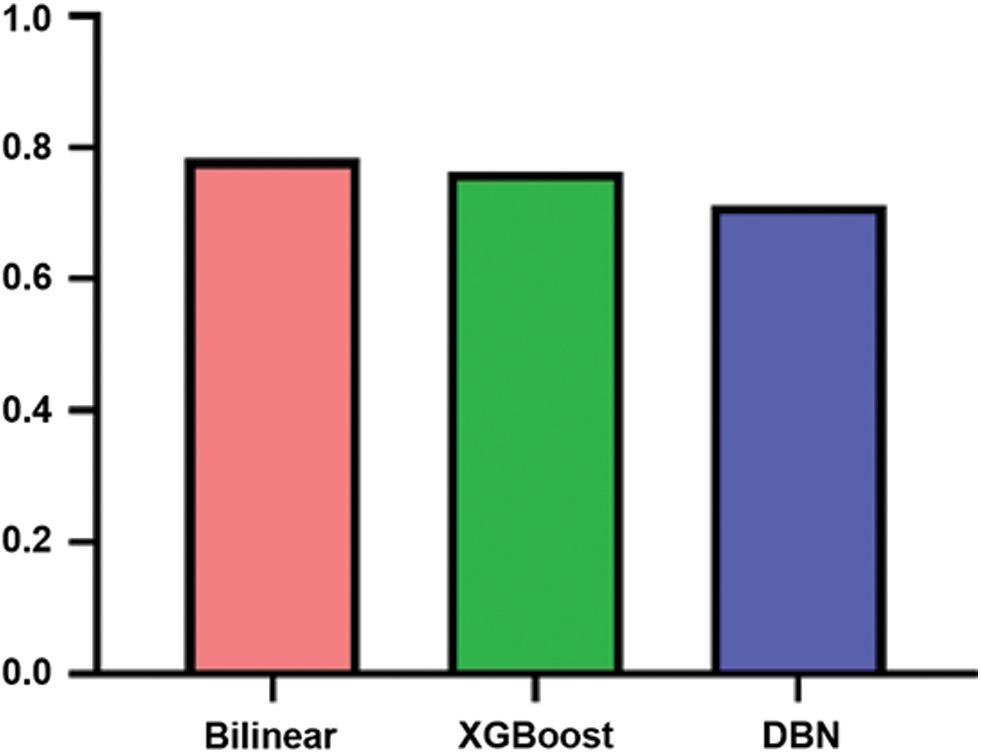
Figure 8: ROC–AUC comparison between the proposed and benchmark studies
5.1 Results of Investigating the Effect of Different Classifier Techniques on the Dataset
The results showed that the XGBoost algorithm outperforms the remaining three algorithms which are Random Forest, Logistic Regression and KNN, While LR shows the worst performance among all the applied algorithms, see Tab. 3. The histogram representation for the ROC_AUC score for all the classifiers with the optimized parameter are shown in the Fig. 9.
Table 3: Comparison between all the applied algorithms in the proposed study
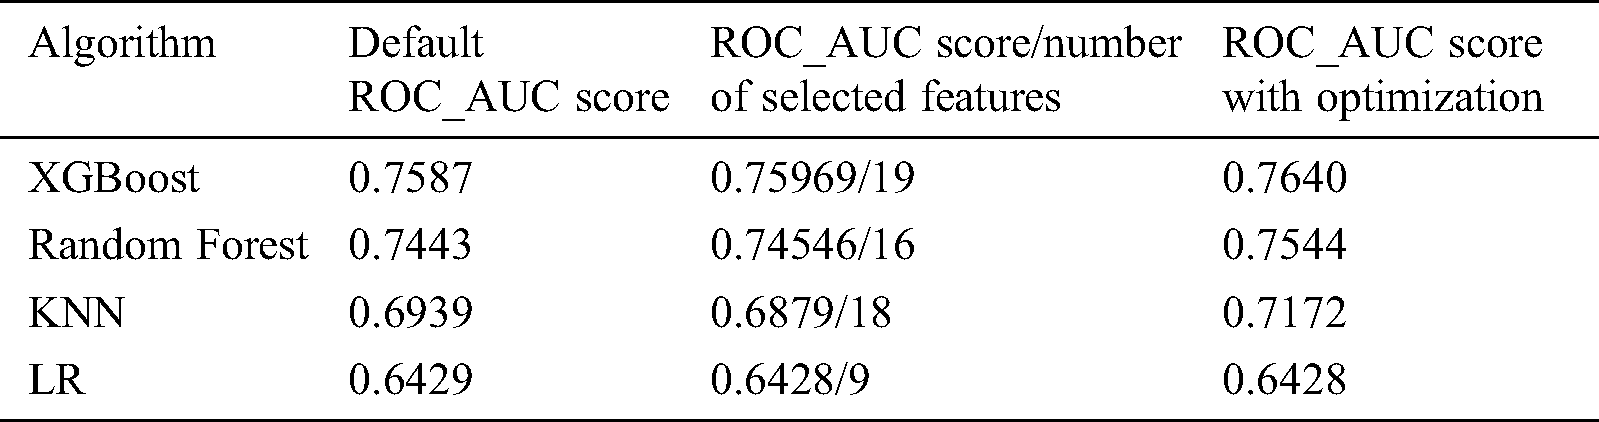
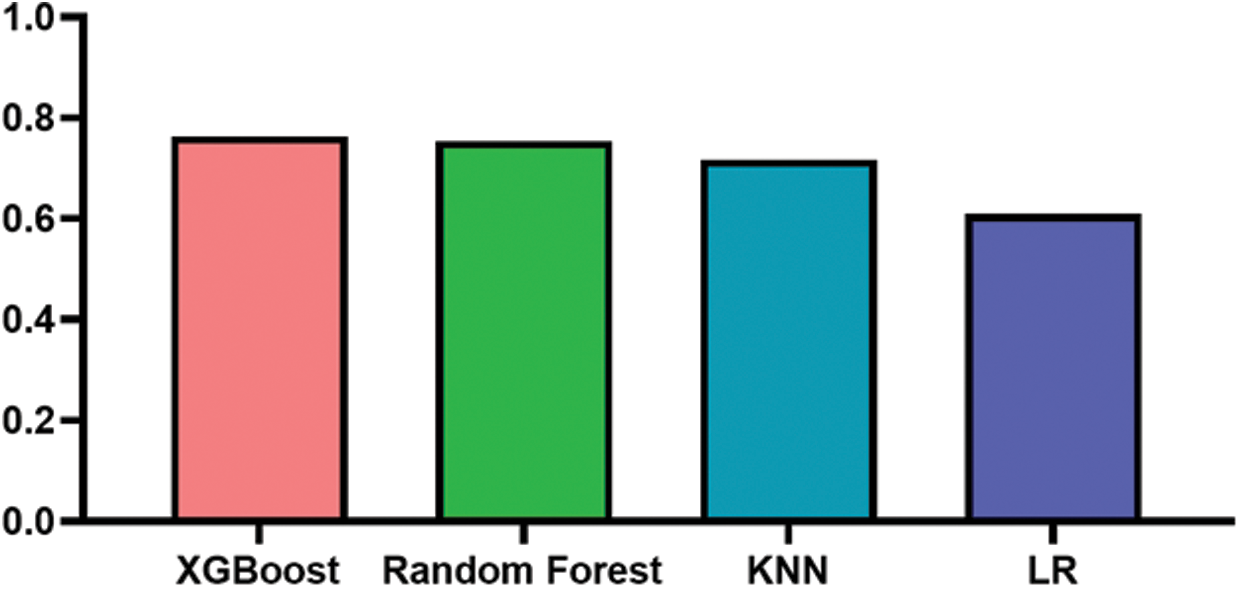
Figure 9: Comparison histogram representations between the applied techniques
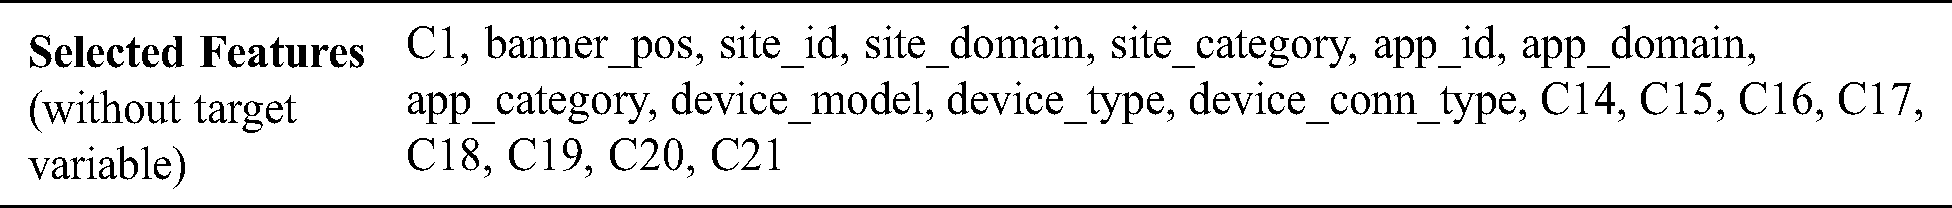
In our study, 80% of the records were used for training and 20% were used for testing, XGBoost outperformed all the other algorithms with 19 features and optimal values of max_depth=6 and n_estimators=200, see Tabs. 3, 4 lists all the features used in the study. Fig. 10 represents the AUC-ROC curve of the XGBoost.
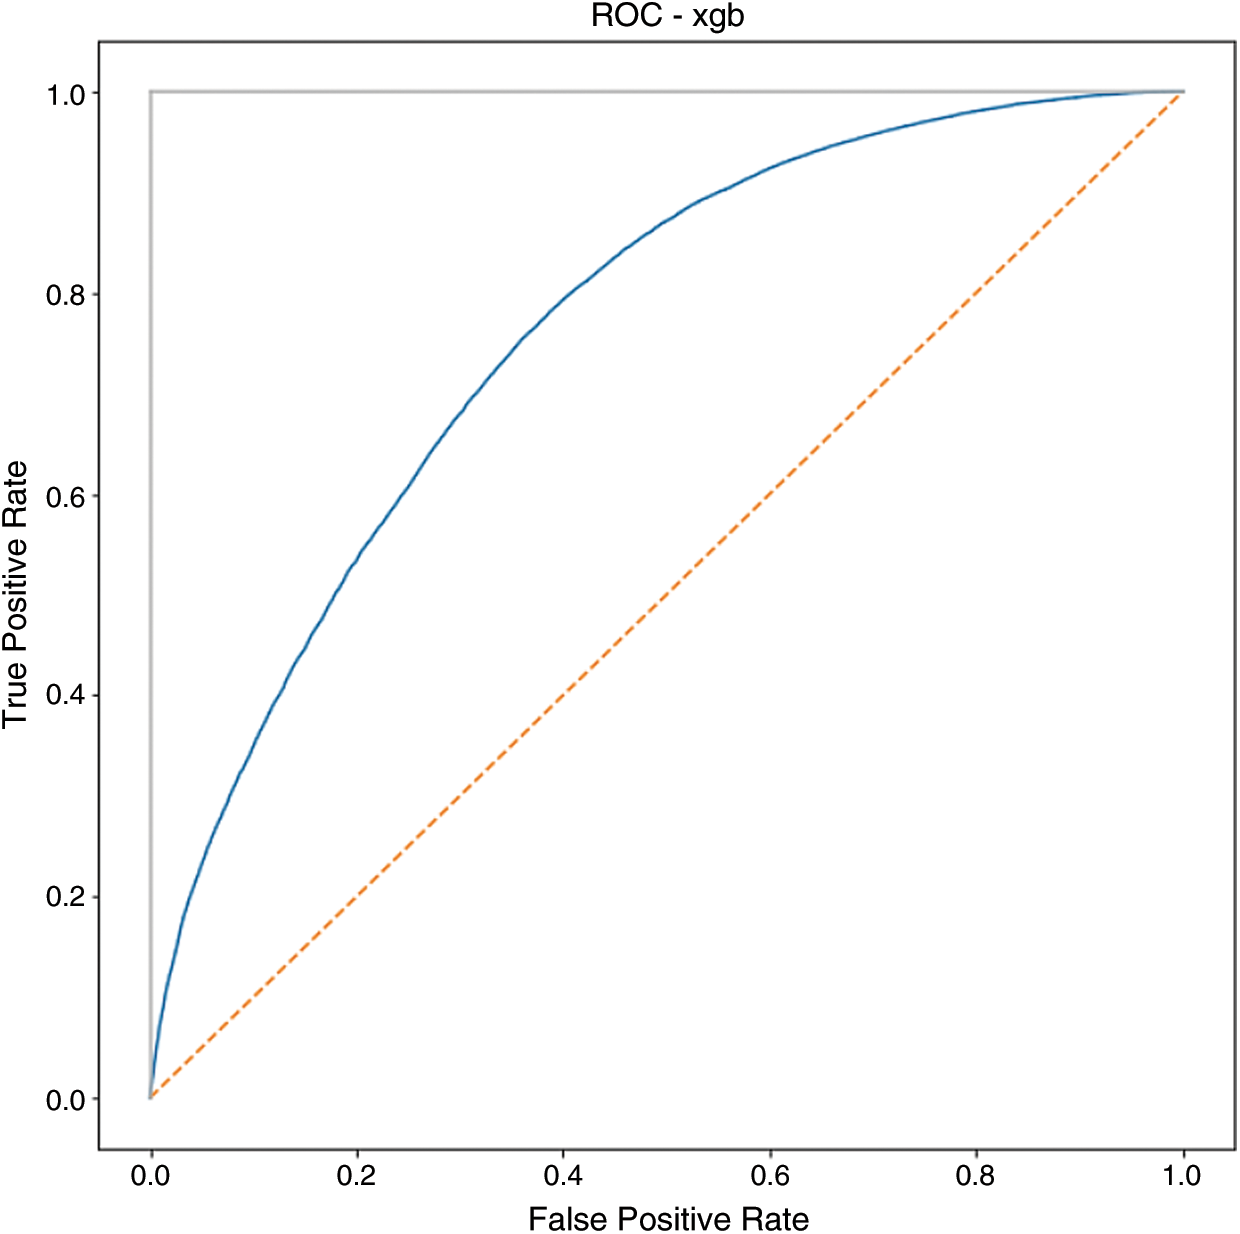
Figure 10: ROC–AUC curve of XGBoost
Table 4: Selected features used in the proposed study in XGBoost
6 Conclusion and Recommendation
Click Through Rate research is a very key topic in the business field. A lot of researches, investigations, and tests were conducted to decide the best approach to apply in our study. The Click Through Rate prediction was implemented by creating XGBoost, Random Forest, KNN and Logistic Regression classifiers of supervised learning. Results showed that the XGBoost model outperformed the other three models. Significant results were obtained from the other models too, with slight differences between the models themselves, depending on the evaluation metrics. To reach better results in future works, deep learning algorithms might be implemented on the same dataset, different feature engineering techniques, and other types of machine learning techniques with the goal to improve performance.
Acknowledgement: We want to thank Dr. Naya Nagy for proof reading the manuscript.
Funding Statement: The authors received no specific funding for this study.
Conflicts of Interest: The authors declare that they have no conflicts of interest to report regarding the present study.
1. “Click-Through rate (CTR) definition.” [Online]. Available at: https://www.investopedia.com/terms/c/clickthroughrates.asp. [Accessed: 17-May-2020]. [Google Scholar]
2. K. E. Ståhlberg. (2019). Click-Through rate prediction in practice A study of a Click-Through rate prediction system, Master dissertation. Finland: Arcada University of Applied Sciences. [Google Scholar]
3. Z. Fang, K. Yue, J. Zhang, D. Zhang and W. Liu. (2014). “Predicting Click-Through rates of new advertisements based on the bayesian network,” Mathematical Problems in Engineering, vol. 2014, pp. 1–9. [Google Scholar]
4. G. Kondakindi, S. Rana, A. Rajkumar, S. K. Ponnekanti and V. Parakh. (2014). “A logistic regression approach to ad click prediction,” Machine Learning Project1, pp. 399–400. [Google Scholar]
5. K. Dembczynski, W. Kotlowski and D. Weiss. (2008). “Predicting ads’ Click-Through rate with decision rules,” in Workshop on Targeting and Ranking in online Advertising. [Google Scholar]
6. L. Shi and B. Li. (2016). “Predict the Click-Through rate and average cost per click for keywords using machine learning methodologies,” in Proc. Int. Conf. Ind. Eng. Oper. Manag., Michigan, USA, pp. 694–700. [Google Scholar]
7. K. Gai, X. Zhu, H. Li, K. Liu and Z. Wang. (2017). “Learning piece-wise linear models from large scale data for ad click prediction. arXiv preprint arXiv: 1704.05194, 1–12. [Google Scholar]
8. X. Xiong, C. Xie, R. Zhao, Y. Li, S. Ju. (2019). et al., “A Click-Through rprediction algorithm based on users’ behaviors,” IEEE Access, vol. 7, pp. 174782–174792. [Google Scholar]
9. S. Saraswathi, V. Krishnamurthy, D.Venkata Vara Prasad, R. K. Tarun,S.Abhinav. (2019). et al., “Machine learning based ad-click prediction system,” International Journal of Advanced Manufacturing Technology, vol. 8, no. 6, pp. 3646–3648. [Google Scholar]
10. B. Edizel, A. Mantrach and X. Bai. (2017). “Deep character-level Click-Through rate prediction for sponsored search,” in SIGIR 2017-Proc. 40th Int. ACM SIGIR Conf. Res. Dev. Inf. Retr., Tokyo, Japan, pp. 305–314. [Google Scholar]
11. H. Guo, R. Tang, Y. Ye, Z. Li and X. He. (2017). “DeepFM: A factorization-machine based neural network for CTR prediction, IJCAI Int,” in Jt. Conf. Artif. Intell, Melbourne, Australia, pp. 1725–1731. [Google Scholar]
12. S. Zhang, Q. Fu and W. Xiao. (2017). “Advertisement click-through rate prediction based on the weighted-ELM and adaboost algorithm,” Sci Program, vol. 2017, pp. 1–8. [Google Scholar]
13. Q. Wang, F. Liu, S. Xing and X. Zhao. (2018). “A new approach for advertising CTR prediction based on deep neural network via attention mechanism,” Computational and Mathematical Methods in Medicine, vol. 2018, pp. 1–11. [Google Scholar]
14. Y. Feng, F. Lv, W. Shen, M. Wang, F. Sun. (2019). et al., “Deep session interest network for Click-Through rate prediction,” in IJCAI Int. Jt. Conf. Artif. Intell., Macao, China, pp. 2301–2307. [Google Scholar]
15. Z. Jiang, S. Gao and M. Li. (2018). “An improved advertising CTR prediction approach based on the fuzzy deep neural network,” PLoS One, vol. 13, no. 5, pp. 1–24. [Google Scholar]
16. F. Cacheda, N. Barbieri and R. Blanco. (2017). “Click-Through rate prediction for local search results,” in WSDM 2017 - Proc. 10th ACM Int. Conf. Web Search Data Min., Cambridge, UK, pp. 171–180. [Google Scholar]
17. J. H. Chen, Z. Q. Zhao, J. Y. Shi and C. Zhao. (2017). “A new approach for mobile advertising Click-Through rate estimation based on deep belief nets,” Comput. Intell. Neurosci, vol. 2017, pp. 1–8. [Google Scholar]
18. Q. Wang, F. Liu, P. Huang, S. Xing and X. Zhao. (2019). “A hierarchical attention model for CTR prediction based on user interest,” IEEE Syst. J, vol. 14, no. 3, pp. 1–10. [Google Scholar]
19. T. Huang, Z. Zhang and J. Zhang. (2019). “WSDM 2017-Proc. 10th ACM Int. Conf. Web Search Data Min.,” in RecSys 2019 - 13th ACM Conf. Recomm. Syst., Copenhagen, Denmark, pp. 169–177. [Google Scholar]
20. T. Mitchell. (1997). Decision Tree Learning in the Machine Learning. 1st ed. NY, USA: McGraw Hill, pp. 55–83. [Google Scholar]
21. W. H. David, L. Stanley and X. S. Rodney. (2013). Applied logistic regression. in Wiley Series in Probability and Statistics, 3rd ed., John Wiley & Sons, New Jersey, USA. [Google Scholar]
22. G. Chandrashekar and F. Sahin. (2014). “A survey on feature selection methods,” Comput Electr. Eng, vol. 40, no. 1, pp. 16–28. [Google Scholar]
23. T. Chen and C. Guestrin. (2016). “XGBoost: A scalable tree boosting system,” in Proc. ACM SIGKDD Int. Conf. Knowl. Discov. Data Min., San Francisco, California, USA, pp. 785–794. [Google Scholar]
24. “Click-Through rate prediction dataset.” [Online]. Available https://www.kaggle.com/c/avazu-ctr-prediction. [Accessed: 18-May-2020]. [Google Scholar]
25. “XGBoost parameters.” [Online]. Available https://xgboost.readthedocs.io/en/latest/parameter.html. [Accessed: 18-May-2020]. [Google Scholar]
26. J. Fan, S. Upadhye and A. Worster. (2006). “Methodology ( ROC ) curves,” Canadian Journal of Emergency Medicine, vol. 8, no. 1, pp. 19–20. [Google Scholar]
 | This work is licensed under a Creative Commons Attribution 4.0 International License, which permits unrestricted use, distribution, and reproduction in any medium, provided the original work is properly cited. |