DOI:10.32604/cmc.2020.013646
| Computers, Materials & Continua DOI:10.32604/cmc.2020.013646 | |
| Article |
Gly-LysPred: Identification of Lysine Glycation Sites in Protein Using Position Relative Features and Statistical Moments via Chou’s 5 Step Rule
1Department of Computer Science, Lahore University of Management Sciences, Lahore, 54792, Pakistan
2Department of Computer Science, University of Management and Technology, Lahore, 54770, Pakistan
3School of Computer Science, Minhaj University Lahore, Lahore, 54770, Pakistan
4Department of Computer Science, Lahore Garrison University, Lahore, 54000, Pakistan
5Department of Unmanned Vehicle Engineering, Sejong University, Seoul, Korea
6Department of Information and Communication Technology, School of Electrical and Computer Engineering, Xiamen University Malaysia, Sepang, 43900, Malaysia
*Corresponding Author: Mohammed Alswaitti. Email: alswaitti.mohammed@xmu.edu.my
Received: 15 August 2020; Accepted: 04 September 2020
Abstract: Glycation is a non-enzymatic post-translational modification which assigns sugar molecule and residues to a peptide. It is a clinically important attribute to numerous age-related, metabolic, and chronic diseases such as diabetes, Alzheimer’s, renal failure, etc. Identification of a non-enzymatic reaction are quite challenging in research. Manual identification in labs is a very costly and time-consuming process. In this research, we developed an accurate, valid, and a robust model named as Gly-LysPred to differentiate the glycated sites from non-glycated sites. Comprehensive techniques using position relative features are used for feature extraction. An algorithm named as a random forest with some preprocessing techniques and feature engineering techniques was developed to train a computational model. Various types of testing techniques such as self-consistency testing, jackknife testing, and cross-validation testing are used to evaluate the model. The overall model’s accuracy was accomplished through self-consistency, jackknife, and cross-validation testing 100%, 99.92%, and 99.88% with MCC 1.00, 0.99, and 0.997 respectively. In this regard, a user-friendly webserver is also urbanized to accumulate the whole procedure. These features vectorization methods suggest that they can play a critical role in other web servers which are developed to classify lysine glycation.
Keywords: Gly-LysPred; PseAAC; post-translational modification; lysine glycation; Chou’s 5 step rule; position relative features
These Proteins are the organic polymeric nitrogenous compounds. Proteins are the major structural and functional components of every organism in the form of enzymes, antibodies, hemoglobin, etc. Proteins provide energy to our body but not the main source of energy. The athletic population requires a very high consumption of proteins. Every protein is made up of amino acids. There are only 20 amino acids which are constituents of all types of proteins. From these 20, 12 amino acids (11 in children’s) are synthesized by our body which named as nonessential. Remaining amino acids are described as essential means are not synthesized by our body and we have to consume these amino acids in our diets. Lack of any essential amino acids results in affecting the growing ability of tissues [1]. That’s why the proper intake of protein is also needed for aged people. It is observed that as age increases 40, muscle strength decreases due to loss in muscle mass [2,3]. The loss in muscle mass creates health-related issues such as sarcopenia and osteoporosis. For the recovery of these issues a person should take proper protein in their aged years [4]. Post-translational modification PTM’s are the enzymatic or non-enzymatic reactions of amino acid chains. PTM’s affect both protein's physiological functions and the structure of the protein.
Determination of PTMs is essential in exposition to elaborate on the processes that grove cellular level, as like cell divide, development, or diversity. PTMs term indicates changing happen in the polypeptide sequence as a result of either the accumulation or exclusion of separate chemical meridian to amino acid residues [5]. These accumulations or exclusions divided the PTM’s into two broad types such as covalent post-translational modification and covalent cleavage peptide backbones in protein [6]. The chemical PTMs have been studied for a variety of biochemical changes in many types of proteins that occur in many combinations or signal-dependent method and also define their tertiary or quaternary structures and control their events and purpose. All evidence will support to realize biological occurrences and disorder stage involving these proteins [7].
Yonder alternative splicing of messenger RNA (mRNA) which is used to as a source of protein diversity, post-translation modification (PTMs) of proteins further modulate and extends the range of possible proteins functions by covalently attaching small chemical moieties to selected amino acid residues. Over 200 many types of PTMs have been recognized that outcome many phases of molecular level and metabolic, signal transduction, or protein immovability [8].
Several studies on PTMs have concentrated on precise forms and they are related to proteins task with phosphorylation on behalf of the most dynamically investigates PTM-type [9,10]. PTMs adversely impact biological cellular functions such as metabolism, signal transduction, and protein stability. These chemical modifications include phosphorylation, glycosylation, methylation, acetylation, ubiquitination. That’s why the understanding of PTMs is important in the study of cellular biology for disease treatment and prevention [11].
Lysine is a type of essential amino acid that means they are not produced in the human body and if any deficiency occurs in our body we take it from outside and complete our body functions. They are present in lot amounts these are poultry, meats, or milk [12]. Lysine is very important as many biological functions requiring some notable applications include the production of connective tissues such as bone, skin, collagen, or elastin, and the making of carnation in the result of fatty acid converts in energy to healthy growth and development in offspring. And also manage our valuable immune function, mostly with observe antiviral activity [13]. In hyperglycemic conditions produced in our body that reactions are starting non-enzymatic glycosylation and very vital mechanisms are modifying proteins, leading to conformational changes and malfunction of proteins [14]. Schiff base and Amador product and produced when a free amino acid group with the carbonyl group of reduced sugar in the result of proteins bilocation occur. When those proteins are manufactured by this procedure are converted in varied compounded that called Advanced glycation end-products (AGEs) [15].
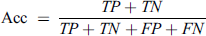
This complete process is depicted in Fig. 1. Advanced glycation that end product of when amino acid takes place the glycation in feverish collagens and also deposit at the time of glycation. We can check through mass spectrometry and recognized fractional fructose-hydroxy-lysine glycations at each of the helical area cross-linking sites of type I collagen that is elevated in tissue from a diabetic mouse model [16]. That study also provisions to a proposed connotation between glycation and collagen thickening. Perceived reduction in collagen extractability from diabetic goes on to introduce intermolecular AGEs cross-links. A very little consequence on collagen solubility upon pepsin digestion compared with acid abstraction supports the addition of inter-triple-helical cross-links in diabetic mouse tendon. Amassed AGEs yields have been associated with both improved and also declined [17]. Post- translation modification of proteins with reducing sugars and α-carbonyl products of their degradation in the result of glycation [18]. Amadori products can also undergo degradation to form carbonyl compounds, such as methylglyoxal or then undergo extra corrupting, oxidation, reduction, and condensation reaction, leading to an irretrievable AGE establishment [19]. Diabetes or nephropathy diabetic or other diseases are happened by the addition of glycation products [20].
Non-fluorescent proteins crosslinks methylglyoxal-lysine or glyoxalin-lysine these are dimer forms of protein and also change the structure and efficient properties which affects harmfully cellular uptake. AGEs arise below regular physiological state but is boost up in when calcium level in the high state [21]. Reactive oxygen species (ROS) has increased glycation of the enzyme of the structural components of the connective tissue matrix and basement member component [22].
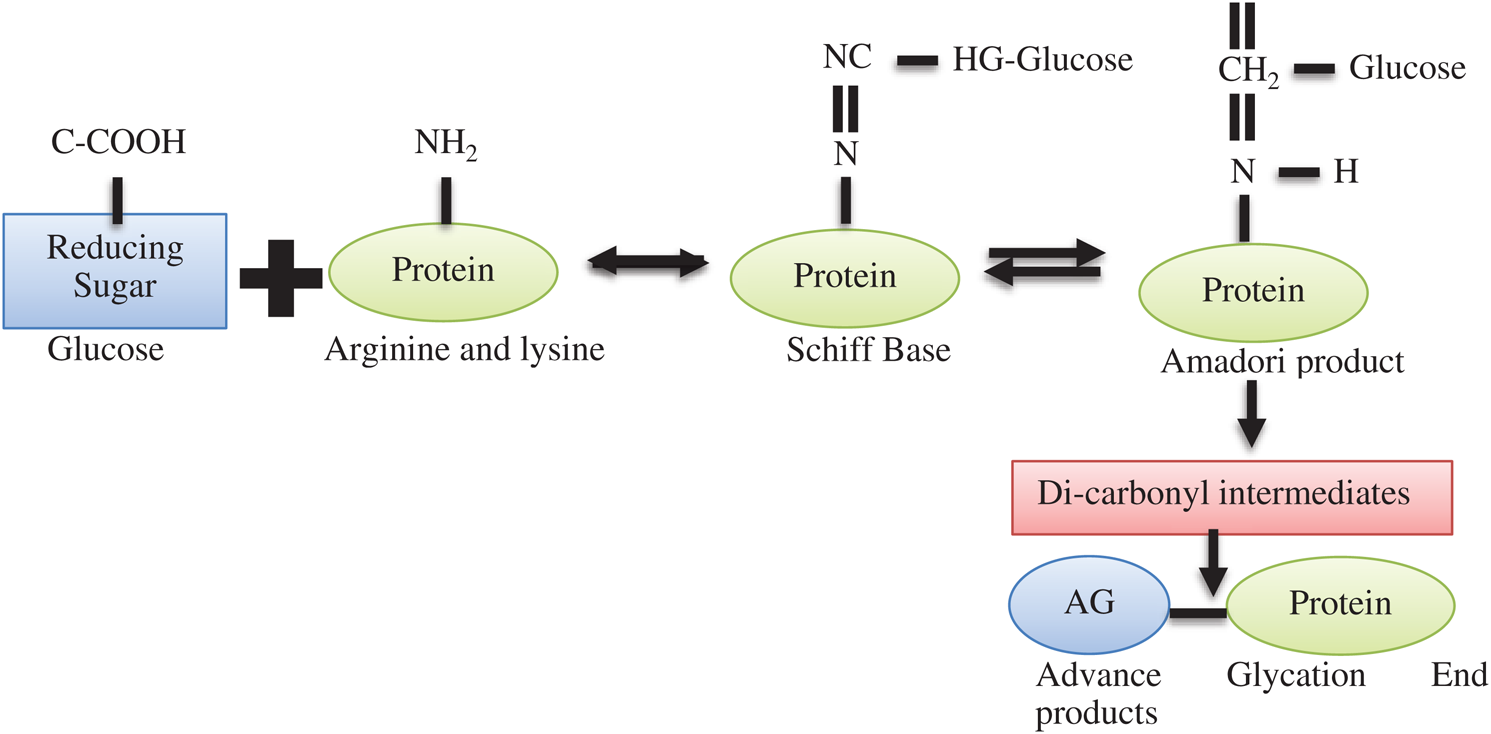
Figure 1: Chemical process of lysine glycation
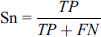
Post translation modification identification in proteins is a very critical issue from 19’s to till date. Currently, the focus change from the data science technique to the mixture of machine learning techniques with feature processing and deep learning techniques e.g. GANNphos and DeepPhos are two predictors used to predict the phosphorylation. GANNphos [23]. In the machine learning era, in 2006, the initial predictor was GlyNN which was developed by using the ANN technique by using a dataset of 126 non-glycated (negatives) and 89 glycated (positives) lysine sites from 20 proteins [24]. In 2015 another computational tool named PreGly based on a feature extraction technique composition of k-spaced amino acid pairs (CKASSP) used to predict Lysine glycation with a similar data set to GlyNN [25]. In 2016, focus tend to different feature extraction techniques with the machine learning model. A new predictor Glee-PseAAc was developed by combining the Support Vector Machine (SVM) algorithm and the position-specific amino acid-base features with the use of a rationalized dataset consisting 446 non-glycated and 223 glycated sites from CPLM databank [26]. Initially, experienced data scientists were not going to trust computational methods due to the ill-famed local minima problem [27,28]. Gradually the situation changed and different sequential and structural bioinformatics detection tools development get started such as X-ray crystallography, NMR tool, etc. [28–34]. Mass spectrometry, radioactive labeling, matrix statistics, vector projection, and several affinity-based methods were used to predict distinct PTM’s sites e.g., ubiquitination, phosphorylation, glycosylation, etc. These methods were costly, laborious, and time-consuming [35–43]. After these all techniques, trend changes towards data science techniques to make predictions. Various techniques of data sciences used to develop prediction servers including the following but not limited to: Artificial Neural networks [44–48], backpropagated Neural networks [47,48], Support vector machines [49–54], Hidden Markov model [55,56], logistic regression [57], Bayesian theory [58], consensus sequences [59], backpropagated Neural networks [47,48], nearest neighbor [60], random forest [61]. DeepPhos [62], pDeep2 [63], DeepUbi [64], and many others [65] which are based on different Deep learning techniques to make predictions. Currently, the focus change from the data science technique to the mixture of machine learning techniques with feature processing and deep learning techniques, e.g., GANNphos and DeepPhos are two predictors used to predict the phosphorylation. GANNphos [23], DeepPhos [62], pDeep2 [63], DeepUbi [64], and many others [65] which are based on different Deep learning techniques to make predictions. The same tendencies occurred with the prediction of lysine glycation. Initially, Lysine glycation is also predicted by some costly and time-consuming methods such as mass spectrometry [40], matrix statistics [41], vector projection [42,43], etc. In the machine learning era, in 2006, the initial predictor was GlyNN which was developed by using the ANN technique by using a dataset of 126 non-glycated (negatives) and 89 glycated (positives) lysine sites from 20 proteins [24]. In 2015 another computational tool named PreGly based on a feature extraction technique composition of k-spaced amino acid pairs (CKASSP) used to predict Lysine glycation with a similar data set to GlyNN [25]. In 2016, focus tend to different feature extraction techniques with the machine learning model. A new predictor Glee-PseAAc was developed by combining the Support Vector Machine (SVM) algorithm and the position-specific amino acid-base features with the use of a rationalized dataset consisting 446 non-glycated and 223 glycated sites from CPLM databank [26]. In 2017 to 2018, with some advancement there are some recent predictors has been developed with the combination of machine learning approach and some feature extraction techniques to improve the previous predictor’s performance such as BPB_GlySite (Combination of SVM algorithm and Bi-Profile Bayes (BPB) based feature extraction technique) [66], Glypre (by combining the SVM and multiple features like an index, position amino acid CKSAAP, conservation) [67], iProtGly-SS (by using structure-based sequence-based features) [68], GlyStruct (a combination of structural properties of amino acid residues and support vector) [69], MDS_GlySitePred (with the combination of SVM and multidimensional scaling feature extraction techniques) [70]. Although Lysine glycation is a complex and multistep process, Identifications of lysine in labs is a time-consuming, operator dependent, and labor-intensive task. To overcome these issues, a computational model is developed for lysine glycation predictions with increased accuracy and efficiency. This computational model follows the Chou’s 5-step rule [71–72] which are depicted in the Fig. 2.
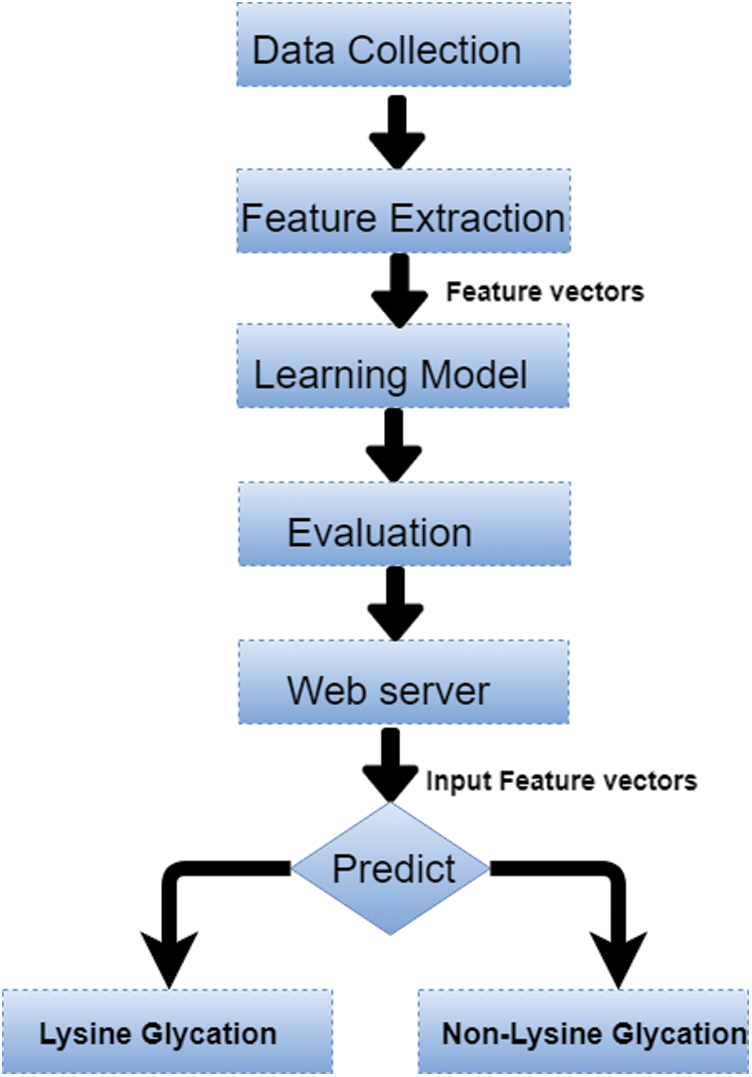
Figure 2: Computational model of lysine glycation sites
Chou’s first step rule data collection; a stringent and reliable dataset is developed for model’s training and testing purposes. In the second step, features are extracted by dataset sequences after some preprocessing and then conversion of these sequences into vectors by using position relative incidence and statistical moments. In Chou’s third step learning model; machine learning models would be used to train the network e.g., random forest. The most robust and solid model would choose to make predictions. The fourth step is related to the evaluation and validation of the model by using different evaluation measures such as measuring the accuracy, specificity, and sensitivity. In the last step of this model a web server is developed and accessible publically to end-users.
This section describes overall techniques for the predictor. This contains the dataset collection data processing and learning model. In the data of the first phase set is collected from an online well-known publically available database named uniprot. In the second phase feature vectors are generated by using some statistical methods. For leaning model 2–3 model would be trained and the best model with high accuracy would be chosen.
The astringent and reliable dataset is a base for a computationally accurate and statistically robust predictor. The noisy dataset will alter the classifier’s robustness and the predicted accurateness may be disbelieved [73]. An accurate dataset is curated from UniProt: https://www.uniprot.org/ which is consists of 1287 positive sites and 1300 negative sites are obtained. CD-Hit is used to remove the >= 60% redundant data from the given dataset.
The formulation of biological sequences into a vector or a discrete model is the most critical problem in computational biology. Different techniques used in past to do this job such as Composition of k-spaced amino acid pairs (CKASSP) [68], position-specific amino acid-base feature extraction [69], Bi-Profile Bayes (BPB) based feature extraction technique [70], multiple features like an index, position amino acid CKSAAP, conservation [71], structure-based sequence features) [72], structural properties of amino acid residues [73] and multidimensional scaling feature extraction technique [74].
The focus on feature extraction is due to the nature of the machine learning model as they cannot handle the sequence samples. The required dataset should be in vector form [74]. To resolve the issue PseAAc [75] is used as it converts a protein sequence into discrete vectors without losing sequence order info [76]. PseAAc equation is given follows:

Sequence statistical moment approach is used to define the dimensions and components of PseAAc equation which are comprised of: 1-Statistical Moments Calculation 2-Determination of Position Relative Incidence Matrix (PRIM) 3-Determination of Reverse Position Relative Incidence Matrix (RPRIM) 4-Frequency Matrix Determination 5-Accumulative Absolute Position Incidence Vector (AAPIV) Generation 6-Reverse Accumulative Absolute Position Incidence Vector (RAAPIV) Generation.
3.1 Statistical Moments Calculation
This approach is used to quantitatively describe the whole dataset. Different data properties are represented with different orders of moments that are used to evaluate the data size and to indicate the eccentricity and orientation of data. Some well-known moments described by statisticians and mathematicians which are based on distribution functions and polynomials [77,78]. In this study Hahn, central and raw moments are considered.
In Hahn moments, Hahn polynomials are used [79] and location and scale variants are calculated. In central moments, location invariant asymmetry, mean and variance are calculated w.r.t centroid [80,81] and for probability distribution in the dataset in raw moment’s location variant asymmetry, mean and variance are calculated.
These specific statistical moments provide sensitive information about the sequence order while the scale-invariant moments are not much appropriate. Data is represented by quantified values [82].
3.2 Determination of Position Relative Incidence Matrix (PRIM)
To predict protein behavior, protein sequence order information is used as the basis for any mathematical model. Amino acid’s relative positions are the essential segment of the protein’s physical attributes. It is furthermore vital to quantize the amino acid’s relative positions in the polypeptide chain. PRIM extracts this information and form a 20 × 20 matrix which is shown below:
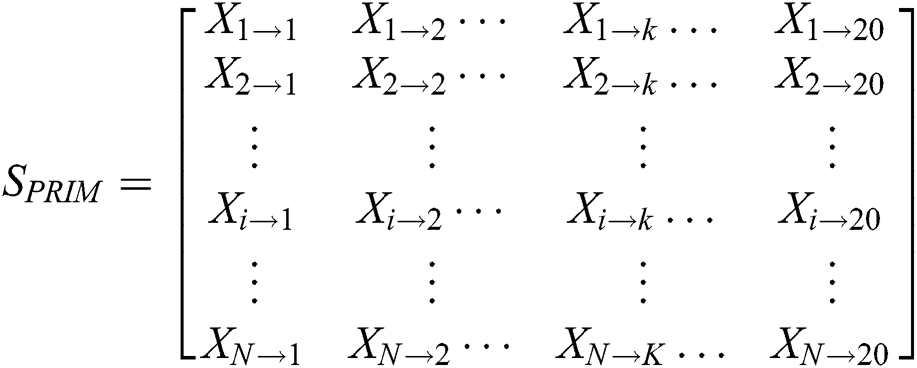
 Contains the sum of kth residue’s relative position w.r.t 1st occurrence of ith residue. PRIM yields a total of 400 coefficients and to reducing these large number of coefficients, statistical movements using PRIM are computed which generate other elements set of 24 cardinalities [83].
3.3 Determination of Reverse Position Relative Incidence Matrix (RPRIM)
Effectiveness and accuracy of machine learning algorithms mainly depend on exactness and thoroughness by which the related features of data can be extracted. Machine learning algorithms are capable to uncover and understand the blur, obscure and hidden features from Data. Within a polypeptide chain, the PRIM matrix extracts information related to the relative positioning of amino acids. This Matrix works similarly to PRIM but in a reverse way. RPRIM helps to discover the more obscure patterns within the polypeptide chains. RPRIM is also a 20 × 20 matrix with 400 coefficients which is shown below:
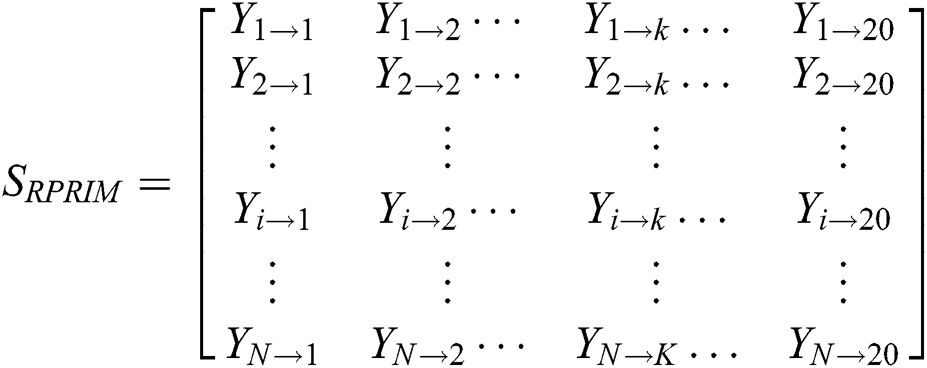
Dimensionality reduction with RPRIM is done by using statistical movements (central, raw, and Hahn moments) calculation which converts 400 coefficients to 24 coefficients.
3.4 Frequency Matrix Determination
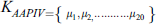
Frequency represents the distribution of amino acid residues in the sequence inside the primary structure. To measure these frequencies, a frequency matrix is used. The frequency matrix is:
 denotes the frequency of ith amino acid occurrences. This matrix reveals information about the protein sequence composition. Sequence information is extracted in PRIM.
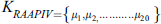
3.5 Accumulative Absolute Position Incidence Vector (AAPIV) Generation
In the frequency matrix, accumulation frequency or compositional information of amino acid residues occurrences in the polypeptide chain was computed. Information related to the relative positions of amino acid residues was not considered.
AAPIV provides information related to the amino acid residues position within the polypeptide chain. A vector with the cardinality of 20 elements, while each element comprises of all ordinal values containing the corresponding residue location within the primary structure. AAPIV vector is:
The ith element of APPIV

3.6 Reverse Accumulative Absolute Position Incidence Vector (RAAPIV)
RPRIM, RAAPIV is also used to uncover the hidden and obscure features from data. RAAPIV revers the primary structure string and then extract AAPIV features.
RAAPIV is the reverse of AAPIV vector with the same cardinality. RAAPIV vector is:
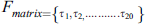
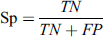
Random forest algorithm is used to predict the lysine glycation sequences which were developed by Leo Bremen [84]. This algorithm is used for classification by using the concept of ensemble decision/classification trees and has been employed in many biological problems. Ensemble learnings of Decision trees allow the algorithm to learn and predict simple and complex classifications accurately. According to the inventors random forest does not require plentiful fine-tuning of parameters and provide excellent performance with default parameters [61,85–87]. Decision trees in random forest classification are the foundation of the algorithm and these trees improve accuracy at the time of merging because each tree has a random subset of the feature vectors [88–91]. Feature vectors of proteins (which contain Statistical Moments Calculation, PRIM, RPRIM, Frequency Matrix Determination, AAPIV, RAAPIV vectors) are propagated down the trees to train the model and to calculate an output matrix is formed in a supervised manner which conformed to two classes (positive or negative) by analyzing the leaf occupancy as shown in Fig. 3. Accuracy is calculated with the prediction of random forest.
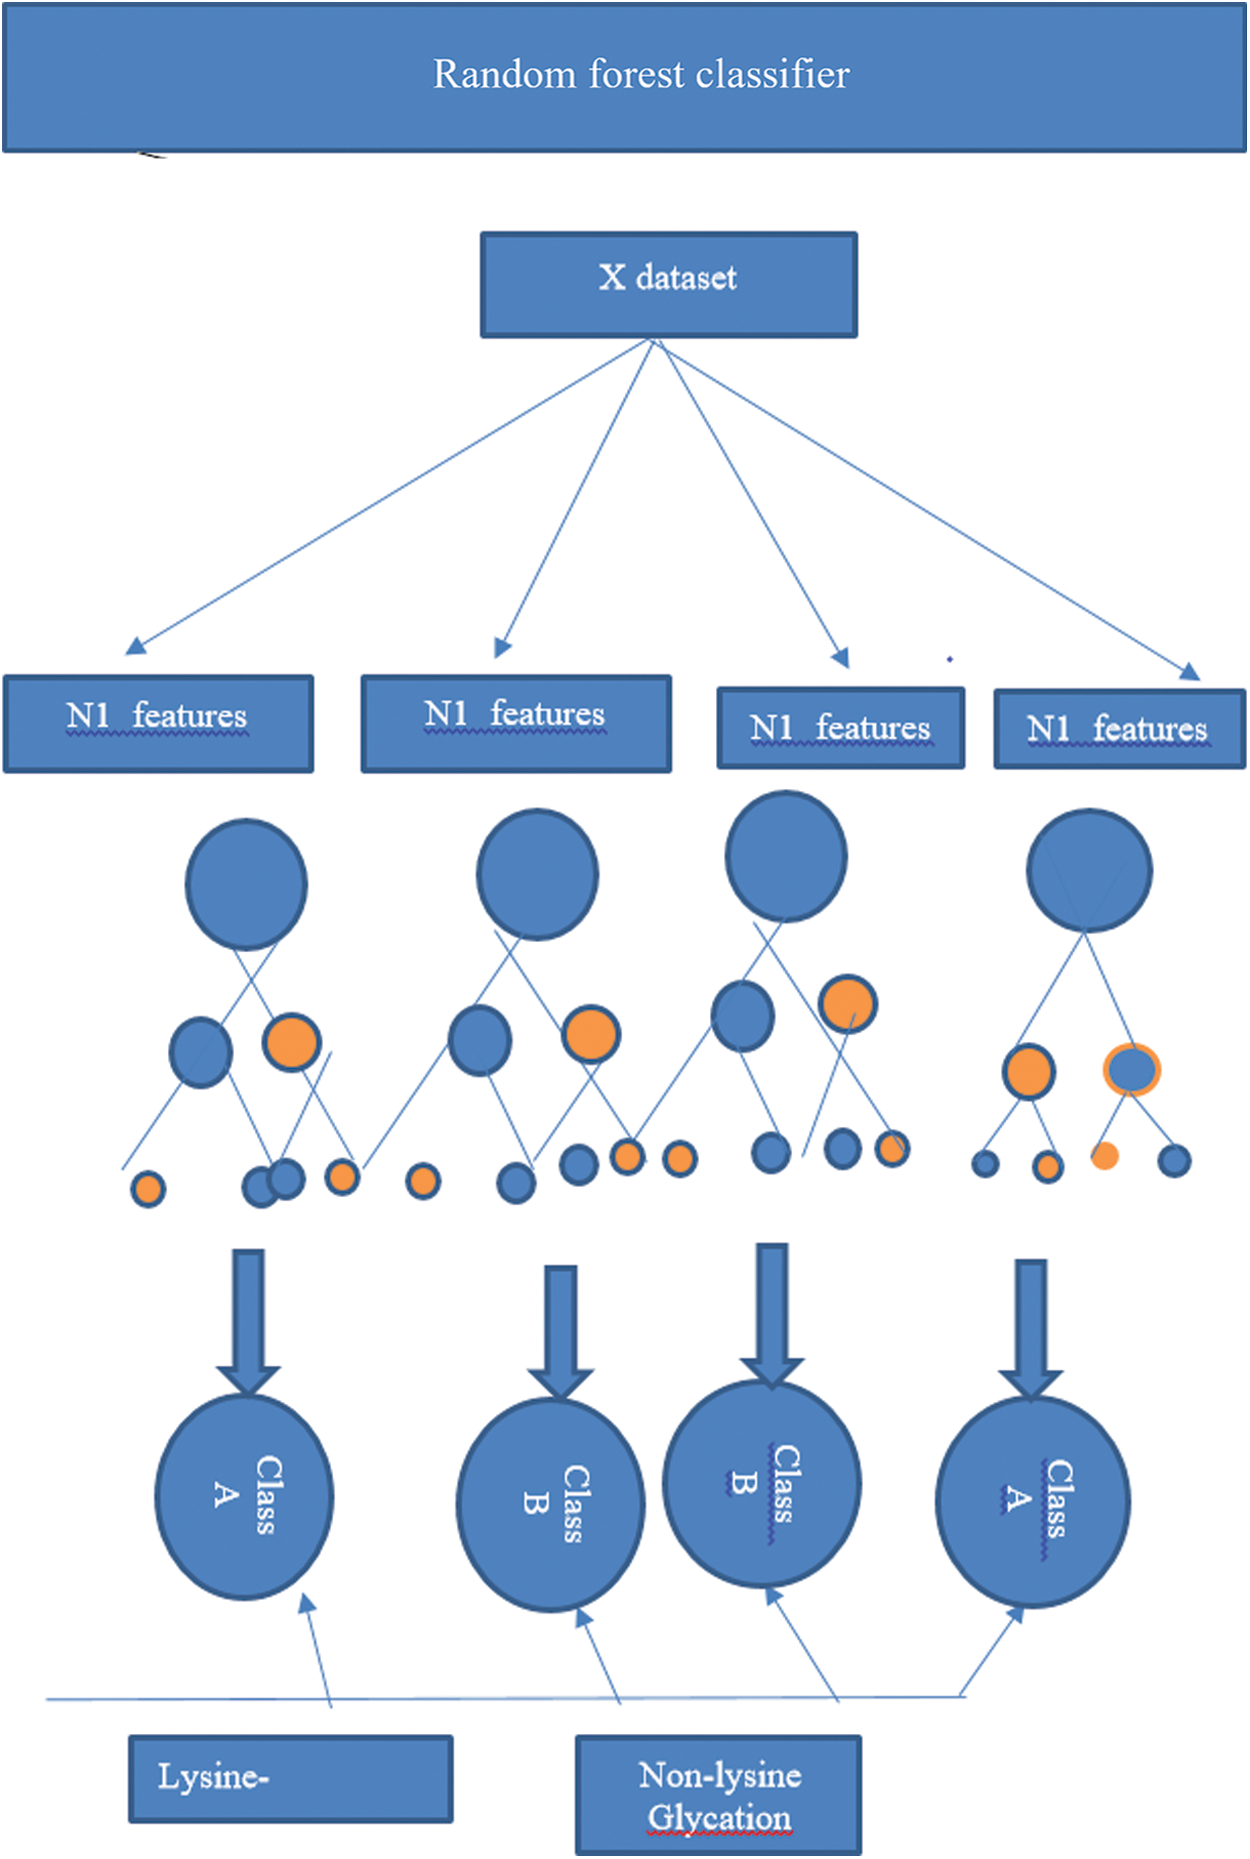
Figure 3: An operating algorithm of random forest
Evaluation is an important procedure to develop a solution to any problem. This is used to evaluate the anticipated accuracy of any new model, some testing techniques are used [92]. Following are the Obtained results from this experiment in this section.
Several comparison metrics exist to compare multiple supervised algorithms performance [93,26]. Among all, the most important and common measures are Accuracy(ACC) to measure the overall accuracy, sensitivity (Sn) to measure the sensitivity, specificity (Sp) to measure specificity, Mathew Correlation Coefficient (MCC) to measure stability using true positive (TP), true negative (TN), false positive (FP), and false negative (FN) values [94]. These measures are defined as:
This metric is used to define the ratio of correct predictions to the total instances. This metrics range is from 0 to 1. Higher Acc value represents higher performance.
This metric is used to define the true positive rate of a classifier and tells about the performance of the classifier in a way to calculate correctly predict lysine glycation. These metrics are also ranges from 0 to 1. A higher sensitivity value represents higher performance.
This metric is used to define the false positive rate of a classifier and tells about the performance of the classifier in a way to calculate correctly predict non-glycated peptides. These metrics also range from 0 to 1.
MCC has a range from −1 to +1 which represents the negative correlation and positive correlation. TP is the count of true positives glycated peptides or positive glycated peptides which are correctly predicted by the classifier, TN is the count of true negative glycated peptides or non-glycated peptides which are correctly classified by the classifier, FP is the count of false positives which means the count of incorrectly non-glycated peptides are predicted as positive glycated peptides, FN is the count of false negatives which means the count of incorrectly glycated peptides predicted as non-glycated peptides.
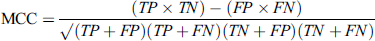
After getting the appropriate metrics to evaluate the classifier, some test methods to score these metrics are also needed. Three methods are most commonly used in statistics to evaluate the predictor which are; Self-consistency, K-fold cross or subsampling validation, and Jackknife testing [95]. In self-consistency same dataset is used to train and test the model. Self-consistency testing has an Accuracy, Sensitivity, Specificity, and MCC of 100%, 100%, 100%, and 1.0 respectively. Receiver Operating Characteristics (ROC) and Area under the Curve (AUC) are also used to evaluate the model’s performance. ROC plots the sensitivity or true positive rate as a function of specificity or false positive rate for all possible folds. AUC value shows the performance of the predictor. Closer value to 1 depicts the better performance of the model [26,54]. ROC of the self-consistency testing is given in Fig. 4.
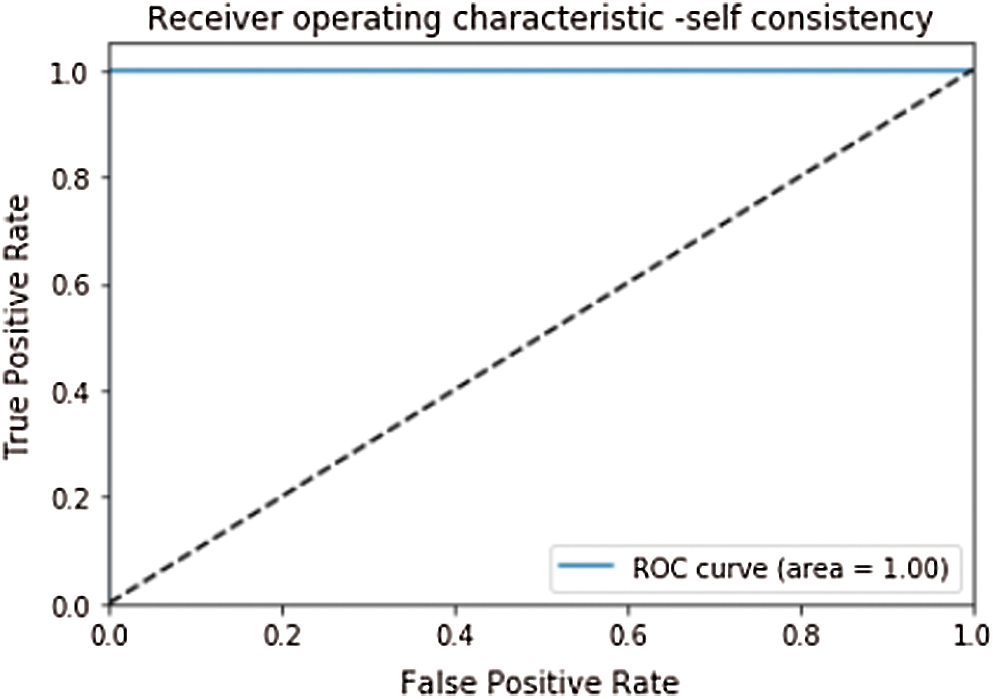
Figure 4: ROC curve of self consistency with AUC = 1
In the absence of obvious validation set to check the appropriateness of the proposed method, cross-validation testing is being used. In cross-validation (subsampling) dataset is divided into k distinct folds and k is always kept constant during the test process. The process is repeated k-times for each fold and accuracy is calculated intended for each iteration. Finally, average of the all calculated accuracies is used as a cross-validation result. We performed k-fold cross-validation by using k = 10. An average result of 10-fold cross-validation has an Accuracy, Sensitivity, Specificity, and MCC of 99.88%, 99.84%, 99.74%, and 0.997 respectively. The results of 10-fold cross-validation are depicted in Fig. 5.
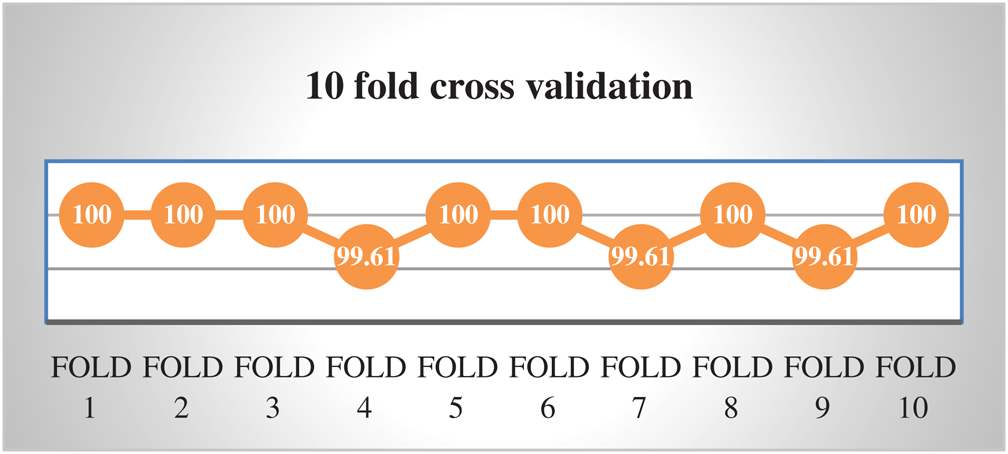
Figure 5: Accuracy of 10-fold cross validation
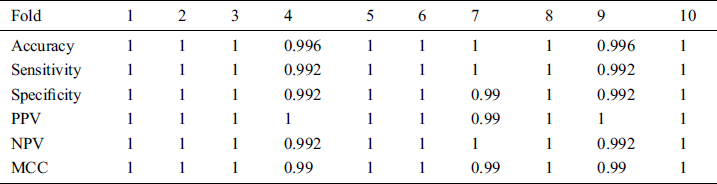
All cross validations 10-fold detailed measures results are also presented in the following Tab. 1.
Table 1: Results of 10 fold cross validation
In jackknife testing, one instance from the dataset was selected for testing, and the lasting all instance used to train the model. In other words, if you have N size of dataset then N−1 size will be used for training purposes and remaining 1 will be used for testing on N−1 size trained dataset. In the same way all instances are tested without keeping them in the training dataset [96]. Jackknife testing has been used widely to examine the various predictors’ quality by many investigators [97–99]. Jackknife testing has 99.92% accuracy, 99.8% Specificity, 100% sensitivity, and 0.99 MCC. Detailed Results of Jackknife’s accuracy are depicted in Fig. 6.
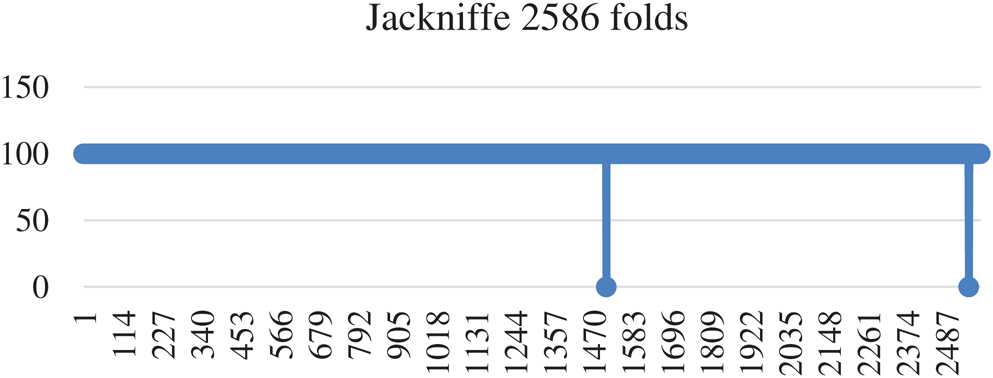
Figure 6: Accuracy of Jackknife testing
5.4 Comparison with Existing Methods
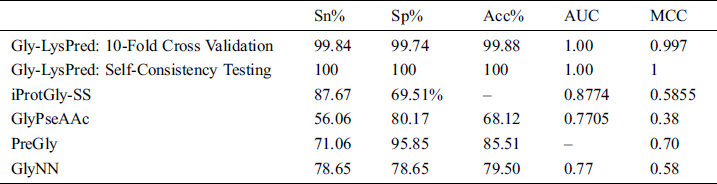
The proposed solution is compared with some pre-build classifiers which are GlyNN [24], PreGly [25], and GlyPseAAc [26] and with iProtGly-SS [68]. Following is the comparison of 10-fold cross-validation results from all predictors as shown in Tab. 2.
Table 2: Comparison of Gly-LysPred results with other models
A user-friendly and easily accessible web server is developed for the end-users initially on local host where they can input their sequences and check either the sequence belongs to lysine glycation or not. The interface of the under-construction webserver is displayed in Fig. 7. This presented web server is our future work and will established with some new concept.
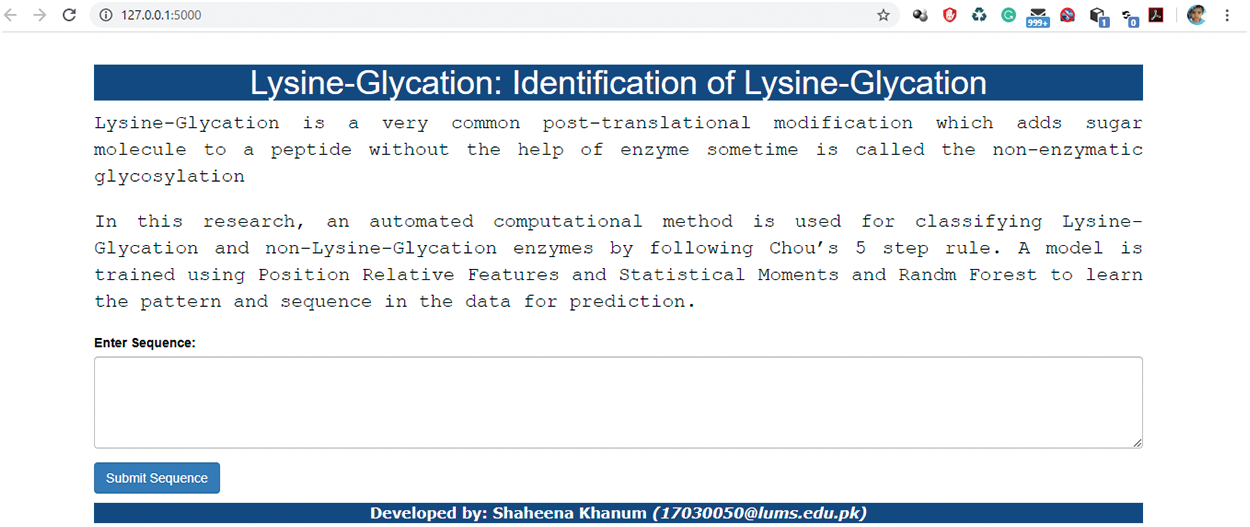
Figure 7: Interface of Webserver
Glycation is a type of non-enzymatic PTM which assigns sugar molecule and residues to a peptide. It is more substantial and clinically important attributes to numerous chronic diseases and age-related, metabolic such as diabetes, Alzheimer’s, renal failure, etc. The bulk of the dataset is first used to train the network. The method proposes a Position Relative Incidence Matrix, Reverse Position Relative Incidence Matrix, Frequency Matrix, Accumulative Absolute Position Incidence Vector, and Reverse Accumulative Absolute Position Incidence Vector for feature extraction. Experiment results also show that the presented methodology provides high throughput and accuracy than the previous predictors. In this research, using Chou’s 5 step rule, we developed a model named Gly-LysPred for the identification of lysine glycation sites from non-lysine glycation sites based on Random Forest (RF) which save a lot of time, money and also not operator dependent. Different verification and validation testing such as Self Consistency, 10-Fold Cross-Validation and Jackknife Testing being performed. Overall model’s accuracy was accomplished through self-consistency, jackknife, and cross-validation testing 100%, 99.92%, and 99.88% with MCC 1.00, 0.99, and 0.997 respectively. This method is ultimately more accurate cost, absolutely effective, and use high throughput technique for the identification of lysine glycation sites from existing.
Acknowledgement: Thanks to our families & colleagues who supported us morally.
Funding Statement: This research was supported by the Research Management Center, Xiamen University Malaysia under XMUM Research Program Cycle 4 (Grant No. XMUMRF/2019-C4/IECE/0012).
Conflicts of Interest: The authors declare that they have no conflicts of interest to report regarding the present study.
1. Y. Shiloh and Y. Ziv. (2013). “The ATM protein kinase: Regulating the cellular response to genotoxic stress, and more,” Nature Reviews Molecular Cell Biology, vol. 14, no. 4, pp. 197–210. [Google Scholar]
2. M. Lonnie, E. Hooker, J. M. Brunstrom, B. M. Corfe, M. A. Green. (2018). et al., “Protein for life: Review of optimal protein intake, sustainable dietary sources and the effect on appetite in ageing adults,” Nutrients, vol. 10, no. 3, pp. 360–361. [Google Scholar]
3. J. Bauer, G. Bolo, T. Cederholm, M. Cesari, J. A. Cruz-Jentoft. (2013). et al., “Evidence-based recommendations for optimal dietary protein intake in older people: A position paper from the PROT-AGE Study Group,” Journal of the American Medical Directors Association, vol. 14, no. 8, pp. 542–559. [Google Scholar]
4. A. J. Cruz-Jentoft, J. P. Baeyens, J. M. Bauer, Y. Boilie, T. Cederholm. (2010). et al., “Sarcopenia: European consensus on definition and diagnosis report of the European working group on sarcopenia in older people,” Age and Ageing, vol. 39, no. 4, pp. 412–423. [Google Scholar]
5. A. L. Santos and A. B. Lindner. (2017). “Protein posttranslational modifications: Roles in aging and age-related disease,” Oxidative Medicine and Cellular Longevity, vol. 2017, no. 5365, pp. 1–19. [Google Scholar]
6. C. T. Walsh, S. Garneau-Tsodikova and G. J. Gatto Jr. (2005). “Protein posttranslational modifications: The chemistry of proteome diversifications,” Angewandte Chemie International Edition, vol. 44, no. 45, pp. 7342–7372. [Google Scholar]
7. M. O. Sheikh, S. M. Halmo and L. Wells. (2017). “Recent advancements in understanding mammalian O-mannosylation,” Glycobiology, vol. 27, no. 9, pp. 806–819. [Google Scholar]
8. S. Zhao, W. Xu, W. Jiang, W. Yu, Y.Lin. (2010). et al., “Regulation of cellular metabolism by protein lysine acetylation,” Science, vol. 327, no. 5968, pp. 1000–1004. [Google Scholar]
9. P. P. Roux and P. Thibault. (2013). “The coming of age of phosphoproteomics—from large data sets to inference of protein functions,” Molecular & Cellular Proteomics, vol. 12, no. 12, pp. 3453–3464. [Google Scholar]
10. C. S. Stach, M. G. McCann, C. M. O’Brien, T. S. Le, N. Somia. (2019). et al., “Model-driven engineering of N-linked glycosylation in Chinese hamster ovary cells,” ACS Synthetic Biology, vol. 8, no. 11, pp. 2524–2535. [Google Scholar]
11. M. Audagnotto and M. Dal Peraro. (2017). “Protein post-translational modifications: In silico prediction tools and molecular modeling,” Computational and Structural Biotechnology Journal, vol. 15, pp. 307–319. [Google Scholar]
12. C. Duparc, C. André, J. Ménard, B. Godouet-Getti, J. Wils. (2017). et al., “Lysine acts as a serotonin type receptor antagonist to counteract in vitro and in vivo the stimulatory effect of serotonergic agents on aldosterone secretion in man,” Hormone and Metabolic Research, vol. 49, no. 4, pp. 269–275. [Google Scholar]
13. E. Krasniqi, A. Boshnjaku and L. Tozi. (2016). “Approved health claims for amino acids in/as food supplements,” Macedonian Pharmaceutical Bulletin, vol. 62, no. 1, pp. 35–46. [Google Scholar]
14. X. Deng, W. Huang, J. Peng, T. T. Zhu, X. L. Sun. (2018). et al., “Irisin alleviates advanced glycation end products-induced inflammation and endothelial dysfunction via inhibiting ROS-NLRP3 inflammasome signaling,” Inflammation, vol. 41, no. 1, pp. 260–275. [Google Scholar]
15. S. Y. Rhee and Y. S. Kim. (2018). “The role of advanced glycation end products in diabetic vascular complications,” Diabetes & Metabolism Journal, vol. 42, no. 3, pp. 188–195. [Google Scholar]
16. A. Nash, M. Notou, A. F. Lopez-Clavijo, L. Bozec, H. N. De Leeuw. (2019). et al., “Glucosepane is associated with changes to structural and physical properties of collagen fibrils,” Matrix Biology Plus, vol. 4, pp. 1–14. [Google Scholar]
17. G. Fessel, Y. Li, V. Diederich, M. Guizar-Sicairos, P. Schneider. (2014). et al., “Advanced glycation end-products reduce collagen molecular sliding to affect collagen fibril damage mechanisms but not stiffness,” PLoS One, vol. 9, pp. 948–952. [Google Scholar]
18. S. Milkovska-Stamenova, R. Schmidt, A. Frolov and C. Birkemeyer. (2015). “GC-MS method for the quantitation of carbohydrate intermediates in glycation systems,” Journal of Agricultural and Food Chemistry, vol. 63, no. 25, pp. 5911–5919. [Google Scholar]
19. C. G. Schalkwijk and T. Miyata. (2012). “Early- and advanced non-enzymatic glycation in diabetic vascular complications: The search for therapeutics,” Amino Acids, vol. 42, no. 4, pp. 1193–1204. [Google Scholar]
20. G. Aldini, G. Vistoli, M. Stefek, N. Chondrogianni, T. Grune. (2013). et al., “Molecular strategies to prevent, inhibit, and degrade advanced glycoxidation and advanced lipoxidation end products,” Free Radical Research, vol. 47, no. suppl. 1, pp. 93–137. [Google Scholar]
21. G. I. Prada. (2018). “Glycoxidative stress in aging and pathology,” Editorial Board Honorary Editor-in-Chief, vol. 7, no. 1, pp. 32–38. [Google Scholar]
22. M. Krautwald and G. Münch. (2010). “Advanced glycation end products as biomarkers and gerontotoxins: A basis to explore methylglyoxal-lowering agents for Alzheimer’s disease?,” Gerontol, vol. 45, pp. 744–751. [Google Scholar]
23. Y. Xu, Y. Yang, Z. Wang, C. Li and Y. Shao. (2018). “A systematic review on posttranslational modification in proteins: Feature construction, algorithm and webserver,” Protein and Peptide Letters, vol. 25, no. 9, pp. 807–814. [Google Scholar]
24. X. Zhao, X. Zhao, L. Bao, Y. Zhang, J. Dai. (2017). et al., “Glypre: In silico prediction of protein glycation sites by fusing multiple features and support vector machine,” Molecules, vol. 22, no. 11, pp. 1891–1893. [Google Scholar]
25. Y. Liu, W. Gu, W. Zhang and J. Wang. (2015). “Predict and analyze protein glycation sites with the mRMR and IFS methods,” Biomed Research International, vol. 2015, no. 12, pp. 1–6. [Google Scholar]
26. Y. Xu, L. Li, J. Ding, L. Wu, G. Mai. (2017). et al., “Glee-PseAAC: Identifying protein lysine glycation through sequences,” Gene, vol. 602, pp. 1–7. [Google Scholar]
27. B. Yu, L. Lou, S. Li, Y. Zhang, W. Qiu. (2017). et al., “Prediction of protein structural class for low-similarity sequences using Chou’s pseudo amino acid composition and wavelet denoising,” Journal of Molecular Graphics and Modelling, vol. 76, pp. 260–273. [Google Scholar]
28. K. C. Chou. (2019). “Progresses in predicting post-translational modification,” International Journal of Peptide Research and Therapeutics, vol. 26, no. 2, pp. 1–16. [Google Scholar]
29. J. Cheng, L. M. Maurer, H. Kang, P. C. Lucas and L. M. McAllister-Lucas. (2020). “Critical protein-protein interactions within the CARMA1-BCL10-MALT1 complex: Take-home points for the cell biologist,” Cellular Immunology, vol. 355, 104158. [Google Scholar]
30. A. Astegno, V. La Verde, V. Marino, D. Dell’Orco and P. Dominici. (2016). “Biochemical and biophysical characterization of a plant calmodulin: Role of the N-and C-lobes in calcium binding, conformational change, and target interaction,” Biochimica et Biophysica Acta (BBA)-Proteins and Proteomics, vol. 1864, no. 3, pp. 297–307. [Google Scholar]
31. M. J. Berardi, W. M. Shih, S. C. Harrison and J. J. Chou. (2011). “Mitochondrial uncoupling protein structure determined by NMR molecular fragment searching,” Nature, vol. 476, no. 7358, pp. 109–113. [Google Scholar]
32. A. Mañas, S. Wang, A. Nelson, J. Li, Y. Zhao. (2017). et al., “The functional domains for Bax∆ 2 aggregate-mediated caspase 8-dependent cell death,” Experimental Cell Research, vol. 359, no. 2, pp. 342–355. [Google Scholar]
33. X. Xu, J. Liang, Z. Zhang, T. Jiang and R. Yu. (2019). “Blockade of human α7 nicotinic acetylcholine receptor by α-Conotoxin ImI dendrimer: Insight from computational simulations,” Marine Drugs, vol. 17, no. 5, pp. 303–305. [Google Scholar]
34. A. A. Parikesit, B. Ardiansah, D. M. Handayani, U. S. F. Tambunan and D. Kerami. (2016). “Virtual screening of Indonesian flavonoid as neuraminidase inhibitor of influenza a subtype H5N1,” IOP Conference Series: Materials Science and Engineering, vol. 107, no. 1, pp. 12053–12062. [Google Scholar]
35. M. Winiewska-Szajewska, D. Płonka, I. Zhukov and J. Poznański. (2019). “Rational drug-design approach supported with thermodynamic studies: A peptide leader for the efficient bi-substrate inhibitor of protein kinase CK2,” Scientific Reports, vol. 9, no. 1, pp. 1–11. [Google Scholar]
36. H. Li and Y. Guan. (2020). “Machine learning empowers phosphoproteome prediction in cancers,” Bioinformatics, vol. 36, no. 3, pp. 859–864. [Google Scholar]
37. H. J. Kao, S. L. Weng, K. Y. Huang, F. J. Kaunang, J. B. K. Hsu. (2017). et al., “MDD-carb: A combinatorial odel for the identification of protein carbonylation sites with substrate motifs,” BMC Systems Biology, vol. 11, no. 7, pp. 137–139. [Google Scholar]
38. Y. Gao, Y. Li, C. Zhang, M. Zhao, C. Deng. (2016). et al., “Enhanced purification of ubiquitinated proteins by engineered tandem hybrid ubiquitin-binding domains (ThUBDs),” Molecular & Cellular Proteomics, vol. 15, no. 4, pp. 1381–1396. [Google Scholar]
39. M. K. Panner Selvam, A. Agarwal and P. N. Pushparaj. (2019). “A quantitative global proteomics approach to understanding the functional pathways dysregulated in the spermatozoa of asthenozoospermic testicular cancer patients,” Andrology, vol. 7, no. 4, pp. 454–462. [Google Scholar]
40. S. Song, G. J. Hooiveld, W. Zhang, M. Li, F. Zhao. (2016). et al., “Comparative proteomics provides insights into metabolic responses in rat liver to isolated soy and meat proteins,” Journal of Proteome Research, vol. 15, no. 4, pp. 1135–1142. [Google Scholar]
41. T. Miyazaki, R. Miyashita, S. Nakamura, M. Ikegaya, T. Kato. (2019). et al., “Biochemical characterization and mutational analysis of silkworm Bombyx mori β-1, 4-N-acetylgalactosaminyltransferase and insight into the substrate specificity of β-1, 4-galactosyltransferase family enzymes,” Insect Biochemistry and Molecular Biology, vol. 115, pp. 1–39. [Google Scholar]
42. W. R. Qiu, B. Q. Sun, X. Xiao, Z. C. Xu and K. C. Chou. (2016). “iHyd-PseCp: Identify hydroxyproline and hydroxylysine in proteins by incorporating sequence-coupled effects into general PseAAC,” Oncotarget, vol. 7, no. 28, pp. 44310–44321. [Google Scholar]
43. S. Ilyas, W. Hussain, A. Ashraf, Y. D. Khan, S. A. Khan. (2019). et al., “iMethylK-PseAAC: Improving accuracy of lysine methylation sites identification by incorporating statistical moments and position relative features into general PseAAC via Chou’s 5-steps rule,” Current Genomics, vol. 20, no. 4, pp. 275–292. [Google Scholar]
44. L. Jiang, J. Zhang, P. Xuan and Q. Zou. (2016). “BP neural network could help improve pre-miRNA identification in various species,” BioMed Research International, vol. 2016, pp. 1–11. [Google Scholar]
45. R. A. Studer, R. Rodriguez-Mias, K. M. Haas, J. I. Hsu, C. Viéitez. (2016). et al., “Evolution of protein phosphorylation across 18 fungal species,” Science, vol. 354, pp. 229–232. [Google Scholar]
46. F. Luo, M. Wang, Y. Liu, X. M. Zhao and A. Li. (2019). “DeepPhos: Prediction of protein phosphorylation sites with deep learning,” Bioinformatics, vol. 35, no. 16, pp. 2766–2773. [Google Scholar]
47. Y. Gao, W. Hao, J. Gu, D. Liu, C. Fan. (2016). et al., “PredPhos: An ensemble framework for structure-based prediction of phosphorylation sites,” Journal of Biological Research-Thessaloniki, vol. 23, no. 1, pp. 12–14. [Google Scholar]
48. D. P. Byrne, M. Vonderach, S. Ferries, P. J. Brownridge, C. E. Eyers. (2016). et al., “cAMP-dependent protein kinase (PKA) complexes probed by complementary differential scanning fluorimetry and ion mobility-mass spectrometry,” Biochemical Journal, vol. 473, no. 19, pp. 3159–3175. [Google Scholar]
49. D. Li, Y. Ju and Q. Zou. (2016). “Protein folds prediction with hierarchical structured SVM,” Current Proteomics, vol. 13, no. 2, pp. 79–85. [Google Scholar]
50. S. Lin, Q. Song, H. Tao, W. Wang, W. Wan. (2015). et al., “Rice_Phospho 1.0: A new rice-specific SVM predictor for protein phosphorylation sites,” Scientific Reports, vol. 5, pp. 119–122. [Google Scholar]
51. R. Z. Han, D. Wang, Y. H. Chen, L. K. Dong and Y. L. Fan. (2017). “Prediction of phosphorylation sites based on the integration of multiple classifiers,” Genetics and Molecular Research, vol. 16, no. 1, pp. 1–9. [Google Scholar]
52. G. Cheng, Q. Chen and R. Zhang. (2019). “Prediction of phosphorylation sites based on granular support vector machine,” Granular Computing, vol. 25, no. 1, pp. 1–11. [Google Scholar]
53. H. Fu, Y. Yang, X. Wang, H. Wang and Y. Xu. (2019). “DeepUbi: A deep learning framework for prediction of ubiquitination sites in proteins,” BMC Bioinformatics, vol. 20, no. 1, pp. 1–10. [Google Scholar]
54. Z. Chen, Y. Z. Chen, X. F. Wang, C. Wang, R. X. Yan. (2011). et al., “Prediction of ubiquitination sites by using the composition of k-spaced amino acid pairs,” PLoS One, vol. 6, no. 7, e22930. [Google Scholar]
55. F. Li, C. Li, T. T. Marquez-Lago, A. Leier and T. Akutsu. (2018). “Quokka: A comprehensive tool for rapid and accurate prediction of kinase family-specific phosphorylation sites in the human proteome,” Bioinformatics, vol. 34, no. 24, pp. 4223–4231. [Google Scholar]
56. J. Song, H. Wang, J. Wang, A. Leier, T. Marquez-Lago. (2017). et al., “PhosphoPredict: A bioinformatics tool for prediction of human kinase-specific phosphorylation substrates and sites by integrating heterogeneous feature selection,” Scientific Reports, vol. 7, no. 1, pp. 1–19. [Google Scholar]
57. F. Ardito, M. Giuliani, D. Perrone, G. Troiano, L. L. Muzio. (2017). et al., “The crucial role of protein phosphorylation in cell signaling and its use as targeted therapy,” International Journal of Molecular Medicine, vol. 40, no. 2, pp. 271–280. [Google Scholar]
58. J. Song, H. Wang, J. Wang, A. Leier, T. Marquez-Lago. (2017). et al., “PhosphoPredict: A bioinformatics tool for prediction of human kinase-specific phosphorylation substrates and sites by integrating heterogeneous feature selection,” Scientific Reports, vol. 7, no. 1, pp. 1–19. [Google Scholar]
59. I. Krystkowiak, J. Manguy and N. E. Davey. (2018). “PSSMSearch: A server for modeling, visualization, proteome-wide discovery and annotation of protein motif specificity determinants,” Nucleic Acids Research, vol. 46, no. W1, pp. W235–W241. [Google Scholar]
60. Y. Cai, T. Huang, L. Hu, X. Shi, L. Xie. (2012). et al., “Prediction of lysine ubiquitination with mRMR feature selection and analysis,” Amino Acids, vol. 42, no. 4, pp. 1387–1395. [Google Scholar]
61. P. Radivojac, V. Vacic, C. Haynes, R. R. Cocklin, A. Mohan. (2010). et al., “Identification, analysis, and prediction of protein ubiquitination sites,” Proteins: Structure, Function, and Bioinformatics, vol. 78, no. 2, pp. 365–380. [Google Scholar]
62. F. Luo, M. Wang, Y. Liu, X. Zhao and A. Li. (2019). “DeepPhos: Prediction of protein phosphorylation sites with deep learning,” Bioinformatics, vol. 35, no. 16, pp. 2766–2773. [Google Scholar]
63. W. F. Zeng, X. X. Zhou, W. J. Zhou, H. Chi, J. Zhan. (2019). et al., “MS/MS spectrum prediction for modified peptides using deep2 trained by transfer learning,” Analytical Chemistry. [Google Scholar]
64. H. Fu, Y. Yang, X. Wang, H. Wang and Y. Xu. (2019). “DeepUbi: A deep learning framework for prediction of ubiquitination sites in proteins,” BMC Bioinformatics, vol. 20, no. 1, pp. 86. [Google Scholar]
65. P. Sun, Y. Chen, B. Liu, Y. Gao, Y. Han. (2019). et al., “DeepMRMP: A new predictor for multiple types of RNA modification sites using deep learning,” Mathematical Biosciences and Engineering, vol. 16, pp. 6231–6241. [Google Scholar]
66. Z. Ju, J. Sun, Y. Li and L. Wang. (2017). “Predicting lysine glycation sites using bi-profile bayes feature extraction,” Computational Biology and Chemistry, vol. 71, pp. 98–103. [Google Scholar]
67. X. Zhao, X. Zhao, L. Bao, Y. Zhang, J. Dai. (2017). et al., “Glypre: In silico prediction of protein glycation sites by fusing multiple features and support vector machine,” Molecules, vol. 22, no. 11, pp. 1891–1893. [Google Scholar]
68. M. M. Islam, S. Saha, M. M. Rahman, S. Shatabda, D. M. Farid. (2018). “Identifying protein glycation sites using sequence and structure-based features,” Proteins: Structure, Function, and Bioinformatics, vol. 86, no. 7, pp. 777–789. [Google Scholar]
69. H. M. Reddy, A. Sharma, A. Dehzangi, D. Shigemizu, A. A. Chandra. (2019). et al., “GlyStruct: Glycation prediction using structural properties of amino acid residues,” BMC Bioinformatics, vol. 19, no. 13, pp. 547–548. [Google Scholar]
70. T. Li, Q. Yin, R. Song, M. Gao and Y. Chen. (2019). “Multidimensional scaling method for prediction of lysine glycation sites,” Computing, vol. 101, no. 6, pp. 705–724. [Google Scholar]
71. S. M. Shovan and M. A. Hasan. (2019). “Prediction of Lysine Glycation PTM site in Protein using Peptide Sequence Evolution based Features,” in Int. Conf. on Electrical, Computer and Communication Engineering, IEEE, pp. 1–5. [Google Scholar]
72. K. C. Chou. (2011). “Some remarks on protein attribute prediction and pseudo amino acid composition,” Journal of Theoretical Biology, vol. 273, no. 1, pp. 236–247. [Google Scholar]
73. V. S. Spelmen and R. Porkodi. (2018). “A review on handling imbalanced data,” in 2018 Int. Conf. on Current Trends Towards Converging Technologies (ICCTCTIEEE, Coimbatore, India, pp. 1–11. [Google Scholar]
74. K. C. Chou. (2015). “Impacts of bioinformatics to medicinal chemistry,” Medicinal Chemistry, vol. 11, no. 3, pp. 218–234. [Google Scholar]
75. S. Amanat, A. Ashraf, W. Hussain, N. Rasool and Y. D. Khan. (2020). “Identification of lysine carboxylation sites in proteins by integrating statistical moments and position relative features via general PseAAC,” Current Bioinformatics, vol. 15, no. 5, pp. 396–407. [Google Scholar]
76. K. C. Chou. (2019). “Impacts of pseudo amino acid components and 5-steps rule to proteomics and proteome analysis,” Current Topics in Medicinal Chemistry, vol. 19, no. 25, pp. 2283–2300. [Google Scholar]
77. Y. D. Khan, F. Ahmad and M. W. Anwar. (2012). “A neuro-cognitive approach for iris recognition using back propagation,” World Applied Sciences Journal, vol. 16, no. 5, pp. 678–685. [Google Scholar]
78. Y. D. Khan, F. Ahmed and S. A. Khan. (2014). “Situation recognition using image moments and recurrent neural networks,” Neural Computing and Applications, vol. 24, no. 7–8, pp. 1519–1529. [Google Scholar]
79. Y. D. Khan, S. A. Khan, F. Ahmad and S. Islam. (2014). “Iris recognition using image moments and k-means algorithm,” Scientific World Journal, vol. 2014, no. 2, pp. 1–9. [Google Scholar]
80. A. H. Butt, S. A. Khan, H. Jamil, N. Rasool and Y. D. Khan. (2016). “A prediction model for membrane proteins using moments-based features,” Biomed Research International, vol. 2016, no. 4, pp. 1–7. [Google Scholar]
81. A. H. Butt, N. Rasool and Y. D. Khan. (2017). “A treatise to computational approaches towards prediction of membrane protein and its subtypes,” Journal of Membrane Biology, vol. 250, no. 1, pp. 55–76. [Google Scholar]
82. Y. D. Khan, N. S. Khan, S. Farooq, A. Abid, S. A. Khan. (2014). et al., “An efficient algorithm for recognition of human actions,” Scientific World Journal, vol. 2014, no. 2, pp. 1–11. [Google Scholar]
83. S. Sun, Y. Hu, M. Ao, P. Shah, J. Chen. (2019). et al., “N-GlycositeAtlas: A database resource for mass spectrometry-based human N-linked glycoprotein and glycosylation site mapping,” Clinical Proteomics, vol. 16, no. 1, pp. 1–11. [Google Scholar]
84. S. Athey, J. Tibshirani and S. Wager. (2019). “Generalized random forests,” Annals of Statistics, vol. 47, no. 2, pp. 1148–1178. [Google Scholar]
85. M. N. Gabere, M. A. Hussein and M. A. Aziz. (2016). “Filtered selection coupled with support vector machines generate a functionally relevant prediction model for colorectal cancer,” Oncotargets and Therapy, vol. 9, pp. 3313–3315. [Google Scholar]
86. R. Iniesta, D. Stahl and P. McGuffin. (2016). “Machine learning, statistical learning and the future of biological research in psychiatry,” Psychological Medicine, vol. 46, no. 12, pp. 2455–2465. [Google Scholar]
87. D. Q. Zeebaree, H. Haron and A. M. Abdulazeez. (2018). “Gene selection and classification of microarray data using convolutional neural network,” in 2018 Int. Conf. on Advanced Science and Engineering (ICOASEKurdistan Region of Iraq, pp. 145–150. [Google Scholar]
88. R. Hoffman and D. Lazaridis. (2013). “The limits of compulsion: Demographic influences on voter turnout in Australian state elections,” Australian Journal of Political Science, vol. 48, no. 1, pp. 28–43. [Google Scholar]
89. D. S. Huang, L. Zhang, K. Han, S. Deng, K. Yang. (2014). et al., “Prediction of protein-protein interactions based on protein-protein correlation using least squares regression,” Current Protein and Peptide Science, vol. 15, no. 6, pp. 553–560. [Google Scholar]
90. Q. Liu, J. Lu and S. Chen. (2014). “Design and analysis of traffic incident detection based on random forest,” Journal of Southeast University, vol. 1, pp. 88–95. [Google Scholar]
91. B. Liu, F. Yang, D. S. Huang and K. C. Chou. (2017). “IPromoter-2L: A two-layer predictor for identifying promoters and their types by multi-window-based PseKNC,” Bioinformatics, vol. 34, no. 1, pp. 33–40. [Google Scholar]
92. K. C. Chou. (2011). “Some remarks on protein attribute prediction and pseudo amino acid composition,” Journal of Theoretical Biology, vol. 273, no. 1, pp. 236–247. [Google Scholar]
93. A. Dehzangi, R. Heffernan, A. Sharma, J. Lyons, K. Paliwal. (2015). et al., “Gram-positive and gram-negative protein subcellular localization by incorporating evolutionary-based descriptors into Chou’s general PseAAC,” Journal of Theoretical Biology, vol. 364, pp. 284–294. [Google Scholar]
94. E. M. Yasser, D. Dobbs and V. G. Honavar. (2017). “In silico prediction of linear B-cell epitopes on proteins,” in Prediction of Protein Secondary Structure, New York, NY: Humana Press, pp. 255–264. [Google Scholar]
95. X. J. Zhu, C. Q. Feng, H. Y. Lai, W. Chen and L. Hao. (2019). “Predicting protein structural classes for low-similarity sequences by evaluating different features,” Knowledge-Based Systems, vol. 163, pp. 787–793. [Google Scholar]
96. K. C. Chou. (2011). “Some remarks on protein attribute prediction and pseudo amino acid composition,” Journal of Theoretical Biology, vol. 273, no. 1, pp. 236–247. [Google Scholar]
97. F. Ali and M. Hayat. (2015). “Classification of membrane protein types using voting feature interval in combination with Chou’s pseudo amino acid composition,” Journal of Theoretical Biology, vol. 384, pp. 78–83. [Google Scholar]
98. J. Chen, R. Long, X. L. Wang, B. Liu, K. C. Chou. (2016). et al., “DRHP-PseRA: Detecting remote homology proteins using profile-based pseudo protein sequence and rank aggregation,” Scientific Reports, vol. 6, no. 1, D204. [Google Scholar]
99. K. Ahmad, M. Waris and M. Hayat. (2016). “Prediction of protein submitochondrial locations by incorporating dipeptide composition into Chou’s general pseudo amino acid composition,” Journal of Membrane Biology, vol. 249, no. 3, pp. 293–304. [Google Scholar]
 | This work is licensed under a Creative Commons Attribution 4.0 International License, which permits unrestricted use, distribution, and reproduction in any medium, provided the original work is properly cited. |