DOI:10.32604/cmc.2020.013733
| Computers, Materials & Continua DOI:10.32604/cmc.2020.013733 | |
| Article |
How Can Lean Manufacturing Lead the Manufacturing Sector during Health Pandemics Such as COVID 19: A Multi Response Optimization Framework
Department of Industrial Engineering, German Jordanian University, Amman, 11841, Jordan
*Corresponding Author: Abdallah Ali Abdallah. Email: alab9819@gmail.com; abdallah.abdallah@gju.edu.jo
Received: 19 August 2020; Accepted: 14 September 2020
Abstract: Lean manufacturing has been used for the last few decades as a process and performance improvement tool. Initially known as Toyota production system (TPS), lean is now used in almost all service and manufacturing sectors to deliver favorable results such as decreased operational cost, increased customer satisfaction, decreased cycle time, and enhanced profits. During the coronavirus disease (COVID 19) pandemic, the manufacturing sector struggled immensely and could not function well even after lockdown was eased in many countries. Many companies found out there are not ready to conform with new regulations made by authorities in many countries. This paper proposes the use of simulation and multi response optimization in addition to other typical lean tools in order to arrive at optimum performance at the end of each project through an established optimization framework. The framework is used in a real case study performed at an aluminum extrusion factory. Lean manufacturing helps organizations to operate with smaller number of resources. It standardizes all processes so that most of the jobs can be done by most of the workers, but this is not enough to create a healthy, sanitized work place. Our framework utilizes the strengths of lean tools and adds pandemic readiness factor to them to ensure improvement in performance and health pandemic readiness. Implementation of the framework in the case company resulted in 50% reduction in labor, $730000 in expected annual cost savings, reduction in inventory levels, improved employee morale and the achievement of pandemic ready status.
Keywords: Lean manufacturing; COVID 19; health pandemics; simulation; desirability index; optimization
Coronavirus disease (COVID 19) has changed the way we look at how we run our businesses. Many companies did not care to create a healthy and clean workplace, especially if such companies are not in the food or drug or healthcare sectors. During the COVID 19 pandemic, every company is required to sanitize the workplace and ensure it looks like a hospital, otherwise, such companies may not be allowed to operate [1].
Most companies measure performance of all its units/departments and of the whole organization. Performance measurements may include profits, sales, market share, employee’s engagement, and process improvement, but in most cases, these measures do not include the sanitary state of the workplace or the level and nature of physical interaction between workers. The ironic part is that, the sanitization, and physical interaction between employees are becoming vital factors influencing operations in health pandemics.
Companies typically use a quality or a continuous improvement method to help enhance their performance. These methods have been used for decades with various success rates [2–4]. In this report we focus on lean manufacturing as one of the continuous improvement tools used in many industries for the last few decades.
Created by Toyota for manufacturing, lean seems to have successful applications in the healthcare and other service sectors [5,6]. Lean thrives on analysing and standardizing processes, eliminating waste and creating value. It has been proven to help hospitals in every aspect of its operations to improve service, reduce cost, minimize errors, and improve profitability [7]. Womack et al. [8] laid out a full array of lean tools and established a new way of thinking of continuous improvements, especially in the manufacturing settings. Lean management is a culture that is built on a number of interconnected tools. Each tool achieves reduction in process time, or reduction in none value added activities, but at the core of lean, few tools are considered vital for worker healthcare [9], including:
A discipline of five types of activities that can be summarized as follows:
Sort: Sort everything in the workplace and only keep around you what you need.
Straighten: Everything kept in the workplace shall have a place and shall be put in its place.
Shine: The workplace shall be cleaned, sanitized, dusted, painted and kept healthy.
Standardize The first there actions need to become a part of the daily work in a standardized manner.
Sustain: Take action to keep these activities in the workplace for good.
5S cleans the workplace from unneeded clutter and keeps it tidy and healthy [10,11].
This includes the use of any visual aids in the workplace [12], such as signs, floor marking and alarm lights. These signs make the workplace clear, clean and healthy and any abnormality in the workplace will be very visible.
Gemab is a Japanese world that means workplace, but the true meaning of gemba in lean is to make the workplace thrive with continuous enhancements. Under this concept, the workplace is a place that does not have any work flaw or health flaw [13].
2.1.4 Worker Stability and Cross Training
Lean manufacturing focusses on the well-being of all employees. The Japanese parental management model is used extensively in lean. Furthermore, cross training allows most workers to do almost any task in the workplace. The two concepts allow for smaller number of worker to do the job in comparison with companies that do not apply lean [14].
2.1.5 Value Stream Mapping (VSM)
VSM is a powerful tool used to draw the current state and proposed future state for any process. It differs than a typical process map or a flow chart by the fact that it clarifies all value added and none vale added activities. It also clarifies the flow of information and product in the process. VSM is used as a tool to realize areas for improvements in the process [8].
Healthy workplace under the COVID 19 pandemic means much more than just psychological health of employees; it now also means:
• Sanitizing all surfaces in the workplace.
• Workers wearing gloves and masks.
• Allowing no more than 50% of the workers to do the job in order to ensure social distancing.
• Very limited physical interpersonal interactions.
• Well ventilated work areas.
• These conditions make it quite difficult to achieve the work especially for companies with large number of workers.
The contribution of this research is in introducing a new framework of process optimization using traditional lean methodology along with simulation and multi response optimization. Application of the framework is illustrated with a case involving a major aluminum extrusion factory.
COVID 19 pandemic made it very difficult for many companies to operate. Authorities in many countries limited the abilities of companies to operate, and mandated strict health requirements on these companies. Most companies use quality methods to enhance performance, but do these methods help their preparations for a health pandemic such as COVID 19? And if not, what should companies do in order to be ready? Finally, what should policy makers do in the future to minimize operational hurdles?
Answers to these questions is important for the viability of the business and its ability to sustain operations throughout pandemics.
This project is set to achieve two goals: improve the performance of an extrusion factory and prepare it to be ready to perform well during a health pandemic such as COVID 19. The factory of interest suffers from high scrap rate mounting up to 27 percent, while similar extrusion standard calls for an acceptable rate of 10 percent. Many other performance issues rise with scrap rate including high testing frequency, low employee morale and low customer satisfaction.
The aluminum factory uses a common method called direct extrusion process [15]. Fig. 1 shows the principle of direct extrusion where a heated aluminum billet is placed in a container and then pushed against a die by a mechanical force. The billet travels relative to the walls of the container. The resulting frictional force increases the chance for surface defects on the final product.
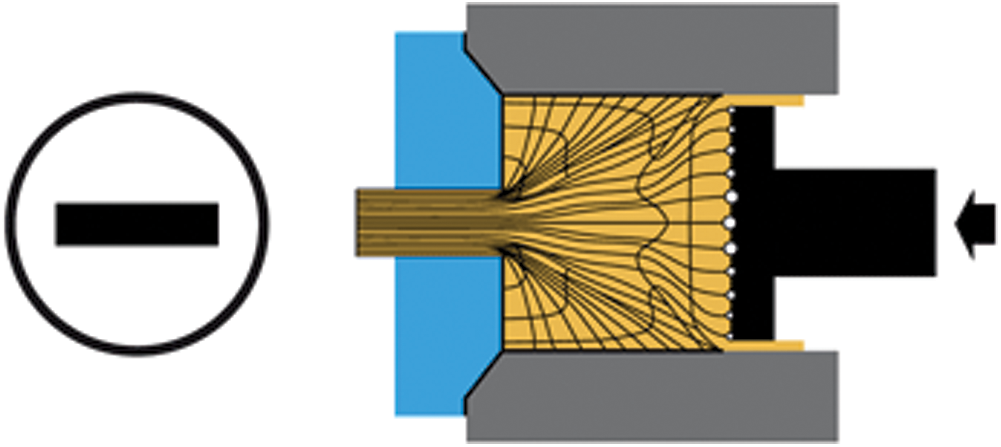
Figure 1: Typical direct extrusion die container
The framework used in this project includes two major modifications applied to traditional lean manufacturing methodology. These modifications include applying simulation to the entire process to capture the effect of any process change. They also include the use of a desirability index (D) after the simulation if finalized. The desirability index is used as a multi response optimization tool to determine the viability of any proposed change. This framework is built based on the work of Abdallah [16].
In the context of multi response optimization, many authors have used a variety of tools to select among alternatives; Pyzdek et al. [17] presented the use of Pareto priority index (PPI) in order to select the best six sigma project to work on. PPI is used in the Define phase to select the projects with the lowest expected duration and highest probability of success to work on. Similarly, Qatawneh et al. [18] used an Importance Index (II) to select projects in healthcare logistics. II is used in the Define phase to select the projects related to inventory items with the highest criticality and usage. Criticality is estimated based on availability of supplies in the market, cost and ease of handling in the warehouse.
Many authors used a desirability index or desirability function to prioritize and select the most desirable solution when faced with competing responses [19–21]. Desirability index calculates the desirability of each solution based on how well it scores on multiple criteria. Each criterion has performance limits for its operating range; within these limits ideal performance is considered desirable and some limits represent an unacceptable performance [22].
For each criterion Yi(x), a desirability function di(Yi) assigns numbers between 0 and 1 to the possible values of Yi, with di(Yi) = 0 representing a completely undesirable performance of Yi and di(Yi) = 1 representing a completely desirable or ideal performance. The individual desirability values are then combined using geometric mean, which gives the overall desirability (D), formulated for k responses as:
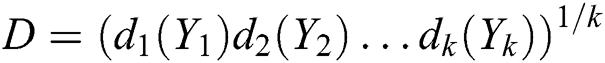
In this research, we follow the approach proposed by the National Institute of Standards and Technology (NIST) on desirability. NIST divided criteria into three classes: target is best criteria, where any deviation of the performance above or below the target is undesirable. Second class consists of criteria to be maximized, such as cost savings. In this case the target will get a score of 1 and a lower undesirable limit is assigned with a score of 0.
Finally, a third class consists of criteria to be minimized, such as total process time, project cost and project implementation time. In this class the target will be a lower desirable limit with a score of 1 and a higher undesirable value is assigned with a score of 0. In our research, we do not have any “target is best” criterion; we have maximized and minimized types only. A full description and calculation can be found in the NIST website: (https://www.itl.nist.gov/div898/handbook/pri/section5/pri5322.htm).
When using lean tools to improve process performance, many possible solutions can arise. Some solutions are considered quick wins, since they provide high benefits at a low cost and can be implemented in a short time. Other solutions may come with a high cost or a long implementation time. In fact, many of the alternative solutions are projects and may need detailed planning and execution. To use desirability index as a tool for selection in this case, the following criteria are used: annual operational cost savings (OC), process efficiency (EFF), pandemic preparedness (PP), implementation time for proposed solution (IT), and project cost (PC).
Estimated values used for OC, PP, EFF, IT and PC are best estimates based on all available information after simulating the proposed process changes. The higher the calculated overall desirability the better, so, if we have multiple proposed solutions, and we cannot implement them all, then we will implement the solution with the highest overall desirability value.
OC and PC are measured in dollars, IT are measured in days or months, while PP and EFF are without a unit. The unit difference is not an issue since each value is standardized based on its range of operation [16]. For example, assume we have three alternatives with actual OC values of $15000, $130000 and $65000. Assume also that management decided that any initiative with annual savings of $10000 or less is not worth pursuing (unacceptable), while the most that can be saved, is not expected to exceed $200000 (ideal). This means an alternative with an OC value of $10000 or less will score zero, while an OC value of $200000 will score one. As for the three values listed in our example, there score is calculated by interpolation as follows:
d(15000) = (15000 − 10000)/(200000 − 10000) = 0.026
d(130000) = (130000 − 10000)/(200000 − 10000) = 0.631
d(65000) = (65000 − 10000)/(200000 − 10000) = 0.289
Process efficiency is calculated as the total value added time (or touch time, as lean people call it) divided by the total lead time or the time spent by one piece from the minute it enters the system as a raw material until it is shipped as a finished usable product. Typically, any process with efficiency levels above 20% is considered lean process.
Pandemic preparedness is a new concept. All proposed process changes are scored on a scale from zero to 1 (or 0% to 100%) based on the following questions:
• Does the change ease sanitizing all surfaces in the workplace?
• For social distancing purposes, does the change allow less interpersonal interactions?
• Does the change affect workplace ventilation positively?
• Does the change lessen the number of workers in the workplace to enhance social distancing?
Each question is scored subjectively by a panel. A score of 1 on any question indicates that the proposed process change raises the performance mentioned in the question to an ideal performance. A score of zero indicates that the proposed process change has a negative impact on the performance mentioned in the question. A score of 0.5 indicates no effect on the performance mentioned in the question. PP score is calculated as the average of the scores on all four questions.
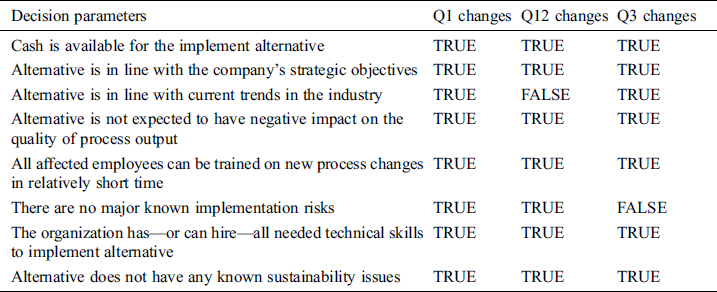
In this paper, we recommend using desirability with two other tools to make selection decision; Alternative evaluation tool and simulation. The first tool is a simple checklist that covers various decision essentials and consequences (see Tab. 3). The selected alternative should score the highest number of “TRUE” values; otherwise, more managerial discussions need to take place before proceeding any further.
Table 3: Alternative evaluation tool for the aluminum factory
Finally, simulation is used to verify metrics such as cycle time, resource usage and utilization, WIP percentage and many others. These metrics provide a confirmation on the estimated values in the desirability equation.
The combined use of desirability, alternative evaluation tool, and simulation is recommended since the combination helps to create sound managerial decisions to select the best alternative [23].
The full project framework describing the suggested methodology is shown in Fig. 2.
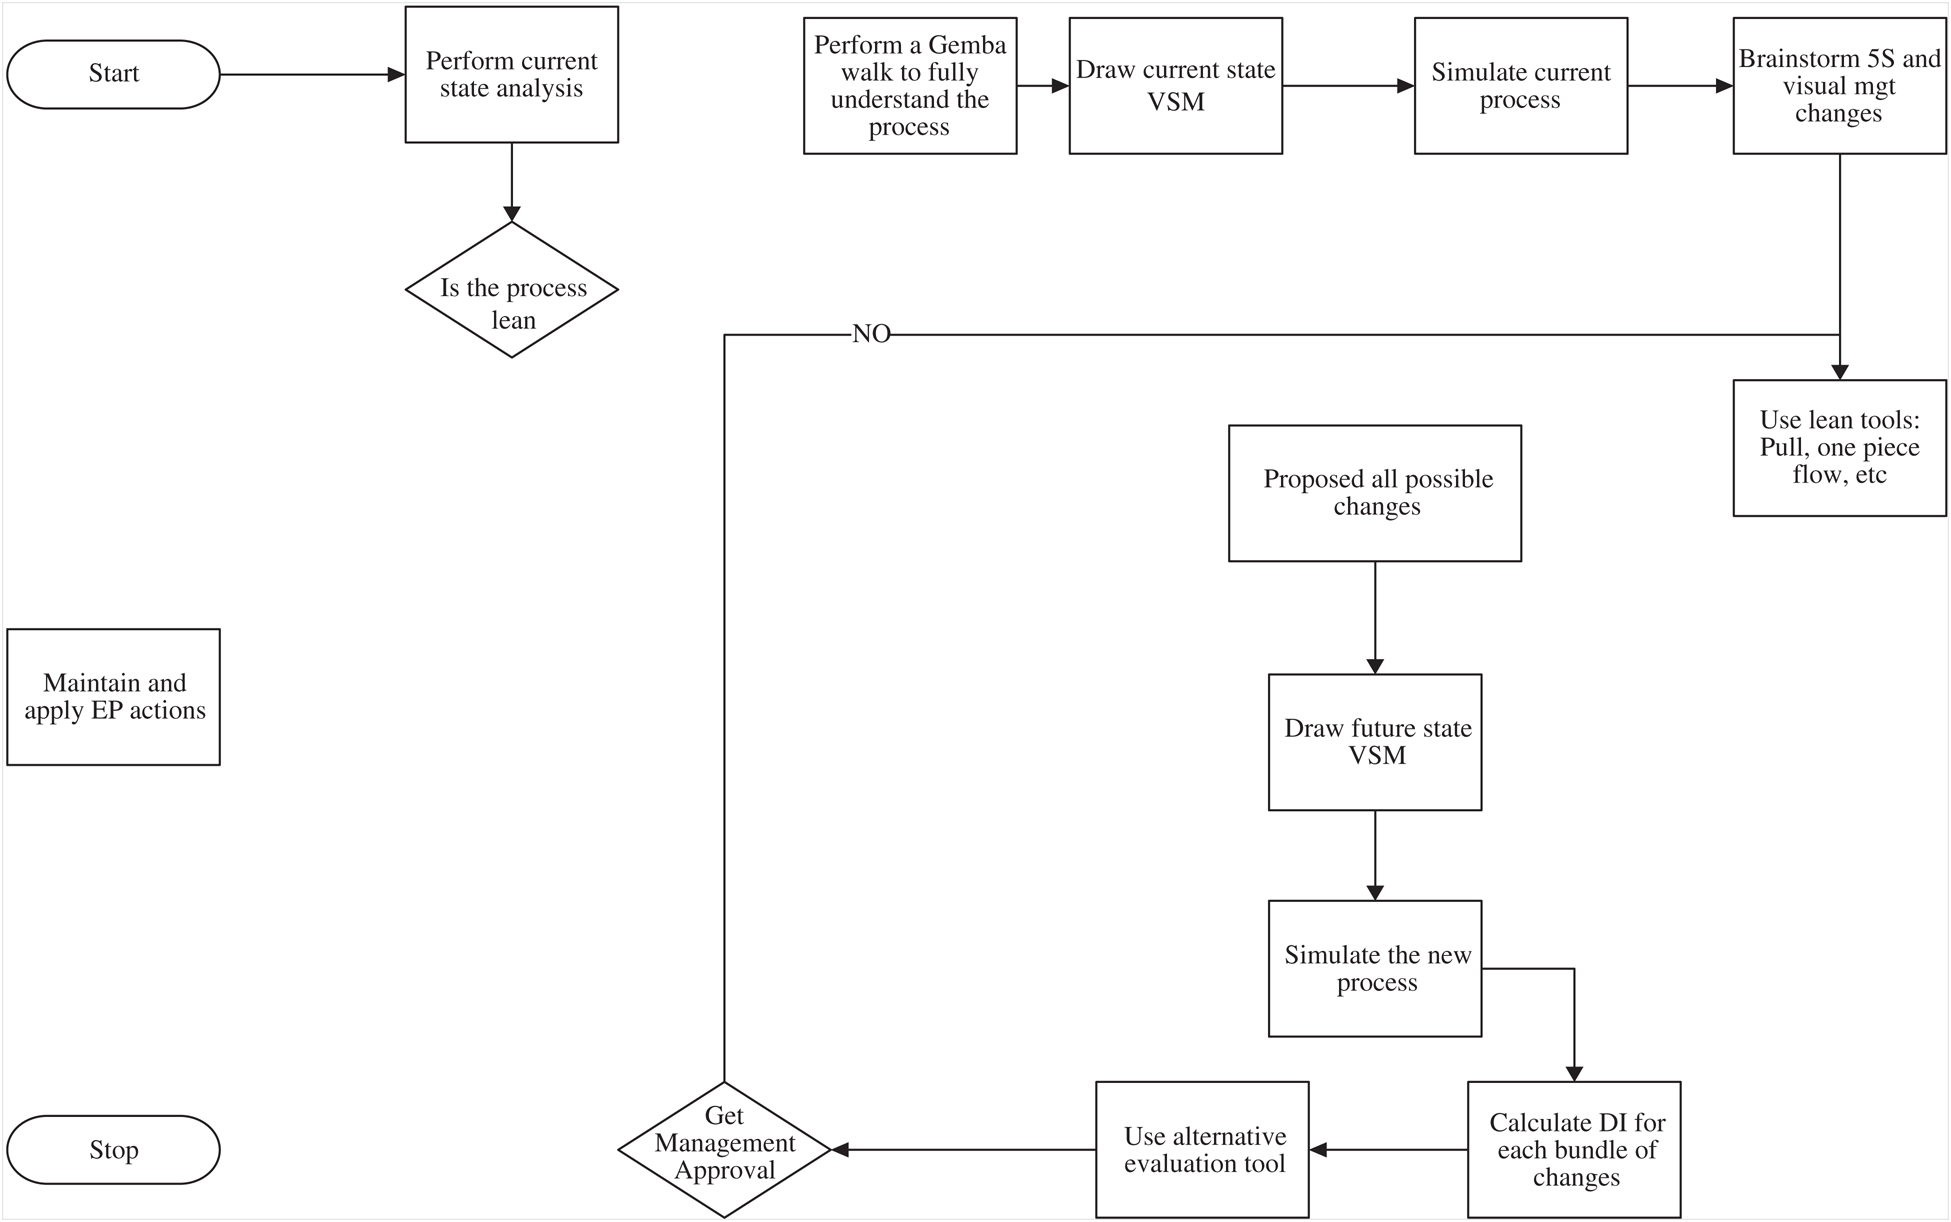
Figure 2: Framework for applying lean tools
The aluminum factory under study uses two extrusion lines: line for 8-inch logs and another line for inch logs. These log or billets come for a local vendor. Each line has the following process steps:
• Heating: Logs are heated to 480 degrees to soften them for the extrusions process.
• Hot Shear: Immediately out of the oven, logs are cut into pieces, each is 1 m long.
• Powdering: Each piece is powdered using Boron Nitride to prevent aluminum from sticking to the container.
• Loading: The billet is positioned on the extruder and pushed toward the die.
• Extrusion Process: Dummy block pushes the billet against the die. The system is isothermal. Die is heated in advance in a special oven to a temperature of 480.
• Quality check: After extrusion process, profiles are formed with lengths that vary between 36 to 48 m. Operator checks for all surface defects.
• Stretching: After the required length is extruded and pulled along the line, the profiles are then dragged to the stretching area. The stretching eliminates small curves that might have appeared on the profile, and it strengthens the profile.
• Sawing: Profiles are cut into smaller identical pieces (usually a profile with length of 36 m is cut into 6 smaller profiles each with a length of 6 m).
• Hardening: Profiles are arranged in a basket and inserted in a hardening oven at a temperature of 185 to 190 degrees.
• Powdering and final paint.
• Packaging and shipping.
This factory was selected in this project for the following reasons:
Scrap rate of the extrusion process reaches 27%, which is considered quite high.
The factory suffers from many quality issues including continuous tampering from operators in machine speeds, oven temperatures, etc. This cause aluminum billets to be jammed in the container and sometimes cause damage to parts of the machine itself.
The factory operates in a dirty workplace, which makes its chance to operate during health pandemics very low.
As a result, the operational cost is considered high, and the company is not ready to comply with authority’s regulations concerning functioning during a health epidemic.
An initial simulation model for the process revealing the process area along with the outside storage areas for incoming logs is shown in Fig. 3. Simulation model and all VSM maps were created using the factory’s current process maps for all processes and sub processes. This is a typical process used in process optimization [24–26].
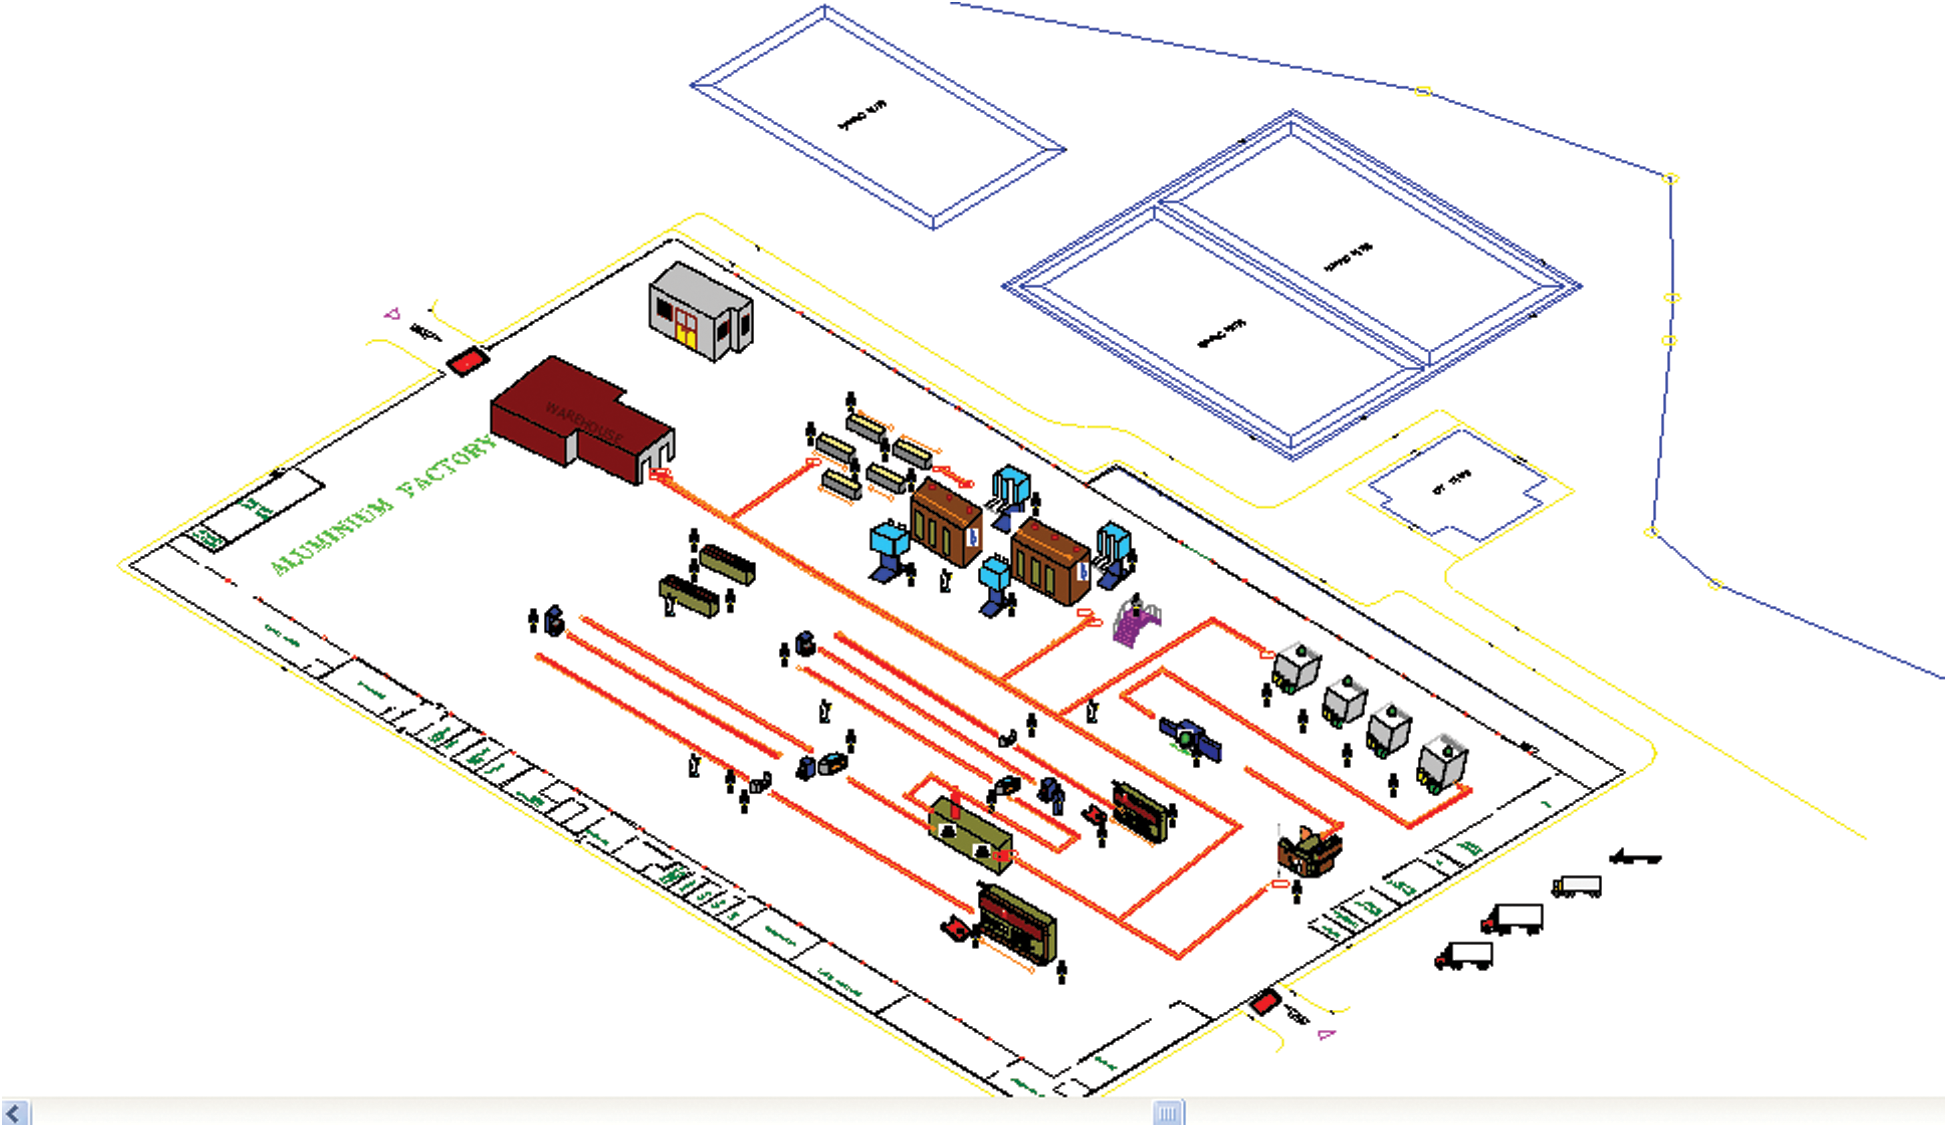
Figure 3: Aluminum factory processes and layout
The current state reveals a stable process but not lean; the process is a pure “push” process and no indications for any initiatives similar to 5S and visual management activities. The number of workers in the factory is 65 worker. Which makes the workplace crowded since internal factory area is only 1.5 square km.
A thorough gemba walk was necessary to fully understand the process and be able to collect data for the VSM and simulation models.
4.2 Value Stream Map (VSM) for the Current State
A full version of the current state VSM is shown in Fig. 4. The figure describes all flaws in the current process, which can be illustrated as follows:
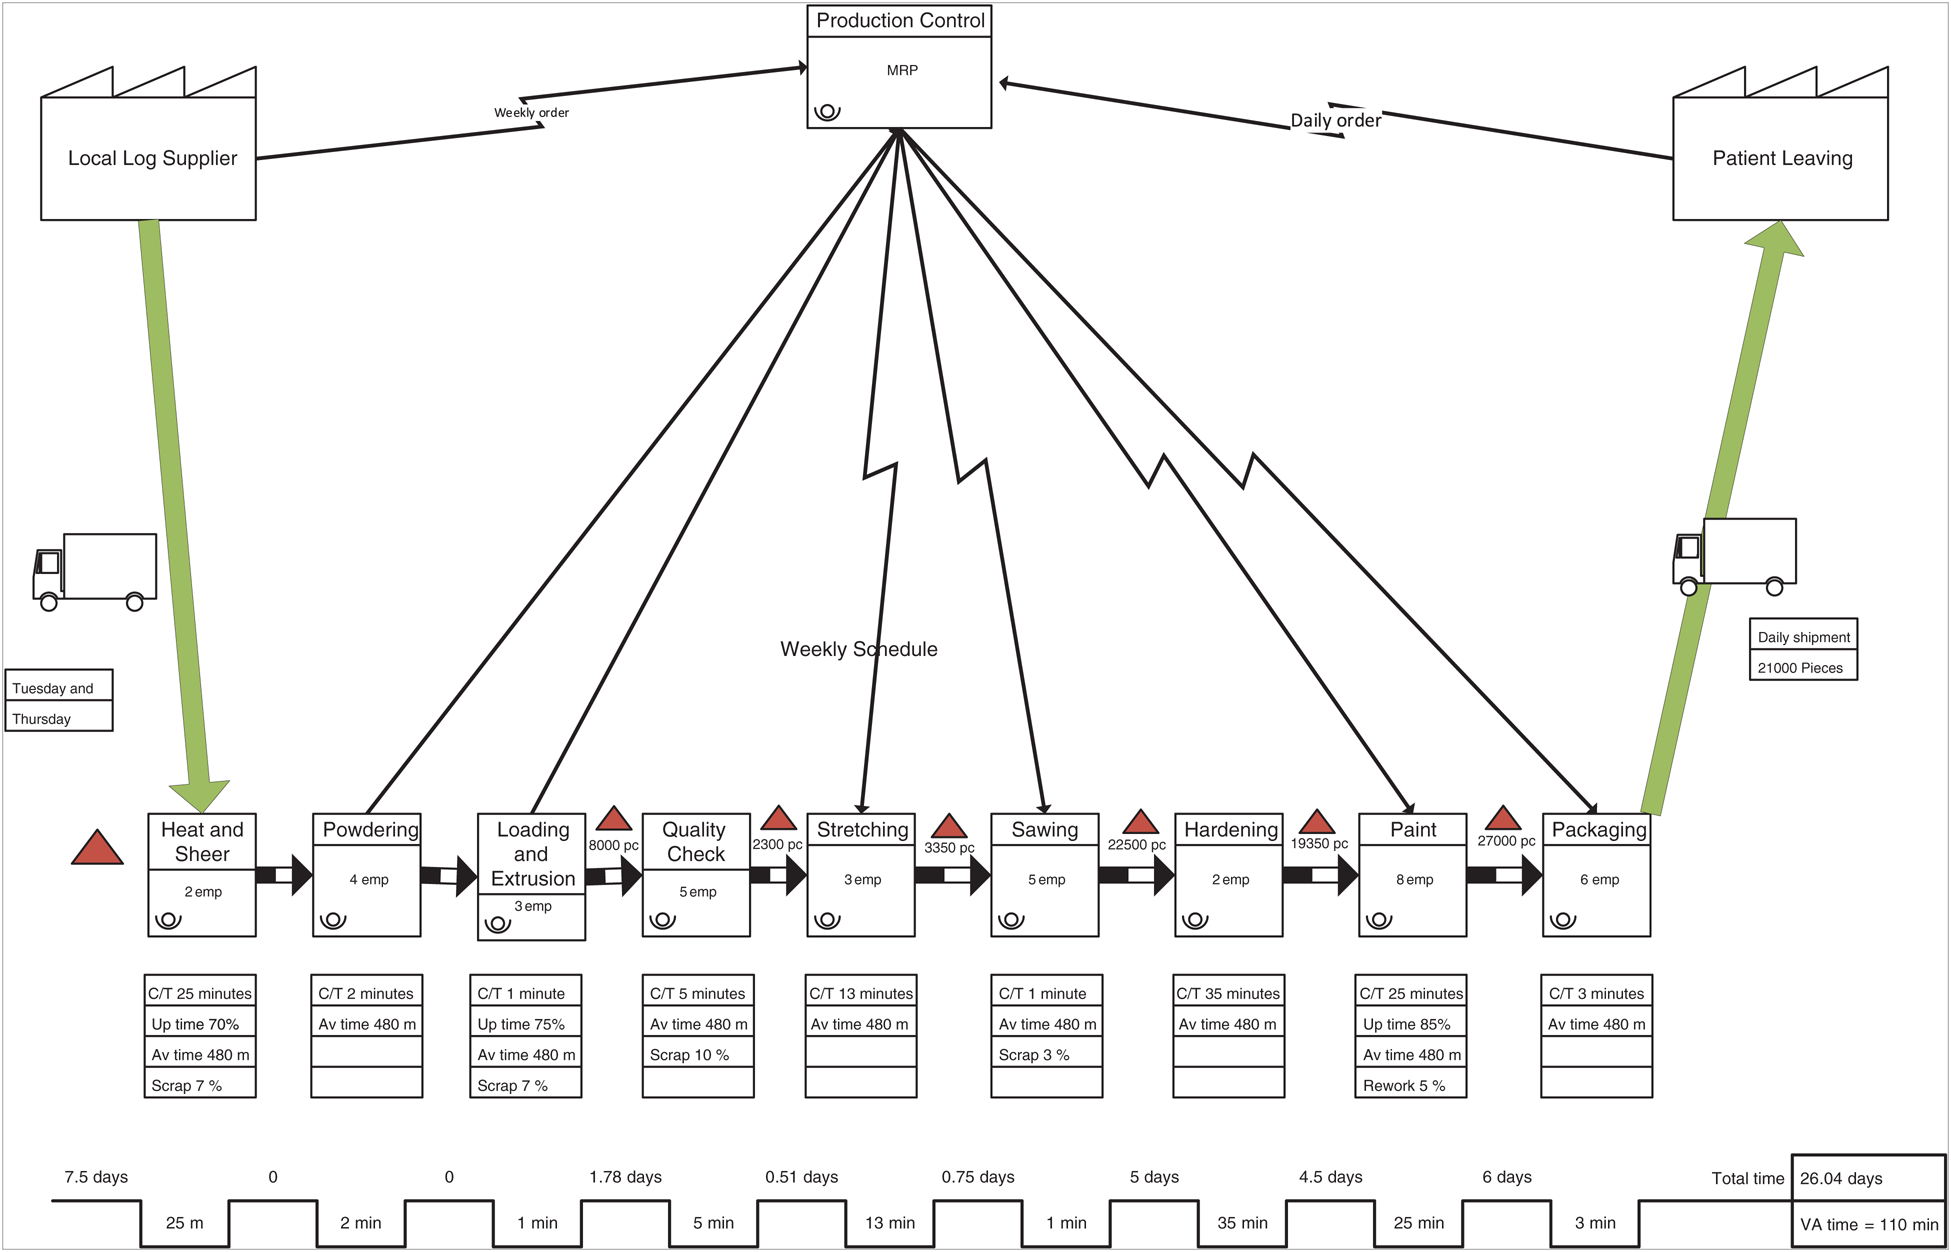
Figure 4: VSM for the process at its current state
• The process is pure push; every step makes whatever it can then pushes it to the next step.
• In the process, many workers are working and interacting infinitely. 38 employees are working in the process, in addition to those working in the yard and the storage areas.
• Efficiency can be calculated by dividing value added time (110 minutes) over total lead-time (26.04 days), which comes up to 0.009. This is an indication of a process that is not lean.
• Inventory levels are quite high between processes and in storage areas.
• Rework level stands at 5% and scrap rate at 27%
• Up time is less than 100% for most working machines.
What the figure does not show, is the level of dirt, this shop operates in. As a workshop, it functions in a very unhealthy environment.
Next step is set to see what lean tools can be implemented. The list of proposed changes after few days of brain storming was very long. Following is a list of the important proposed lean changes:
• Full 5S and visual management training: the place needs a full week of training and implementation projects to be followed by audits plans.
• Purchasing new extruder and a new die oven. The extruder seems to create the highest level of scrap, which is caught either at the extruder or in the quality check step. This will also eliminate the need for 1 employee.
• Implementing total productive maintenance (TPM) for the paint-spraying machine, the saw and the heating oven.
• Eliminating packaging and combining it with the paint group. This will save 6 employees.
• Minimize the batch size at the paint job to 10% of the current batch size. This will save 4 employees.
• Merging the first two steps and making the batch size as a one-piece flow. This will eliminate the need for 3 employees.
• Merging the quality check with the extrusion process and checking each part as it comes out. This will eliminate the need for 5 employees.
• Minimizing the batch at the saw and eliminating the need for 2 employees.
• Lowering the orders from current vendors to 2-day level.
• Hiring a line supervisor to ensure the flow is flawless.
• Establishing performance audits throughout the factory.
4.4 Simulation and VSM for the Future State
If all proposed changes are implemented, the simulation model and future state VSM show the following benefits:
• Work force size is decreased from 38 to 19. A 50% reduction.
• Lead time is reduced from 26.04 days to 4.3 days
• Value added time is decreased from 110 minutes to 97 minutes.
• Efficiency is increased from 0.009 to 0.05. it is not lean yet, but it is getting close.
• Level of workers personal physical interactions is decreased by about 70%
Gaining management approval for all process changes was a challenge. Too many changes are requested, which made it seem as a risky decision in management’s eyes. The project team and management agreed on a one year cascaded implementation plan. Tab. 1 (Fig. 5) shows all proposed changes along with cost and implementation time.
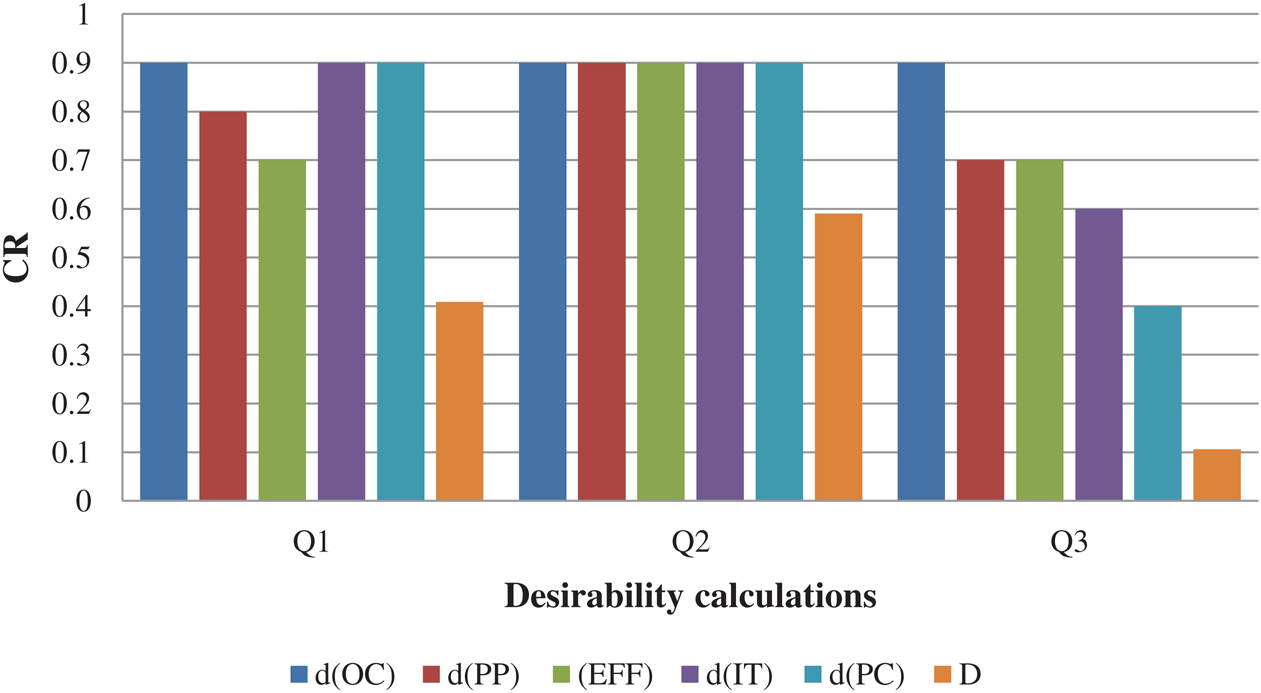
Figure 5: Desirability calculations
Table 1: Proposed changes and management agreement
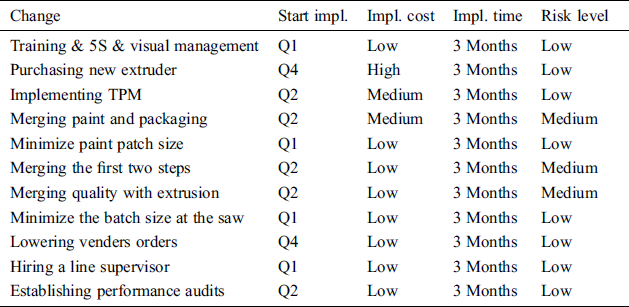
It is worth noticing that, most changes that was decided to start in the first quarter are low hanging fruits, and come with minimal risk. These changes are designed to build culture. All mergers are set for the second quarter. This is was done intentionally to ensure that the culture of continuous improvement and hygiene is set. The third quarter was left without any changes, and the fourth quarter only has the purchasing of the extruder since it is very expensive ($275000).
The next step is to calculate desirability index for the three bundles of changes. The team discussed all cost of implementation, effect of the bundles of changes on pandemic preparedness, the length of implementation, cost savings and effect of changes on process efficiency. Desirability scores are sown in Tab. 2.
Table 2: Desirability calculations
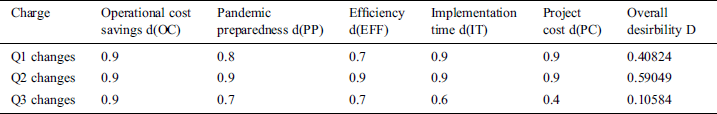
It is worthy of notice that Q2 changes have higher desirability than Q1, but Q1 changes are important to establish a culture and give a comfortable feeling to decision makers.
Final step of the analysis is to check with the alternative evaluation tool. Tab. 3 shows that filled matrix. The matrix shows that a sound decision is to go with the selected Q1 changes first, then Q2 then Q4.
The project finished first month of the first quarter of implementation by the time this paper was written. Annual operational cost savings is estimated to be $730000, which easily covers the cost of the new extruder in the first year. Important benefits gained can also be seen in improved employee morale. Freed up employees are used somewhere else in the company. Some were even transferred to other departments. On the health pandemic preparedness, this project transformed the factory from a work place that is not ready to comply with almost any health regulation, to a factory that is always ready to operate during hard and easy times. Masks and gloves became a standard operation at the factory.
This paper presents the use of simulation, lean manufacturing and desirability index as a blend of tools to facilitate proper decision making. While the case used is in aluminum factory, the methodology can be used in almost any service or industry. Desirability index can be used to elevate awareness of different consequences on health, cost, and performance. DI can be used to select between alternatives, but it also can be used as a tool to show which team is using better improvement efforts.
Overall desirability is a function of individual values of desirability. Importantly, PP can get a value of zero if any new proposed change will harm the company’s preparedness level to health pandemics. PP will score 0.5 if the proposed change does not affect pandemic preparedness. This was carefully set to encourage all quality and production personnel to work always toward being ready for health pandemics.
In the case factory, we created one future state VSM for Q1, but Q2 and Q4 will get other versions of the future state VSM as well. While this may seem too much work, it is worth it, to keep track of value added and none value added activities.
It is worthy to notice that in this case we used OC, PP, EFF, IT and PC to calculate a desirable outcome. In other projects, these factors may change, and that is fine as long as we think of the three or four criteria that can be used to prioritize our decision. Once we agree on these factors, we need to establish ideal and undesirable limits for each criterion, then simple desirability calculations follows.
It is recommended to use desirability index in combination with other tools, since no one tool is complex enough to handle all selection decisions managers need to make. Alternative evaluation tool and simulation are suggested in this paper to strengthen the selection process. In cases where simulation or the alternative evaluation tool do not agree with the choice made by the desirability index, further managerial discussions need to take place.
Future work can extend the findings of this study by implementing the framework on other manufacturing and service sectors. One may think that the food industry and the pharmaceutical industry may already be pandemic ready. Future research can study such hypothesis.
Future work can also discuss risk as one of the factors that may be used to calculate desirability in some applications like drug and food industries or chemical industries.
Finally, future work can combine the framework used in this study with electronic communication techniques to optimize performance by using sensors and image transmission systems [27–30], or by using innovative communications solutions similar to those studies by scholars in [31–34].
Lean manufacturing has been used for decades in manufacturing and service sectors. In this research, we enhanced the use of lean tools with the use of simulation and desirability index to improve the process of selecting the best solution. The case study was performed in an aluminum factory that suffers from quality and cost issues and it was not ready to operate well during the COVID 19 pandemic. Health regulations made it difficult to operate in the same old way.
Application of the proposed framework resulted in 50% reduction in labor, $730000 in annual cost savings, reduction in inventory levels, enhancement in employee morale and the achievement of pandemic ready status. These improvements highly support the effectiveness of implementing lean manufacturing in the format suggested.
Acknowledgement: Foremost, the authors are like to express their sincere gratitude to the Jordan Ministry of Higher Education and Scientific Research and The German Jordanian University.
Funding Statement: The authors received no specific funding for this study.
Conflicts of Interest: The authors declare that they have no conflicts of interest to report regarding the present study.
1. D. R. Lucey and L. O. Gostin. (2016). “The emerging Zika pandemic enhancing preparedness,” Journal of the American Medical Association, vol. 315, no. 9, pp. 865–866. [Google Scholar]
2. A. Abdallah. (2014). “Implementing quality initiatives in healthcare organizations: drivers and challenges,” International Journal of Health Care Quality Assurance, vol. 27, no. 3, pp. 166–181. [Google Scholar]
3. J. A. Alexander, L. R. Hearld, H. J. Jiang and I. Fraser. (2007). “Increasing the relevance of research to health care managers: Hospital CEO imperatives for improving quality and lowering costs,” Health Care Management Review, vol. 32, no. 2, pp. 150–159. [Google Scholar]
4. B. Alhayani and H. Ilhan. (2020). “Image transmission over decode and forward based cooperative wireless multimedia sensor networks for rayleigh fading channels in medical internet of things (MIoT) for remote health-care and health communication monitoring,” Journal of Medical Imaging and Health Informatics, vol. 10, no. 1, pp. 160–168. [Google Scholar]
5. S. T. Teich and F. F. Faddoul. (2013). “Lean management—The journey from Toyota to healthcare,” Rambam Maimonides Medical Journal, vol. 4, no. 2, pp. 1–9. [Google Scholar]
6. N. Bateman, P. Hines and P. Davidson. (2014). “Wider applications for lean,” International Journal of Productivity and Performance Management, vol. 63, no. 5, pp. 550–568. [Google Scholar]
7. M. Graban. (2012). Lean Hospitals. 1st ed. Boca Raton, FL, USA: CRC Press. [Google Scholar]
8. J. P. Womack and D. T. Jones. (1996). Lean Thinking. 1st ed. New York, NY, USA: Simon Schuster. [Google Scholar]
9. V. Muthukumaran, V. R. Hariram and K. K. Padmanabhan. (2019). “A research on implementation of lean tools across verticals in manufacturing,” International Journal of Engineering and Advanced Technology, vol. 8, no. 6S, pp. 2249–8958. [Google Scholar]
10. I. Rizkya, K. Syahputri, R. M. Sari and I. Siregar. (2018). “5S implementation in welding workshop—A lean tool in waste minimization,” in IOP Conference Series: MS&E, North Sumatera, Indonesia, Medan City North Sumatera, Indonesia. [Google Scholar]
11. M. Al Najem, H. N. Dhakal and N. Bennett. (2012). “The role of culture and leadership in lean transformation: A review and assessment model,” International Journal of Lean Thinking, vol. 3, no. 1, pp. 119–138. [Google Scholar]
12. B. Alhayani and R. Milind. (2014). “Face recognition system by image processing,” International Journal of Electronics and Communication Engineering & Technology, vol. 5, no. 5, pp. 80–90. [Google Scholar]
13. I. C. Gherghea, C. Bungau and D. C. Negrau. (2019). “Lead time reduction and increasing productivity by implementing lean manufacturing methods in cnc processing center,” in IOP Conference Series: MS&E, Oradea, Romania, Oradea, Felix SPA, Romania. [Google Scholar]
14. E. W. Dickson, S. Singh, D. S. Cheung, C. C. Wyatt and A. Nugent. (2009). “Application of lean manufacturing techniques in the emergency department,” Journal of Emergency Medicine, vol. 37, no. 2, pp. 177–182. [Google Scholar]
15. A. J. Bryant, W. Dixon and A. Roger. (1999). “Isothermal extrusion,” Light Metal Age, vol. 57, no. 3, pp. 8–36. [Google Scholar]
16. A. Abdallah. (2020). “Simulated six sigma: a multi response optimization,” Quality Engineering, vol. 32, no. 4, pp. 583–594. [Google Scholar]
17. T. Pyzdek and P. Keller. (2014). The Six Sigma Handbook. 4th ed. New York, NY, USA: McGraw-Hill Higher Education. [Google Scholar]
18. L. Al-Qatawneh, A. Abdallah and S. Zalloum. (2019). “Six sigma application in healthcare logistics: a framework and a case study,” Journal of Healthcare Engineering, vol. 2019, no. 1, pp. 1–12. [Google Scholar]
19. F. C. Wu. (2004). “Optimization of correlated multiple quality characteristics using desirability function,” Quality Engineering, vol. 17, no. 1, pp. 119–126. [Google Scholar]
20. I. J. Jeong and K. J. Kim. (2009). “An interactive desirability function method to multiresponse optimization,” European Journal of Operational Research, vol. 195, no. 2, pp. 412–426. [Google Scholar]
21. E. Del Castillo, D. C. Montgomery and D. R. McCarville. (1996). “Modified desirability functions for multiple response optimization,” Journal of Quality Technology, vol. 28, no. 3, pp. 337–345. [Google Scholar]
22. G. Derringer and R. Suich. (1980). “Simultaneous optimization of several response variables,” Journal of Quality Technology, vol. 12, no. 4, pp. 214–219. [Google Scholar]
23. W. D. Kelton, P. S. Randall and T. S. David. (2007). Simulation with Arena. 2nd ed. New York, NY, USA: McGraw-Hill Higher Education. [Google Scholar]
24. J. Banks, S. C. John, L. N. Barry and M. N. David. (2010). Discrete-Event System Simulation. 5th ed. London, UK: Pearson Education. [Google Scholar]
25. B. Al-Hayani and H. Ilhan. (2020). “Efficient cooperative image transmission in one-way mult-hop sensor network,” International Journal of Electrical Engineering Education, vol. 57, no. 2, pp. 321–339. [Google Scholar]
26. O. Özcan, M. Türkeş and N. Musaoğlu. (2017). “Monitoring the Changes in the Mesopotamian Marshlands during Drought Periods”. in 5th International Workshop on Sand and Dust Storms, Istanbul, Turkey. [Google Scholar]
27. B. Alhayani and Milind Rane. (2014). “Face recognition system by image processing,” International Journal of Electronics and Communication Engineering & Technology, vol. 5, no. 5, pp. 80–90. [Google Scholar]
28. B. Al-Hayani and H. Ilhan. (2020). “Visual sensor intelligent module based image transmission in industrial manufacturing for monitoring and manipulation problems,” Journal of Intelligent Manufacturing, vol. 14, pp. 1–14. [Google Scholar]
29. O. I. Khalaf and G. M. Abdulsahib. (2019). “Frequency estimation by the method of minimum mean squared error and P-value distributed in the wireless sensor network,” Journal of Information Science and Engineering, vol. 35, no. 5, pp. 1099–1112. [Google Scholar]
30. B. ALhayani and H. Ilhan. (2020). “Image transmission over decode and forward based cooperative wireless multimedia sensor networks for Rayleigh fading channels in medical internet of things (MIoT) for remote health-care and health communication monitoring,” Journal of Medical Imaging and Health Informatics, vol. 10, pp. 160–168. [Google Scholar]
31. O. I. Khalaf, G. M. Abdulsahib, H. D. Kasmaei and K. A. Ogudo. (2020). “A new algorithm on application of blockchain technology in live stream video transmissions and telecommunications,” International Journal of E-Collaboration, vol. 16, no. 1, pp. 16–31. [Google Scholar]
32. O. I. Khalaf, G. M. Abdulsahib and B. M. Sabbar. (2020). “Optimization of wireless sensor network coverage using the bee algorithm,” Journal of Information Science and Engineering, vol. 36, no. 2, pp. 377–386. [Google Scholar]
33. O. I. Khalaf and B. M. Sabbar. (2019). “An overview on wireless sensor networks and finding optimal location of nodes,” Periodicals of Engineering and Natural Sciences, vol. 7, no. 3, pp. 1096–1101. [Google Scholar]
34. B. ALhayani and H. Ilhan. (2017). “Hyper spectral image classification using dimensionality reduction techniques,” International Journal of Innovative Research in Electrical, Electronics, Instrumentation and Control Engineering, vol. 5, pp. 71–74. [Google Scholar]
 | This work is licensed under a Creative Commons Attribution 4.0 International License, which permits unrestricted use, distribution, and reproduction in any medium, provided the original work is properly cited. |