DOI:10.32604/cmc.2020.013761
| Computers, Materials & Continua DOI:10.32604/cmc.2020.013761 | |
| Article |
Evaluation of Pencil Lead Based Electrodes for Electrocardiogram Monitoring in Hot Spring
1Department of ICT Convergence Rehabilitation Engineering, Soonchunhyang University, Asan, 31538, Korea
2Department of ICT Convergence, Soonchunhyang University, Asan, 31538, Korea
3Department of Occupational Therapy, Soonchunhyang University, Asan, 31538, Korea
4Department of Computer Science and Engineering, Soonchunhyang University, Asan, 31538, Korea
*Corresponding Author: Yunyoung Nam. Email: ynam@sch.ac.kr
Received: 20 August 2020; Accepted: 14 September 2020
Abstract: Electrocardiogram (ECG) electrodes are conductive pads applied to the skin to measure cardiac activity. Ag/AgCl electrodes are the commercial product which widely used to obtain ECGs. When monitoring the ECG in a hot spring, Ag/AgCl electrodes must be waterproofed; however, this is time-consuming, and the adhesive may tear the skin on removal. For solving the problem, we developed the carbon pencil lead (CPL) electrodes for use in hot springs. Both CPL and Ag/AgCl electrodes were connected to ECG100C’s cables. The Performance was evaluated in three conditions as following: hot spring water with and without bubble, and in cold water. In each environment, the procedure was followed by three different protocols that are recording from the dry condition, hot spring water immersion with and without movement, post hot spring water condition. Under dry and wet conditions, both electrodes can obtain the waveform of the ECG signal in which all PQRST waves were identifiable. Nevertheless, the signal quality of both types of electrodes was different in water immersion with and without movement. The overall morphology obtained by Ag/AgCl electrodes was unstable higher than that of CPL electrodes in immersion without movement condition. The CPL electrodes provided better ECG waveform quality compared to Ag/AgCl electrodes in which the ECG signal had high waveforms distortion in water immersion with movement condition.
Keywords: Carbon pencil lea; ECG electrodes; ECG monitoring; hot spring water; cold water; hot spring water bubble
An electrocardiogram (ECG or EKG) monitors cardiac performance and capacity by analyzing electrical activity in the form the P wave, QRS wave complex, T wave, and U wave. An ECG can be used to diagnose heart disease. One of the most important ECG features is the R-to-R interval (RRI), which is commonly used to identify and analyze heart problems. In Yoon et al. [1], the RRI was used to automatically detect congestive heart failure and atrial fibrillation (AF) by normalizing the root mean square of successive differences (RMSSD), the entropy, and the Shannon entropy. In Wang et al. [2], short-term RRI features were used to detect congestive heart failure; a deep-learning method automatically extracted the features. Congestive heart failure can be identified based on heart rate variability (HRV), with RRIs extracted from the signals [3]. Automatic classification of congestive heart failure risk has been described signals were selected for further analysis when the normal-normal (NN) RRI parameter exceeded a certain threshold [4]. Deep learning based on RRI features has been used to identify heart congestion [5]. A convolutional neural network and distance distribution matrix used the RRIs as inputs. Features of the normal sinus rhythm (NSR) and congestive heart failure have been used to develop deep learning classifiers, including ALEXNET, DENSENET, and INCEPTION-V4.
An iPhone 4S application can be used to detect AF using the RRI [6]. The user places a finger on the camera [7]. The frequency of data from the MIT-BIH Arrhythmia Database is resampled [8] to a range appropriate for the iPhone application, which then makes a diagnosis of AF or NSR. Lian et al. [9] drew maps of original and modified RRIs and used them to detect AF. Ruan et al. [10] developed an algorithm that automatically detected AF based on a scatterplot of the R-R interval. The RRIs of AF and NSR were dissimilar, and AF was detected by reference to RRI irregularities. Logan et al. [11] developed a method to predict AF automatically when walking based on the variation in RRI. Heartbeats were recorded and the desired features extracted.
Several methods [12] are used to record ECG signals. The heart rate monitoring devices used in hospitals and other healthcare settings are the gold standard. Holter devices can be employed to monitor HRV [13] for periods longer than 24 h. ECG signals can be obtained using wearable devices such as the Nymi Band (Nymi Inc.), Helo LX (World Global Network), Visi Mobile (Sotera Wireless), W/ME (Phyode), Bioharness 3 (Zephyr Technology), and Qardiocore (Qardio) [14].
The circulatory system transports blood, oxygen, nutrients, and other substances to tissues. Given the importance of the heart, monitoring HRV is recommended. Portable ECG monitoring is desirable; Mundt et al. [15] developed a wearable device that monitors the heart rate in space. Jung et al. [16] used dry carbon electrodes for long-term ECG monitoring. In water, signal quality is decreased by pressure, low temperature, and depth, so monitoring hypothermia, hypoxia, and vascular system problems, including decompression sickness (DCS), can be difficult [17–20]. Bersain et al. developed an ECG electrode active under both dry and wet conditions. Carbon black (CB) electrodes have been used to obtain ECG signals [21]. However, no study has evaluated electrode performance in hot spring water with a temperature over 36.7°C [22]. Hot spring water is sometimes referred to as cold-warm or thermal spring water; thermal springs have long been used for therapeutic purposes [23]. ECG monitoring may be compromised by bubble noise. Graphite, a form of pure carbon and a good conductor, is used in the fabrication of electrodes, pencils, batteries, brake linings, foundry facings, lubricants and nuclear reactors [24]. Here, we evaluated the ECGs of subjects immersed in hot spring water using dry electrodes fabricated from carbon pencil lead (CPL); we assessed dry, immersion, and post-immersion conditions.
Various ECG monitoring experiments [21,25,26] have been performed using different types of electrodes. In Chi et al. [25], Yu et al. developed dry-contact and noncontact electrodes to replace Ag/AgCl electrodes. Dry electrodes can be based on any skin-sensitive conductive material. Performance is evaluated based on signal quality (in terms of noise and motion sensitivity). In Reyes et al. [21], hydrophobic electrodes fabricated from CB powder and polydimethylsiloxane (PDMS), differing in diameter and thickness, produced undistorted ECG signal waveforms under dry conditions, and during water immersion with and without movement. In Thap et al. [26], ECG monitoring was performed under freshwater and saltwater conditions using dry CB electrodes. An Ag/AgCl electrode was used for comparison. Under dry and post-saltwater wetting conditions, all electrodes detected the ECG waveform. However, in freshwater and saltwater, the GPL electrodes were better than the Ag/AgCl electrode.
3.1 Carbon Pencil Lead Electrodes
CPL electrodes were connected to an MP160 (BIOPAC Systems, Inc.) data acquisition system via ECG100C (BIOPAC Systems, Inc.) ECG amplifier cables. As shown in Fig. 1(a), the graphite of wooden 4B pencils (Deojon) was used as follows. First, the pencil wood was removed, and the lead was ground into powder as shown in Fig. 1(b). The powder was mixed with a chloroprene-rubber-based bonding material and placed in acrylic tubes. The tubes were capped until the electrodes hardened and then covered with black tape as shown in Fig. 1(c). The electrodes were 20 mm in diameter and 5-mm-thick. These electrodes, together with the Ag/AgCl electrodes, were connected to a PSL-iECG2 (Physiolab) commercial ECG device. Fig. 2 shows that the CPL signal was more sensitive and stronger than that arising from the Ag/AgCl electrodes.
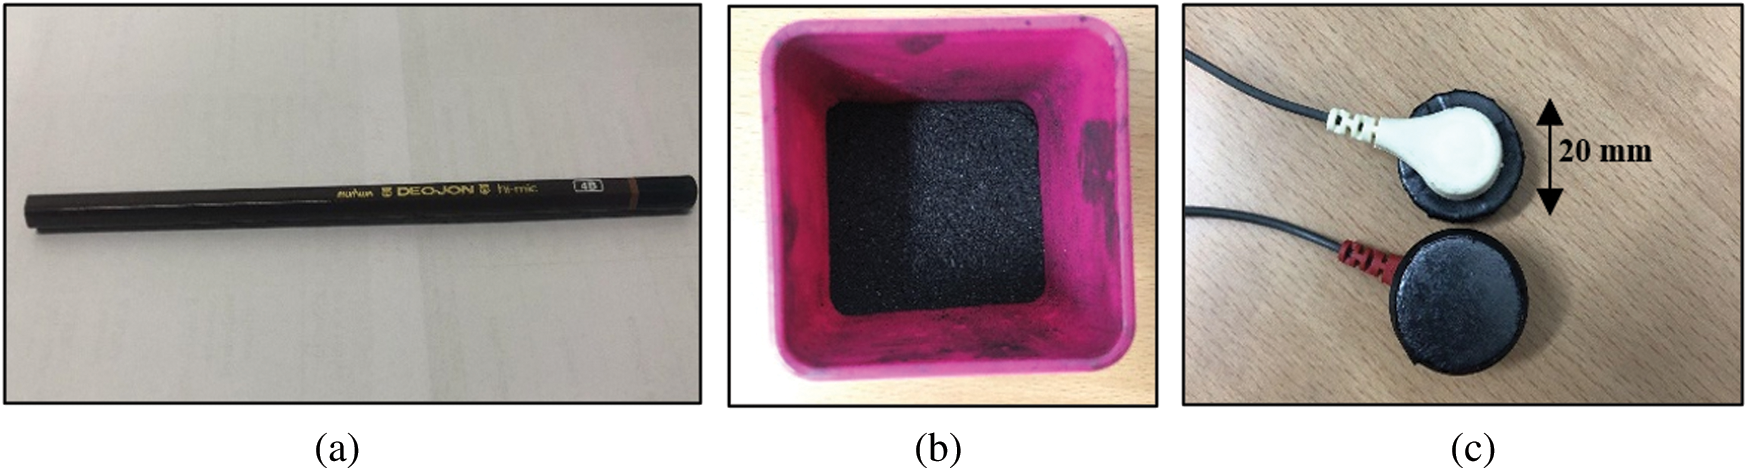
Figure 1: The electrodes made from carbon pencil lead; (a) Pencil which used as the material, (b) Pencil lead ground into powder, (c) Pencil lead electrodes
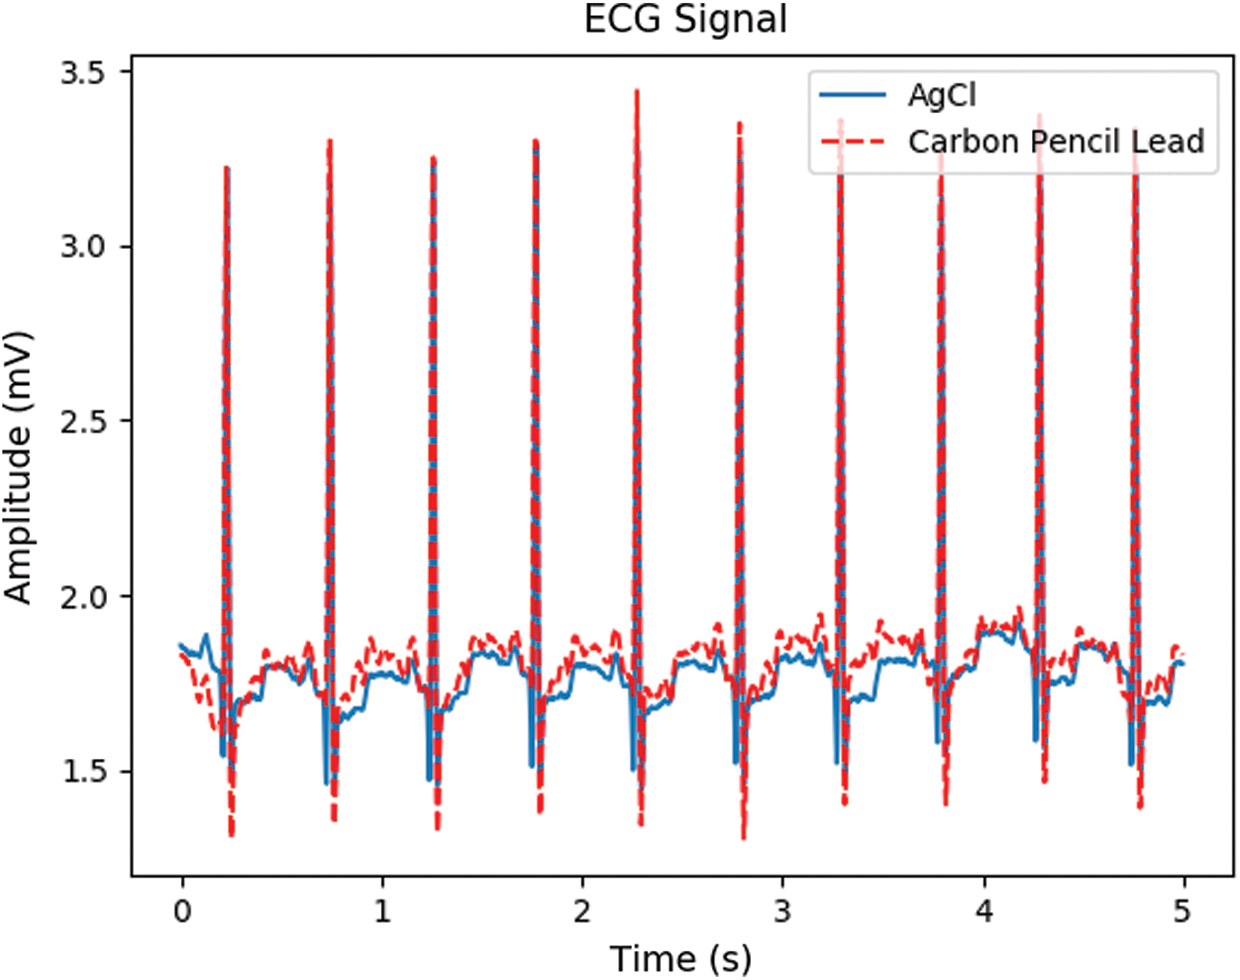
Figure 2: The ECG signal from Ag/AgCl and CPL electrodes
The MP160 is the gold standard biodata acquisition device [27]; it has an ETHUSB ethernet adapter for high-speed data transfer (up to 200,000 samples/s). The ECG100C ECG amplifier connects to the MP160 device to collect heart electrical activity data [28]. A SNAIL camping battery (model 3) was used to power the MP160 rather than direct AC power. ECG data were collected by connecting Ag/AgCl and carbon electrodes to the ECG100C amplifier cable.
The experimental protocol is shown in Fig. 3 and included sitting in the dry for 2 minutes, followed by 5 minutes of sitting in the hot spring while immersed up to the neck, and 2 minutes of sitting after getting out of the spring. The first 3 minutes of immersion were without movement, and the latter 2 minutes were with movement.
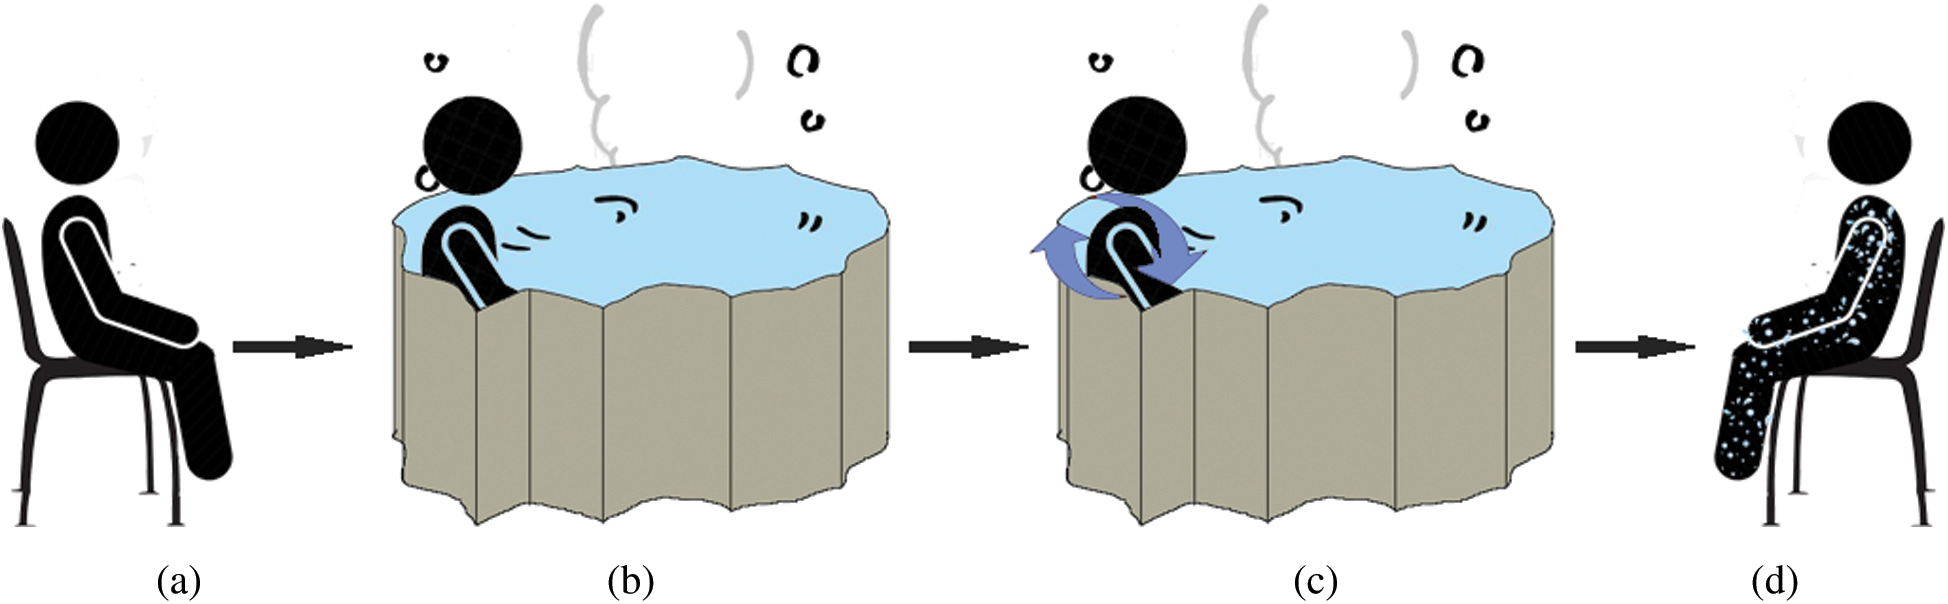
Figure 3: Experiment’s protocol, (a) dry condition, (b) water immersion without movement, (c) water immersion with movement, (d) wet condition
Although the sound made by bubbles is pleasing, bubbling may degrade signal quality. The experiment took place at the Onyang hot spring, which is known as the oldest hot spring in Korea (about 1,300 years old) [29]. During the Joseon period, King Sejong the Great, his queens, and other royal families visited the Onyang hot spring or Onyang Temporary Palace to rest or for therapeutic reasons [30]. The water temperature ranges from 38.1 to 54.6°C, and with an average of 49.3°C in 2016 [31].
Raw signals were obtained via the Ag/AgCl and CPL electrodes attached to the subjects and then delivered to the MP160 device. The signals contained several types of noise caused by baseline drift, powerline interference, electrode contact, motion artifacts, and muscle contractions [32] as shown in Fig. 4. First, the DC component was eliminated and a bandpass filter (first-order Butterworth filter; 0.5–12 Hz) was applied to reduce muscle noise. Derivative moving average filters were then used for smoothing. As shown in Fig. 5, the R and S peaks of the ECG signals were extracted based on the Pan Tompkins algorithm [33] to calculate V peak-to-peak (Vpp) values. We compared the RRIs of the carbon and Ag/AgCl electrodes, specifically the mean RRIs (ms), the standard deviations of the normal-to-normal RRIs (SDNN, ms), and the root mean square of the successive differences (RMSSD, ms).
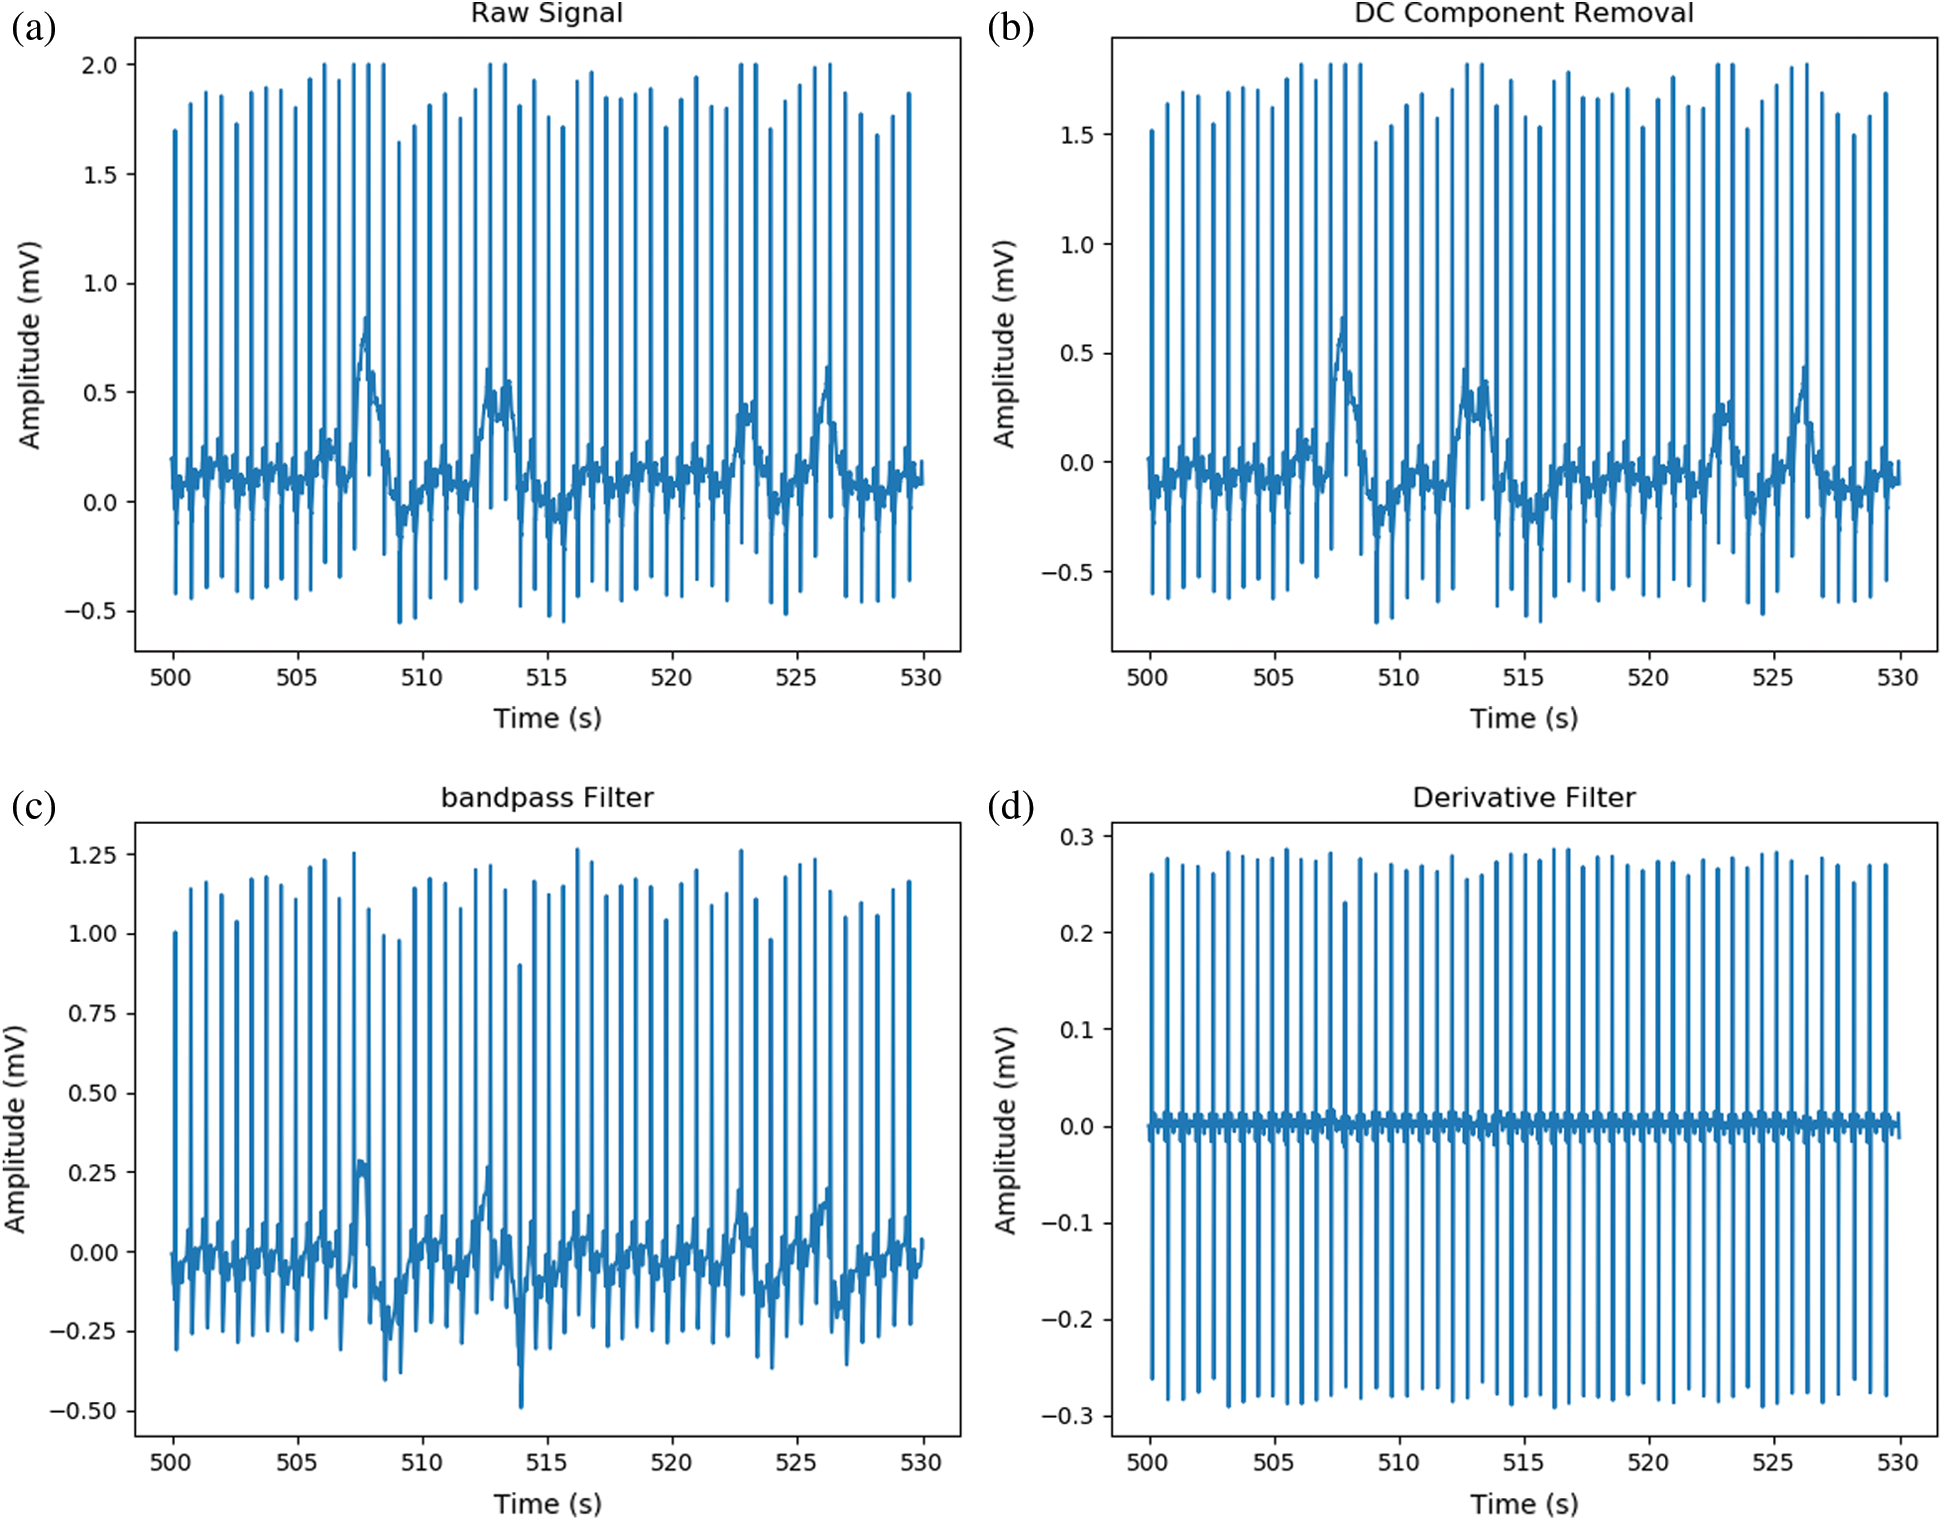
Figure 4: Steps of noise reduction; (a) Raw signal from hot spring bubble water, (b) DC component removed, (c) Signal after applied band-pass filter, (d) Signal after applied derivative filter
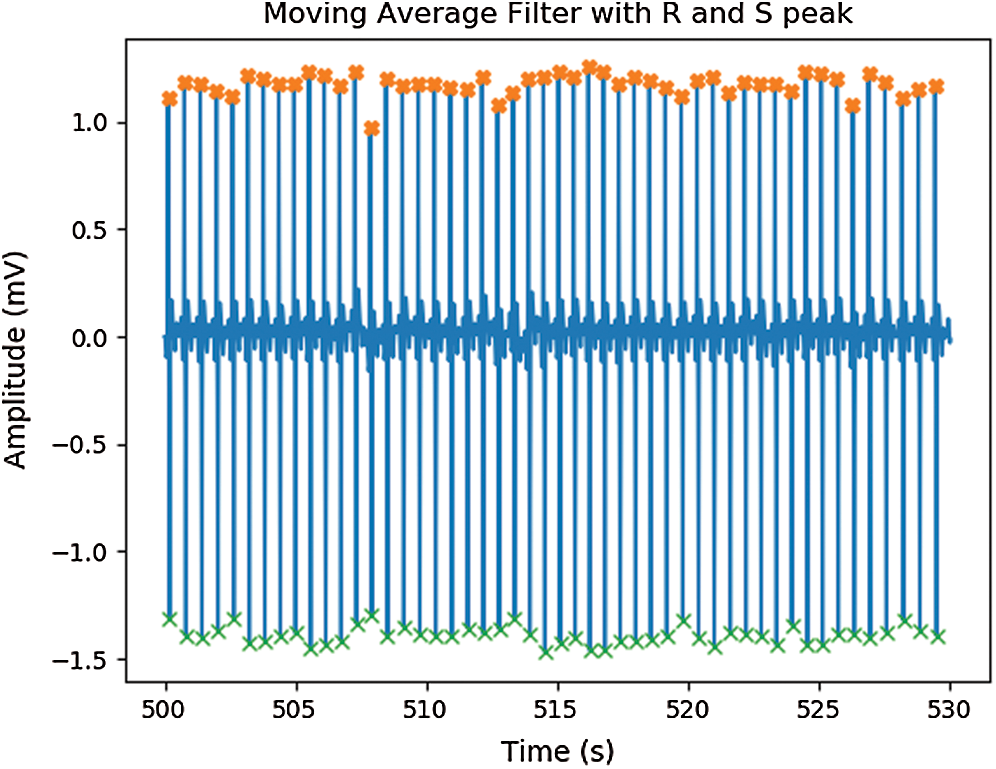
Figure 5: Signal after applied moving average filter with peak detection
3.5 Wireless ECG Monitoring Device
We used both the gold standard MP160 device and a wireless ECG monitoring device to obtain ECG signals. The high-performance ATmega328P 8-bit microcontroller (Arduino), which has low power consumption, was connected to an AD8232 single-lead ECG sensor (SparkFun). The ECG data were transmitted to the microcontroller via the output pin (no. 23) connected to the analog pin of the microchip. Then, a HC05 Bluetooth module was used to transmit the ECG data to the computer. The transmit data pin (TXD) and receive data pin (RXD) of both the HC05 and ATmega328P microcontrollers were oppositely connected (TXD to RXD and RXD to TXD). Fig. 6. shows the circuit of the device combined with other electronic components including capacitors, resistors, crystal oscillators, and a voltage regulator (model LM7805; STMicroelectronics) that limited the output to 5 V; the input power source ranged from 7 to 35 V. Pin no. 1 of the microcontroller served as the reset pin and was connected to a resistor and a button. The circuit was soldered onto a prototype board. The performance of the wireless ECG device was compared to that of the gold standard ECG100C amplifier cable in terms of the analysis of signals arising from Ag/AgCl electrodes over a 2 minutes period in dry subjects. The ECG100C power gain was 500, and the power amplitude was lower than that of the wireless device signal. Thus, the amplitude scale is variable (Fig. 7).
Figure 6: Circuit of wireless ECG monitoring
Figure 7: ECG signal from proposed device (dash blue line) and BioPac devices (orange line), plot with different scale with 10 seconds duration
The wireless device can obtain a signal and send it to a PC/laptop via Bluetooth. However, some data are lost during transfer through the HC05 module. Therefore, after preprocessing, the signal was resampled. Given the loss of data, only 1 min of signal was used for feature extraction, and a Bland-Altman plot was drawn to show the agreement between the signals from the wireless device and ECG100C amplifier [34]. Fig. 8(a) is a Bland-Altman plot of the heart rate [beats per minute (bpm)] recorded by both tested devices with 95% limits of agreement and agreement value ranges from –3.71 to 7.61. Fewer data points are outside than within this range. Thus, the wireless ECG device can be used for ECG monitoring. Pearson correlation was used to measure the correlation between the heartbeat data of the two devices [35]. The straight line in Fig. 8(b) indicates a positive linear relationship; the Pearson correlation coefficient was 0.74 (0–0.19 = very weak, 0.2–0.39 = weak, 0.40–0.59 = moderate, 0.6–0.79 = strong, and 0.8–1 = very strong).
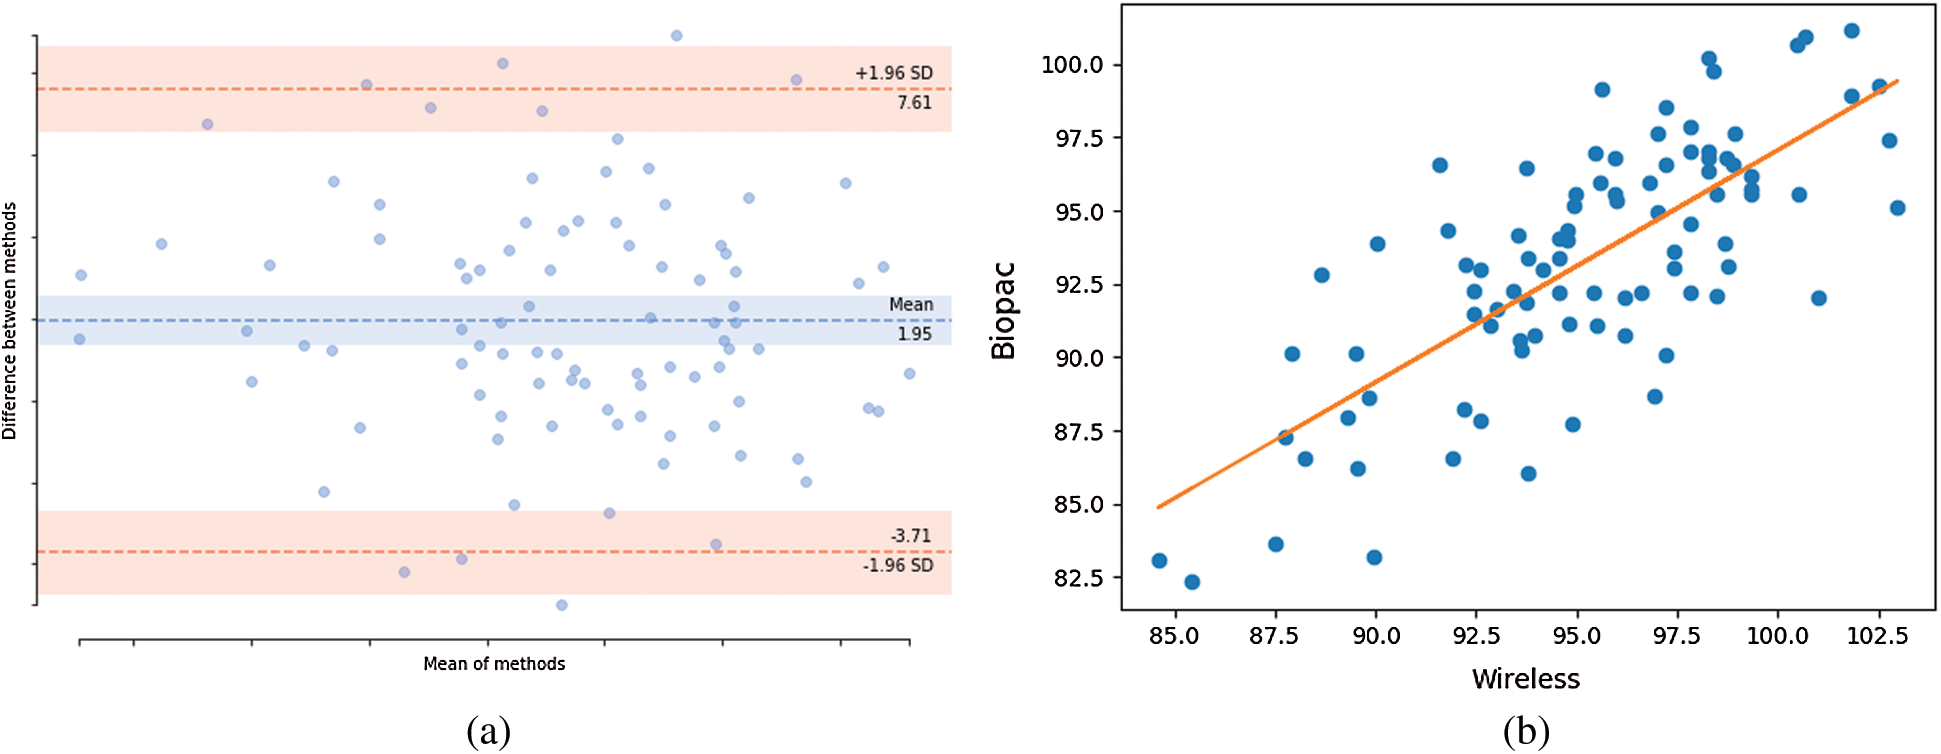
Figure 8: Agreement and correlation of heart rate from proposed devices and BioPac devices. (a) Bland-Altman of mean difference of 1.96 at limit agreement of 95%, (b) Pearson correlation coefficient plot
Data were continuously collected according to the protocol illustrated in Fig. 3. ECG signals were collected by the MP160 device running AcqKnowledge software [36]. The sampling rate was 250 Hz. Fig. 9. shows (a) the bubbling hot spring, (b) a subject, and (c) the experimental equipment. All subjects had to shower before entering the hot spring; we acquired 2 minutes of ECG data during showering, with the electrodes covered with bandages. After the subjects had dried off, the electrodes were reattached using new bandages. The performance of the Ag/AgCl and CPL electrodes was compared.
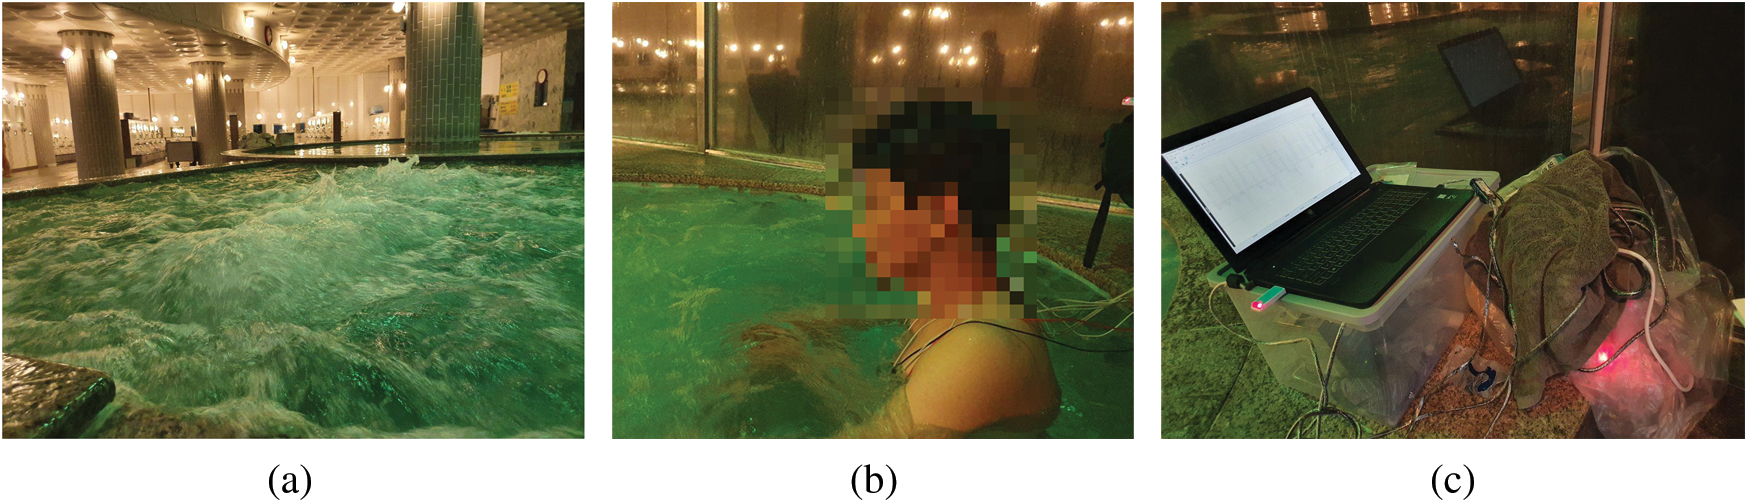
Figure 9: Experiment in hot spring water; (a) hot spring water with bubble, (b) experiment subject sit in hot spring tube, (c) equipment for data collecting
The CPL electrodes were less sensitive to noise (Fig. 10) and had higher-quality waveforms. The Ag/AgCl and CPL electrodes acquired ECG signals from subjects in hot spring water. The signals from the CPL electrodes exhibited less waveform distortion than the Ag/AgCl electrode signals during the dry, immersion, and wet phases. Under dry conditions, the signals from both electrodes exhibited very similar ECG waveforms (Fig. 11). However, the CPL electrode signal was stronger than that of the Ag/AgCl electrode.
Figure 10: Example of signals from showering records obtained by; (a) Ag/AgCl electrodes, (b) CPL electrodes
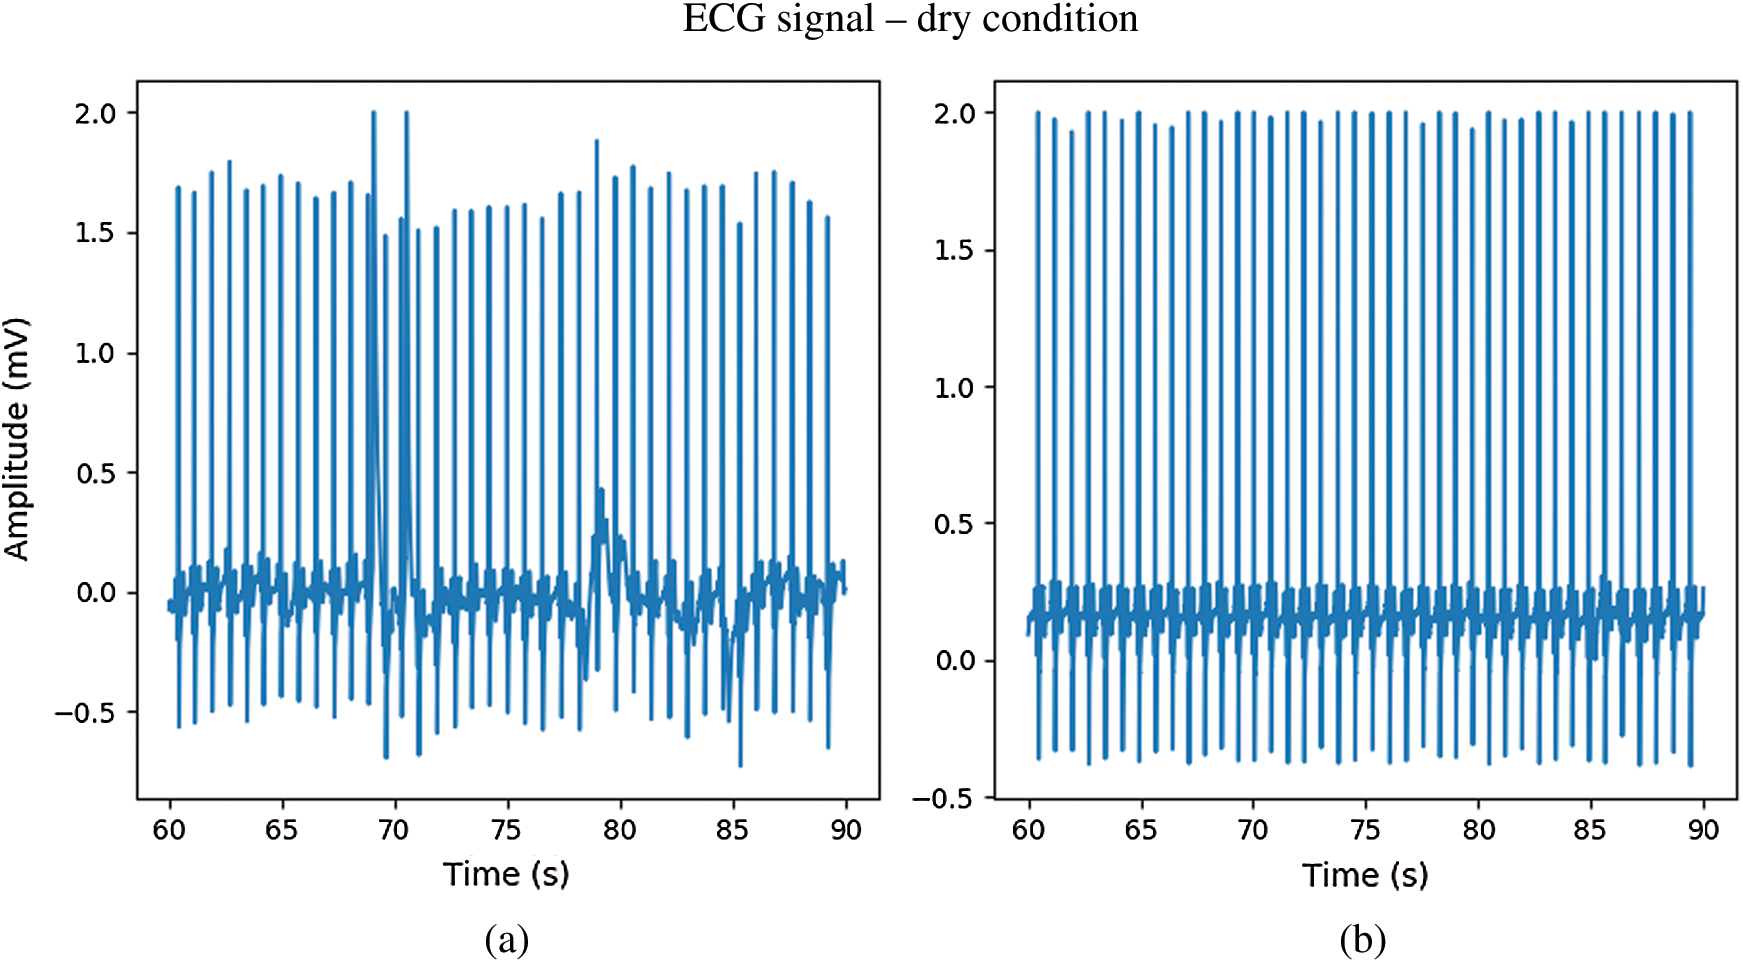
Figure 11: The ECG signal in dry condition; (a) Ag/AgCl electrodes, (b) CPL electrodes
In Fig. 12. during immersion in bubbling hot spring water without movement, the ECG signal from the CPL electrode (b) exhibited a waveform that was less deformed than that of the Ag/AgCl electrode (a). During immersion in bubbling water with movement, both electrodes showed distorted ECG waveforms. However, while the R peaks of ECG signals from the CPL electrode were clear as shown in Fig. 13(b), those of the Ag/AgCl electrodes were not clear as shown in Fig. 13(a). Fig. 14 shows 10-seconds signals from the Ag/AgCl (a) and CPL (b) electrodes under the wet condition; both ECG waveforms were clear.
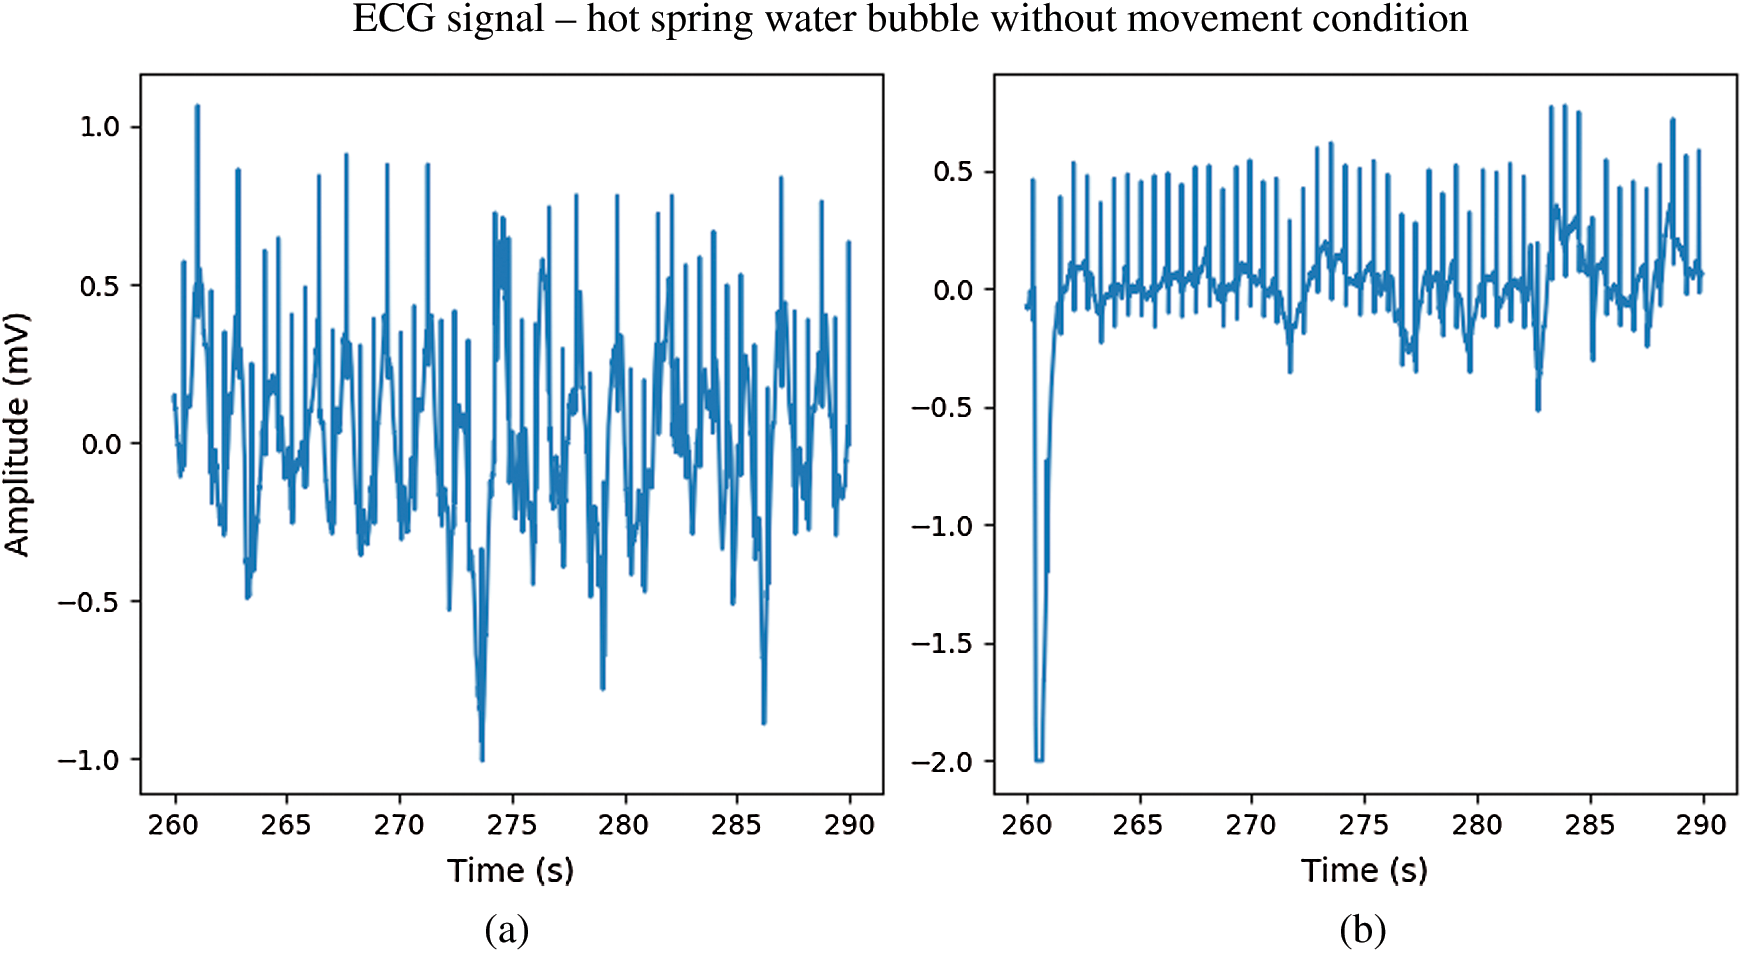
Figure 12: The ECG signal in hot spring water immersion without movement; (a) Ag/AgCl electrodes, (b) CPL electrodes
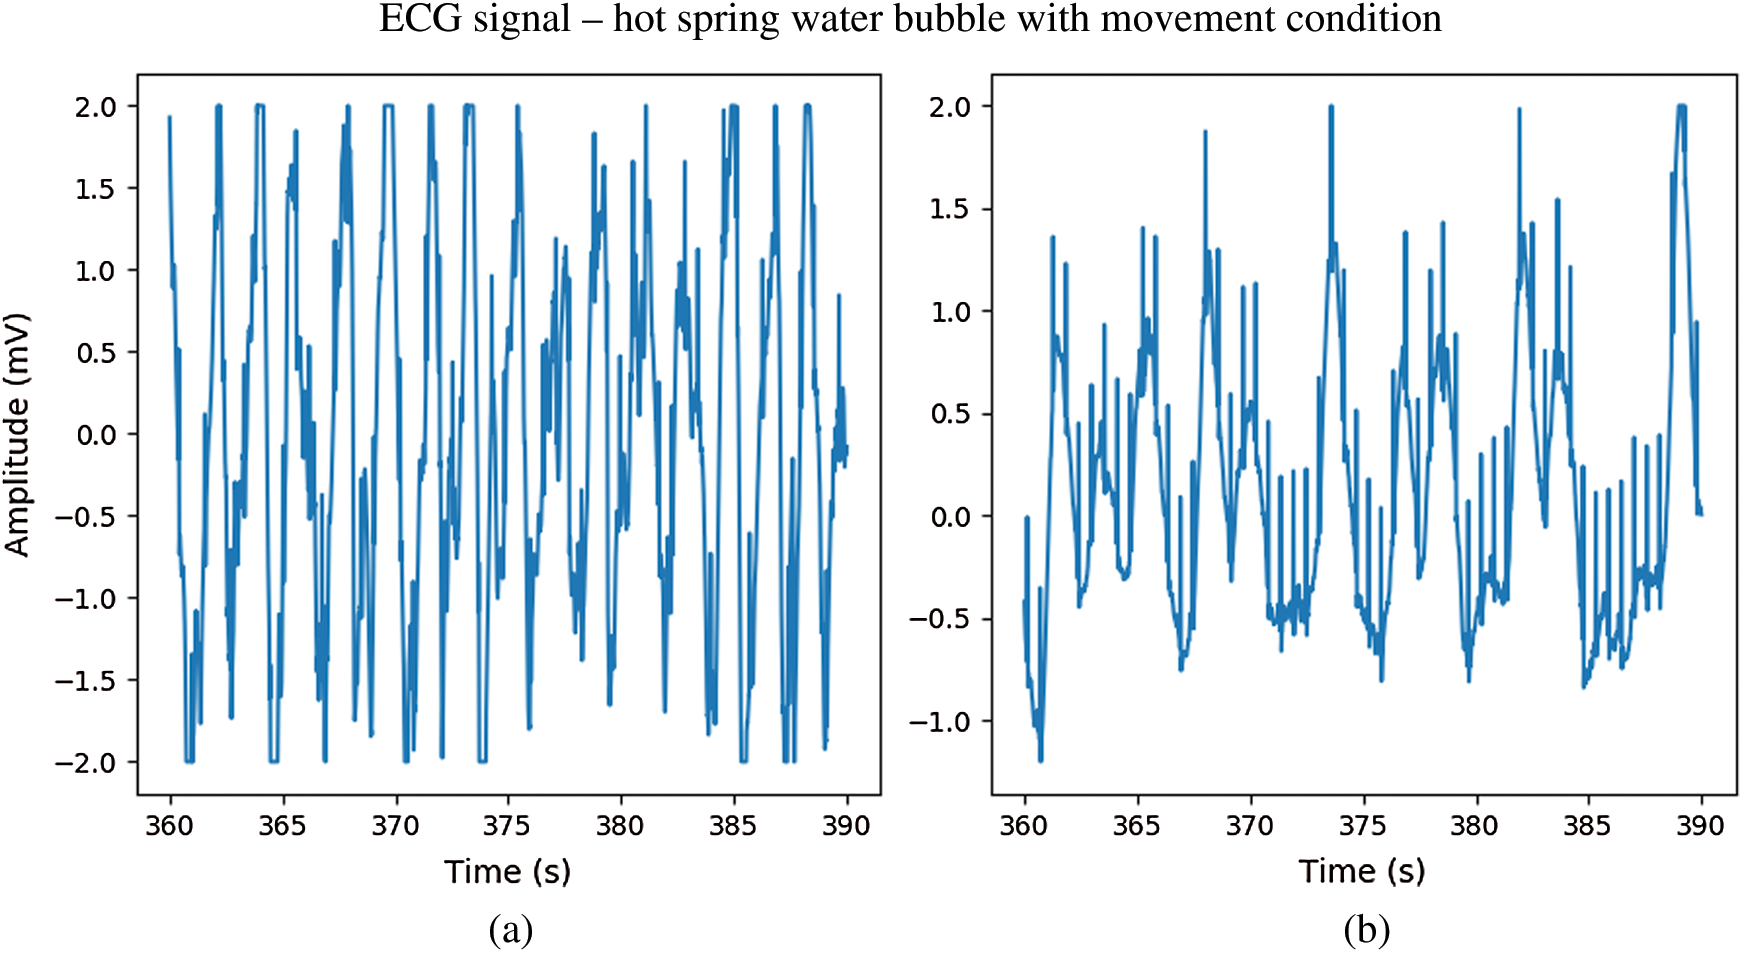
Figure 13: The ECG signal in hot spring water immersion with movement; (a) Ag/AgCl electrodes, (b) CPL electrodes
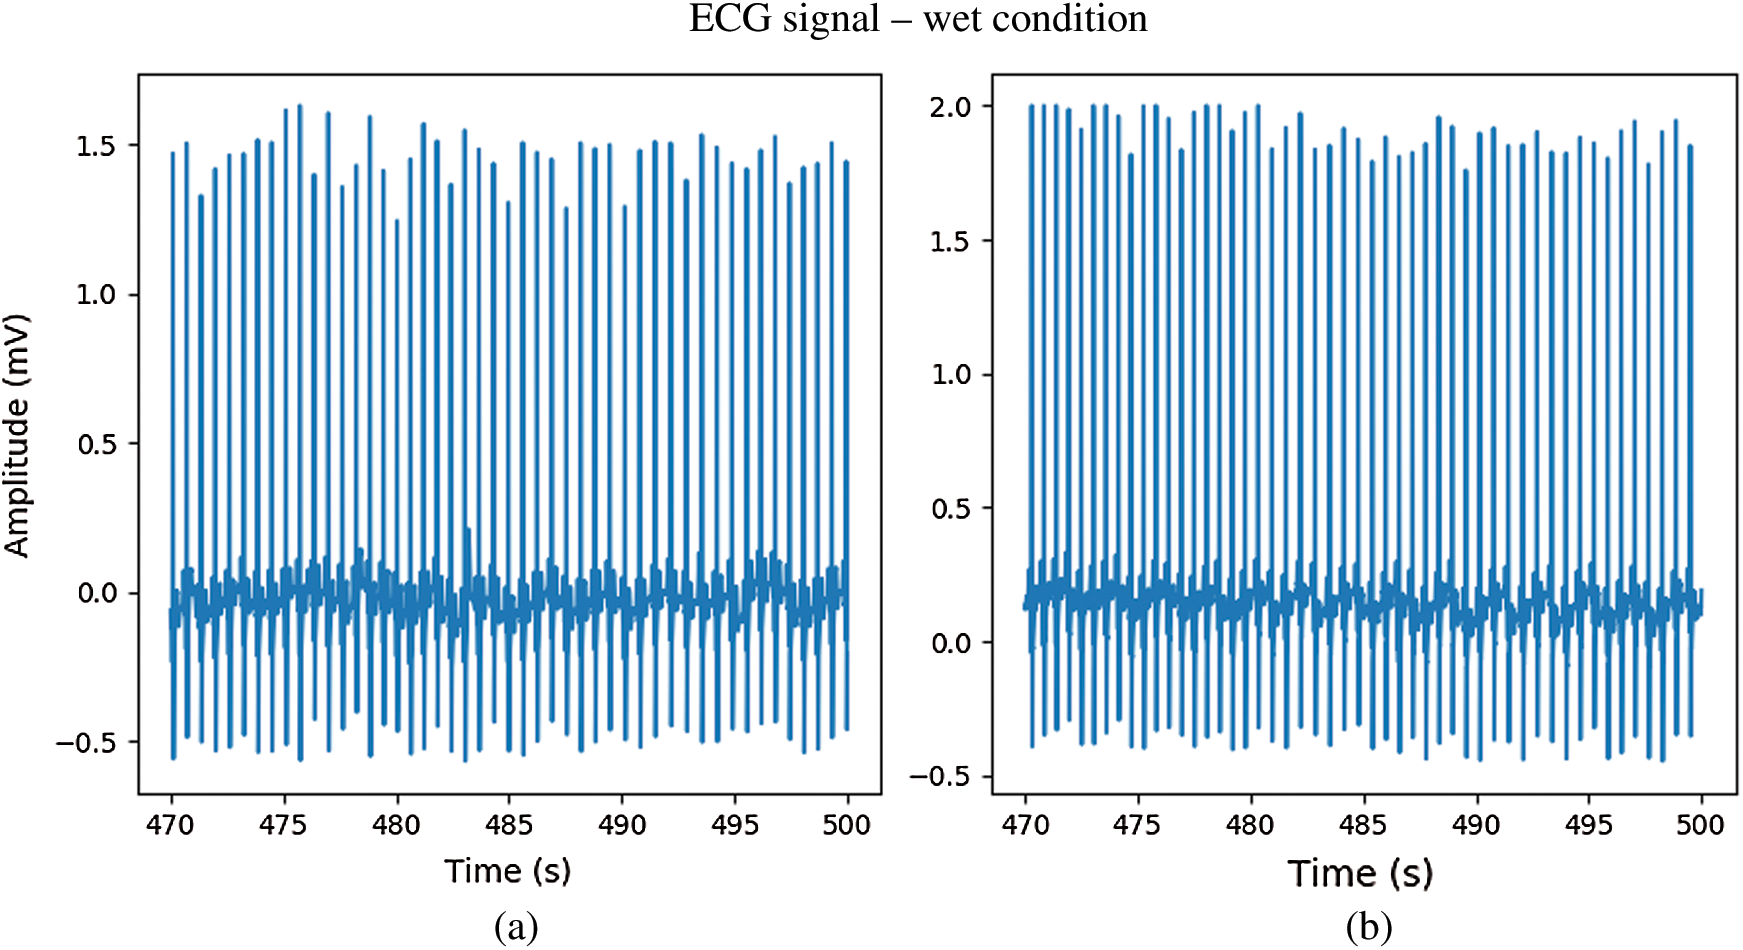
Figure 14: The ECG signal in wet condition; (a) Ag/AgCl electrodes, (b) CPL electrodes
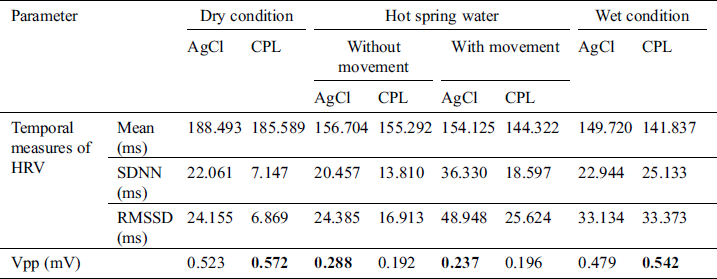
As mentioned in Section 3.4, signal processing was used to remove noise then the R and S peaks were extracted. The temporal and Vpp data acquired by the CPL and Ag/AgCl electrodes are summarized in Tabs. 1–3. for the cold condition and two hot (without and with bubbling) conditions, respectively. Under the dry condition, the Vpp of the CPL electrode was 0.594 mV is higher than that of the Ag/AgCl electrode. During immersion, the Vpp of the Ag/AgCl electrode was higher than that of the CPL electrode. Under the wet condition, the Vpp of the CPL electrode was 0.535 mV is slightly higher than that of the Ag/AgCl electrode (0.512 mV; Tab. 1). The Vpp values of the Ag/AgCl electrodes under the dry and immersion without bubbles conditions were higher than those of the CLP electrodes (Tab. 2).
Table 1: ECG signal quality in the cold water condition
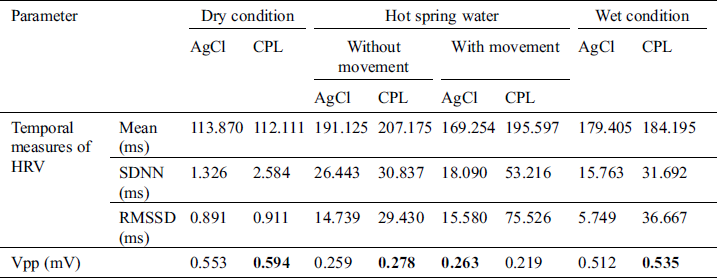
Table 2: ECG signal quality in the hot spring water without bubbling condition
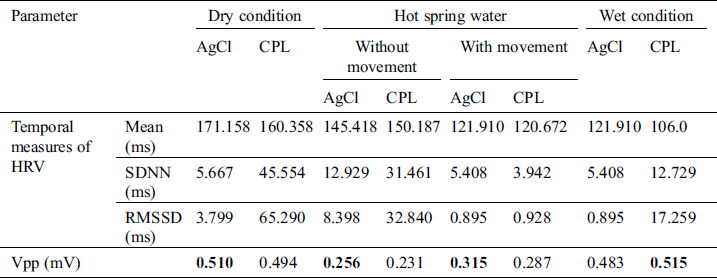
Table 3: ECG signal quality in the bubbling hot spring water condition
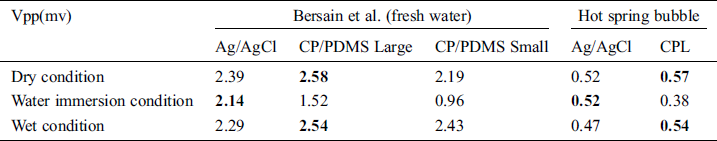
Tab. 4. compares the ECG data obtained under still and bubbling hot spring water conditions using carbon black (CB), polydimethylsiloxane (PDMS), and CPL electrodes. The ECG signals differed by device. The Vpp values in hot spring water were low, but all electrodes performed similarly.
Table 4: Performance of electrodes for ECG monitoring in water
In this study, we fabricated dry electrodes from pencil lead and collected ECG data. The performance of Ag/AgCl and CPL electrodes was compared in the following conditions: Dry, during immersion in hot spring water without and with bubbles, and in cold water. Under both the dry and wet conditions, the Vpp values of the carbon electrode were higher than those of the Ag/AgCl electrode. In wet conditions (cold water, hot spring water with and without bubbles), the Vpp of the Ag/AgCl electrode was higher than that of the carbon electrode. During water immersion without movement, the Ag/AgCl signal contained an R peak. However, the ECG waveform was less stable than that of the CPL electrodes. During water immersion with movement, R peaks were observed more often in the CPL electrode versus Ag/AgCl electrode signals. Although the Vpp values of the Ag/AgCl and CPL electrodes were almost equal, the signal quality of the CPL electrodes was better. However, Ag/AgCl electrodes cannot be used for long-term monitoring in wet conditions because the adhesive will deteriorate. Waterproofed CPL electrodes can be used to fabricate monitoring devices for use in hot springs water.
Funding Statement: This research was supported by Korea Institute for Advancement of Technology (KIAT) grant funded by the Korea Government (MOTIE) (P0012724, The Competency Development Program for Industry Specialist) and the Soonchunhyang University Research Fund.
Conflicts of Interest: The authors declare that they have no conflicts of interest to report regarding the present study.
1. K. H. Yoon, T. Thap, C. W. Jeong, N. H. Kim, S. Noh et al. (2015). , “Analysis of statistical methods for automatic detection of congestive heart failure and atrial fibrillation with short RR interval time series,” in 9th IEEE Int. Conf. on Innovative Mobile and Internet Services in Ubiquitous Computing, Blumenau, Brazil, pp. 452–457. [Google Scholar]
2. L. Wang, W. Zhou, Q. Chang, J. Chen and X. Zhou. (2019). “Deep ensemble detection of congestive heart failure using short-term RR intervals,” IEEE Access, vol. 7, pp. 69559–69574. [Google Scholar]
3. B. Hu, S. Wei, D. Wei, L. Zhao, G. Zhu et al. (2019). , “Multiple time scales analysis for identifying congestive heart failure based on heart rate variability,” IEEE Access, vol. 7, pp. 17862–17871. [Google Scholar]
4. P. Melillo, N. De Luca, M. Bracale and L. Pecchia. (2013). “Classification tree for risk assessment in patients suffering from congestive heart failure via long-term heart rate variability,” IEEE Journal of Biomedical and Health Informatics, vol. 17, no. 3, pp. 727–733. [Google Scholar]
5. Y. Li, Y. Zhang, L. Zhao, Y. Zhang, C. Liu et al. (2018). , “Combining convolutional neural network and distance distribution matrix for identification of congestive heart failure,” IEE Access, vol. 6, pp. 39734–39744. [Google Scholar]
6. J. Lee, B. Reyes, D. D. McManus, O. Maitas and K. H. Chon. (2012). “Atrial fibrillation detection using an iPhone 4S. IEEE transactions on biomedical engineering,” IEEE Transactions on Biomedical Engineering, vol. 60, no. 1, pp. 203–206. [Google Scholar]
7. A. Ghoidrati, B. Murray and S. Marinello. (2008). “RR interval analysis for detection of atrial fibrillation in ECG monitors,” in IEEE 30th Annual Int. Conf. of the IEEE Engineering in Medicine and Biology Society, Vancouver, BC, Canada, pp. 601–604. [Google Scholar]
8. G. B. Moody and R. G. Mark. (2001). “The impact of the MIT-BIH Arrhythmia database,” IEEE Engineering in Medicine and Biology Magazine, vol. 20, no. 3, pp. 45–50. [Google Scholar]
9. J. Lian, L. Wang and D. Muessig. (2011). “A simple method to detect atrial fibrillation using RR intervals,” American Journal of Cardiology, vol. 107, no. 10, pp. 1494–1497. [Google Scholar]
10. X. Ruan, X. Lui, C. Lui, X. Wang and P. Li. (2011). “Automatic detection of atrial fibrillation using RR interval signal,” in 4th IEEE Int. Conf. on Biomedical Engineering and Informatics, Shanghai, China, vol. 2, pp. 644–647. [Google Scholar]
11. B. Logan and J. Healey. (2005). “Robust detection of atrial fibrillation for a long term telemonitoring system,” in IEEE in Computers in Cardiology, Lyon, France, pp. 619–622. [Google Scholar]
12. R. Goya-Esteban, I. Mora-Jiménez, J. Rojo-Alvarez, O. Barquero-Pérez, F. J. Pastor-Pérez et al. (2010). , “Heart rate variability on 7-day Holter monitoring using a bootstrap rhythmometric procedure,” IEEE Transactions on Biomedical Engineering, vol. 57, no. 6, pp. 1366–1376. [Google Scholar]
13. C. Steinberg, F. Philippon, M. Sanchez, M. Fortier-Poisson, G. O’Hara et al. (2019). , “A novel wearable device for continuous ambulatory ECG recording: Proof of concept and assessment of signal quality,” Biosensors, vol. 9, no. 1, pp. 17. [Google Scholar]
14. K. Lee, S. Kim, H. O. Choi, J. Lee and Y. Nam. (2020). “Analyzing electrocardiogram signals obtained from a nymi band to detect atrial fibrillation,” Multimedia Tools and Application, vol. 79, no. 23, pp. 15985–15999. [Google Scholar]
15. C. W. Mundt, K. N. Montgomery, U. E. Udoh, V. N. Barker, G. C. Thonier et al. (2005). , “A multiparameter wearable physiologic monitoring system for space and terrestrial applications,” IEEE Transactions on Information Technology in Biomedicine, vol. 9, no. 3, pp. 382–391. [Google Scholar]
16. H. C. Jung, J. H. Moon, D. H. Baek, J. H. Lee, Y. Y. Choi et al. (2012). , “CNT/PDMS composite flexible dry electrodes for long-term ECG monitoring,” IEEE Transactions on Biomedical Engineering, vol. 59, no. 5, pp. 1472–1479. [Google Scholar]
17. J. Hansel, I. Solleder, W. Gfroerer, C. M. Muth, K. Paulat et al. (2009). , “Hypoxia and cardiac arrhythmias in breath-hold divers during voluntary immersed breath-holds,” European Journal of Applied Physiology, vol. 105, no. 5, pp. 673–678. [Google Scholar]
18. K. Hirayanagi, K. Nakabayashi, K. Okonogi and H. Ohiwa. (2003). “Autonomic nervous activity and stress hormones induced by hyperbaric saturation diving,” Undersea & Hyperbaric Medical Society, vol. 30, no. 1, pp. 47–55. [Google Scholar]
19. A. Kurita, H. Nagayoshi, Y. Okamoto, B. Takase, T. Ishizuka et al. (2002). , “Effects of severe hyperbaric pressure on autonomic nerve functions,” Military Medicine, vol. 167, no. 11, pp. 934–938. [Google Scholar]
20. Y. Bai, R. T. Mahon, J. C. White, P. R. Brink and K. H. Chon. (2009). “Impairment of the autonomic nervous function during decompression sickness in swine,” Journal of Applied Physiology, vol. 106, no. 3, pp. 1004–1009. [Google Scholar]
21. B. A. Reyes, H. F. Posada-Quintero, J. R. Bales, A. L. Clement, G. D. Pins et al. (2014). , “Novel electrodes for underwater ECG monitoring,” IEEE Transactions on Biomedical Engineering, vol. 61, no. 6, pp. 1863–1876. [Google Scholar]
22. A. Pentecost, B. Jones and R. W. Renaut. (2003). “What is a hot spring?,” Canadian Journal of Earth Sciences, vol. 40, no. 11, pp. 1443–1446. [Google Scholar]
23. Z. Hamzah, N. A. Rani, A. Saat and A. K. Wood. (2013). “Determination of hot springs physico-chemical water quality potentially use for balneotherapy,” Malaysian Journal of Analytical Sciences, vol. 17, no. 3, pp. 436–444. [Google Scholar]
24. J. B. Spicer, F. W. Zeng, K. Han, L. R. Olasov, N. C. Gallego et al. (2014). , “Effects of graphite porosity and anisotropy on measurements of elastic modulus using laser ultrasonics,” in IEEE Int. Ultrasonics Sym., Chicago, IL, pp. 232–235. [Google Scholar]
25. Y. M. Chi, T. P. Jung and G. Cauwenberghs. (2010). “Dry-contact and noncontact biopotential electrodes: Methodological review,” IEEE Reviews in Biomedical Engineering, vol. 3, pp. 106–119. [Google Scholar]
26. T. Thap, K. H. Yoon and J. Lee. (2016). “Graphite based electrode for ECG monitoring: Evaluation under freshwater and saltwater conditions,” Sensors, vol. 16, no. 4, pp. 542. [Google Scholar]
27. BioPac. (2020). “MP160 data acquisition systems,” . [Online]. Available: https://www.biopac.com/product/mp150-data-acquisition-systems/. [Google Scholar]
28. BioPac. (2020). “ECG electrocardiogram amplifier,” . [Online]. Available: https://www.biopac.com/product/ecg-electrocardiogram-amplifier. [Google Scholar]
29. P. S. Kang and K. W. Park. (2010). “A review on the historical change of hot springs in Onyang-Oncheon,” Tourism Institute of Northeast Asia, vol. 6, no. 2, pp. 83–103. [Google Scholar]
30. Onyang Hot Spring Hotel. (2020). “Onyang temporary palace/museum,” . [Online]. Available: https://www.onyanghotel.co.kr:502/en/m92.php. [Google Scholar]
31. U. Yun, B. W. Chao and C. Lee. (2016). “Hydrochemical properties of the onyang hot spring waters,” Journal of Engineering Geology, vol. 26, no. 4, pp. 561–570. [Google Scholar]
32. G. M. Friesen, T. C. Jannett, M. A. Jadallah, S. L. Yates, S. R. Quint et al. (1990). , “A comparison of the noise sensitivity of nine QRS detection algorithms,” IEEE Transactions on Biomedical Engineering, vol. 37, no. 1, pp. 85–98. [Google Scholar]
33. J. Pan and W. J. Tompkins. (1985). “A real-time QRS detection algorithm,” IEEE Transactions on Biomedical Engineering, vol. 32, no. 3, pp. 230–236. [Google Scholar]
34. J. M. Bland and D. G. Altman. (1999). “Measuring agreement in method comparison studies,” Statistical Methods in Medical Research, vol. 8, no. 2, pp. 135–160. [Google Scholar]
35. P. Sedgwick. (2012). “Pearson’s correlation coefficient,” BMJ (Online), vol. 345, e4483. [Google Scholar]
36. BioPac. (2020). “Software,” . [Online]. Available: https://www.biopac.com/product-category/research/software/. [Google Scholar]
 | This work is licensed under a Creative Commons Attribution 4.0 International License, which permits unrestricted use, distribution, and reproduction in any medium, provided the original work is properly cited. |