DOI:10.32604/cmc.2020.013946
| Computers, Materials & Continua DOI:10.32604/cmc.2020.013946 | |
| Article |
Hybrid Metamodel—NSGA-III—EDAS Based Optimal Design of Thin Film Coatings
1Department of Mechanical Engineering, Vel Tech Rangarajan Dr. Sagunthala R&D Institute of Science and Technology, Avadi, 600062, India
2Department of Electronics and Telecommunication Engineering, MPSTME SVKM’S Narsee Monjee Institute of Management Studies, Shirpur, 425405, India
3Department of Mechanical Engineering, Sikkim Manipal Institute of Technology, Sikkim Manipal University, Majhitar, 737136, India
4School of Computing, University of Eastern Finland, Kuopio, 70211, Finland
*Corresponding Author: Kanak Kalita. Email: drkanakkalita@veltech.edu.in
Received: 26 August 2020; Accepted: 25 September 2020
Abstract: In this work, diamond-like carbon (DLC) thin film coatings are deposited on silicon substrates by using plasma-enhanced chemical vapour deposition (PECVD) technique. By varying the hydrogen ( ) flow rate,
  −Argon (Ar) flow rate and deposition temperature (
 ) as per a Box-Behnken experimental design (BBD), 15 DLC deposition experiments are carried out. The Young’s modulus (E) and the coefficient of friction (COF) for the DLCs are measured. By using a second-order polynomial regression approach, two metamodels are built for E and COF, that establish them as functions of
  flow rate,
  -Ar flow rate and
  . A non-dominated sorting genetic algorithm (NSGA-III) is used to obtain a set of Pareto solutions for the multi-objective optimization of E maximization and COF minimization. According to various practical scenarios, evaluation based on distance from average solution (EDAS) approach is used to identify the most feasible solutions out of the Pareto solution set. Confirmation experiments are conducted which shows the efficacy of the polynomial regression—NSGA-III—EDAS hybrid approach. The surface morphology of the DLCs deposited as per the optimal predictions is also studied by using atomic force microscopy.
Keywords: Multi-objective optimization; regression analysis; thin-film coating
The excellent mechanical, tribological and optical properties of diamond-like carbon (DLC) coatings offer a wide application in the automotive and electronic industries. DLC coating is a mixture of both graphite-like sp2 bond and diamond-like sp3 bonds which shows that the properties of DLCs depend on the number of bonds present within the coatings. DLCs are considered to be the hybrid form of carbon which holds both graphite-like sp2 bond and diamond-like sp3 bonds [1]. It is well known that graphite (100% sp2) is having a zero-band gap whereas diamond (100% sp3 bond) has a bandgap of 5.5 eV and thus, by the synthesis of DLCs by using different methods the amount of sp3 and sp2 bonds can be altered [2]. Due to the mixture of sp2 and sp3 bonds within the DLC films, it possesses characteristics of both graphite and diamond. The good electrical and electronic properties of DLC are due to the sp2 hybridized carbon whereas, the tribological and mechanical properties are due to the sp3 hybridized carbon [3,4]. DLC films are also used for making surgical equipments, automotive engine parts, magnetic storage discs, micro-electromechanical devices (MEMS), etc.
Various chemical vapour deposition (CVD) techniques are used for the deposition of thin-film coatings and out of all the CVD techniques, plasma-enhanced chemical vapour deposition (PECVD) technique is most widely used for the DLC coating synthesis because of its quality coating at low temperature [5–7]. The different PECVD deposition parameters like gas flow rate, duty cycle, gas composition, deposition temperature, power supply etc. influence the properties of DLC thin films. In recent years, the selection of deposition parameters is a matter of prime concern for the researchers to get the desired properties of the films [8,9]. Singh et al. [10] used a Taguchi technique to find the combination of PECVD deposition parameters like bias voltage (V), bias frequency (f), gas composition, deposition pressure (P) of DLC coatings with PECVD technique to get optimum response parameters, i.e., roughness and hardness. Ghadai et al. [11] used particle swarm optimization (PSO) techniques to optimize the PECVD process parameters to get high hardness of the DLC coating. In an extension to the previous work, Ghadai et al. [12] found that symbolic regression metamodels are superior to traditional polynomial regression metamodels. The symbolic regression metamodels were form-free and thus, were better at modelling the inherent non-linearity in the deposition process. Ghadai et al. [13] also used a genetic algorithm to fine-tune the DLC deposition parameters in APCVD process.
Despite the considerable amount of work done on DLC thin film coatings, only a handful of works are seen on the implementation of advance computational intelligence techniques like multi-objective optimization based on metamodels. This work attempts to address this lacuna by building metamodels that express two different DLC performance parameters (Young’s modulus and coefficient of friction) as functions of three DLC deposition process parameters (hydrogen flow rate,  -Argon flow rate and deposition temperature). The metamodels are then deployed in conjunction with the non-dominated sorting genetic algorithm (NSGA-III) for carrying out Pareto optimization. Finally, based on certain scenarios, a multi-criteria decision-making method called EDAS is used to identify the desirable solutions from the Pareto set. Surface morphologies of these optimal designs are studied by using atomic force microscopy.
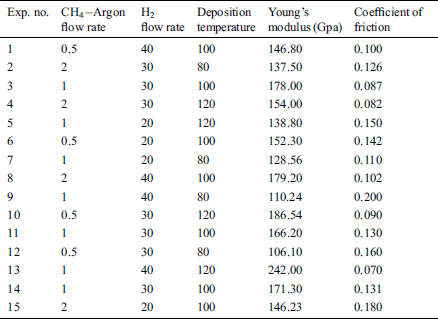
In the work, the synthesis of DLC coatings over silicon (Si) was done by using PECVD deposition technique. To remove the oxide layer, the substrates were dipped into 2% HF solution for 4 min followed by ultrasonic cleaning in deionized water for 10 min. Tab. 1 shows the details of input parameters like hydrogen ( ) flow rate,
  -Argon (Ar) flow rate and temperature for the deposition (
 ) of DLC coatings. The morphological analysis of the DLC coating is done with the help of Innova SPM atomic force microscope. The Young’s modulus (E) of the DLC coatings were calculated by using a nano-hardness tester (NHTX-55-0019) of CSM Instruments having Berkovich indentor. The radius of curvature of the indentor (B-I 93) is 20 μm. The indentation was considered at three different locations and the average of that value is considered and the maximum load is taken as 10 mN. The Oliver–Pharr method [14] is applied for the calculation of Young’s modulus (E). The nano scratch tests were performed over the coating by using CSM instrument with a sphero-conical diamond indenter (R = 2 µm, SB-A63), by applying a load of 20 mN with a scratch speed of 1 mm/min over a 0.5 mm scratch length.
Table 1: Experimental readings of Young’s modulus and coefficient of friction measured at selected BBD sample points
2.2 Predictive Modeling with Polynomial Regression
In this work, the metamodels for Young’s modulus and the coefficient of friction are built by fitting a second-order polynomial regression equation of the following form.

Here  are the coefficients of regression. These coefficients of regression help in describing the response (
 ) as a function of predictor variables (
 ).
).  represent hydrogen (
 ) flow rate,
  -Argon (Ar) flow rate and deposition temperature (
 ) respectively.
Using the Box–Behnken experimental design in Tab. 1, Eq. (1) is fitted based on multiple regression fitting scheme. The difference between the predicted value ( ) and the actual experimental value (
 ) of the response is called the residue [15].
 in Eq. (1) are computed such that the residual sum of squared (RSS) is minimized.
where  is the number of experimental points in Tab. 1.
2.3 Optimization with NSGA-III
In this work, non-dominated sorting genetic algorithm III (NSGA-III) [16,17] is used for carrying out the Pareto optimization. The multi-objective optimization problem is stated as,


In Eq. (4),  and
and  are Young’s modulus (E) and coefficient of friction (COF) respectively.
NSGA-III is realized in this work by using the following pseudo-code.
________________________________________________________________________
START
Define objective functions 
Initiate generation counter 
Initiate a random population of  individuals
Calculate the fitness of each individual
Conduct non-dominated sorting of individuals
Assign ranks and select parents
Generate child population
Tournament selection
Crossover and mutation
Do
Do for all individuals
Calculate fitness
Conduct non-dominated sorting
Generate Pareto fonts
Determine crowing distance
Loop inside by adding solution to next generation from the first front until 
END
Select points on lower front with high crowding distance
Create the next generation
Tournament selection
Crossover and mutation
Until 
Report the Pareto front having  non-dominated solutions
END
________________________________________________________________________
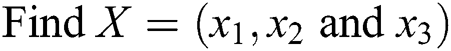
Using the training data listed in Tab. 1, second-order polynomial regression metamodels are developed for the prediction of Young’s modulus (E) and the coefficient of friction (COF). The coefficients of regression for the metamodels of E and COF are mentioned in Tab. 2. Fig. 1 shows the variation of the predicted values of E and COF for their respective experimental values. It should be noted that closer the values are to the diagonal (identity) line in Fig. 1, better are the estimations of the metamodel. In general, the metamodel for E is seen to have better performance than COF. To further analyze the utility of the two metamodels, the residuals in each case are evaluated against their respective predicted values, as shown in Fig. 2. A random scatter is seen in both cases, which indicates that the residues do not show any trend with the predicted values. Thereby it can be concluded that the metamodels are appropriate as they can quantify the variance in the training data. Further analysis of the residuals is done by plotting their normal probability plots in Fig. 3. No outliers are seen in Fig. 3, which further confirms the efficacy of the metamodels.
Figure 1: Predicted versus the experimental output responses. (a) Young’s modulus, (b) Coefficient of friction

Figure 3: Normal probability plots for the residuals of the metamodels. (a) Young’s modulus, (b) Coefficient of friction
Table 2: Regression coefficients for the second-order metamodels
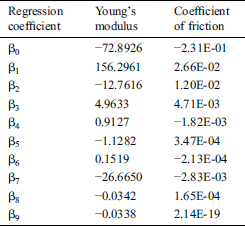
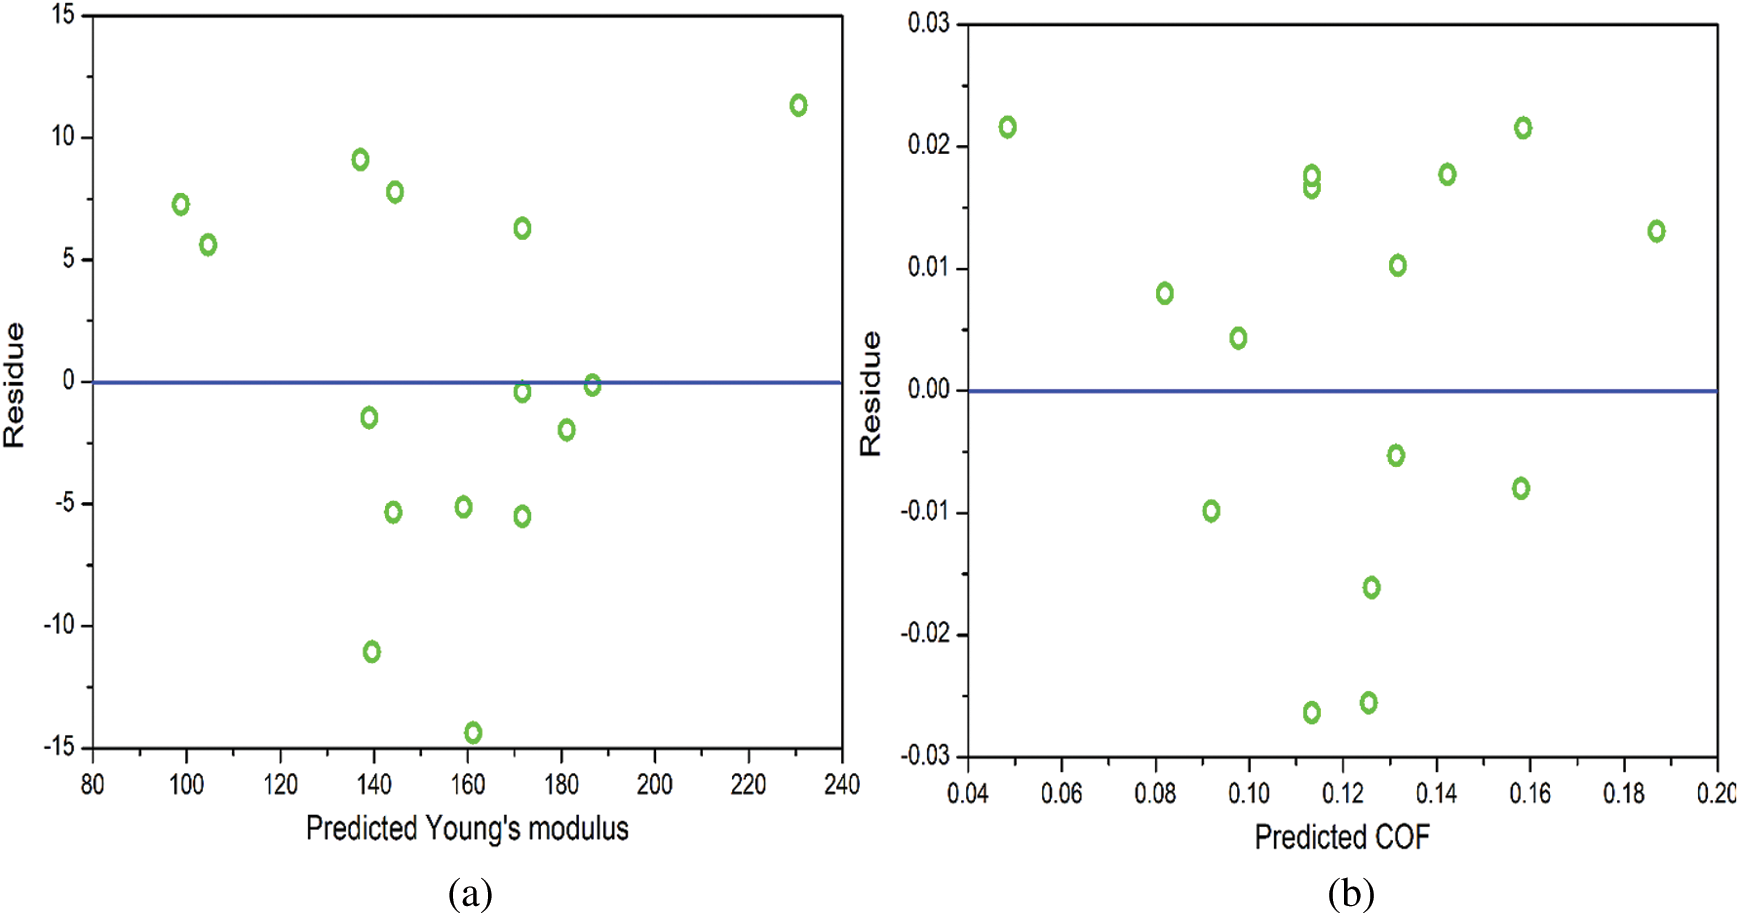
Figure 2: Variation of the residuals with predicted output responses. (a) Young’s modulus, (b) Coefficient of friction
3.2 Influence of Process Parameters on the Young’s Modulus
Fig. 4 shows the effect of H4 and  flow rate on Young’s modulus (E) of the DLCs. It is seen that deposition temperature (
 ) has a significant effect on the role that of
  and
and  flow rate plays on E. For example—at a lesser
  , the E of the DLCs increase with the increase in
  flow rate but the E decreases with an increase in
  flow rate. The trend is the opposite when higher levels of
  is considered. Similarly, Fig. 5 shows the interactive effect of
  and
and  flow rate on E at various levels of
  flow. It is observed that the E increases as the
  and
and  flow rate increases. Fig. 6 shows that the increase in
  flow, in general, decreases the E of the DLCs.
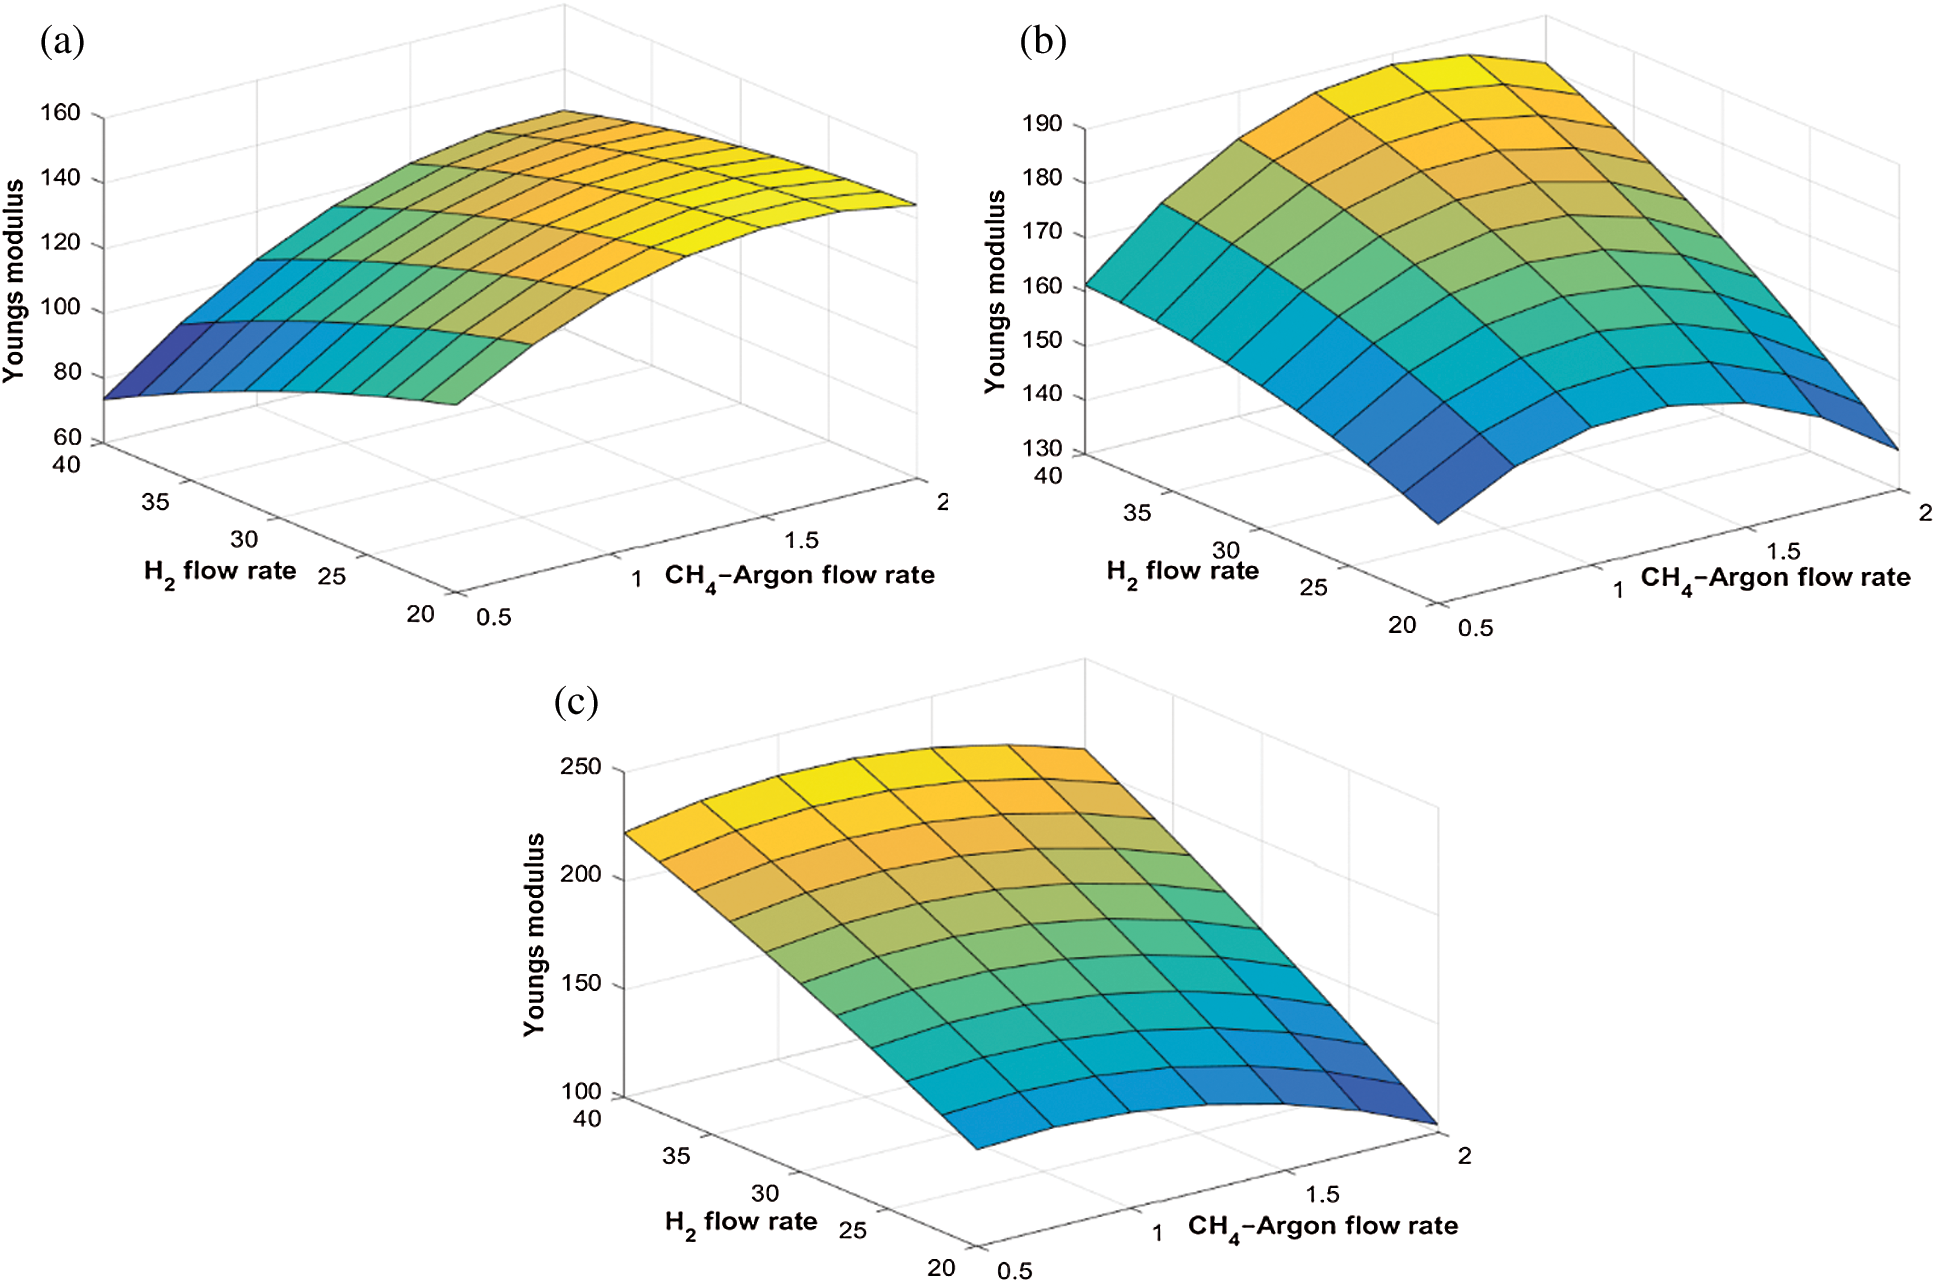
Figure 4: Variation of Young’s modulus with  flow rate and
  flow rate at different deposition temperatures. (a)
  (b)
(b)  , and (c)
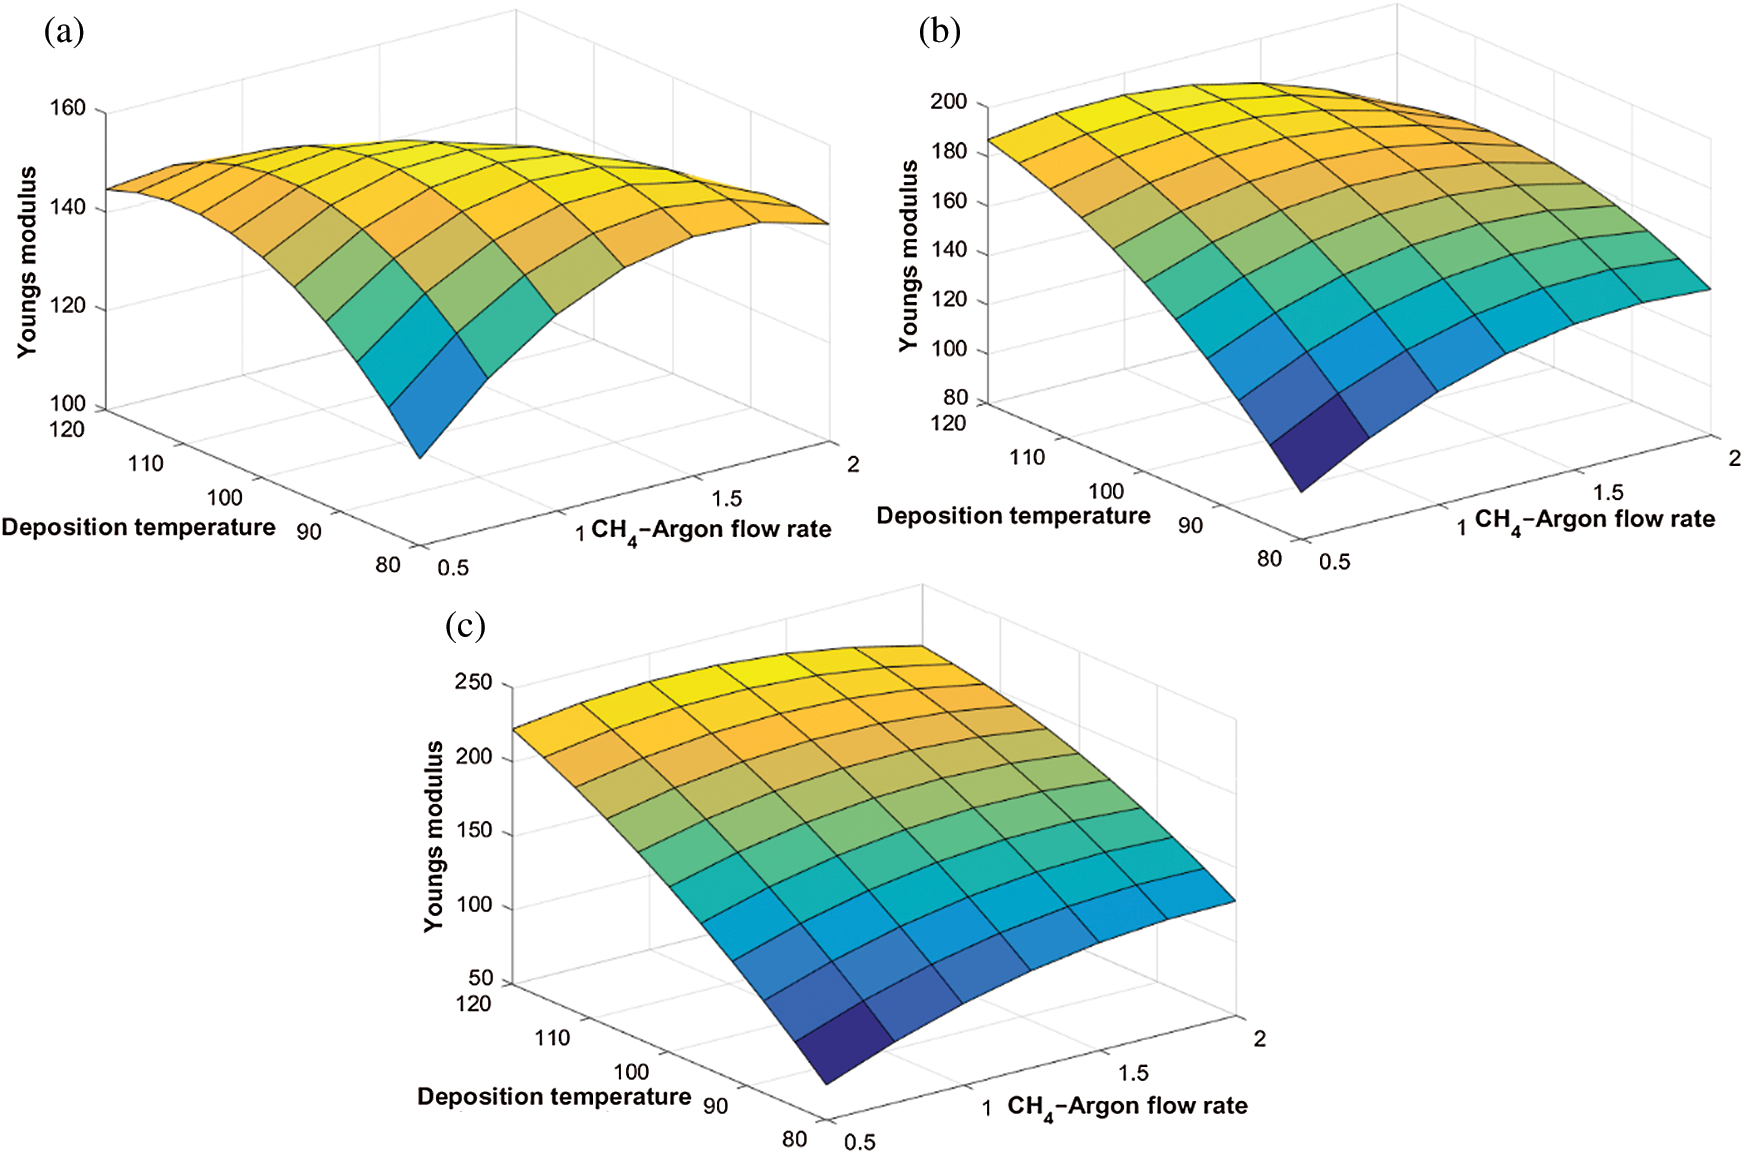
Figure 5: Variation of Young’s modulus with deposition temperature and  flow rate at different
  flow rates. (a) 20 sccm, (b) 30 sccm, and (c) 40 sccm
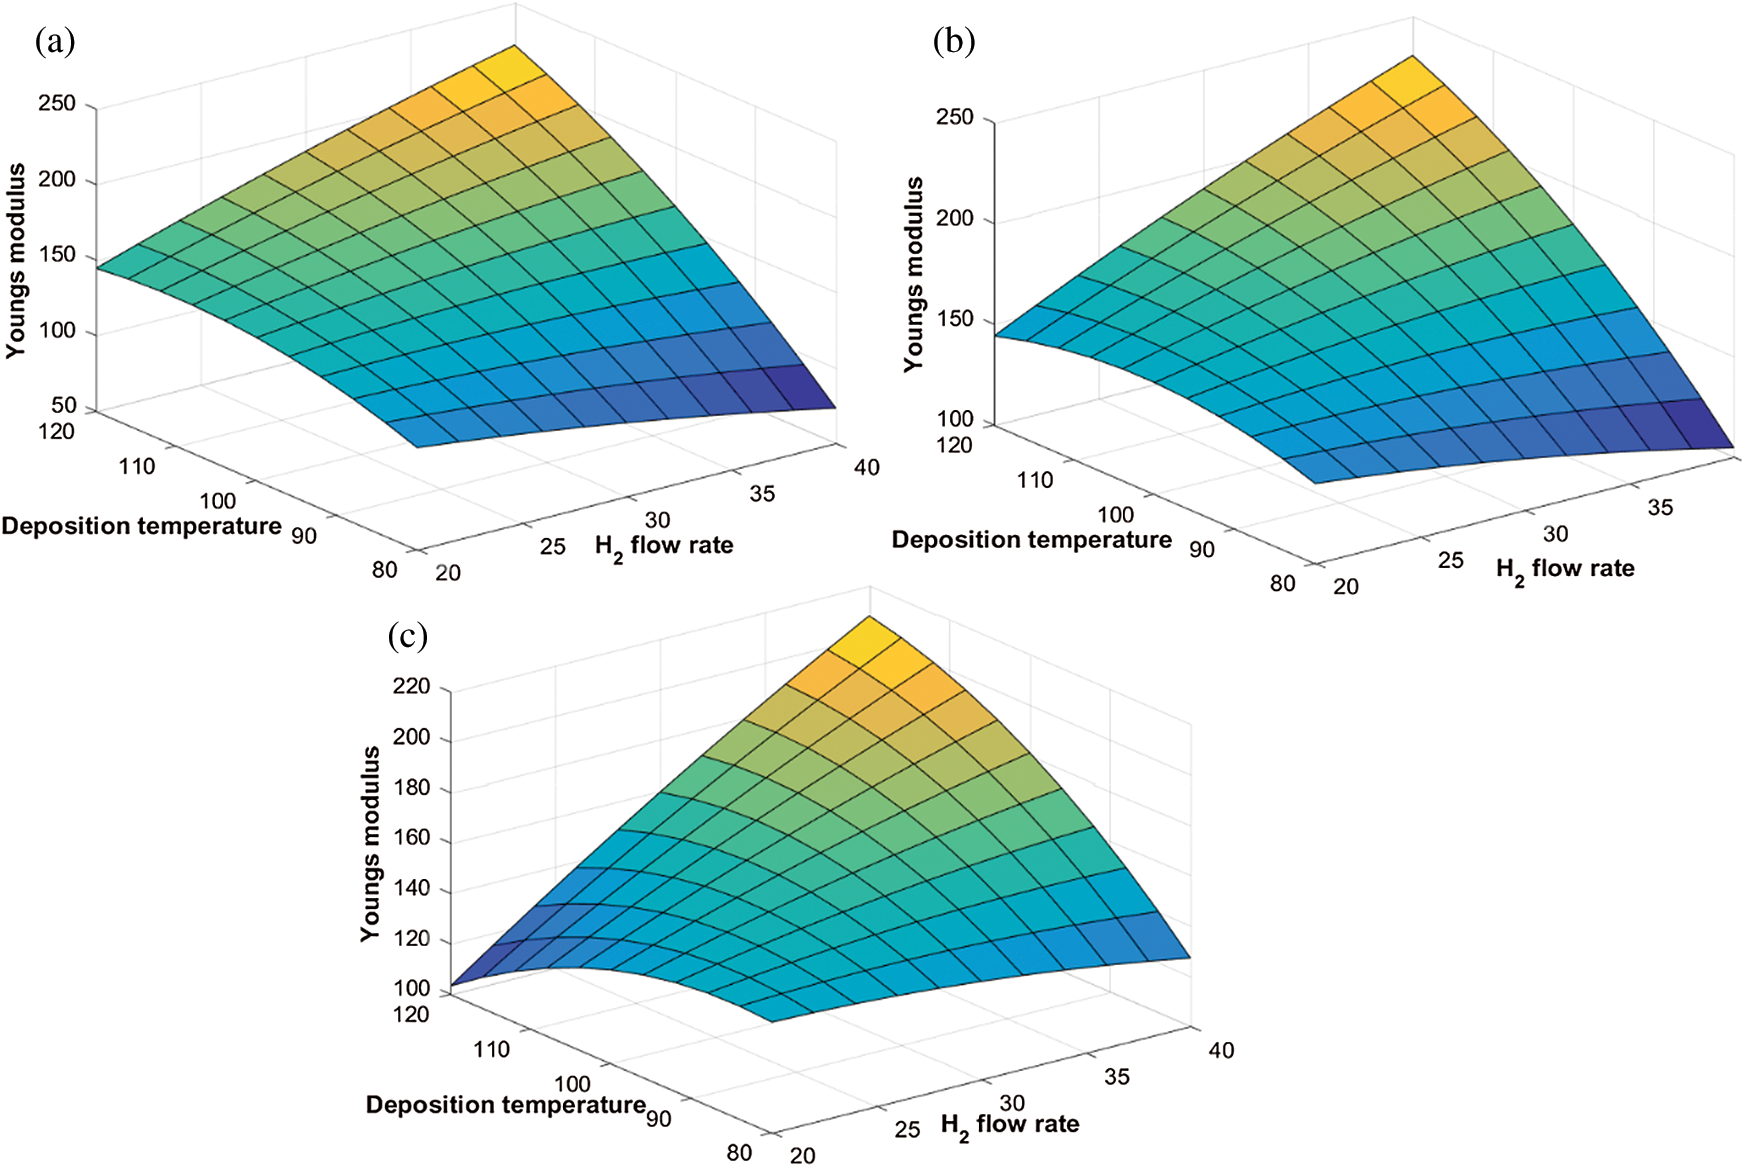
Figure 6: Variation of Young’s modulus with deposition temperature and  flow rate at different
  flow rates. (a) 0.5 sccm, (b) 1 sccm, and (c) 2 sccm
3.3 Influence of Process Parameters on the Coefficient of Friction
Fig. 7 shows the effect of  and
and  flow rate on the coefficient of friction (COF) of the DLCs. It is seen that the trend of the COF of the DLCs is also significantly affected by the
  . At low
  , the increase in
  and
and  flow rate increases the COF of the DLCs, whereas at higher levels of
  , the COF decreases with an increase in
  flow rate but
  flow rate has a negligible effect on it. In Fig. 8, the trend of COF with
  and
and  flow rate is similar for mid and high level
  flow rate but is significantly different for low
  flow rate. At mid and high
  flow rate, the COF increases with a decrease in
  , but is not much affected by variation in
  flow rate. However, as seen in Fig. 9, the behaviour of the COF of the DLCs is similar at all levels of
  flow rate.
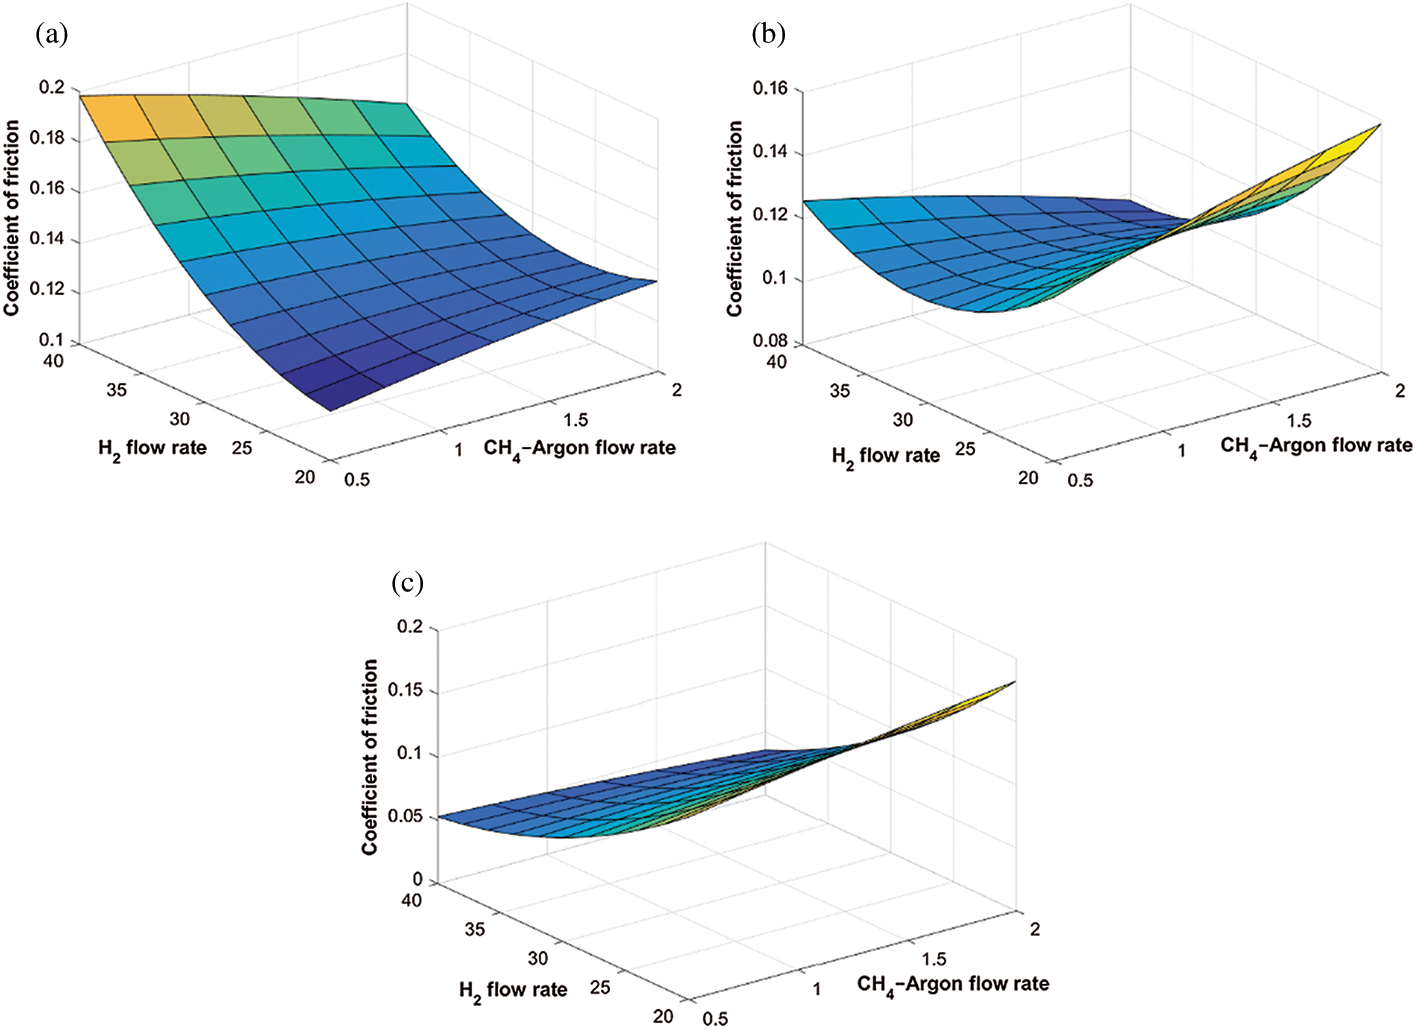
Figure 7: Variation of the coefficient of friction with  flow rate and
  flow rate at different deposition temperatures. (a)
  (b)
(b)  (c)
(c) 
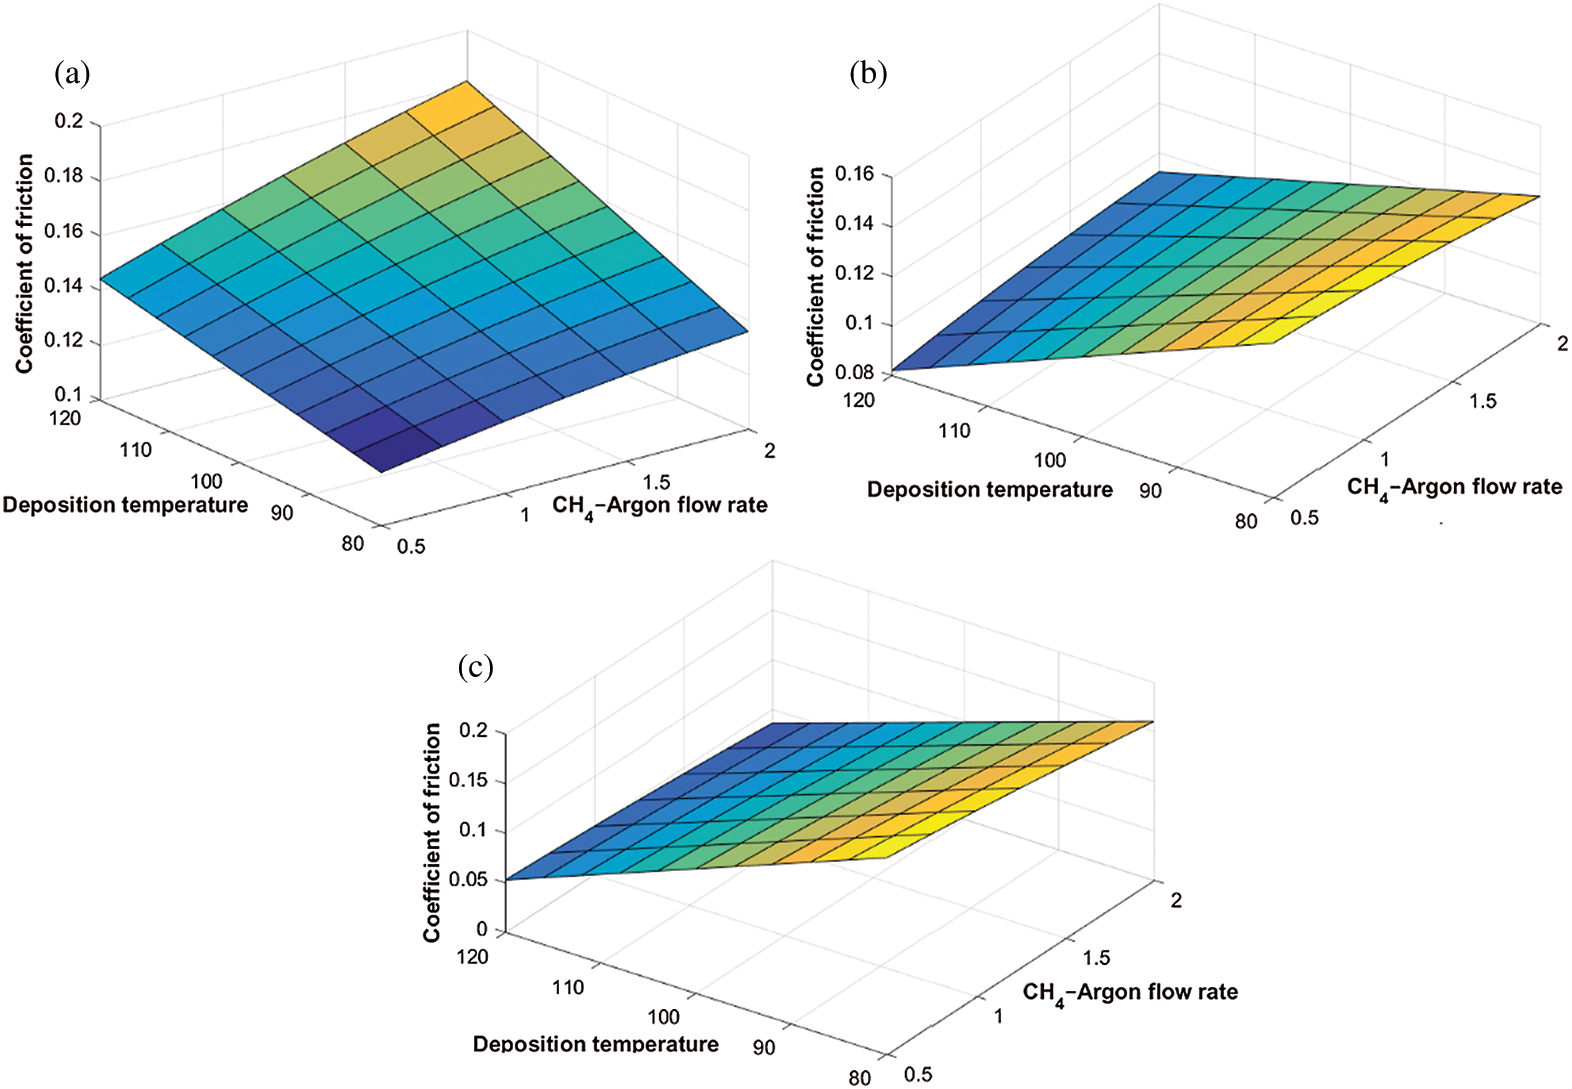
Figure 8: Variation of the coefficient of friction with deposition temperature and  flow rate at different
  flow rates. (a) 20 sccm, (b) 30 sccm, and (c) 40 sccm
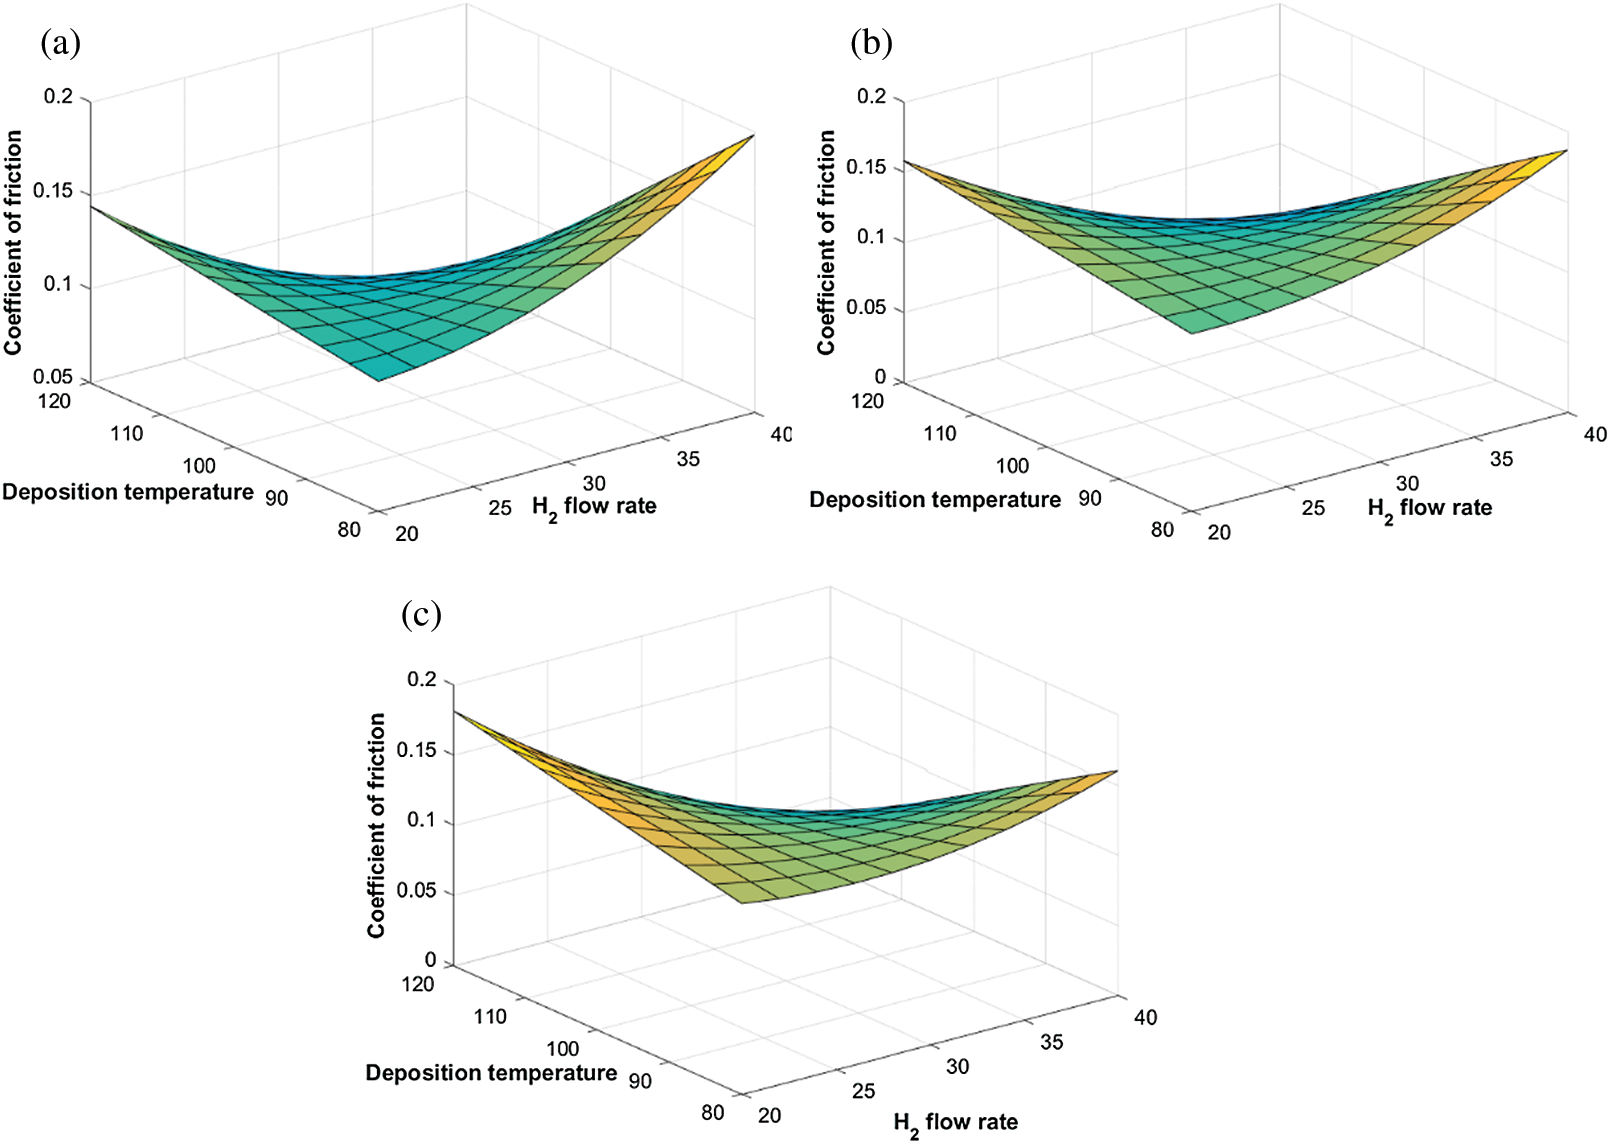
Figure 9: Variation of the coefficient of friction with deposition temperature and  flow rate at different
  flow rates. (a) 0.5 sccm, (b) 1 sccm, and (c) 2 sccm
Based on the discussion on the effect of the DLC deposition process parameters on Young’s modulus and COF in the previous two sections, it is seen that the optimal setting of the two response parameters has conflicting requirements in terms of process parameter settings. Thus, it is not possible to arbitrary decide the optimal parameter combination that would simultaneously maximize the E and minimize the COF. Thus, a Pareto optimization using non-dominated sorting genetic algorithm is carried out and depicted in Fig. 10. The continuous Pareto front in Fig. 10b shows that as the E of the DLCs improve, there is an increase in COF as well. Thus, each solution within the Pareto front in Fig. 10b represents a possible compromise solution to the multi-objective problem. Since it is not possible to arbitrarily draw a particular solution out of the Pareto front to represent a feasible solution, a multi-criteria decision-making approach called EDAS is used to select the most plausible solutions pertaining to certain practical scenarios and are presented in Tab. 3.
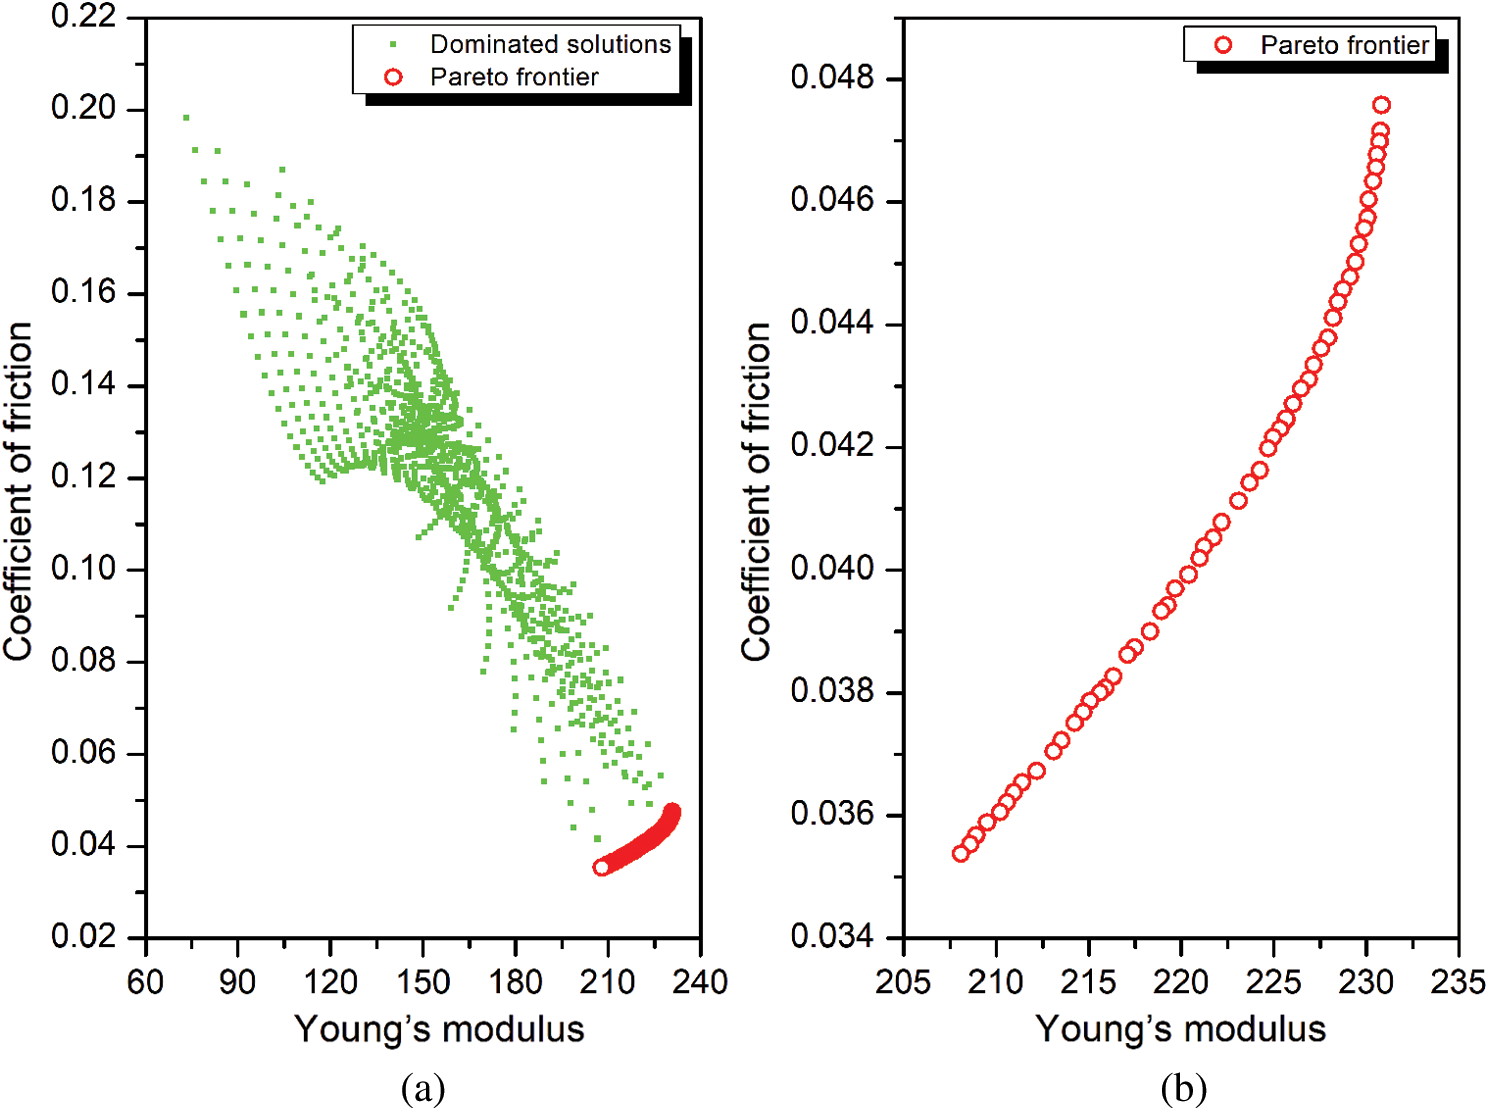
Figure 10: Multi-objective optimization of Young’s modulus and COF (a) Dominated and non-dominated solutions, (b) Enlarged view of Pareto frontier
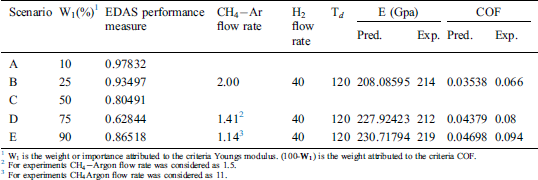
Table 3: EDAS selected optimal solution from the Pareto front
3.5 Experimental Confirmation of Optimal Results
Confirmation experiments as per the optimal process parameters are conducted and the experimental values are reported in Tab. 3. The 3-D and 2-D atomic force microscopy (AFM) images of DLC coatings for the validation of optimal point of scenario (A/B/C), (D) and (E) are shown in Figs. 11–13, respectively. The surface roughness ( ) of the coatings for scenario (A/B/C), (D) and (E) are 15.5 nm, 28 nm, and 32 nm respectively. From the figures, it is observed that small, agglomerated particles are formed for all the cases. The maximum and average particle size for the experimental results for scenario (A/B/C) is 7 nm and 1.5 nm, for scenario (D) the sizes are 15.4 nm and 3.4 nm, for scenario (E) the sizes are 44.2 nm and 7 nm respectively. In all the different scenarios the
  flow rate and deposition temperature are the same, however, the
  flow rate is different. From the experimental results shown in Tab. 3, it is observed that the COF of the DLC coating decreases with an increase in the
  flow rate. From the AFM images, it is observed that the DLC coating having less COF has a smooth surface and result is confirmed from the
  value. Overall, the confirmation experiment values are seen to be close to the predicted optimal solutions.
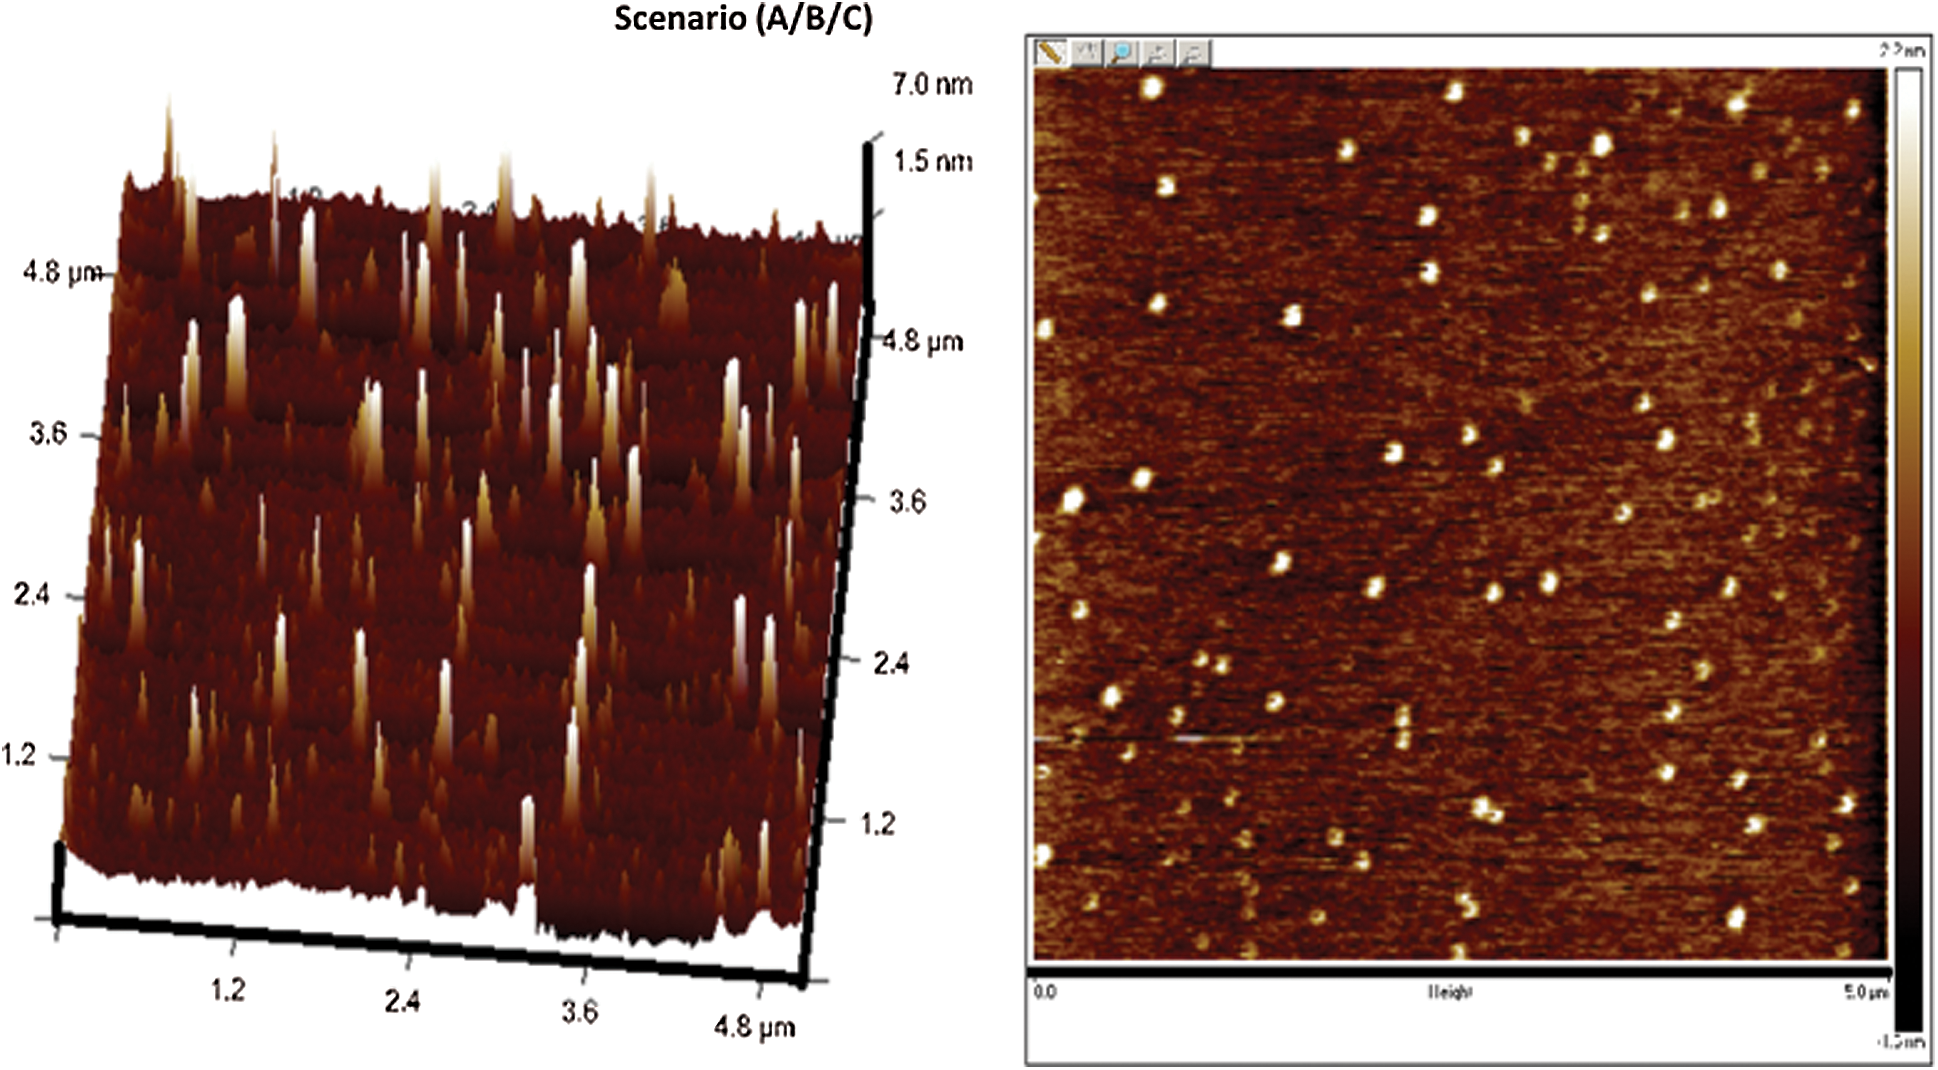
Figure 11: AFM images of deposited DLCs as per scenario A/B/C
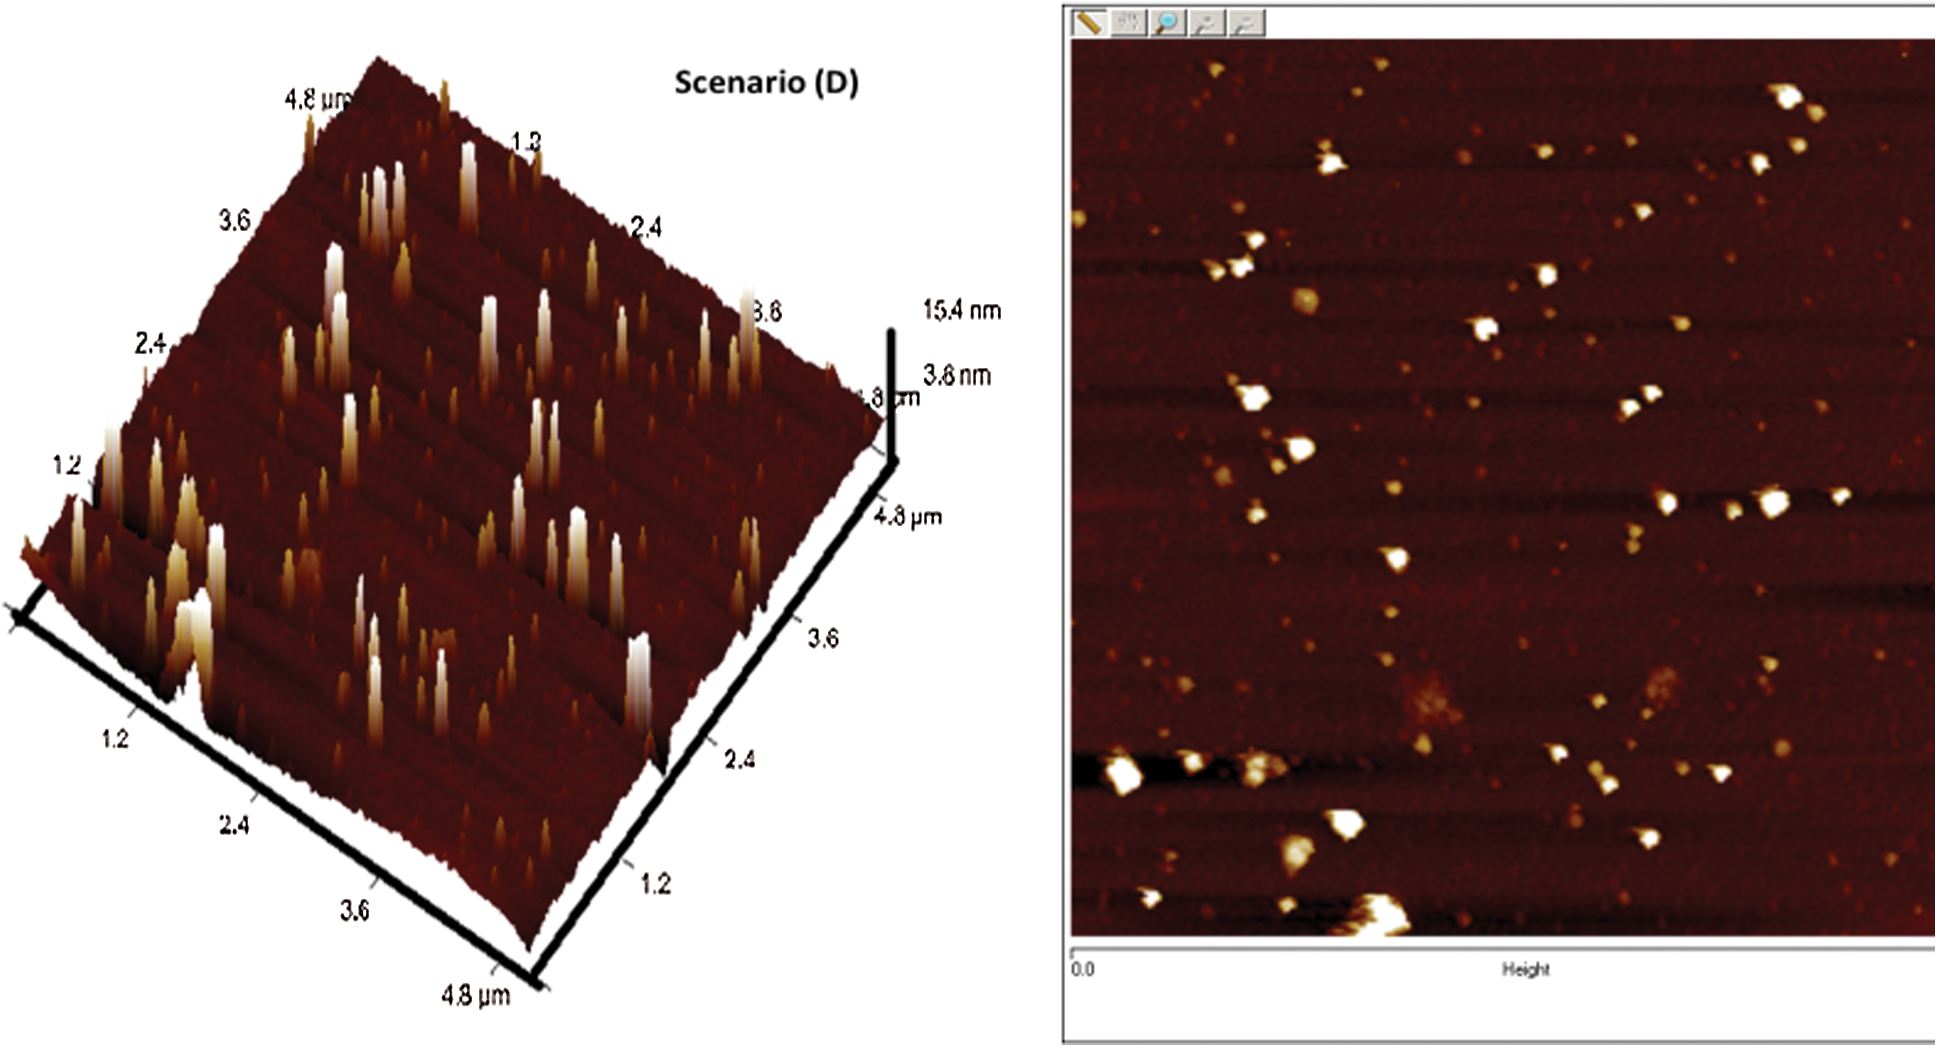
Figure 12: AFM images of deposited DLCs as per scenario D
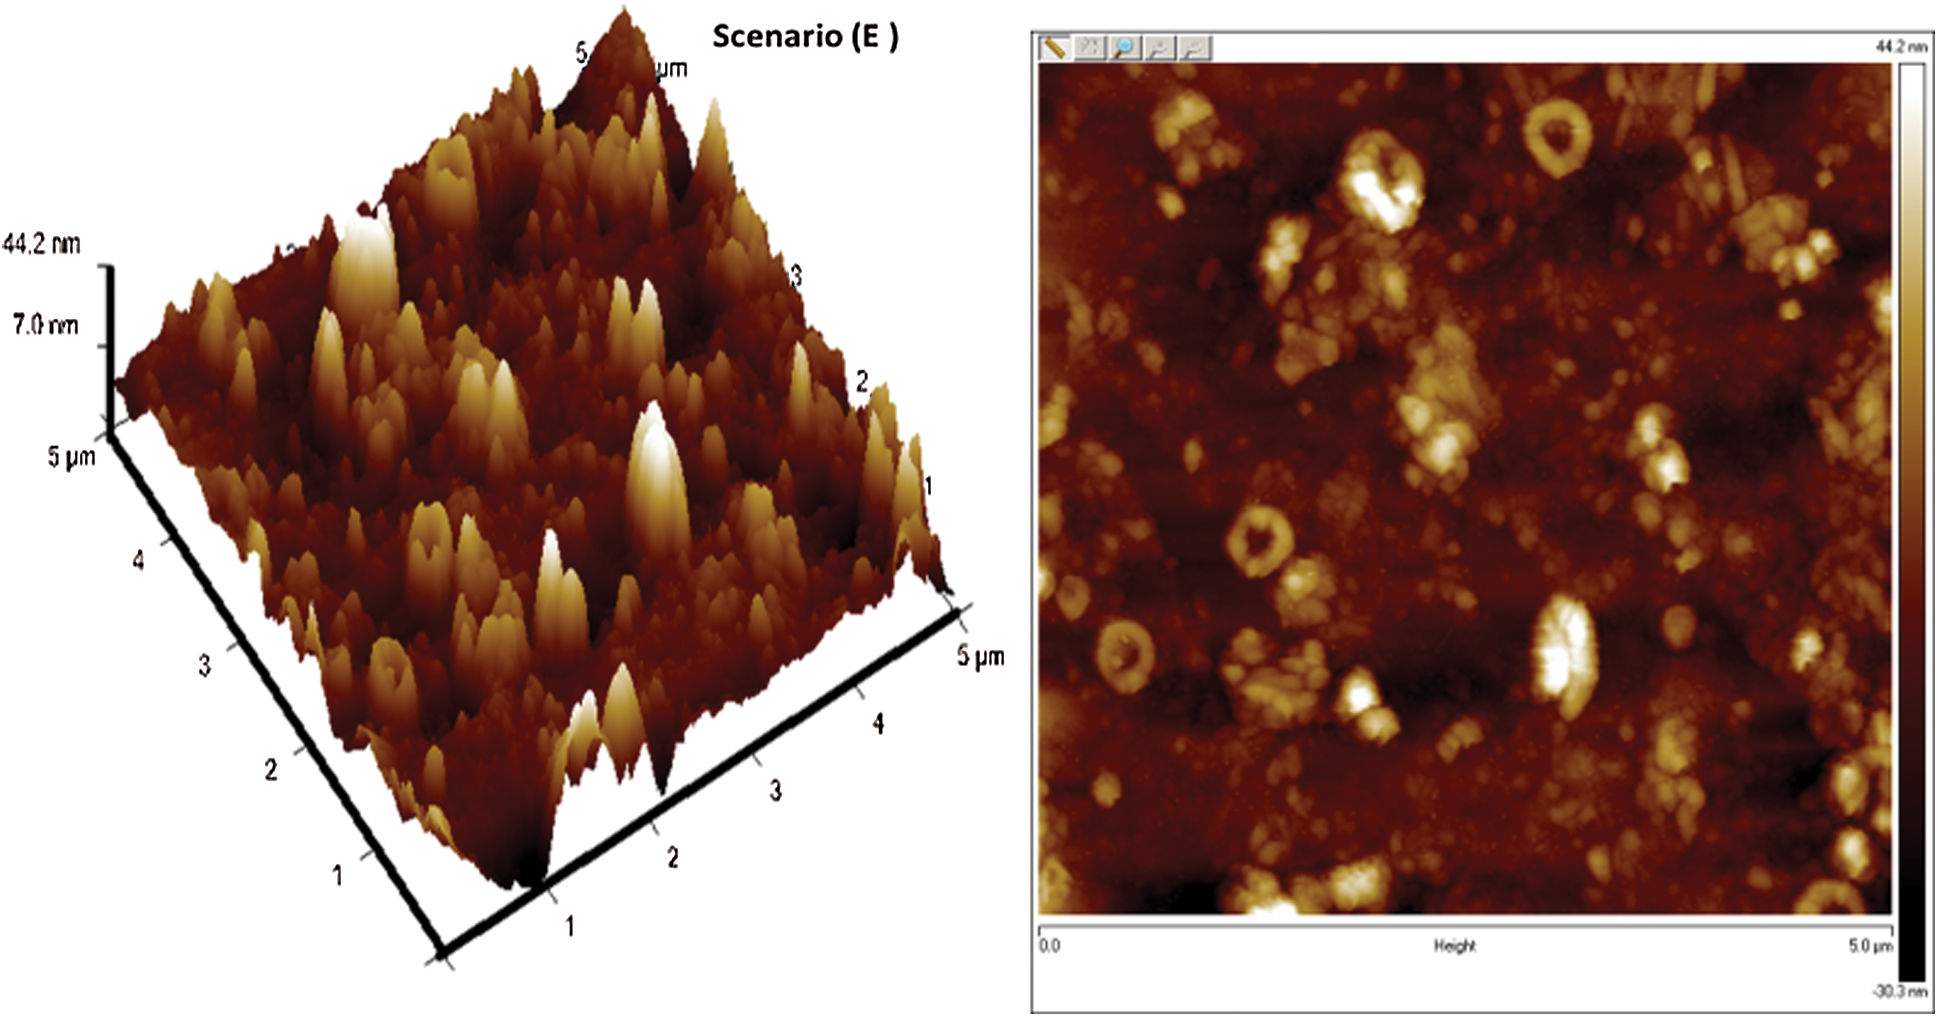
Figure 13: AFM images of deposited DLCs as per scenario E
Finding an optimal combination of process parameters that enhances the performance of a process is a realistic goal with tremendous practical implications. In this work, such an effort for optimizing the DLC deposition process parameters is undertaken to suitably enhance Young’s modulus and coefficient of friction of DLC thin film coatings. Based on the study the following conclusion are made
• Second-order polynomial regressions can serve as reliable metamodels for DLC process modelling that can be subsequently used for process parameter effect study or in case of optimization scenarios.
• Non-dominated sorting genetic algorithm (NSGA-III) is a viable tool for Pareto optimization of such critical processes. Improvement in Young’s modulus of the DLCs was in general accompanied by worsening of the coefficient of friction. Thus, given such conflicting process performance, the Pareto set, as opposed to single-objective solutions, can provide the designer with a lot of flexibility regarding setting the preferred process parameters.
• In general, a higher level of hydrogen flow rate and deposition temperature was found to be suitable in augmenting the young’s modulus of the DLCs.
• Confirmation experiments conducted as per the optimal process parameters showed that the polynomial regression—NSGA-III—EDAS approach is reliable and accurate.
Acknowledgement: Authors acknowledge the support of COE, Manipal University in carrying out the characterizations.
Funding Statement: This research was partially funded by TMA Pai University Research Fund, Manipal Group, India (Grant No. 6100/SMIT/R&D/Project/08/2018).
Conflicts of Interest: The authors declare that they have no conflicts of interest to report regarding the present study.
1. J. Robertson. (2002). “Diamond-like amorphous carbon,” Materials Science and Engineering: R: Reports, vol. 37, no. 4, pp. 129–281. [Google Scholar]
2. M. Moseler, P. Gumbsch, C. Casiraghi, A. C. Ferrari and J. Robertson. (2005). “The ultrasmoothness of diamond-like carbon surfaces,” Science, vol. 309, no. 5740, pp. 1545–1548. [Google Scholar]
3. H. Li, T. Xu, C. Wang, J. Chen, H. Zhou et al. (2006). , “Annealing effect on the structure, mechanical and tribological properties of hydrogenated diamond-like carbon films,” Thin Solid Films, vol. 515, no. 4, pp. 2153–2160. [Google Scholar]
4. M. Kihel, R. Clergereaux, D. Escaich, M. Calafat, P. Raynaud et al. (2008). , “Investigations on electrical properties of a-C:H thin films deposited in a microwave multipolar plasma reactor excited at distributed electron cyclotron resonance,” Diamond and Related Materials, vol. 17, no. 7, pp. 1710–1715. [Google Scholar]
5. R. K. Ghadai, S. Das, D. Kumar, S. C. Mondal and B. P. Swain. (2018). “Correlation between structural and mechanical properties of silicon doped DLC thin films,” Diamond and Related Materials, vol. 82, pp. 25–32. [Google Scholar]
6. A. Muthuraja, S. Naik, D. K. Rajak and C. I. Pruncu. (2019). “Experimental investigation on chromium-diamond like carbon (Cr-DLC) coating through plasma enhanced chemical vapour deposition (PECVD) on the nozzle needle surface,” Diamond and Related Materials, vol. 100, 107588. [Google Scholar]
7. E. J. D. M. Pillaca, M. A. Ramı́rez, J. G. Bernal, D. C. Lugo and V. J. Trava-Airoldi. (2019). “DLC deposition inside of a long tube by using the pulsed-DC PECVD process,” Surface and Coatings Technology, vol. 359, no. 1, pp. 55–61. [Google Scholar]
8. O. Keles, Y. Taptik, O. L. Eryilmaz, M. Urgen and A. F. Cakir. (1999). “Optimization of ARC-PVD TiN coating process parameters by Taguchi technique,” Quality Engineering, vol. 12, no. 1, pp. 29–36. [Google Scholar]
9. K. J. Clay, S. P. Speakman, N. A. Morrison, N. Tomozeiu, W. I. Milne et al. (1998). , “Material properties and tribological performance of rf-PECVD deposited DLC coatings,” Diamond and Related Materials, vol. 7, no. 8, pp. 1100–1107. [Google Scholar]
10. T. P. Singh and V. S. Jatti. (2015). “Optimization of the deposition parameters of DLC coatings with the IC-PECVD method,” Particulate Science and Technology, vol. 33, no. 2, pp. 119–123. [Google Scholar]
11. R. K. Ghadai, K. Kalita, S. C. Mondal and B. P. Swain. (2018). “PECVD process parameter optimization: Towards increased hardness of diamond-like carbon thin films,” Materials and Manufacturing Processes, vol. 33, no. 16, pp. 1905–1913. [Google Scholar]
12. R. K. Ghadai and K. Kalita. (2020). “Accurate estimation of DLC thin film hardness using genetic programming,” International Journal of Materials Research, vol. 11, no. 6, pp. 453–462. [Google Scholar]
13. R. K. Ghadai, K. Kalita, S. C. Mondal and B. P. Swain. (2019). “Genetically optimized diamond-like carbon thin film coatings,” Materials and Manufacturing Processes, vol. 34, no. 13, pp. 1476–1487. [Google Scholar]
14. W. C. Oliver and G. M. Pharr. (1992). “An improved technique for determining hardness and elastic modulus using load and displacement sensing indentation experiments,” Journal of Materials Research, vol. 7, no. 6, pp. 1564–1583. [Google Scholar]
15. K. Kalita, P. Dey and S. Haldar. (2019). “Search for accurate RSM metamodels for structural engineering,” Journal of Reinforced Plastics and Composites, vol. 38, no. 21, pp. 995–1013. [Google Scholar]
16. K. Deb and H. Jain. (2014). “An evolutionary many-objective optimization algorithm using reference-point-based nondominated sorting approach part I: Solving problems with box constraints,” IEEE Transactions on Evolutionary Computation, vol. 18, no. 4, pp. 577–601. [Google Scholar]
17. N. Ganesh, R. K. Ghadai, A. K. Bhoi, K. Kalita and X. Z. Gao. (2020). “An intelligent predictive model-based multi-response optimization of EDM process,” Computer Modeling in Engineering & Sciences, vol. 124, no. 2, pp. 459–476. [Google Scholar]
 | This work is licensed under a Creative Commons Attribution 4.0 International License, which permits unrestricted use, distribution, and reproduction in any medium, provided the original work is properly cited. |