DOI:10.32604/cmc.2020.014227
| Computers, Materials & Continua DOI:10.32604/cmc.2020.014227 | |
| Article |
Hajj Crowd Management Using CNN-Based Approach
1Department of Information Technology, College of Computer, Qassim University, Buraydah, Saudi Arabia
2Electronic Section, Universiti Kuala Lumpur British Malaysian Institute, Malaysia
3Department of Electrical Engineering, Onaizah Colleges, Saudi Arabia
4Department of Electrical and Computer Engineering, International Islamic University, Malaysia
*Corresponding Author: Waleed Albattah. Email: w.albattah@qu.edu.sa
Received: 07 September 2020; Accepted: 24 September 2020
Abstract: Hajj as the Muslim holy pilgrimage, attracts millions of humans to Mecca every year. According to statists, the pilgrimage has attracted close to 2.5 million pilgrims in 2019, and at its peak, it has attracted over 3 million pilgrims in 2012. It is considered as the world’s largest human gathering. Safety makes one of the main concerns with regards to managing the large crowds and ensuring that stampedes and other similar overcrowding accidents are avoided. This paper presents a crowd management system using image classification and an alarm system for managing the millions of crowds during Hajj. The image classification system greatly relies on the appropriate dataset used to train the Convolutional neural network (CNN), which is the deep learning technique that has recently attracted the interest of the research community and industry in varying applications of image classification and speech recognition. The core building block of CNN is is a convolutional layer obtained by the getting CNN trained with patches bearing designated features of the trainee mages. The algorithm is implemented, using the Conv2D layers to activate the CNN as a sequential network. Thus, creating a 2D convolution layer having 64 filters and drop out of 0.5 makes the core of a CNN referred to as a set of KERNELS. The aim is to train the CNN model with mapped image data, and to make it available for use in classifying the crowd as heavily-crowded, crowded, semi-crowded, light crowded, and normal. The utility of these results lies in producing appropriate signals for proving helpful in monitoring the pilgrims. Counting pilgrims from the photos will help the authorities to determine the number of people in certain areas. The results demonstrate the utility of agent-based modeling for Hajj pilgrims.
Keywords: Crowd management; CNN approach; Hajj
Estimating human crowd flows has remained fundamental to regulating human density and tracking in public places such as shopping malls, railway stations, and airports to improve congestion control, traffic tracking, and crowd management by relevant authorities. Organizing and estimating crowd densities through image processing techniques has been the subject of active and challenging research. In crowd arrangements there lies the need of taking into account mental and social factors of Hajj pilgrims, who come from around the world for the annual religious gathering to the holy city of Mecca [1]. The safety of Hajj pilgrims has always been a reason of concern for the authorities, especially during the Hajj at the three holy sites of Minh, Arafat, and Muzdalifah. One of the main tasks during Hajj is to control and manage large crowds, to ensure the safety and security of pilgrims, and to prevent them from re-occurrence of the 1990 stampede, which resulted in significant casualties and loss of precious lives. A lot of work has been reported to detect crowd behavior, which is especially important in the analysis of crowd scenes [2]. These pilgrims move around like a closely compacted community, regardless of their language, nationality, gender, or occupation. Reconstruction of the raw image is carried out in a training manner so that they can be embedded with better image reproduction features. Therefore, it is important to facilitate efforts being deployed for reporting and, as a result, regulate the crowd as it develops [3]. Pilgrims throw stones at what is called Rami Al-Jamarat, which is called the Stoning of Devil. Crowds of pilgrims all move individually or in groups guided by supervisors. They move at varying speeds depending on their style, age, physical conditions, and whether as escort or escorted, and so they differ in style and throws in Rami Al-Jamarat. At the same time, they also take different time for throwing the stones due to which chances of crowd develop.
Convolution Neural networks (CNN) are primarily used in the field of pattern recognition within images. This allows you to encode specific image-related features in the architecture, making the network more suitable for image-focused tasks. In the case of CNN, the neurons in the fully formed layer are connected to only a small region of the pre-targeted segment. The standard technique compares the whole image with the appropriate image, however, CNN compares part of the image with part of what is commonly known as identifiable features. By finding matches of a particular feature, CNN is much better at looking at matching objects than with whole imaging matching schemes. The objective of image classification is to the automatic allocation of the image to thematic classes. There are two types of classification, supervised and unsupervised classification. Also. Two steps are involved in the classification of images, training the system followed by testing. Image classification is used in every field of life such as Images are used to extract planar graphs representing blood vessels in the retina, and complex multilayer representations of deep objects and shapes against a bright background. Point distribution creates a dynamic Delaunay triangle while edge and side labels define the geometric structure as red edges on adjacent ups [4]. Individual behavior in the assembly of humans is reported in [5], where feature points are first drawn in crowd scenes to understand the relationship of individuals to people’s microcosmic and macroscopic views. Images have been reported into a neural network-based loss function to re-create the raw image into the lookup table, which can be locally differentiated to facilitate the back-propagation process [6]. An efficient algorithm has been recently proposed to detect faint edges in a large set of noise images by creating different surfaces with requirements that meet the curves meeting at the desired edges [7]. The usefulness of the algorithm has been demonstrated in both the simulation and the application involved in the processing of the original maps. In another approach, a long video is temporarily divided into overlapping short video sections that turn into a set of cuboid tips. Each cuboid tip is used to detect short thin elongated body channels representing the linked object box via Fast R-CNN [8]. Videos from scenes viewed from different angles are used to represent the geometry of specific objects for learning the 3D geometry of the target object categories [9]. Image processing has been reduced to developing algorithms for edge detection, reconstruction, extraction of the properties that show the characteristics of the target object. Agent-Based Modeling (ABM) as a study tool mimics the behavior of a large and heterogeneous system, as well as all its possible interactions and results [10]. Khan et al. [11] used agent-based modeling and simulation (ABMS) methods to examine the impact of the layout of the courtyard of the Masjid al-Haram and to study suggesting the administrative priorities for the satisfaction, health, and safety of the Tawaf crowds of pilgrims. Through this method, the performance of micro-level pilgrims has been modeled to mimic the new performance of the crowd to create better security by reducing the number of casualties.
This paper proposes a model for image processing to determine the level of the crowd as one of five types, and to avoid the effect of the crowd exceeding the crowd limit by sending an alarm. Also, it presents an estimate of the crowd density in the pictures too. In this work, we evaluate the deep learning approach for the problem of crowd congestion. Besides studying different CNN architectures, we also investigate different approaches to deal with both high-resolution images and low-resolution images without changing the CNN architecture. The proposed model consists of two main components. The first component takes images of the moving crowd, and these images are then classified into as one of the five categories: Namely, 1) heavily-crowded, 2) crowded, 3) semi-crowded, 4) light crowded, and 5) normal. The second component consists of five color warning lights, and the color of these lights is based on the results of the classification process. The purpose of this article is to represent a model that will help reduce the number of possible incidents that may occur, especially in Rami al-Jamrat. Also, the use of instructions in different languages, especially during Hajj, as well as warning light will be more useful for people to understand the warning signs and to avoid crowd congestion.
The Rami Al-Jamarat actions are performed in the prescribed order as per required guidelines. It takes place around three stone pillars, called Jamarat-al-Oola, Jamarat-al-Wusta, and Jamarat-al-Aqaba as shown in Fig. 1. These pillars are pelted by pilgrims as a compulsory component of Hajj to match the achievement of the Prophet Abraham (عليه السلام) by imitation. These pillars show three locations where Prophet Abraham (عليه السلام) pelted Satan with stones when he tried to dissuade him from taking the sacrifice of his son Prophet Ishmael (عليه السلام). This solemn ceremony affects the flow of the whole crowd, as some of the crowd enter the path for moving towards the pillars while at some places the crowd stops to throw the stones at the pillars. This causes heavy density jams as pilgrims have little time to perform this action. Crowd congestion happens because of the limited time and the vast number of pilgrims struggling to achieve this ritual.
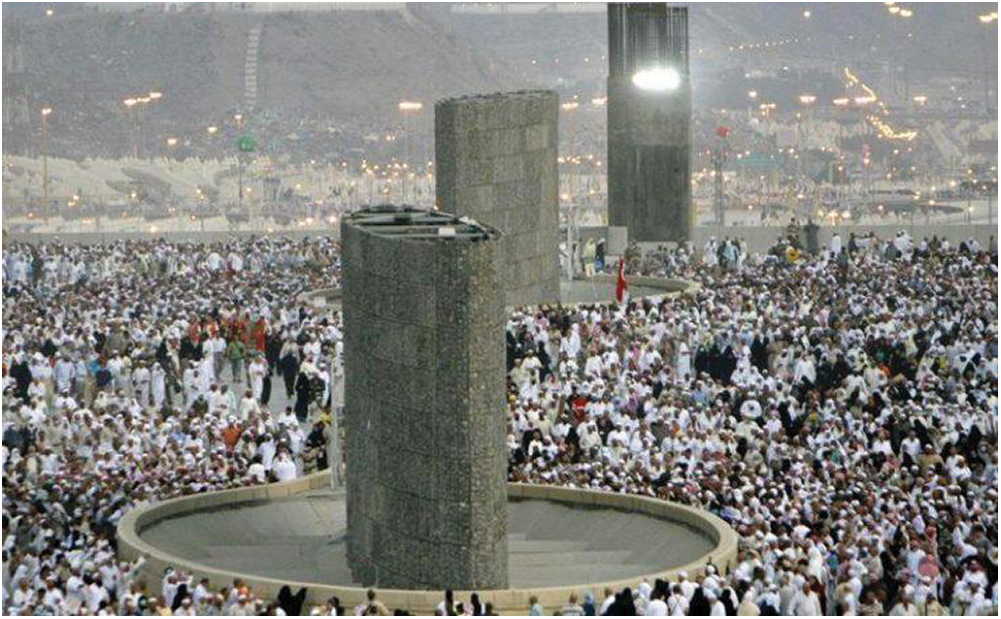
Figure 1: The jamarat three stones pillars
The proposed solution is to act in the early stages of congestion and keeping the crowd flow as close to normal as possible. The Jamarat path is divided into several areas that are monitored in terms of the crowd status to regulate congestion.
The system has been developed using SQL for algorithmic development, Python for CNN algorithm, and Java for Simulation results for implementing crowd level detection algorithms. The system state diagram is shown in Fig. 2.
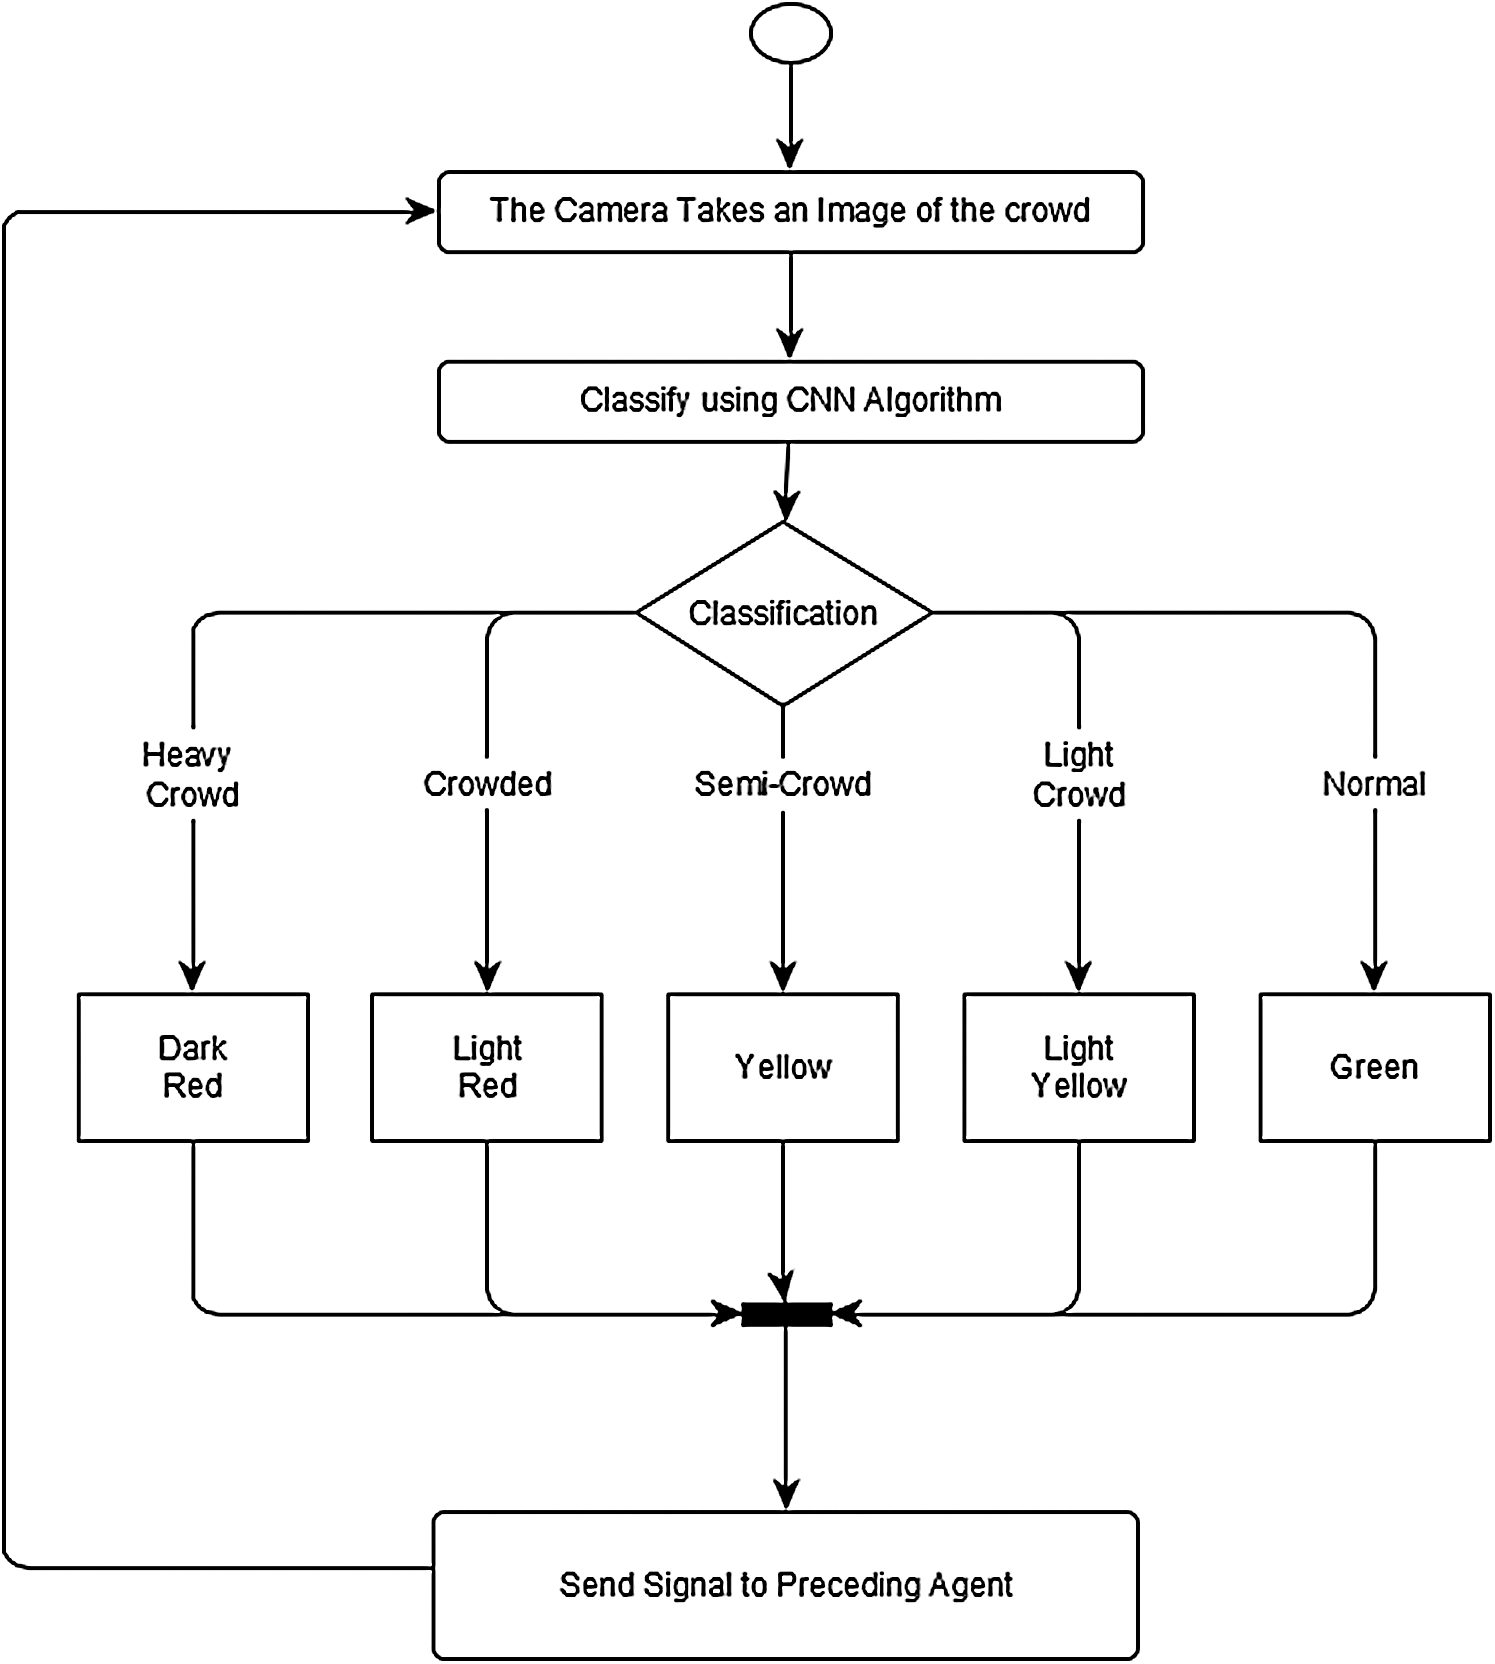
Figure 2: The model state diagram of the proposed approach
Cameras were installed in several areas of the Al-Jamarat Stoning path. These cameras are equipped with five-color warning lights placed above the moving crowd to cover each area. The camera takes an image of crowd every few seconds, to be classified into one of five categories. Image Rating classification determines the color of lights in the previous region, not the area covered by the current camera. In the event of a crowded area, a signal is sent to the warning lights of the previous zone. Color guide is red for the heavily crowded, brown for the crowded, yellow for the semi-crowded, blue for the light crowded, and green for the normal. Pedestrians are informed about the meaning of each light color in advance through the Hajj Monitoring and Management System.
• If the light is red, pedestrians are requested to stop moving until the light changes as they are headed towards a heavily crowded area.
• If the light is brown, pedestrians must walk very slowly as they are heading towards a crowded area.
• If the light turns yellow, this means pedestrians are heading to a semi-crowded area and their speed must be slowed to avoid making the place crowded.
• If the light turns blue, this means pedestrians are heading to a lightly crowded area and must slow down to avoid making the place semi-crowded.
• If the light is green, it means that the situation is safe, and pedestrians can move on normally.
The type of connection between the components depends upon the availability of hardware equipment and on a specific area, it can be wired or wireless.
Crowd analysis is inherently an interdisciplinary research topic with researchers from natural sciences, psychology, physics, biology, public safety, and computer vision backgrounds. Computer vision has gained tremendous interest in the field of deep learning in recent years. The most advanced of the various deep learning models is the Convolution Neural Network (CNN) algorithm, which is a deep learning model for processing grid-styled data, such as images. This algorithm has the advantage of using the convulsion operation in the process of neural training and image classification [12].
The essential components of the CNN algorithm are convolutional, polling, and a fully connected layers, as shown in Fig. 3. The convolutional layer learns to represent the image and is used to compute feature maps. A convolutional layer plays an important role in CNN, which consists of a pile of mathematical processes. To reduce the resolution of feature maps, there is a polling layer after each layer. A pooling layer is used typically to reduce the spatial dimension by using down sampling approach to determines and extract the parameters with minimum distortion and shifts of a feature map.
Once the features extracted through the festival layers and these features are developed after sampling under the polling layers, they are mapped to the final results of the network by a fully connected layer of substrates, the connecting layers “flattens”. The outputs produced by the previous layers convert them into a single vector which can be used as the input of the next layer. Also, it contains neurons that are directly connected to other neurons in two adjacent layers.
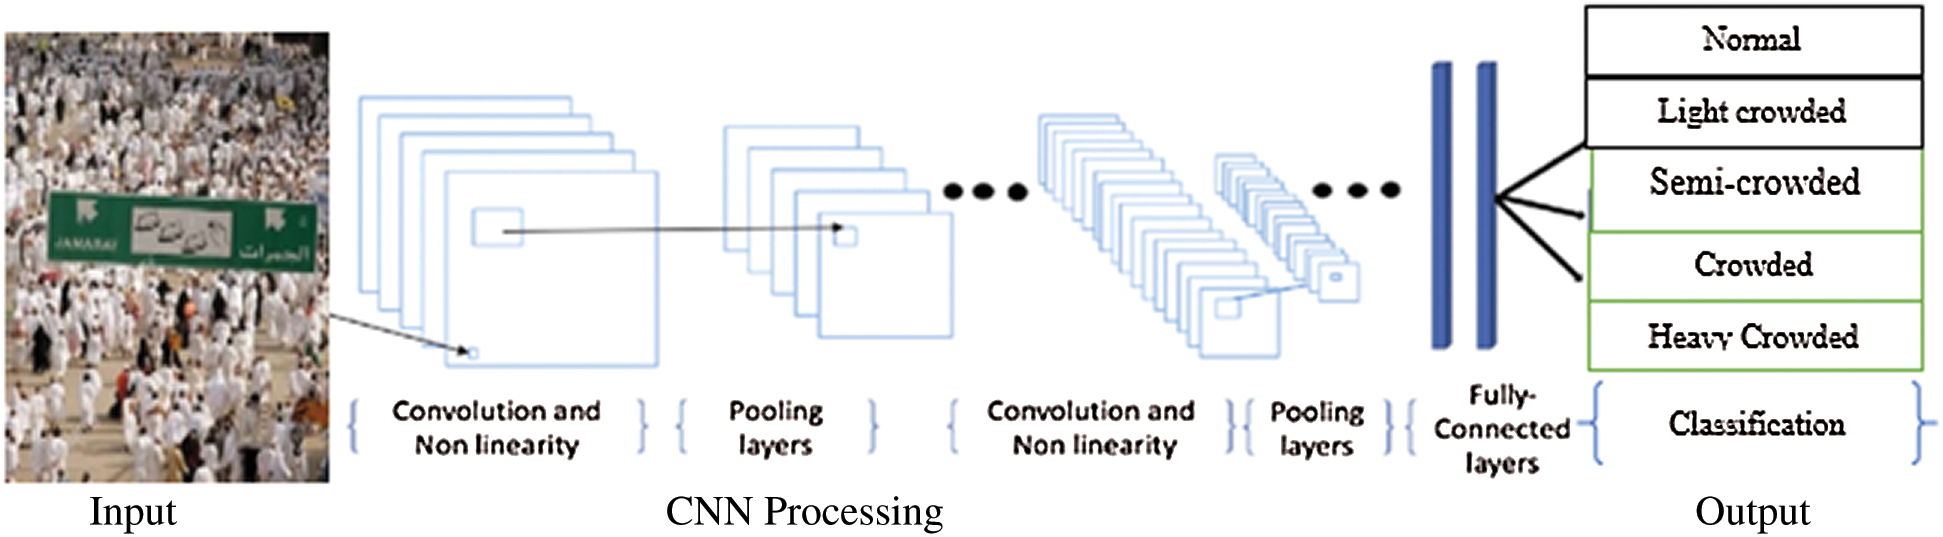
Figure 3: Different components of CNN algorithm Input CNN Processing Output
4 Dataset and Parameters Extraction
The classification process must be trained using an efficient dataset that contains a large number of images. It is not easy to get a proper dataset of moving crowds on the way to Jamrat. Due to overcrowding, there are insufficient cameras installed along the way, and existing cameras are not installed at right angles. Thus, the camera should be installed facing the crowd from above. To solve this problem, researchers extract appropriate images from videos that can be used in algorithm training. Crowd estimation is taking new directions, and the study focuses on analyzing group and crowd behavior, such as using video data from [13] multi-camera networks. Studies on such behavior are valuable for solving many fundamental problems, such as detecting moving objects in moving scenes, how humans can be tracked in a camera view, and accurately estimating human suffixes. How, and how to fuse information from multiple cameras for analysis of group and crowd behavior.
The sequence used for this work shows the crowds on the way to Jamrat during the 2018 Hajj days. “Free Video from JPG Converter” [14] software has been used to extract images. In order to maximize the number of training images in the dataset, work has been done to enhance the image, such as flipping, cropping and scaling. The images shown in Fig. 4 are used to construct the dataset. These images are manually divided into five categories according to the size of the crowd of each image. These images are then subdivided into training and testing data, along with other images.
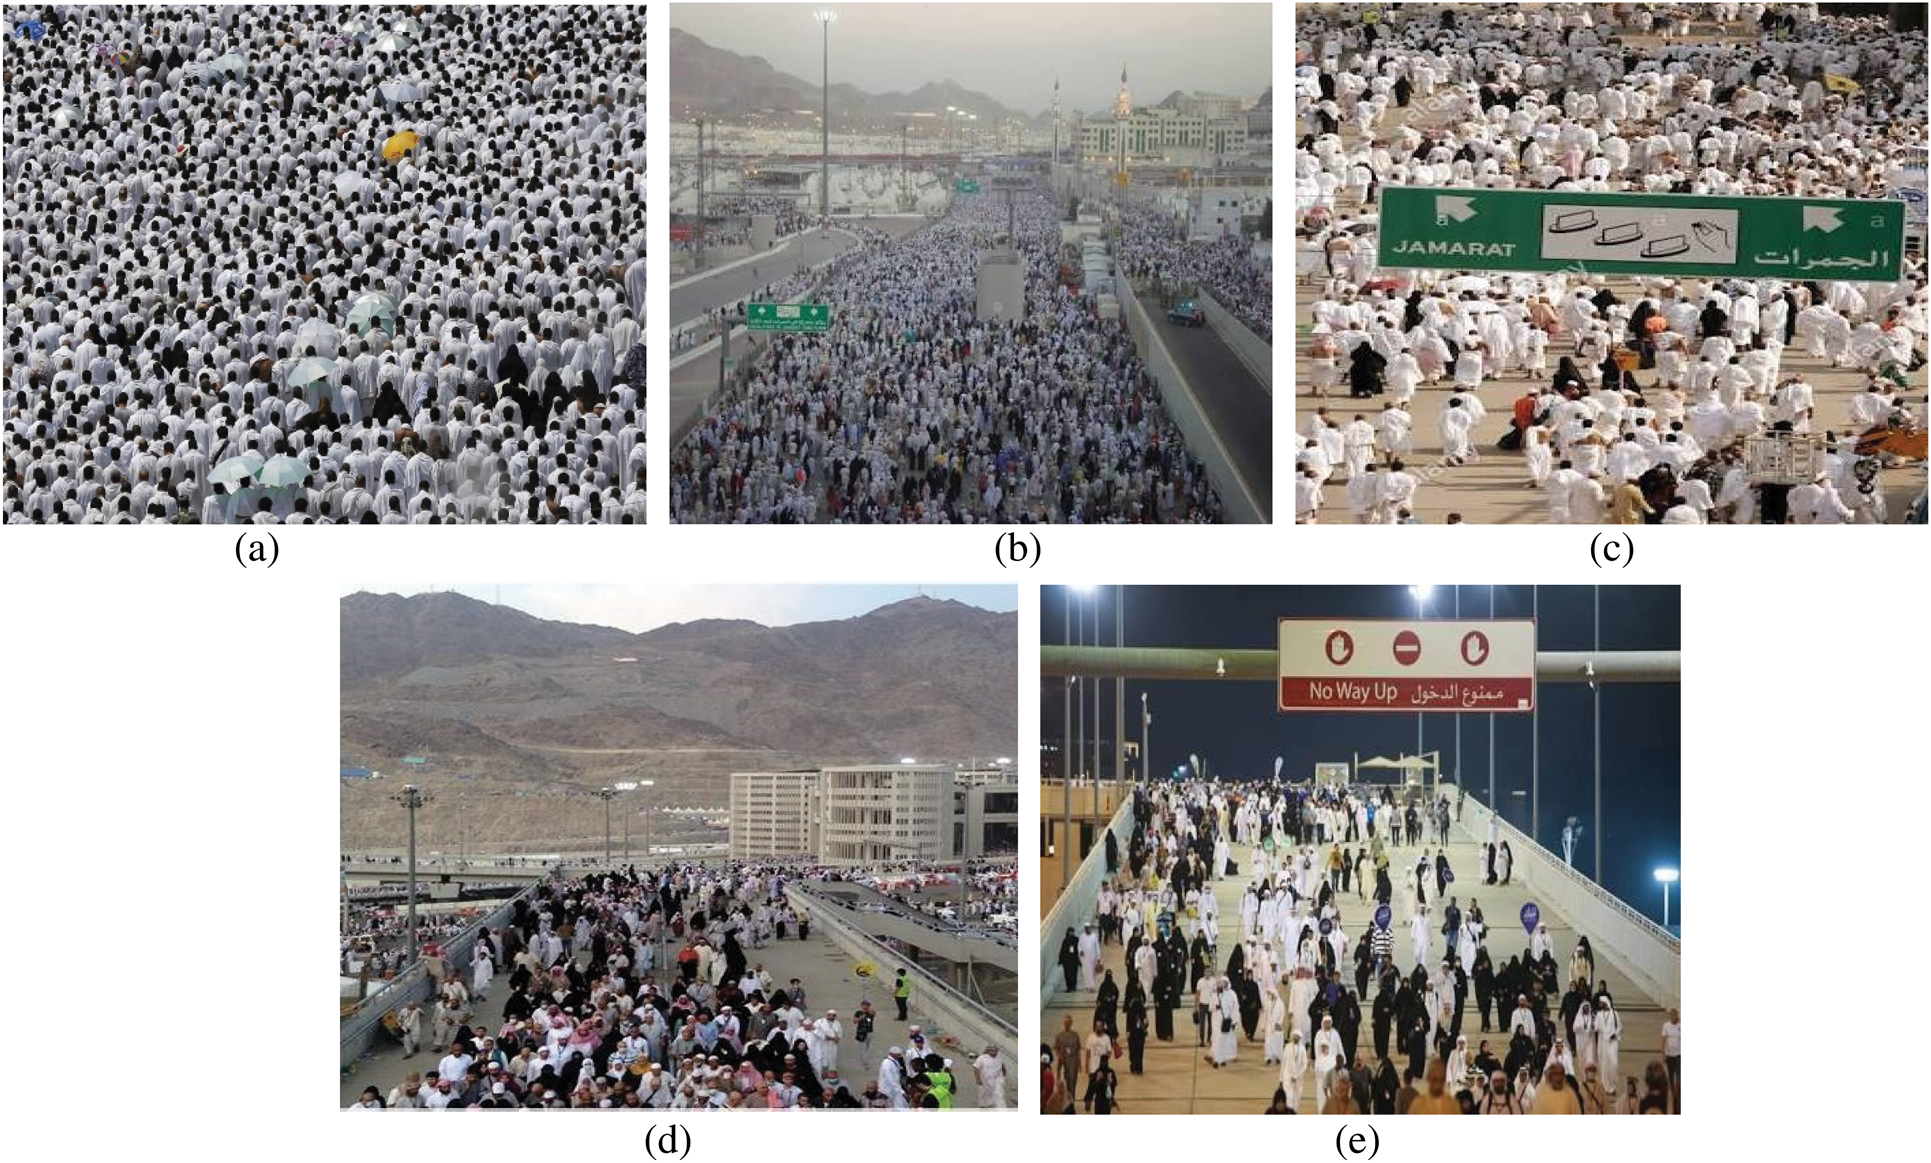
Figure 4: (a) Heavy Crowded (b) Crowded (c) Semi-Crowded (d) Light Crowd (e) Normal
For implementation, the neural network is initiated using sequential data, making the CNN as a sequential network. The Conv2D instruction is used for convolution operation, creating a 2D Convolution Layer, which ultimately creates a convolution KERNEL. Subsequent feature map values are calculated according to the following formula:
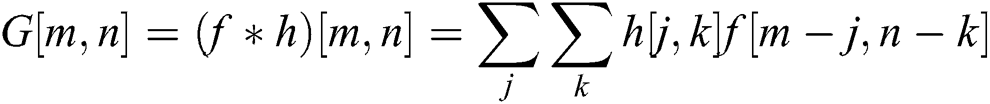
where f represents the input image and h the KERNEL. The indexes of rows and columns of the result matrix are m and n respectively. After placing our filter over the selected pixel, we take each value from KERNEL and multiply them in pairs with corresponding values form the image. In last, we sum up everything and put the result in the output feature map. The dimensions of the output matrix, keeping padding and stride into the account, can be calculated as:
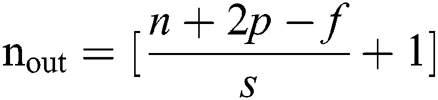
where p is padding, f is filter dimension and s is stride and n is image size. The KERNEL is netted with layers as inputs which help produce a tensor of outputs
For pooling operation, MaxPooling2D is used. Max-pooling is a sample-based discretization process. The objective is to down-sample an input representation as an image, hidden-layer output matrix, reducing its dimensionality and allowing for assumptions to be made about features contained in the sub-regions binned within. The data is then split into training data and testing data. Three hundred and twenty (320) images are used for training while 30 images are used for testing. The images for the training process of the CNN model are prepared before the classifier is initialized. After building the model, the first convolution layer is added which is initialized as an input layer to the fully connected network producing the output layer. To reduce the loss which is categorical cross-entropy, the Adom optimizer is used with a learning ratio set to 0.001. Finally, the data shows up to be well suited to the model by specifying the training data, the test data, and the parameters related to the number of steps in the training of the neural network as shown in Fig. 5.
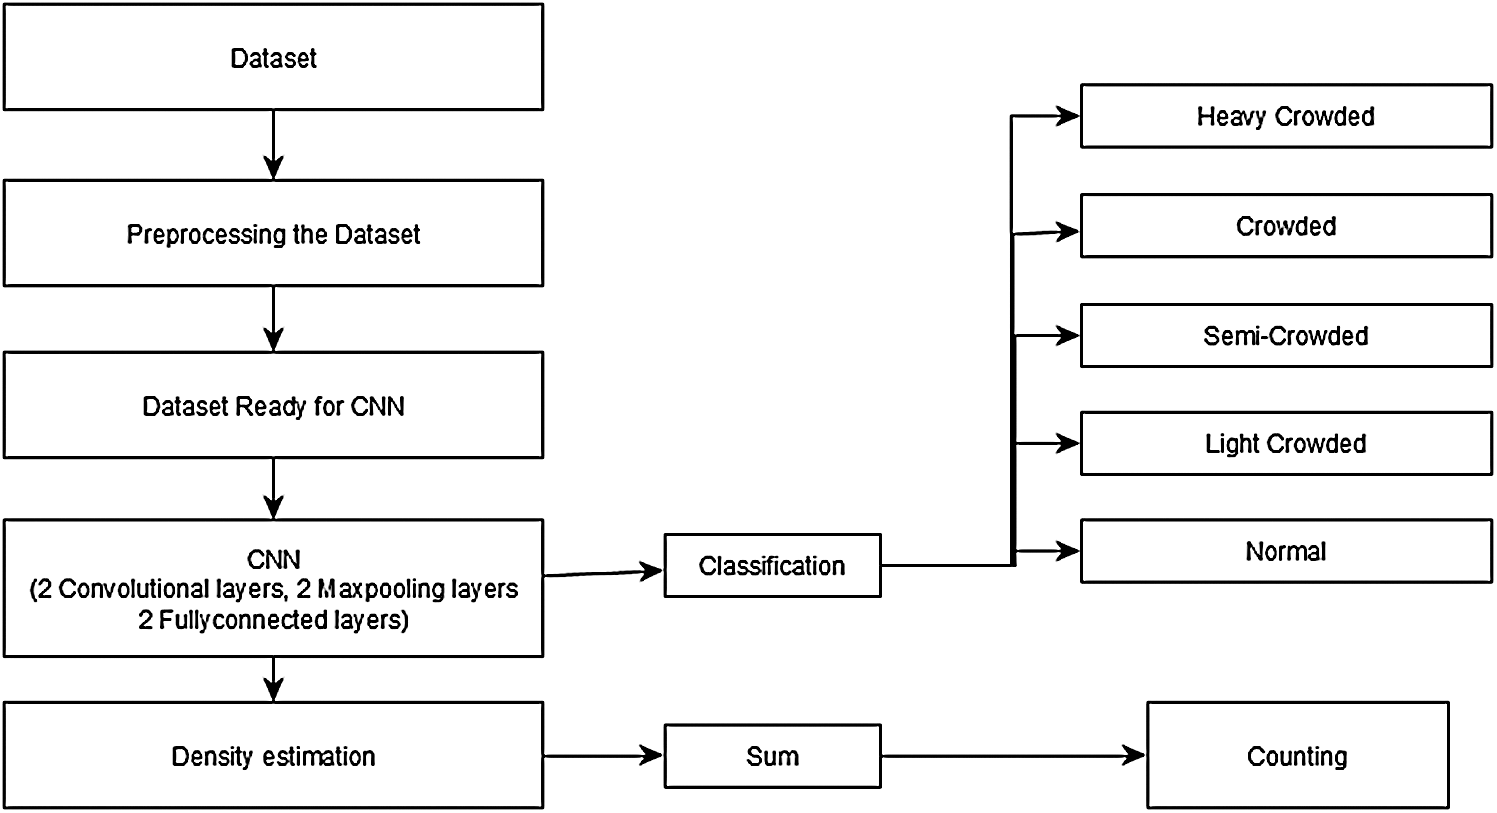
Figure 5: Implementation of CNN
For generating full-resolution density maps, we consider classic CNN regressor for pixel-wise density prediction. In other words, given an image patch, this process predicts the density at the center pixel. The full-resolution density map is obtained using a sliding window for density values for all pixels inside the region of interest. Although pixel-wise prediction does not explicitly model the relationship between neighboring pixels, it still results in smooth density maps—the pooling operation in the CNN introduces translation invariance, and thus neighboring patches have similar features. Thus, the pixel-wise predictions using CNNs will tend to be smooth and can better maintain the monotonicity, which will benefit localization tasks, such as detection and tracking. Besides, due to the capability of CNNs to learn feature representations, density maps predicted by CNNs are less noisy and well localized around the objects, as compared to methods using handcrafted features. The CNN-pixel is trained using the regression and classification tasks. The examples of our predicted density maps appear in Fig. 6. The CNN-based methods show their capability of handling these extremely crowded images. Note that although there are only a few training images, there are still many patches of people that can be extracted to train CNN from scratch by combining them with techniques recently reported for flow estimation [15–16] and counting of crowds [17–18]. Similar embedding of the features of recently reported research works [19–20] for future pursuits will help in categorizing crowd camera-images into what is featured with attributes of sizes and heights of individuals in addition to relational behaviors.
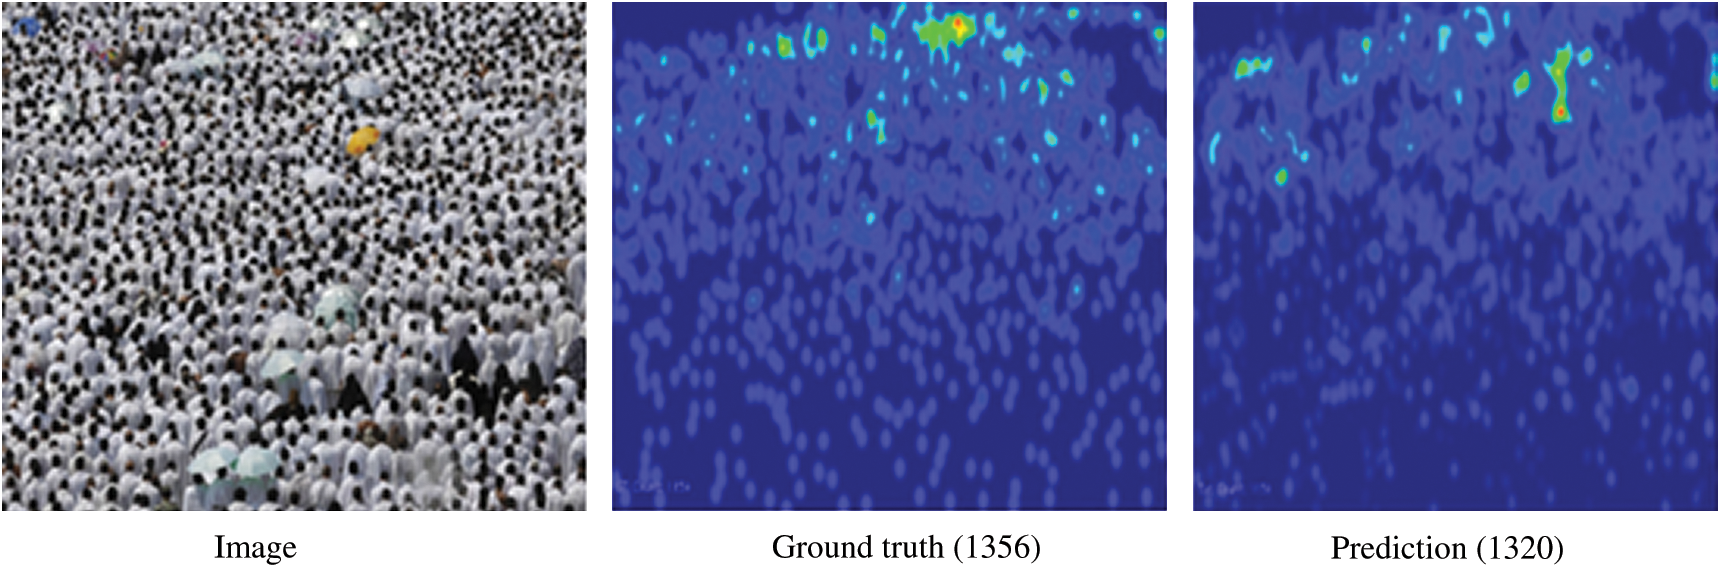
Figure 6: Example result using our CNN model. The number in parenthesis is the count
Upon the first attempt, after adding the first convolutional layer with 32 filters, the accuracy is very poor and standing at about 55%. Therefore, the algorithm is improved by adding a 2nd convolutional layer with 64 filters. The second attempt results in improvements with an accuracy of 97%. After using the dropout fraction as a 0.5 to prevent overfitting, the training and test accuracy of 98% is achieved, (Fig. 7), which is an acceptable training and testing accuracy.
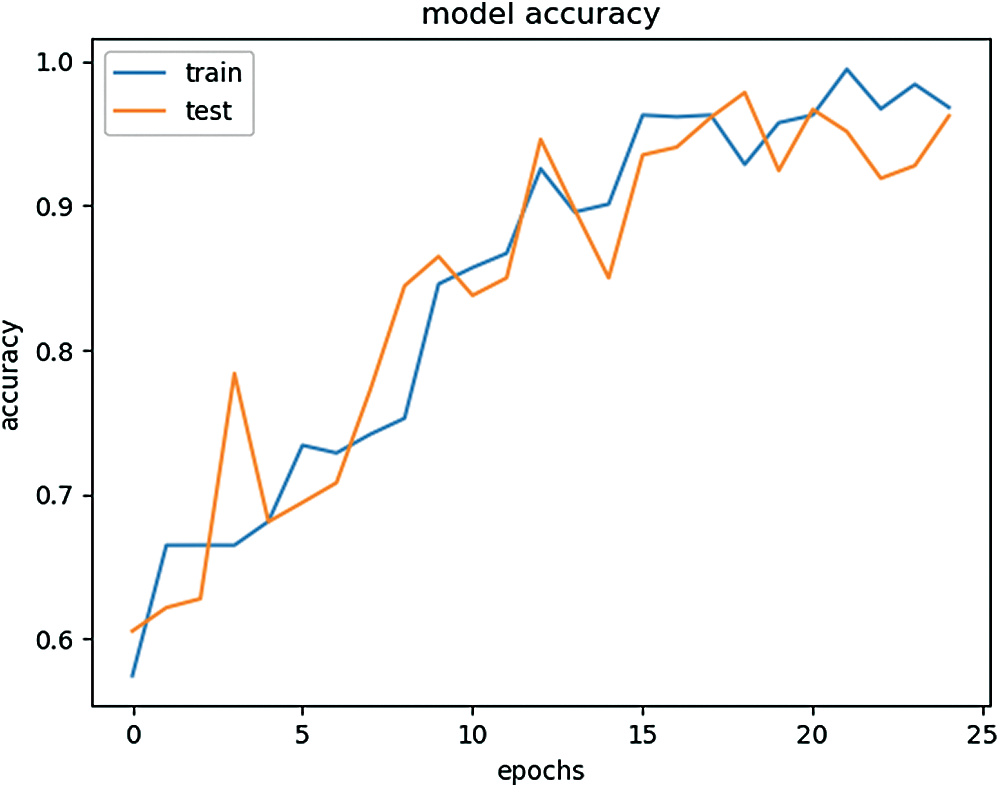
Figure 7: Model accuracy
Traffic congestion has been increasing on the highways in most parts of the world, particularly causing serious time delays within the inner parts of metropolitan cities. Its main expression is a progressive reduction in traffic speeds, resulting in increases in journey times, fuel consumption, other operating costs, and environmental pollution, as compared with uninterrupted traffic flow. Congestion is mainly due to the intensive use of automobiles. The proposed model can also be used for traffic management on highways or other busy roads and ensure uninterrupted traffic flow. This model indicates the traffic congestion on highways and classifies it into five situations, referred to as heavy-crowded, crowded, semi-crowded, light crowded, and normal as shown in Fig. 8. After classification, instruction is sent to authorities to manage the traffic and restore the steady traffic flow.
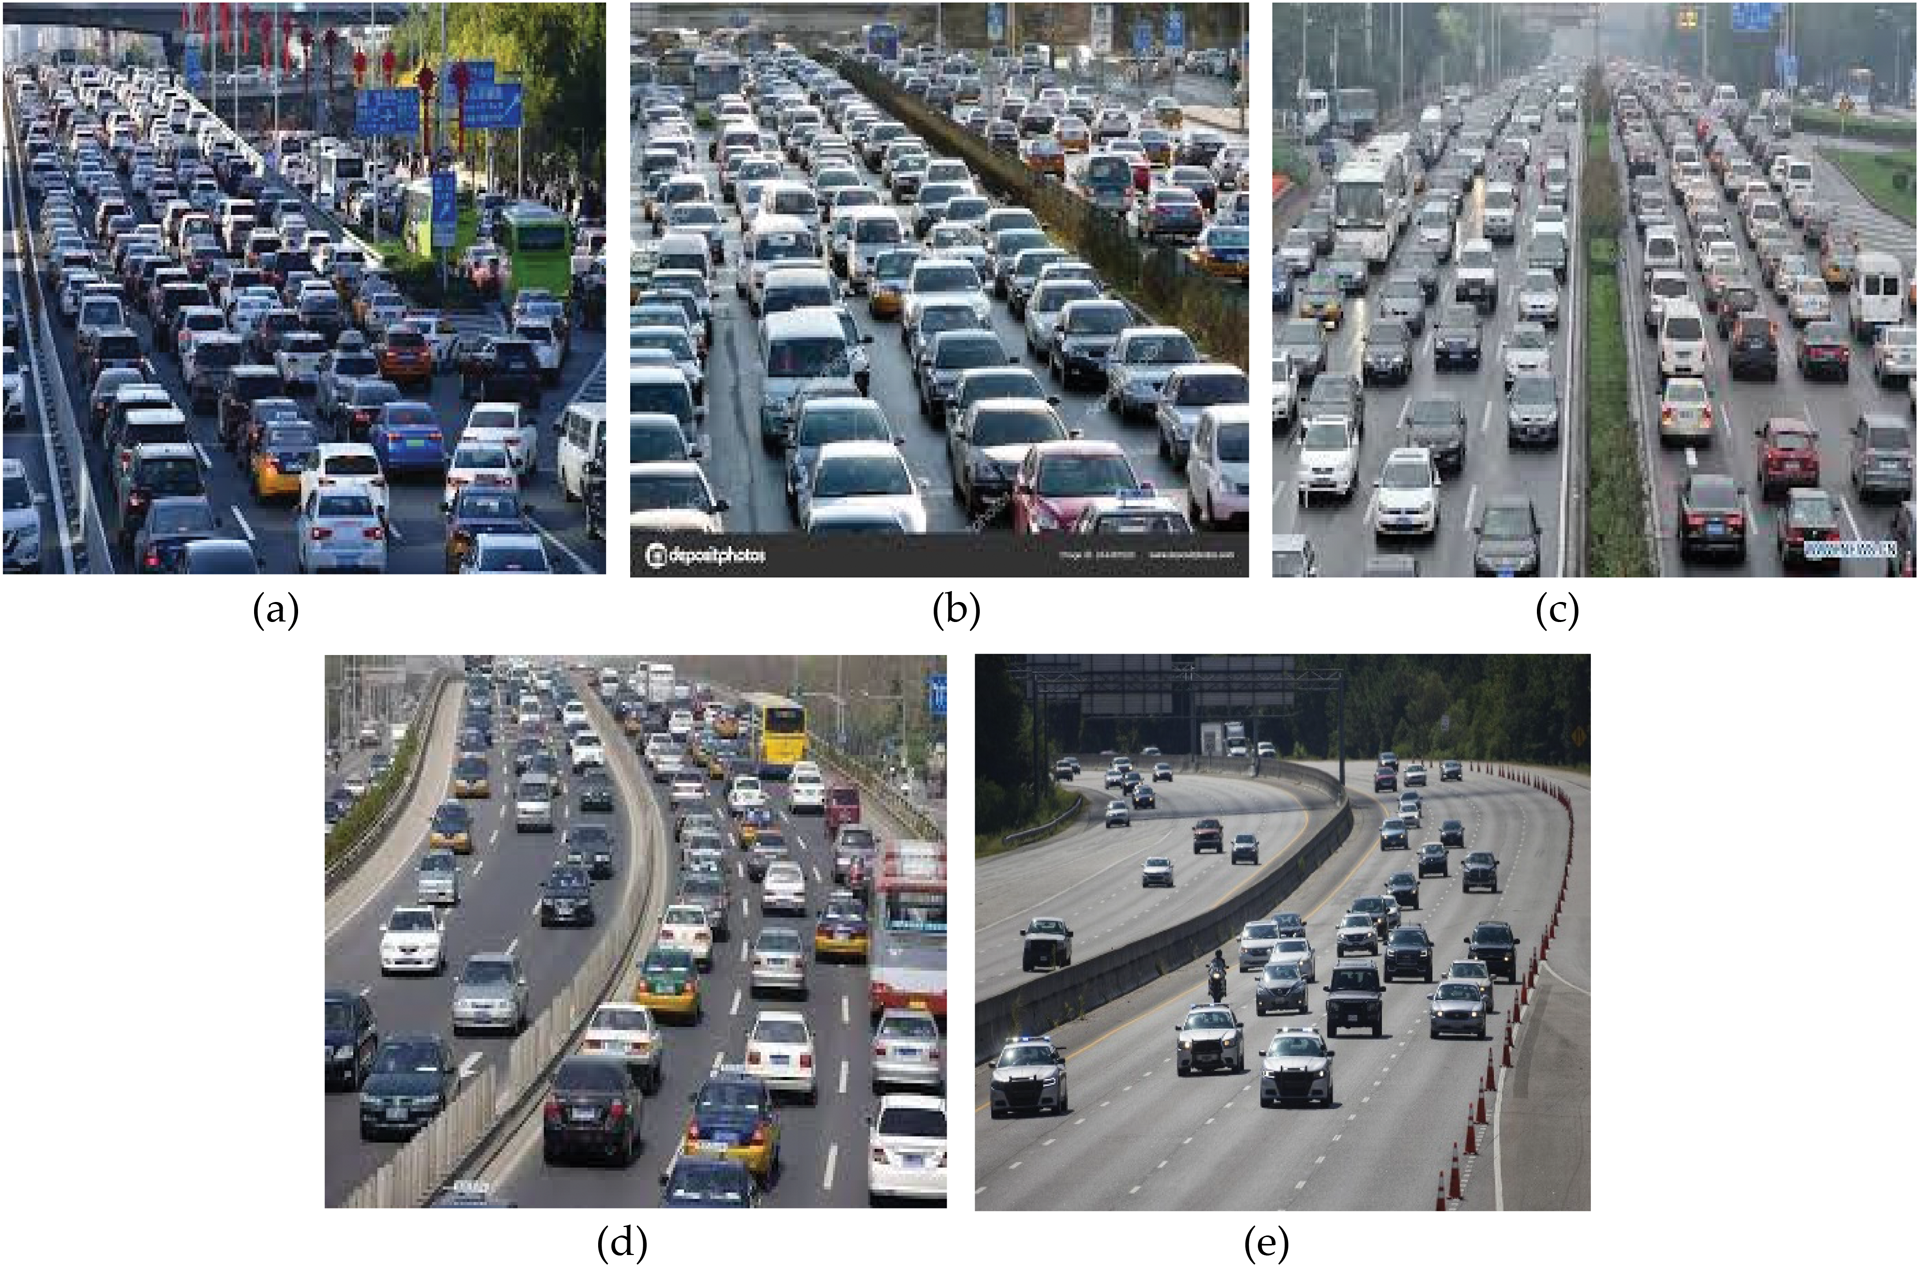
Figure 8: (a) Heavy Crowded (b) Crowded (c) Semi-Crowded (d) Light Crowd (e) Normal
To analyze the pilgrims’ behavior towards our model, a multi-agent-based simulation has been developed to simulate the crowd along the Jamarat hitting path. To simulate pedestrian behavior, the Anylogic Simulation platform [12] has been used. It is a multi-method simulation platform that supports agent-based, general-purpose simulation, featuring system dynamics and process-centric modeling. The modeling language is highly flexible, enabling the capturing of systems’ complexity and heterogeneity to any desired level of detail. The AnyLogic Simulation contains the Pedestrian Library, which simulates pedestrian flows in a physical environment, providing the ability to collect statistics on pedestrian density in different areas. When this library is used in a simulation, the pedestrians are simulated as interacting agents with complex behavior, moving in continuous space, and reacting to obstacles and other neighboring pedestrians.
The proposed model uses cameras and image classification to determine the state of the crowd. However, this part could not be added to the simulation; instead, a counting process was incorporated from the AnyLogic platform. The number of pilgrims in each area was then counted to determine the state of the crowd.
Pilgrims are simulated as human agents, each agent has several parameters such as position, speed, size, and time required for throwing stones.
The flow rate of people is the number of people passing through a particular area per unit time. To analyze the flow of people, Fruin [21] has developed a level of service standard. Fruin defines six levels of pedestrian flow rates, ranging from level A to level F, with the corresponding density, space, flow rate, and speed values, as listed in Tab. 1.
Table 1: Fruins’ [21] six levels of pedestrian density, space, speed and flow rates
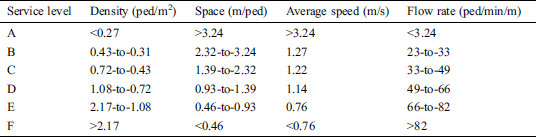
Based on these flow rates, the state of the flow can be divided into five cases:
• Free flow (A and B), where pedestrians walk with comfortable speed.
• Light crowd (C), where the pedestrians walk with less comfortable speed.
• Constant flow (D), where the pedestrian cannot walk freely, although the flow is not that crowded.
• Crowded flow (E), here the pedestrian walks very slowly as there is not enough space for a walk.
• Heavy Crowded (Stampede state) (F), where pedestrians may lose their balance and fall, perhaps getting injured.
The change in the flow state depends on the difference between the flow rate of pedestrians entering the path (Pin) and the flow rate of pedestrians leaving the path. Fig. 9 shows the change in the flow state when pedestrians enter or leave.
The simulation is performed for a specific area of the path, consisting of the Jamarat pillars, the area before, and the area after. The same concept can be applied to the whole path, and congestion in the said area is the main reason for congestion in other areas. That is, if we succeed in preventing congestion in this area, congestion will not occur in other areas. Agents are used that trigger event to assess the crowd state, and the technique is implemented using Java to code the events as shown in Fig. 10. Based on the results, the state of the crowd in this area can be determined by comparing the results to predefined values for deciding on the state to be declared as heavily crowded, crowded, and semi-crowded, light crowded, and normal.
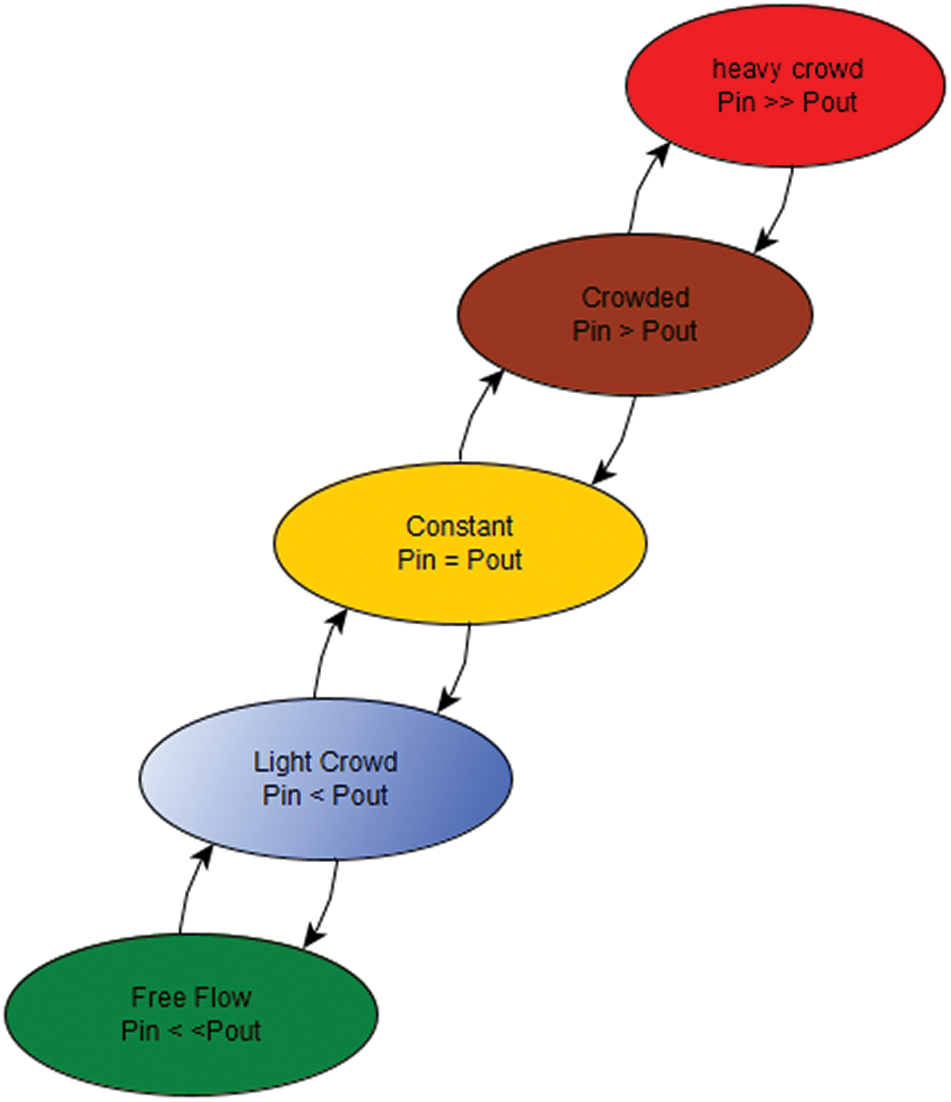
Figure 9: Change in the flow state when pedestrian enter or leaving
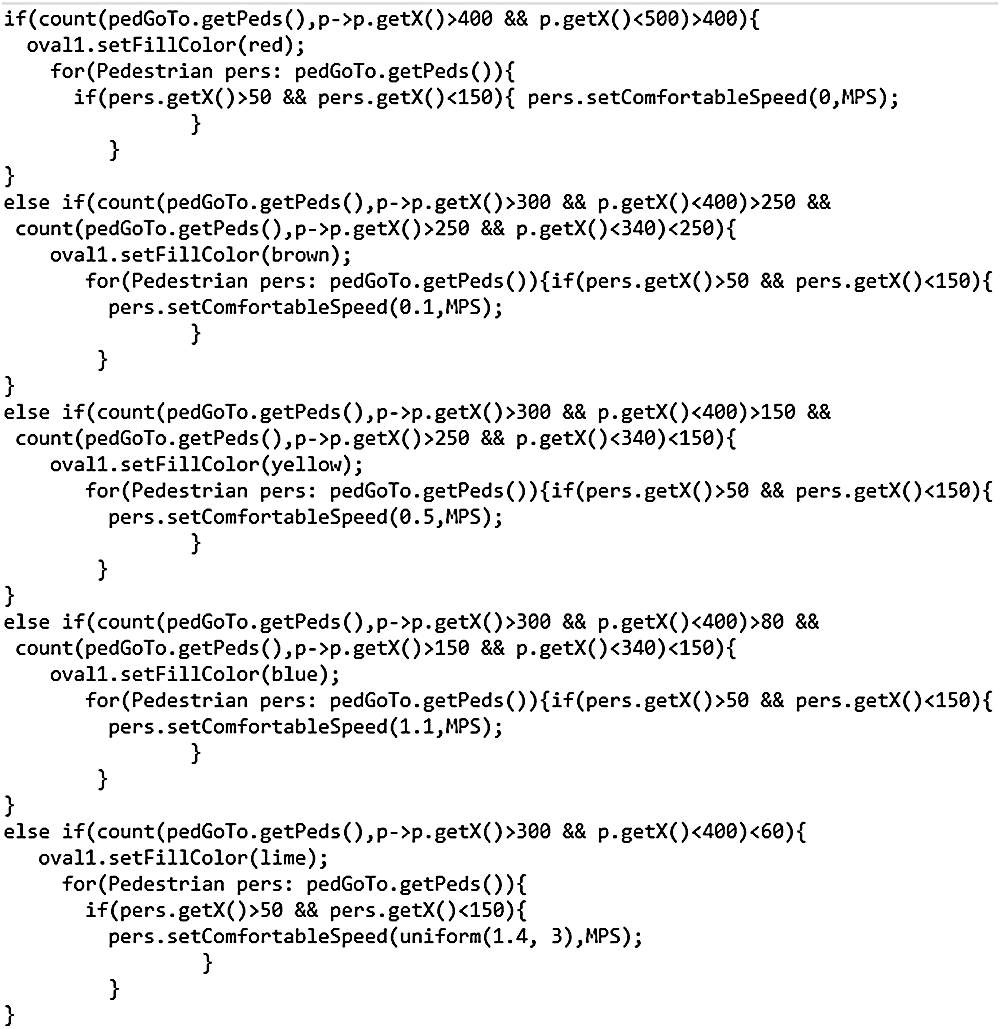
Figure 10: The Java code that monitor and control the pilgrim’s movement
In preparing the simulation environment, the path and the pillars have been defined in the AnyLogic Simulation platform by creating different variables to monitor the crowd at various locations.
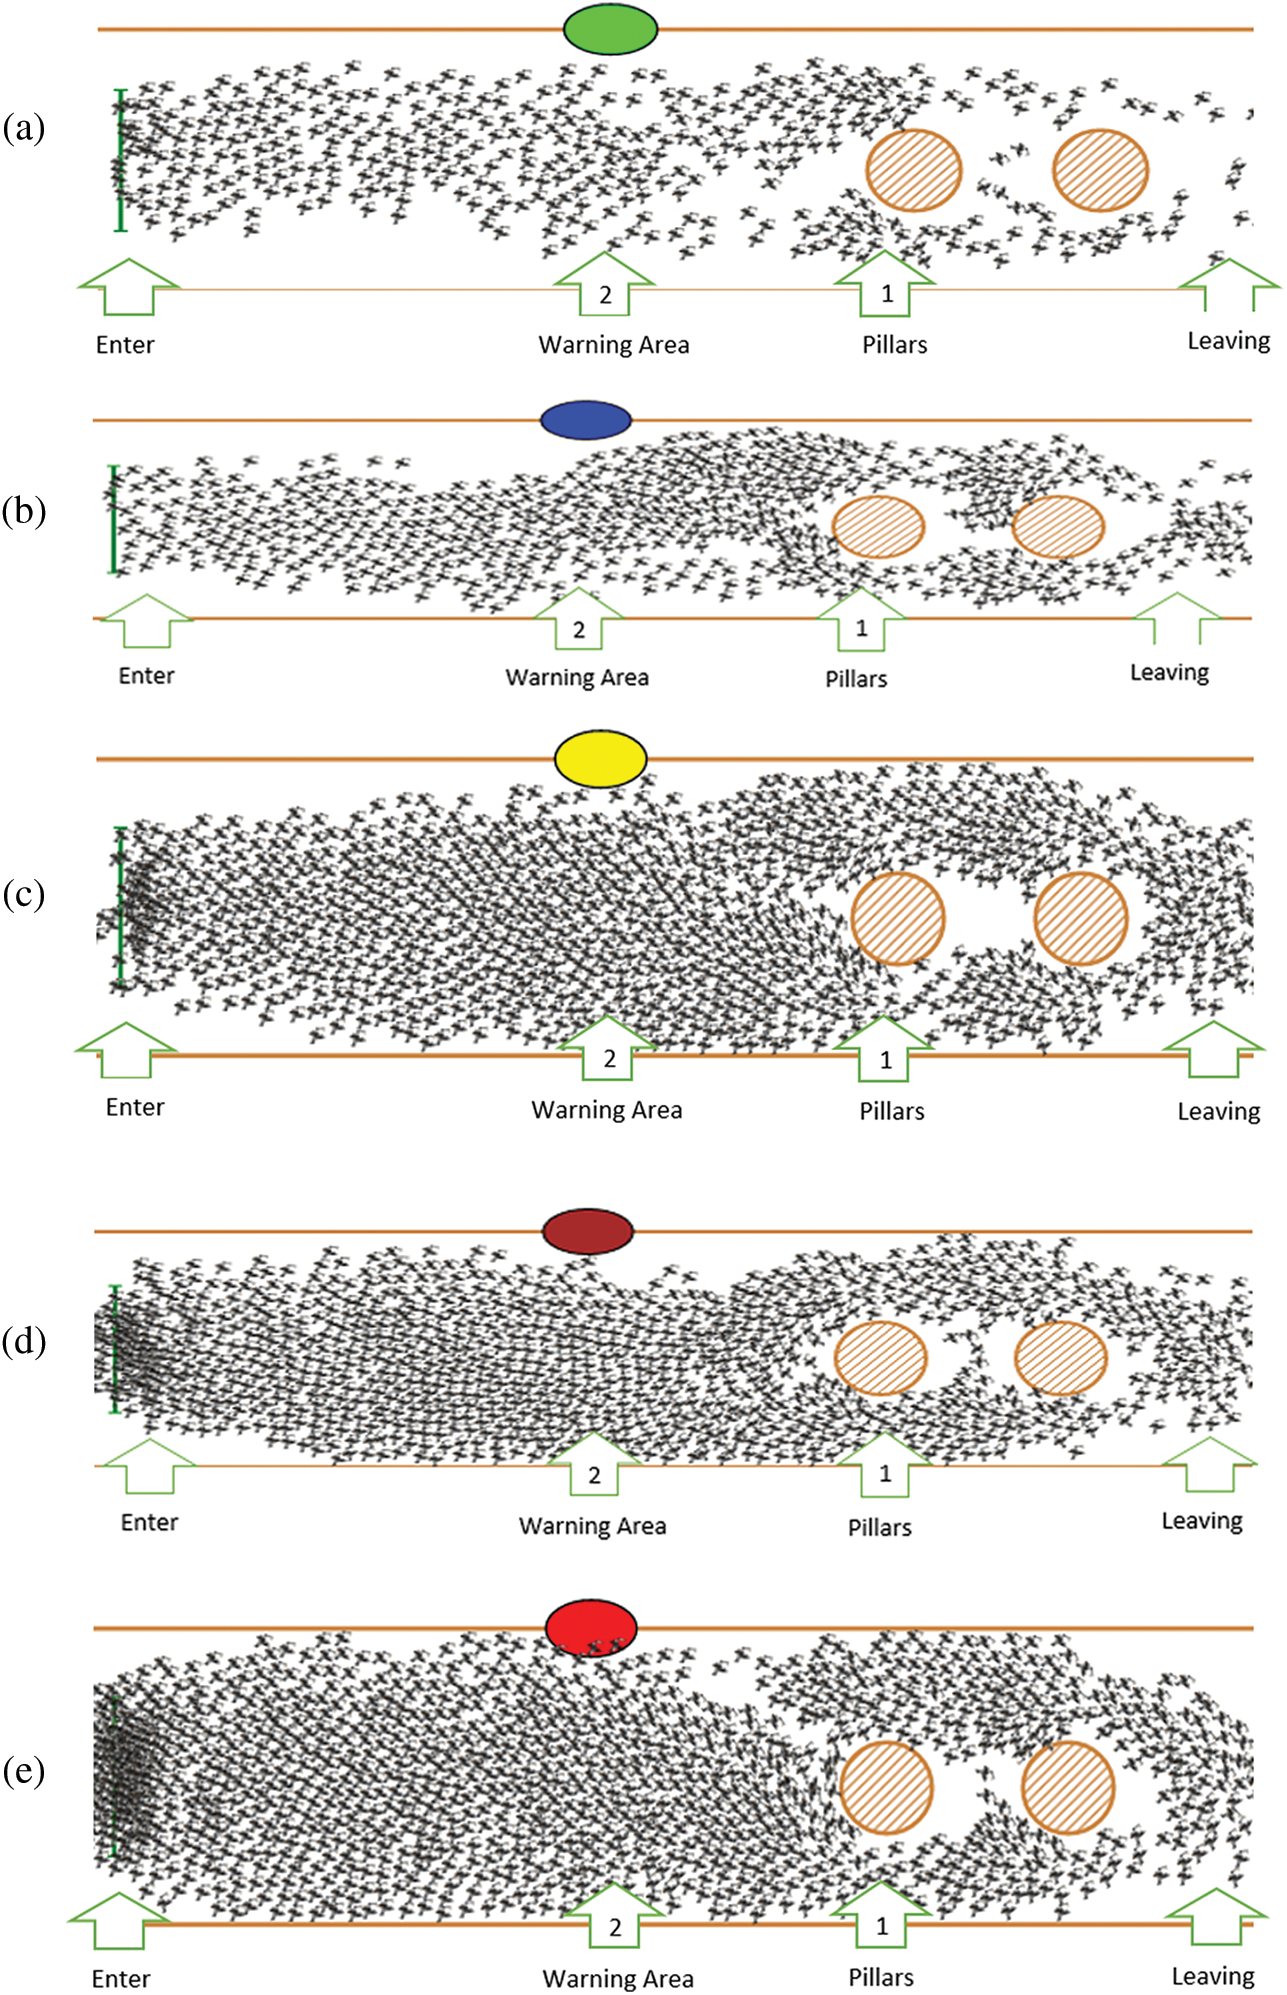
Figure 11: Simulation results of the five scenarios (a) Stage-1 (b) Stage-2 (c) Stage-3 (d) Stage-4 (e) Stage-5
The stages of the crowd are as shown in Fig. 11. In Stage-1, the flow has been normal until the pilgrims have reached the Jamarat pillars (Location 1). This, in turn, switches the green light on in Location 2, indicating the normal upcoming flow. Then the number of pilgrims starts to increase as it gets closer to a light crowd, that is, Stage 2. As a result, the warning light at Location 2 is activated with a blue color, directing the pilgrims to slow down their speed. This allows time for moving onward to the pilgrims at Location 1. Thus, preventing an increase in the number of pilgrims at Location 1 and enhancing the management of crowd congestion.
In Stage 3, another scenario occurred whereby the number of pilgrims reaches the congestion state. At that moment, the warning light is activated with Yellow color at Location 2, which directs pilgrims to slow down allowing ample time to the pilgrims at Location 1, which prevented an increase in the number of pilgrims. At stage 4, when the number of pilgrims reached the congestion. At that time, the warning light was activated with Brown color at location 2. At stage 5, Red color activated at location 2 when the congestion reached to danger level and walking become difficult at location 1. At that moment, pilgrims are directed to stop walking. This led to a congestion-free situation, preventing severe congestion.
11 Conclusion and Future Scope
This study has provided a framework for solving the problem of estimating the level of congestion in order to avoid accidents happening due to that congestion. This can be applied to monitoring schemes used during Hajj, especially in crowd management on the way to Jamrat. After exceeding the default crowd limit, the model works by activating the alarm almost instantly, which reduces the chances of the crowd reaching dangerous levels and minimizes potential damage as a result. Using a typical traffic light system, a RED light appears when the rate of visitors to a particular area exceeds the rate at which other pilgrims leave, signaling takes place for stopping migration to that area. When the flow rate of pilgrims entering becomes the same as the flow rate of pilgrims leaving the area, the light turns YELLOW suggesting a slower pace. The GREEN light indicates that the crowd level in the area is low and the movement can move freely in the area. The proposed CNN Architecture, based on the sliding window mechanism, allows us to deal with both high and low resolution images. The proposed model benefits from the simplicity, familiarity, and user-friendliness of the traffic light system, making it easier for the pilgrims to follow instructions. Experiments with available datasets have produced good initial results using the technique of the suggested CNN algorithm after the second convolutional layer with 64 filters. However, the performance and efficiency of this model can be improved by using drone cameras and supercomputers for algorithm processing. The future work is in fact a continuity of the technique [5] to detect group behavior also potentially allows the group to be categorized according to age, gender, and speed, which is directed at varying groups’ behavior. Screens can also be used in conjunction with the aforementioned traffic light signals to display instructions in different languages.
Acknowledgement: Authors acknowledge the proofreading support by Khan, Saman S. freelance Proofreader of Malaysia and Wahab Adetunji, Lawal of UK in this work.
Conflict of Interest: The authors declare that they have no conflicts of interest to report regarding the present study.
Funding Statement: The authors extend their appreciation to the Deputyship for Research & Innovation, Ministry of Education in Saudi Arabia for funding this research work through the project number QURDO001 titled “Intelligent Real-time Crowd Monitoring System Using Unmanned Aerial Vehicle (UAV) Video and Global Positioning Systems (GPS) Data”.
1. W. M. Shalash, A. Al-Hazimi and B. Al-Zahrani1. (2017). “A mobile based crowd management system,” International Journal of Advanced Research in Computer and Communication Engineering, vol. 6, no. 6, pp. 205–215. [Google Scholar]
2. L. Al-Salhie, M. Al-Zuhair and A. Al-Wabil. (2014). “Multimedia surveillance in event detection: Crowd analytics in Hajj, Design, User Experience, and Usability,” in User Experience Design for Diverse Interaction Platforms and Environments. Cham: Springer, pp. 383–392. [Google Scholar]
3. A. Alazbah and B. Zafar. (2019). “Pilgrimage (hajj) crowd management using agent-based method,” International Journal on Foundations of Computer Science & Technology, vol. 9, no. 1. [Google Scholar]
4. J. Favreau, F. Lafarge, A. Bousseau and A. Auvolat. (2020). “Extracting geometric structures in images with delaunay point processes,” IEEE Transactions on Pattern Analysis and Machine Intelligence, vol. 42, no. 4, pp. 837–850. [Google Scholar]
5. Q. Wang, M. Chen, F. Nie and X. Li. (2020). “Detecting coherent groups in crowd scenes by multiview clustering,” IEEE Transactions on Pattern Analysis and Machine Intelligence, vol. 42, no. 1, pp. 46–58. [Google Scholar]
6. A. Punnappurath and M. S. Brown. (2020). “Learning raw image Reconstruction-Aware deep image compressors,” IEEE Transactions on Pattern Analysis and Machine Intelligence, vol. 42, no. 4, pp. 1013–1019. [Google Scholar]
7. N. Ofir, M. Galun, S. Alpert, A. Brandt, B. Nadler et al. (2020). , “On Detection of faint edges in noisy images,” IEEE Transactions on Pattern Analysis and Machine Intelligence, vol. 42, no. 4, pp. 894–908. [Google Scholar]
8. P. Tang, C. Wang, X. Wang, W. Liu, W. Zeng et al. (2020). , “Object detection in videos by high quality object linking,” IEEE Transactions on Pattern Analysis and Machine Intelligence, vol. 42, no. 5, pp. 1272–1278. [Google Scholar]
9. D. Novotny, D. Larlus and A. Vedaldi. (2020). “Capturing the geometry of object categories from video supervision,” IEEE Transactions on Pattern Analysis and Machine Intelligence, vol. 42, no. 2, pp. 261–275. [Google Scholar]
10. T. Alam and M. Aljohani. (2020). “Decision support system for Real-Time people counting in a crowded environment,” International Journal of Electronics and Information Engineering, vol. 12, no. 1, pp. 34–41. [Google Scholar]
11. I. Khan and R. McLeod. (2012). “Managing Hajj crowd complexity: Superior throughput satisfaction, health, & safety,” Arabian Journal of Business and Management Review, vol. 2, no. 4, pp. 1–15. [Google Scholar]
12. AnyLogic, “AnyLogic: Simulation modeling software tools & solutions for business,” 2020. [Online]. Available: https://www.anylogic.com/. [Google Scholar]
13. H. Yao, A. Cavallaro, T. Bouwmans and Z. Zhang. (2017). “Guest editorial introduction to the special issue on group and crowd behavior analysis for intelligent Multi camera video surveillance,” IEEE Transactions on Circuits and Systems for Video Technology, vol. 27, no. 3, pp. 405–408. [Google Scholar]
14. V. A. Sindagi and V. M. Patel. (2018). “A survey of recent advances in CNN-based single image crowd counting and density estimation,” Pattern Recognition Letters, vol. 1, no. 7, pp. 3–16. [Google Scholar]
15. W. Wang, P. Liu, R. Ying, J. Wang, J. Qian et al. (2019). , “A High-Computational efficiency human detection and flow estimation method based on TOF measurements,” MDPI: Sensors, vol. 19, no. 3, pp. 729. [Google Scholar]
16. D. Kang, Z. Ma and A. B. Chan. (2019). “Beyond counting: Comparisons of density maps for crowd analysis tasks—Counting, detection, and tracking,” IEEE Transactions on Circuits and Systems for Video Technology, vol. 29, no. 5, pp. 1408–1422. [Google Scholar]
17. A. B. Chan and N. Vasconcelos. (2011). “Counting people with low-level features and Bayesian regression,” IEEE Transactions on Image Processing, vol. 21, no. 4, pp. 2160–2177. [Google Scholar]
18. Z. Lin and L. S. Davis. (2010). “Shape-based human detection and segmentation via hierarchical part-template matching,” IEEE Transactions on Pattern Analysis and Machine Intelligence, vol. 32, no. 4, pp. 604–618. [Google Scholar]
19. Y. Zhang, D. Zhou, S. Chen, S. Gao and M. Yi. (2016). “Single-image crowd counting via multi-column convolutional neural network,” in Proc. of the IEEE Conf. on Computer Vision and Pattern Recognition, pp. 589–597. [Google Scholar]
20. T. Ahmad, Y. Ma, M. Yahya, B. Ahmad, S. Nazir et al. (2020). , “Object detection through modified YOLO neural network,” Scientific Programming, vol. 2020, no. 10, pp. 1–10. [Google Scholar]
21. J. Fruin. (1971). Pedestrians, 1st ed. Washington, D.C: Highway Research Board. [Google Scholar]
 | This work is licensed under a Creative Commons Attribution 4.0 International License, which permits unrestricted use, distribution, and reproduction in any medium, provided the original work is properly cited. |