DOI:10.32604/cmc.2021.012213
| Computers, Materials & Continua DOI:10.32604/cmc.2021.012213 | |
| Article |
A Novel Collective User Web Behavior Simulation Method
1College of Computer Science & Technology, Harbin Institute of Technology at Weihai, Weihai, 264209, China
2Cyberspace Security Research Center, Peng Cheng Laboratory, Shenzhen, 518000, China
3Research Institute of Cyberspace Security, Harbin Institute of Technology, Harbin, 150001, China
*Corresponding Author: Bailing Wang. Email: wbl@hit.edu.cn
Received: 20 June 2020; Accepted: 17 July 2020
Abstract: A collective user web behavior simulation is an import means for generating a large-scale user network behavior in a network testbed or cyber range. Existing studies almost focus on individual web behavior analysis and prediction, which cannot simulate human dynamics that widely exist in large-scale users’ behaviors. To address these issues, we propose a novel collective user web behavior simulation method, in which an algorithm for constructing a connected virtual social network is proposed, and then a collective user web behavior simulation algorithm is designed on the virtual social network. In the simulation method, a new epidemic information dissemination algorithm based on the SIR model is proposed to drive the user web behavior with Breadth—First Search algorithm on the connected virtual social network. We specially build an experiment environment with 12 servers by using Docker container technology and then perform a wide range of experiments with different user scales to evaluate the method. The experimental results demonstrate that not only the degrees of the social network but also the time intervals of the collective users’ web behavior can be well fitted to a power-law distribution and show that our simulation method can well simulate a collective user web behavior.
Keywords: Web behavior simulation; virtual social network; human dynamics; power-law distribution
Facing an increasingly severe network security issues in the Internet, researchers and organizations have constructed all kinds of large-scale of network testbeds to simulate the Internet and then conduct experiments for analyzing these issues, such as Emulab Network Testbed, NCR (National Cyber Range) [1] and StarBED [2]. In large-scale network testbeds or cyber ranges, virtualization technologies are widely employed to simulate the hardware and network, which constitute the infrastructure of the network testbed. Meanwhile, the user network behavior on network testbed is generated by simulating the user behavior on the Internet [3,4]. In recently years, for predicting or simulating individual behaviors on some applications, many user network behavior models and simulation methods have been proposed [5–11] and achieved promised results. However, these methods cannot be directly applied in collective user network behavior simulation because of the lack of interactions among individuals and other issues.
Based on human dynamics, many researchers have devoted the studies on behavior analysis [12–15] and have achieved fruitful results. However, a collective user network behavior simulation is rarely touched in current studies for the challenges in the scale and the method of simulation in a network testbed. Our interest arises out of the question of how to perform a collective user network behavior simulation that follows human dynamics in a real network environment. In the simulation, the key is how to drive the collective user to perform one kind of network behavior while following the laws of human dynamics.
In this paper, we study a collective user web behavior simulation method. In detail, we first construct a virtual social network in which each virtual node is modeled as an agent and the degrees of the agents follow a power-law distribution, a form of heavy-tailed distribution. Then, we simulate the information dissemination process among the agents based on an epidemic information dissemination model, in which all agents reply a message to a specific post in the forum after infected and then infects its neighbors. We finally validate that the time intervals between two consecutive replies follow a power-law distribution, which agrees with the laws of human dynamics. The experimental results demonstrate that our method is capable of simulating the collective user web behavior realistically.
The goal of our work is to study the method of simulating a collective user network behavior in a large network testbed or cyber range, instead of studying the mechanism of the heavy-tailed phenomenon in the real social network such as Twitter and Facebook. To the best of our knowledge, this work is the first study on the method of simulating a collective user network behavior in a real network environment.
In summary, the main contributions of our work are listed as follows:
1. We design a virtual social network construction method, which improves the PLOD (power-law out degree) [16] algorithm with the BA (Barabási–Albert) model [17,18] and has the ability to quickly establish a connected virtual social network whose degree distribution follows a power-law distribution.
2. An information dissemination algorithm, the key of the simulation method, is proposed to drive the individual user’s network behavior. We give the calculation method of the length of waiting time and define the process of the epidemic information dissemination in the algorithm.
3. We design a real network environment to evaluate the performance of the simulation method on the Docker container swarm. As an agent, each Docker container posts a reply to the specific post of the same forum by running our proposed algorithms in the connected social network. We validate that the time intervals of consecutive replies follow a power-law distribution.
The rest of the paper is organized as follows: Section 2 reviews related work, Section 3 introduces the approach, Section 4 presents our experiments and the result, and Section 5 discusses and concludes the paper.
A collective user behavior simulation plays an essential role in multiple internet applications. Many researchers have focused on the prediction and simulation of individual network behavior.
2.1 User Network Behavior Modeling and Predicting
Kaderka et al. [19] build a tool named BeCos, which not only allows users to specify system and component behavior but also enables system engineers to clearly define behavior in a semantically rigorous manner with behavior ontology and scenario ontology. Yang et al. [20] analyzed the influence of multiple factors on email reply behavior and developed a model to predict whether a receiver will reply to the sender. Moreover, they characterized the influence of rich factors on email reply behavior. Incorporating structure, usage, and content data from a real website, Loyola et al. [8] proposed a new method to analyze web user behavior by using an Ant Colony Optimization algorithm, which can explain approximately 80% of real usage with a predefined similarity measure. Si et al. [21] studied the users’ post and reply behaviors in Tianya, an internet forum, and found that users’ posts, replies, in-degrees and out-degrees of replied message distribution all follow a power-law distribution, which is consistent with the achievements of other researchers.
In terms of the analysis approaches, Rajabi et al. [9] defined user behavior categories using an unsupervised learning algorithm and then proposed a data-driven approach to analyze user behavior. Liu et al. [10] presented a new user behavior modeling method on the user’s clicking behavior of search engines, in which a convolutional neural network (CNN) architecture is constructed to build click models, and the parameters from traditional click models are used to restrict the meaning in the hidden layer of the CNN. This model is considered as the best with respect to the evaluation metric of click perplexity. Park et al. [7] analyzed the behavior of image search on a large-scale query log from Yahoo Image Search, which assumed that a user’s behavior is dependent on the query type. Aiming at revealing high-level patterns in the behavior of game players, Sifa et al. [22] performed four experiments on a 6 million player dataset covering a total playtime of over 5 billion hours across more than 3000 games distributed via the Steam platform, which provided unique insights into the behavior of the game player. Xiao et al. [23] studied human behavior in Sina Microblog of China and found that not only on the individual level but also on the group level, the message releasing time intervals obey power-law distribution.
2.2 User Network Behavior Simulation
Agent-based models (ABM) [24,25] are computational models that simulate the actions and interactions of autonomous agents (individual or collective entities) to assess their effects within an environment. In company with the increase of computing power, ABM based user behavior simulation techniques (e.g., BDI) have been widely used in social simulation [26–29], e.g., Kampmann et al. [29] proposed an automatic parameter identification approach for personality driving behavior models by comparing the behavior data of human and artificial drivers in the same virtual environment. This method can also be applied to compare human and artificial driving behavior. Also, Flamino et al. [30] concluded that human patterns of temporal preference are consistent and resilient by analyzing users of several real-world datasets. Further, they integrated those patterns into large-scale agent-based models and simulated the users’ activity to validate predictive accuracy. Xu et al. [31] build an agent-based model to simulate the knowledge transfer and integration processes among irrational individuals and then explored the effects of individual irrationality and network structure on collective performance. Although ABM is widely used to simulate human behavior in multiple research areas such as auto driving, the research on simulating user network behavior is quite rare. In [32], the BP-BDI model is proposed to simulate the user’s behavior on email, in which a behavior learning model based on BP neural network is used to learn the user’s mail behavior. Diallo et al. [33] first analyzed the web simulation by using the principles of service orientation, platform independence and interoperability, and then proposed a layered approach for the web simulation. In terms of Human-machine interaction (HMI) simulation, Amirkhanyan et al. [5] proposed a user behavior simulation scheme based on user behavior state graphs, which are capable to generate simple user behavior on Windows-family virtual machines.
To sum up, there are many researches on individual behavior modeling and simulation based on ABM and make some notable research results, whereas, in collective user network behavior simulation, these research results cannot be applied directly. On the one hand, different from traffic simulations and crowding behavior simulation in an emergency, the collective user’s network behavior is spontaneous and lasting for several days or even months. On the other hand, the individual network behavior simulation methods are not suitable for collective user behavior simulation for lack of interactions among users.
In this paper, we propose a novel collective user web behavior simulation method based on ABM. Firstly, we construct a connected undirected virtual social network, and then use epidemic information dissemination model to simulate the information dissemination process among the agents in the virtual social network to drive individual user’s web behavior simulation. The time calculation method makes the time intervals of two consecutive network behaviors follow a power-law distribution. It should be noticed that our work is different from [23], in which they simulated multi-agent interactions in a real-life social network topology to verify whether the results are consistent with empirical observations. In addition, their simulation happened in an emulation environment without any real network behavior. However, our work is to explore a simulation method that can construct a virtual social network and simulate a collective user’s web behavior that follows human dynamics in a real network environment.
In this section, we first propose a connected virtual social network construction algorithm by combing the PLOD algorithm with the BA model. In the virtual social network, each node is modeled as one agent. We divide the agents into three categories, the susceptible agent, the infected agent and the recovered agent. The SIR is modified, named as s_SIR, to simulate the information dissemination among the agents, which drives individual network behavior simulation. Taking web behavior for example, one agent selected randomly from the social network replies to an specific post of the same forum after Δti (i∈[1, n]) length of time and then infects its neighbors. The infected agent will repeat the same process. The abstract simulation process of the collective user web behavior is demonstrated as Fig. 1.
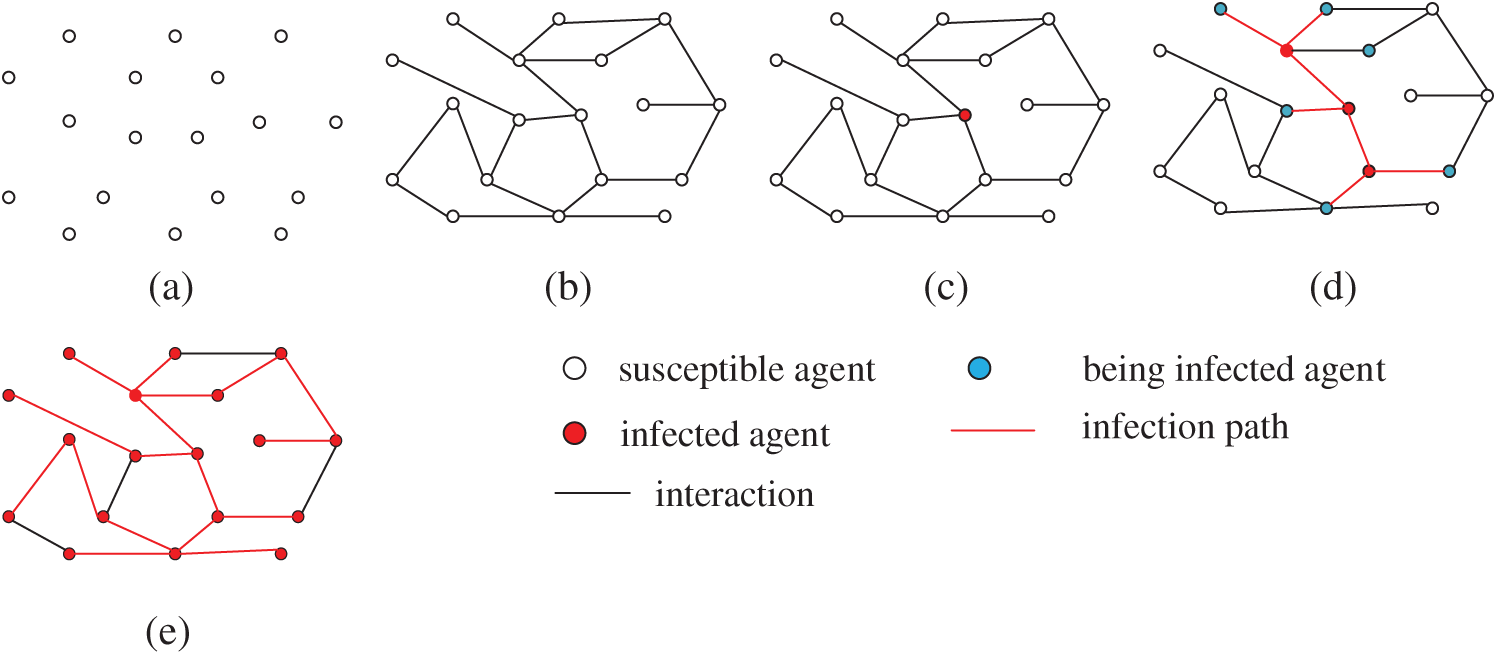
Figure 1: The abstraction process of collective user web behavior simulation
In Fig. 1, (a) shows isolated agents, (b) a virtual social network constructed by our algorithm, (c) one agent is infected (individual web behavior simulation), (d) The neighbors are infected, and (e) all the agents are infected (collective user web behavior simulation complete). We assume one infected agent will recover if it has infected all its susceptible neighbors and the recovered agent will never be infected anymore. In the information dissemination process, two connected agents communicate with each other to simulate the infection process by using UDP. Once infected, the agent will perform web behavior simulation after Δti (i∈{1, 2, …, n}) length of time.
3.1 Virtual Social Network Construction Algorithm
There are two classical virtual social network generation algorithms, one is the PLOD, and the other is the BA model. The degree distribution resulting from the BA model follows a power-law distribution of the form P(k) ~ k–3, which cannot generate other degree distributions directly. The PLOD algorithm can construct a virtual social network that the degrees of the agents obey power-law distribution by assigning a degree to each agent. However, it cannot guarantee that the virtual social network is connected. To construct a connected virtual social network with specified degree centrality, we improve the PLOD algorithm with the BA model, which makes the degrees of the agents follow a power-law distribution. The algorithm is described as Algorithm 1.
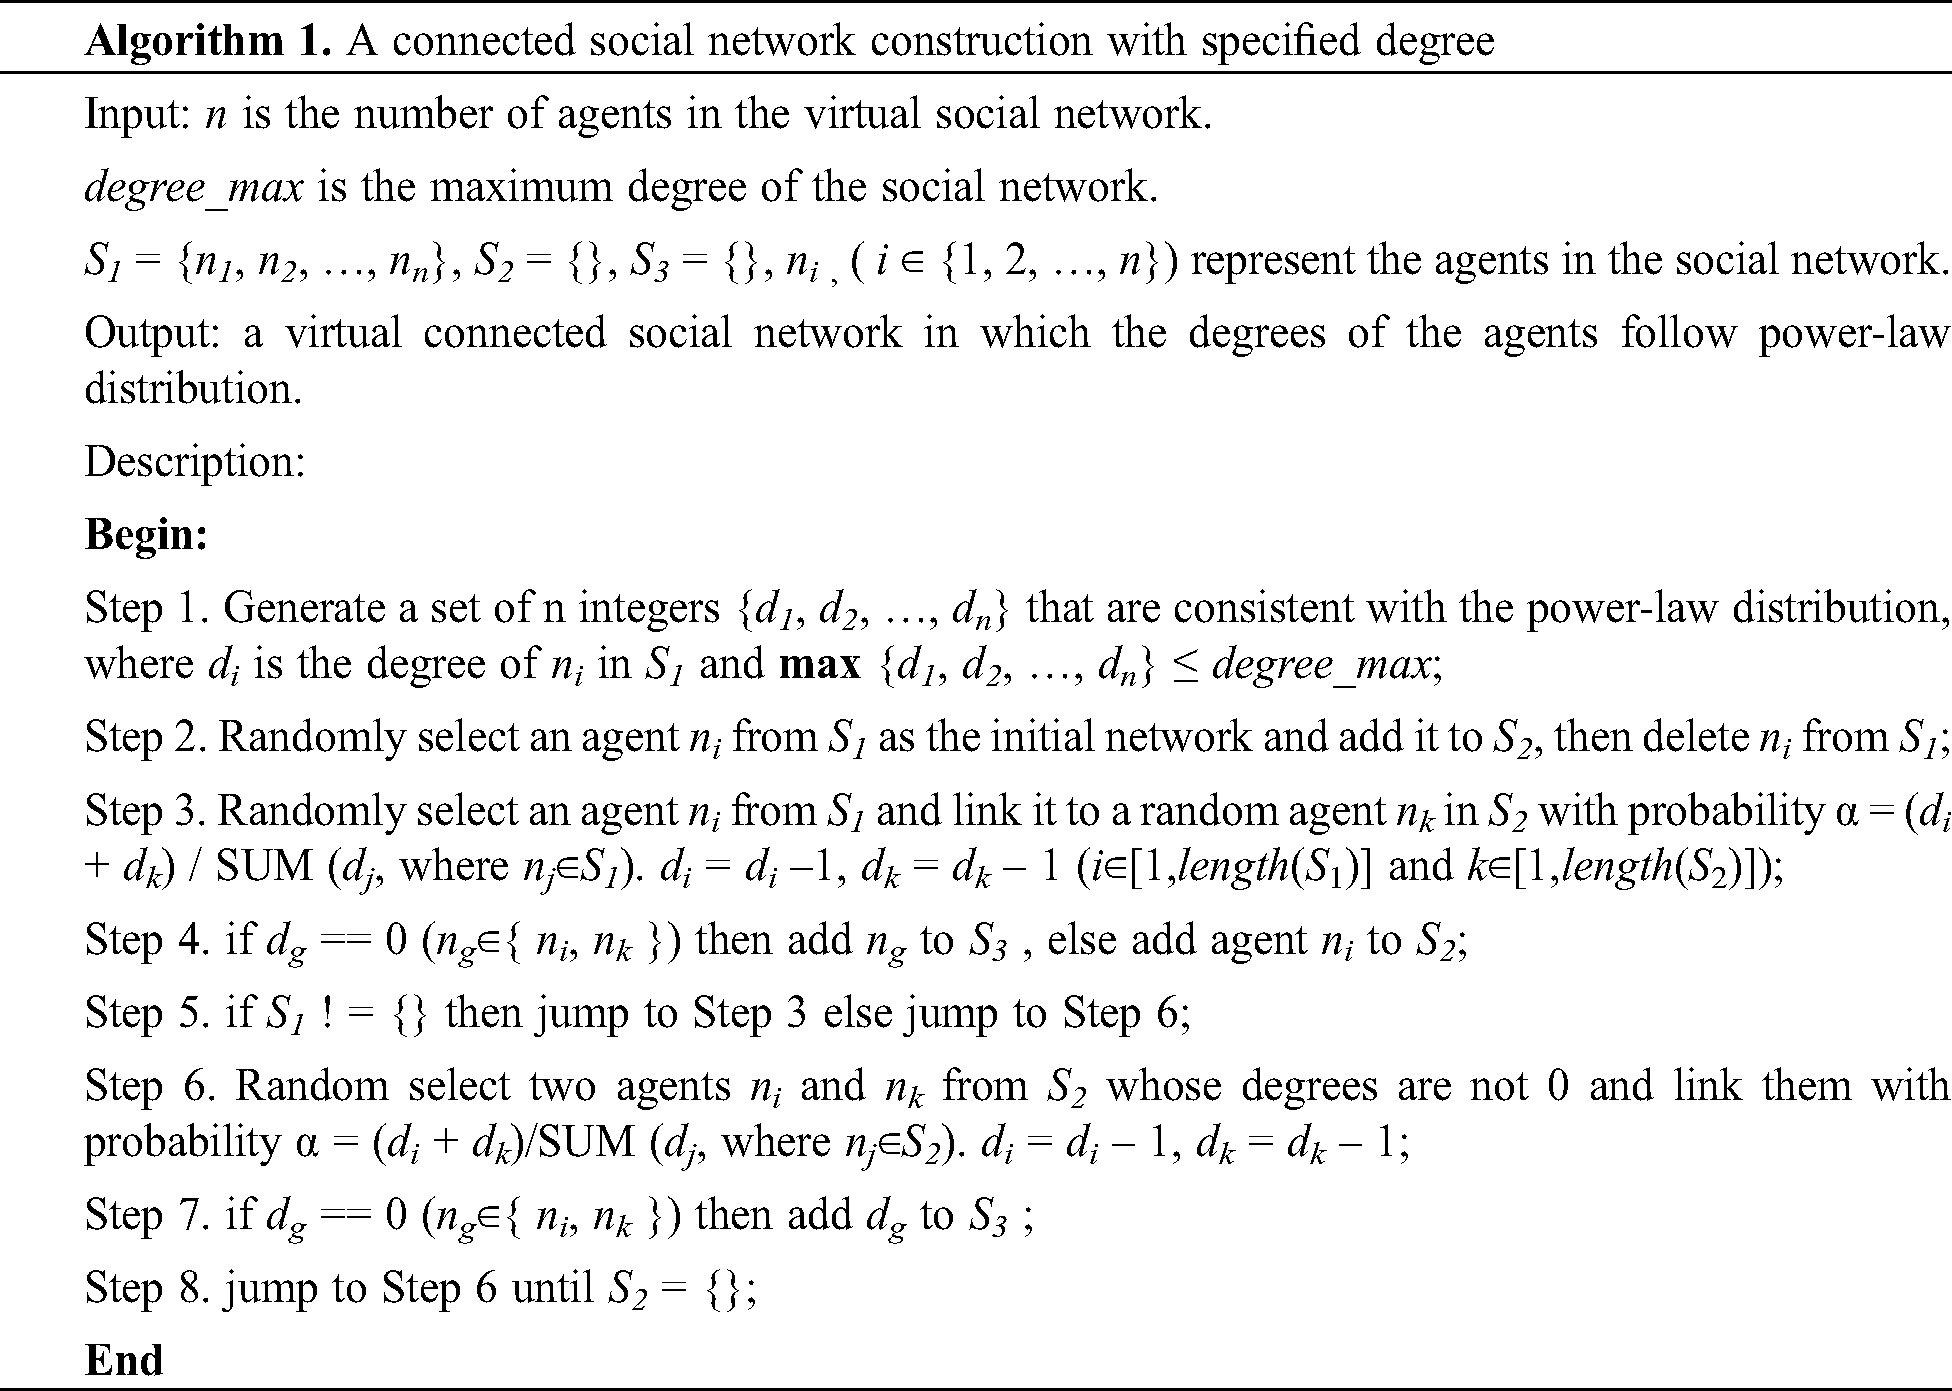
In Algorithm 1, the agents are divided into three non-intersecting collections, S1, S2, and S3. S1 is the collection of isolated agents in the social network, S2 is the collection of the connected agents whose degrees are not zero in the virtual network, and S3 is the collection of agents whose degrees are 0. The virtual social network grows up until S1 = {} and S2 = {}. The  when
when  . Therefore, the virtual social network constructed is a connected network. Also, the time complexity of Algorithm 1 is O(n2). Furthermore, we implement the method proposed in [34] to calculate the set {di} for the degrees of the agents.
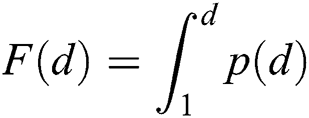
We assume that the {di} satisfies a power-law distribution p(di) ∝ di–β , and an upper limit M is assigned to degree_max in Algorithm 1. The purpose is to generate a set {di| di∈[1, M] ∧ di is an integer ∧ p(di) ∝ di –β}. The cumulative distribution is
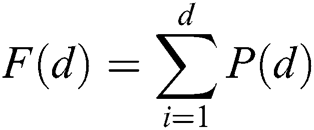
Accordingly, Eq. (1) can be approximated by a continuous form, as
The ratio of F(Δt) (Δt∈[1, M]) to F(M) is denoted by r, as
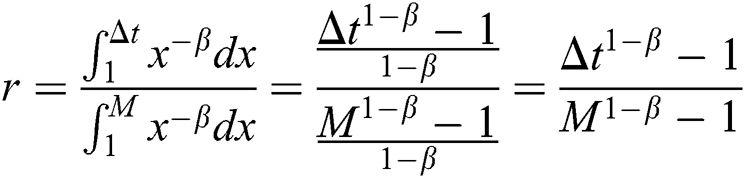
0 ≤ r ≤ 1 and
If  , then
 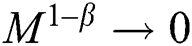 and hence (4) can be approximated as
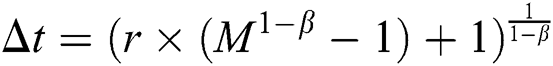
For different β, the average intervals avg(Δt) is different. To exclude the bias influenced caused by avg(Δt), a correction factor u(β) is introduced to Eq. (5), as
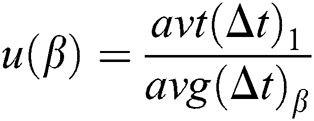
where u(β) satisfies
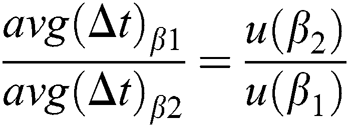
For simplicity but without loss of generality, we set u(1) = 1, hence

To sum up, given M and β, u(β) can be estimated directly. The set{di} can be generated by selecting a random r ∈ [0,1] and then calculating Δti by using Eq. (6). Furthermore, if Δt' is not an integer, we further rectify Δt'. Namely, Δt' = ⌈Δt'⌉ with probability Δt' − ⌊Δt'⌋ while Δt' = ⌊Δt'⌋ with probability ⌈Δt'⌉ − Δt'. The virtual relationship is established and maintained by the communication among agents.
3.2 Web Behavior Simulation Algorithm
We apply the SIR model to simulate the information dissemination process among the agents and meanwhile trigger the web behavior simulation, which is named the s-SIR algorithm as described in Algorithm 2. More specifically, the status of agents in the virtual social network is divided into three types, namely, susceptible agents, infected agents, recovered agents.
Before describing our s-SIR algorithm, we first give the following definitions:
1. In the initial state, each agent in the social network is susceptible.
2. Each agent is irrational; in other words, it will infect all susceptible neighbors.
3. Each infected agent will become a recovered agent after infecting all neighbors and will never be infected anymore.
The infection process is implemented by one agent transferring a message to its neighbors one by one in the virtual social network. The agent is viewed as infected once it receives a specified message from a neighbor, and then replies to the same post after waiting a specified length of time.
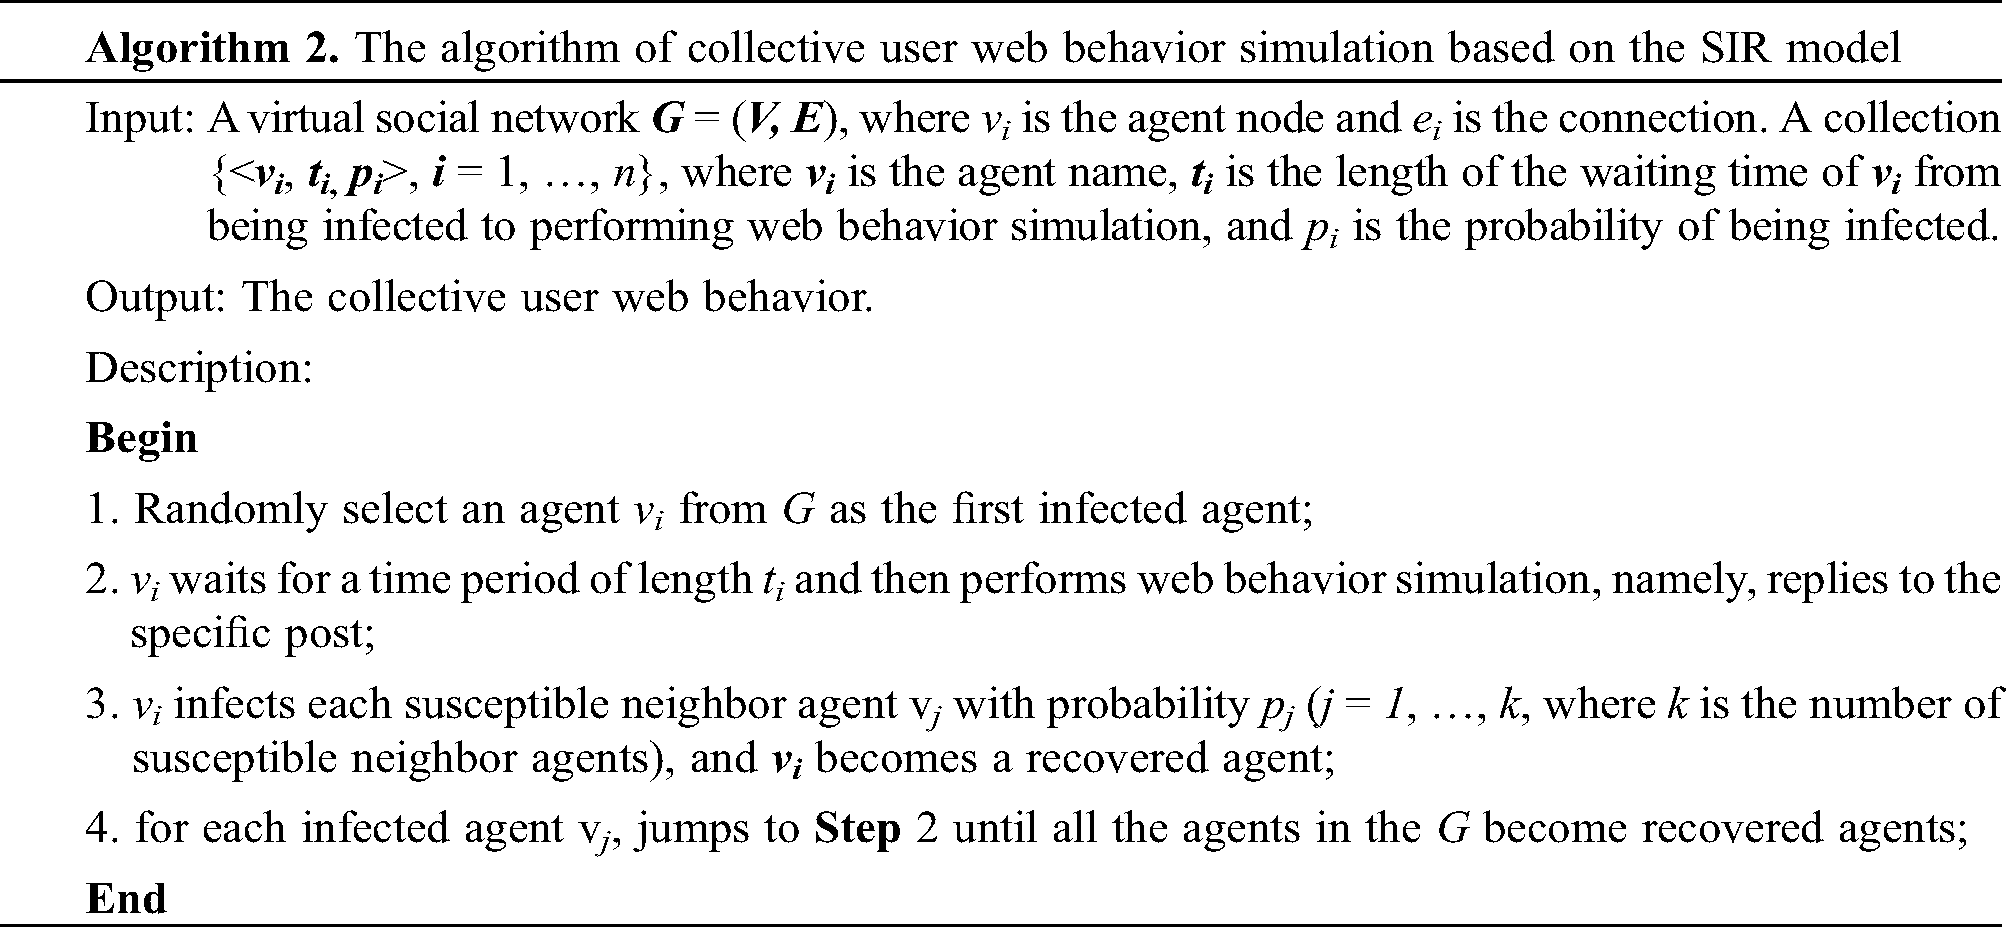
In Algorithm 2, each infected agent vi (i∈{1, 2,…, n}) will wait for the length of ti before replying a message to an specific post of the same forum, and then send a message to each susceptible neighbors vj with Breadth—First Search. At some point of time, multiple agents are performing web behavior simulations simultaneously. The length of waiting time ti (i = 1, …, n) also follows a power-law distribution. The calculation method of ti is given in the Eqs. (1)–(7). To simulate the web behavior realistically, we use an expansion factor γ to extend the web behavior simulation process. Namely, the length of the waiting time ti is expanded by γ times.
To simulate collective user web behavior, a construction method of a virtual social network is proposed, of which the degrees of nodes follow a power-lower distribution. Next, a web behavior simulation method named s-SIR based on SIR has been designed to drive each agent performing a reply to the post in the virtual social network. Not only the distribution of agents’ degrees but also the time intervals of post behaviors follow a power-law distribution. In other words, we abstract an undirected graph G = {vi, di, ti} to describe the agents in the virtual social network, where di is the degree of vi, and ti is the length of waiting time from being infected to perform the simulation. Once the G is determined, the collective user web behaviors can be simulated, and finally, the degree and waiting time intervals follow a power-law distribution.
In our experiments, we use a Docker container swarm to simulate the collective user. We deploy 6000 and 10000 Docker containers respectively to evaluate our proposed simulation method. First, the virtual social network constructed method is validated, and then we perform web behavior simulation in the virtual social network with our proposed s-SIR algorithm. Finally, a power-law function is used to fit test data, and the standard error is employed to evaluate the realistic of the simulation method. Our experiments demonstrate that the method is capable of simulating the collective user web behavior realistically.
We deploy 12 high-performance servers (Intel Xeon E5-2650 V4, 64G memory, 2 NICs and 2T hard disk) to conduct the experiments, of which 10 servers running Docker containers are used to perform collective user web behavior simulation and another server serves as a web server where a forum is deployed and the 12th server is used to generate the virtual social network and calculate the time of replying to the post of the forum. Each agent replies a message to the specific assigned post of the forum in the web server. The agent is implmented by one Docker container, and the Weave Net networking toolkit is employed to connect all the agents. The physical and logical topologies of the experiment is shown in Fig. 2.
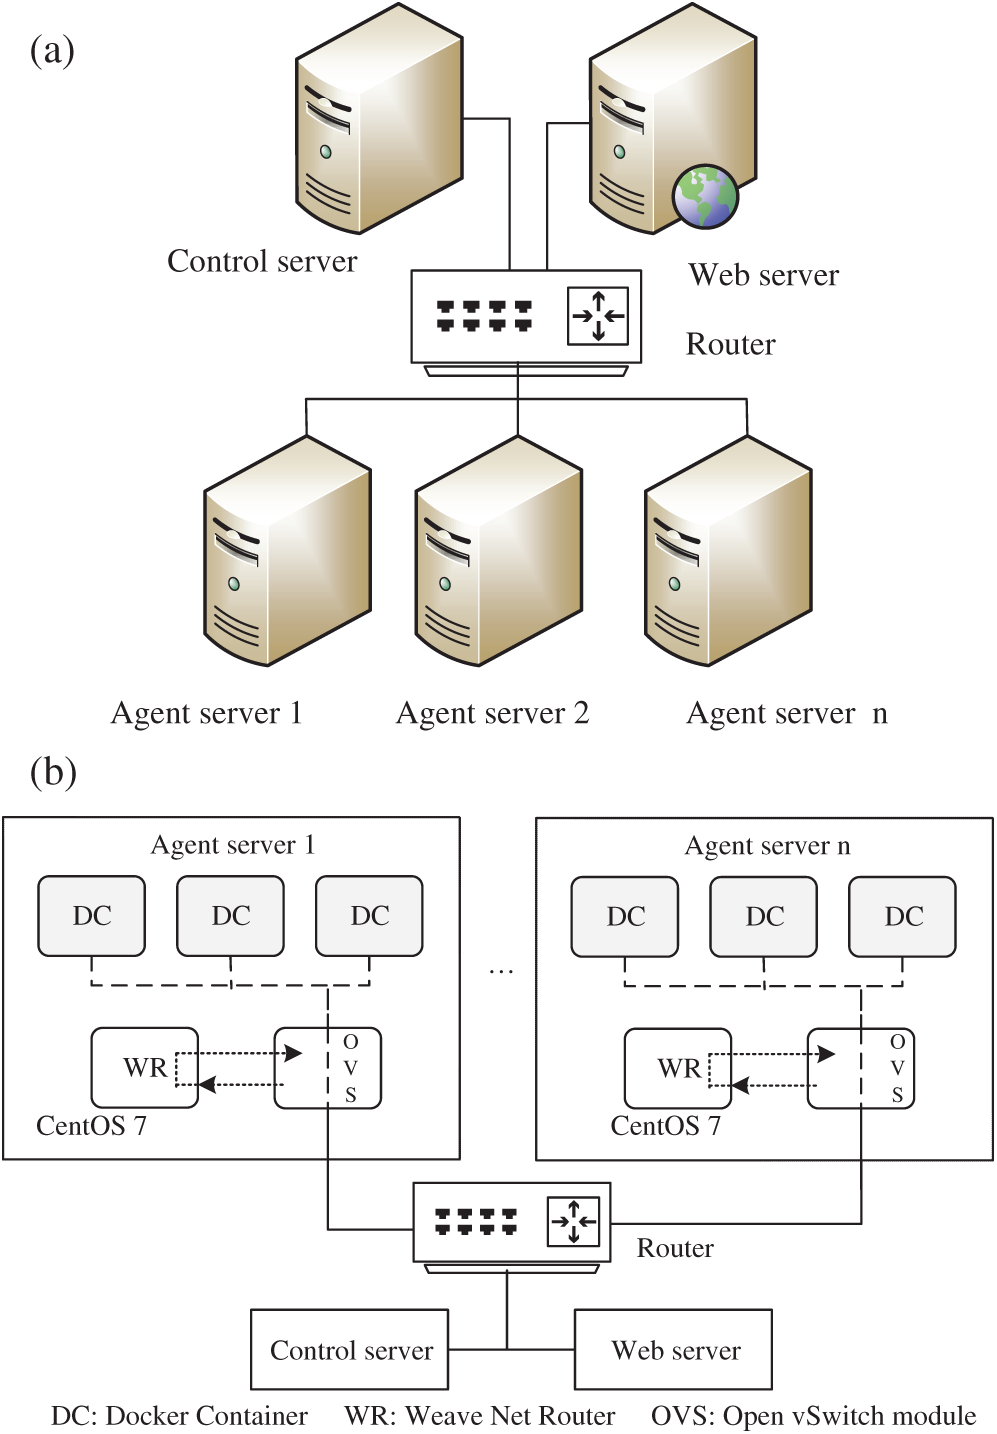
Figure 2: (a) The physical topology of the experiment network. (b) The logical topology of the agent server
As shown in Fig. 2, the servers are connected by a router in physical while the agents (Docker containers) are connected by Open vSwitch, a virtual switch, controlled by Weave Net in logical. The implementations of Algorithms 1 and 2 are deployed in the control server and the agents, respectively, to perform the simulation. We deploy 10000 agents at most to evaluate our proposed method, and all the system clocks of the servers are synchronized by NTP before each round of the experiment. Furthermore, the clock synchronization error of 1000 Docker containers in one server is tested and the maximum error is less than 1 s.
4.2 Calculation Time Comparison
First, we compare the calculation time between the PLOD algorithm and the improved PLOD algorithm (Algorithm 1). The number of nodes ranges from 100 to 1000 with the same degree distribution function. The experimental result is shown in Fig. 3.
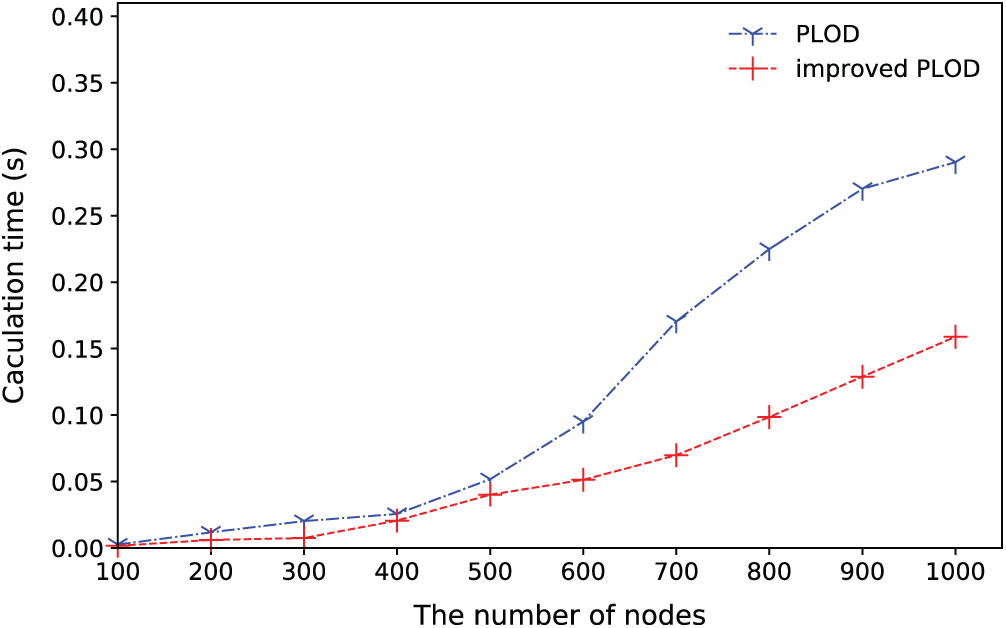
Figure 3: The comparison of the calculation time between the PLOD and improved PLOD
As shown in Fig. 3, the calculation time increases as the number of nodes increase. However, the improved PLOD algorithm grows slowly compared with the PLOD. For the improved PLOD algorithm, the maximum calculation time is 0.15 s with 1000 nodes, which is much less than that of the PLOD algorithm.
4.3 Virtual Social Network Construction Experiment
Next, we evaluate the virtual social network construction method with 1000 agents where β = 2.1 in Algorithm 1. The degree distribution and generated graph are demonstrated in Fig. 4.
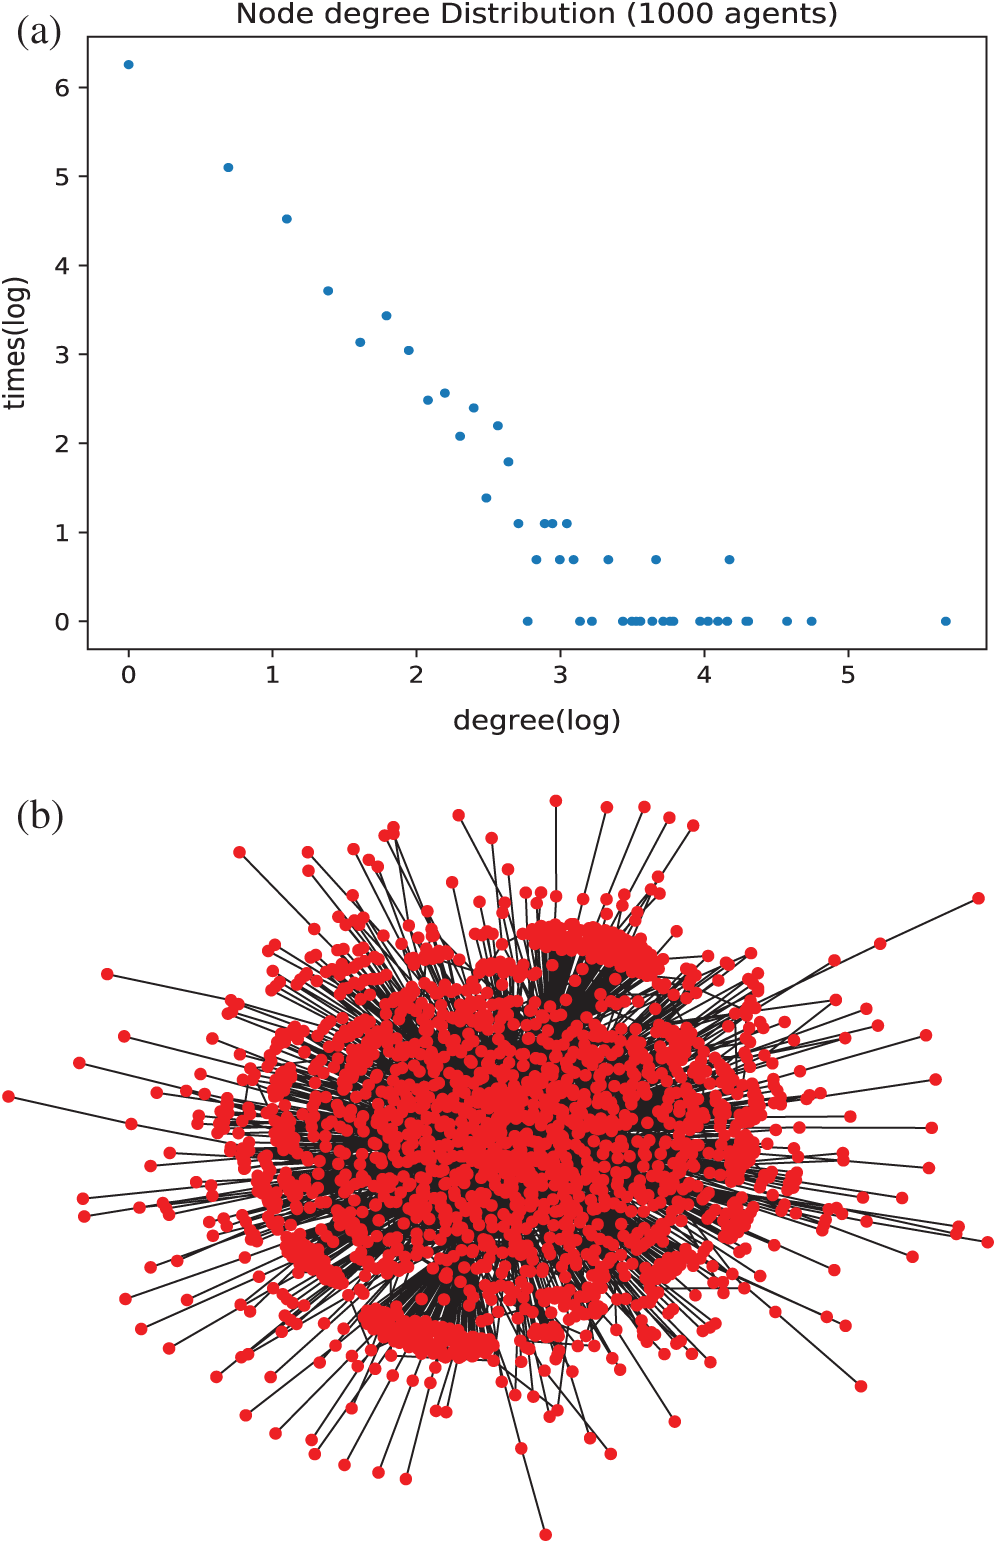
Figure 4: (a) The distribution of the virtual social network log–log plot. (b) The graph of virtual social network
In Fig. 4a , the x-axis is the degrees of the agents, and the y-axis represents the number of times of the same degree that appears in the experiment. In the experiment, there are 44 different degrees from {1, 2, …, 292} for the 1000 agents. Furthermore, most degrees of the nodes are smaller and follow heavy-tailed distribution in the log–log plot. The power-law function appears as a straight line with slope k = –2.1.
4.4 Time Interval Distribution Experiment
In this section, we construct a virtual network with 6000 and 10000 agents, respectively. Firstly, one agent is randomly selected as the source of the infection. Then we drive the web behavior simulation according to the network topology and the length of waiting time. In this section, we set all the infected probability pj = 1 (j = 1, …, n), and the length of each waiting time ti (i = 1, …, n) is multiplied by expansion factor γ (γ = 1500) to extend the waiting time. Finally, we calculate the time intervals of the reply to the post. The time intervals are indirectly obtained from the database of the webserver of the forum. The time interval distribution of 10000 users is illustrated in Fig. 5.
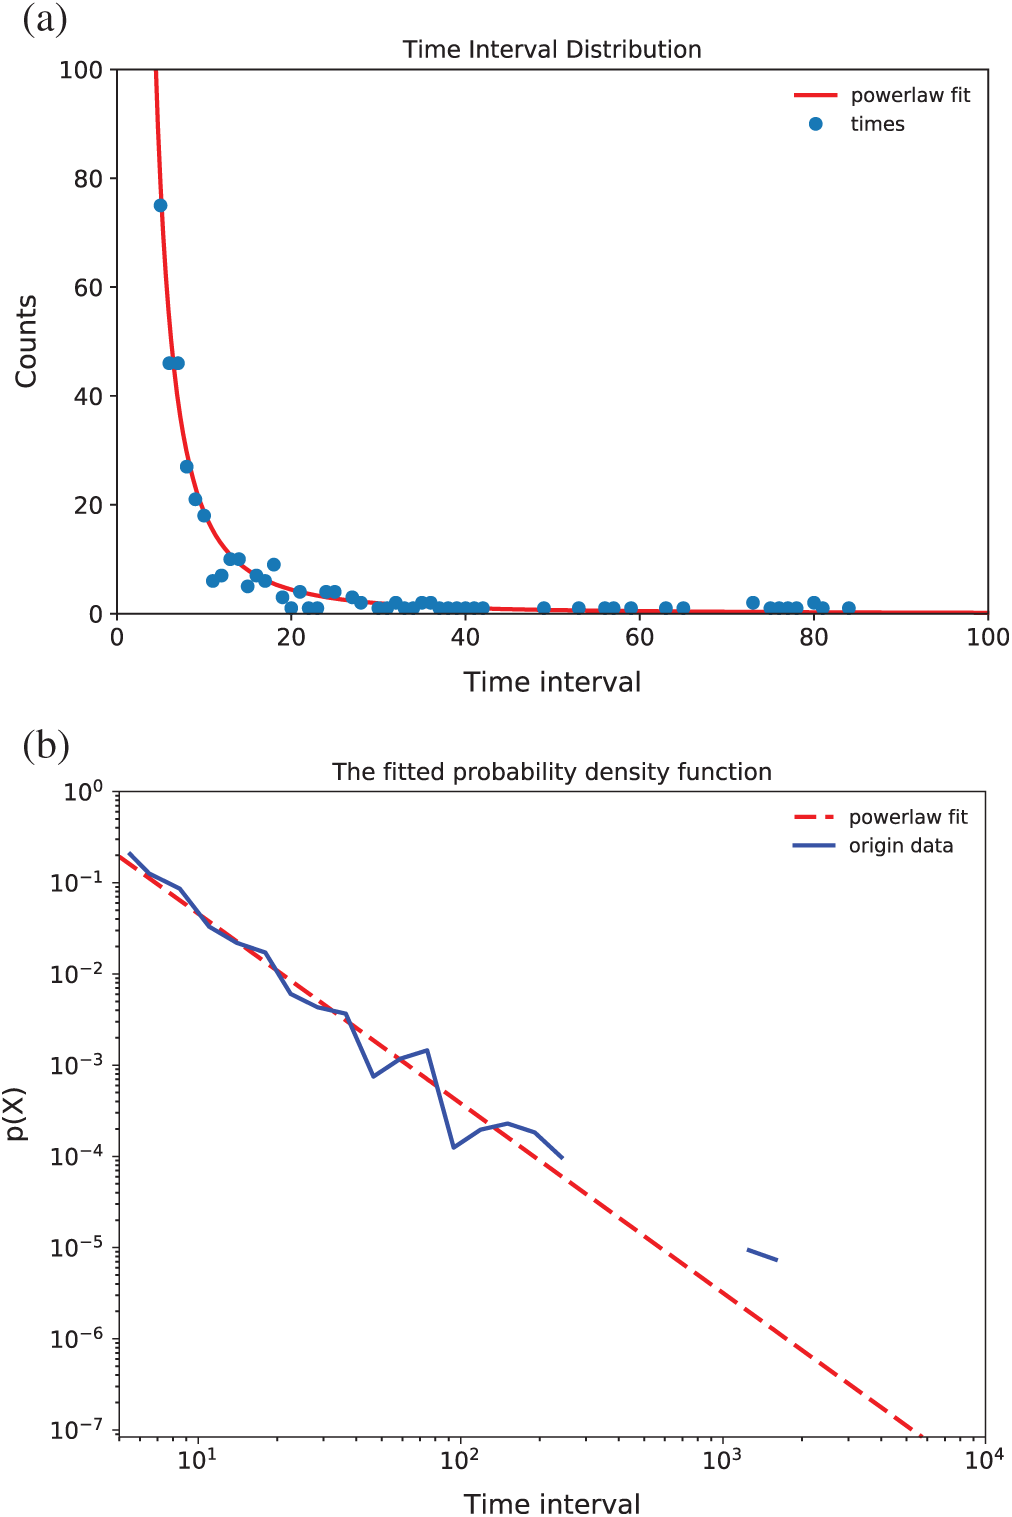
Figure 5: (a) The distribution of time intervals of replies to the post with 10000 users. (b) The logarithmic plot of the time intervals of replies to the post with 10000 users
As in Fig. 5, the x-axis is the time interval and the y-axis is the number of counts of the time interval. We can conclude:
1. Most of the time interval of agents are located in the tail part,
2. The smaller the time interval, the larger the counts and
3. The larger the time interval, the smaller the counts.
We fit the pow-law function, which is y = 6640 × x–2.1, and the probability density function using logarithmic operations is y = –2.1 × x + 3.8 with standard error 0.0153.
To compare with the simulation result of 10000 users, the experimental result of 6000 users is shown in Fig. 6.
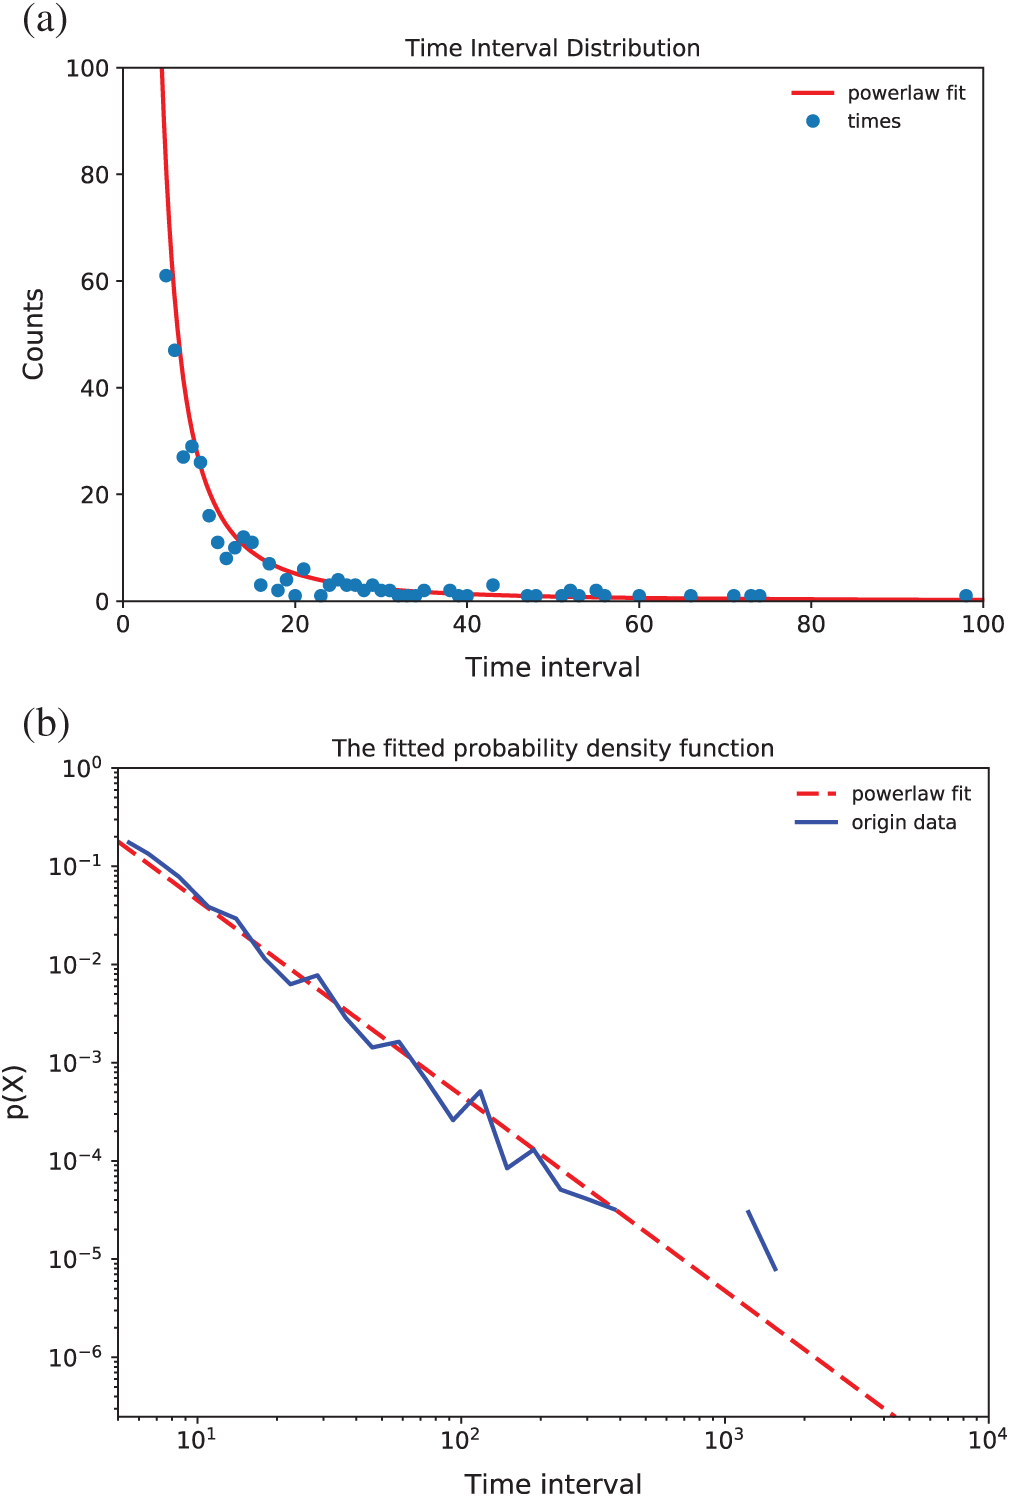
Figure 6: (a) The distribution of time intervals of replies to the post with 6000 users. (b) The logarithmic plot of the time intervals of replies to the post with 6000 users
As demonstrated in Fig. 6a, the time intervals also exhibit a power-law distribution, which is similar to the 10000 user’s simulation. The probability density function using logarithmic operations is y = –2.0 × x + 3.7 with standard error 0.0156. Comparing Fig. 6 with Fig. 5, we can conclude that the standard error does not change obviously (less than 2%). Hence, the performance of the simulation method is stable.
4.5 Standard Error Comparisons Experiment
Finally, we perform extensive experiments to evaluate the standard error of the fitted pow-law function, in which β = 3, 4, 5 in Algorithm 2 and the waiting time expansion factor γ = 200, 300, 500, and 1500 with 6000 agents and 10000 agents, respectively. The experimental results are shown in Fig. 7.
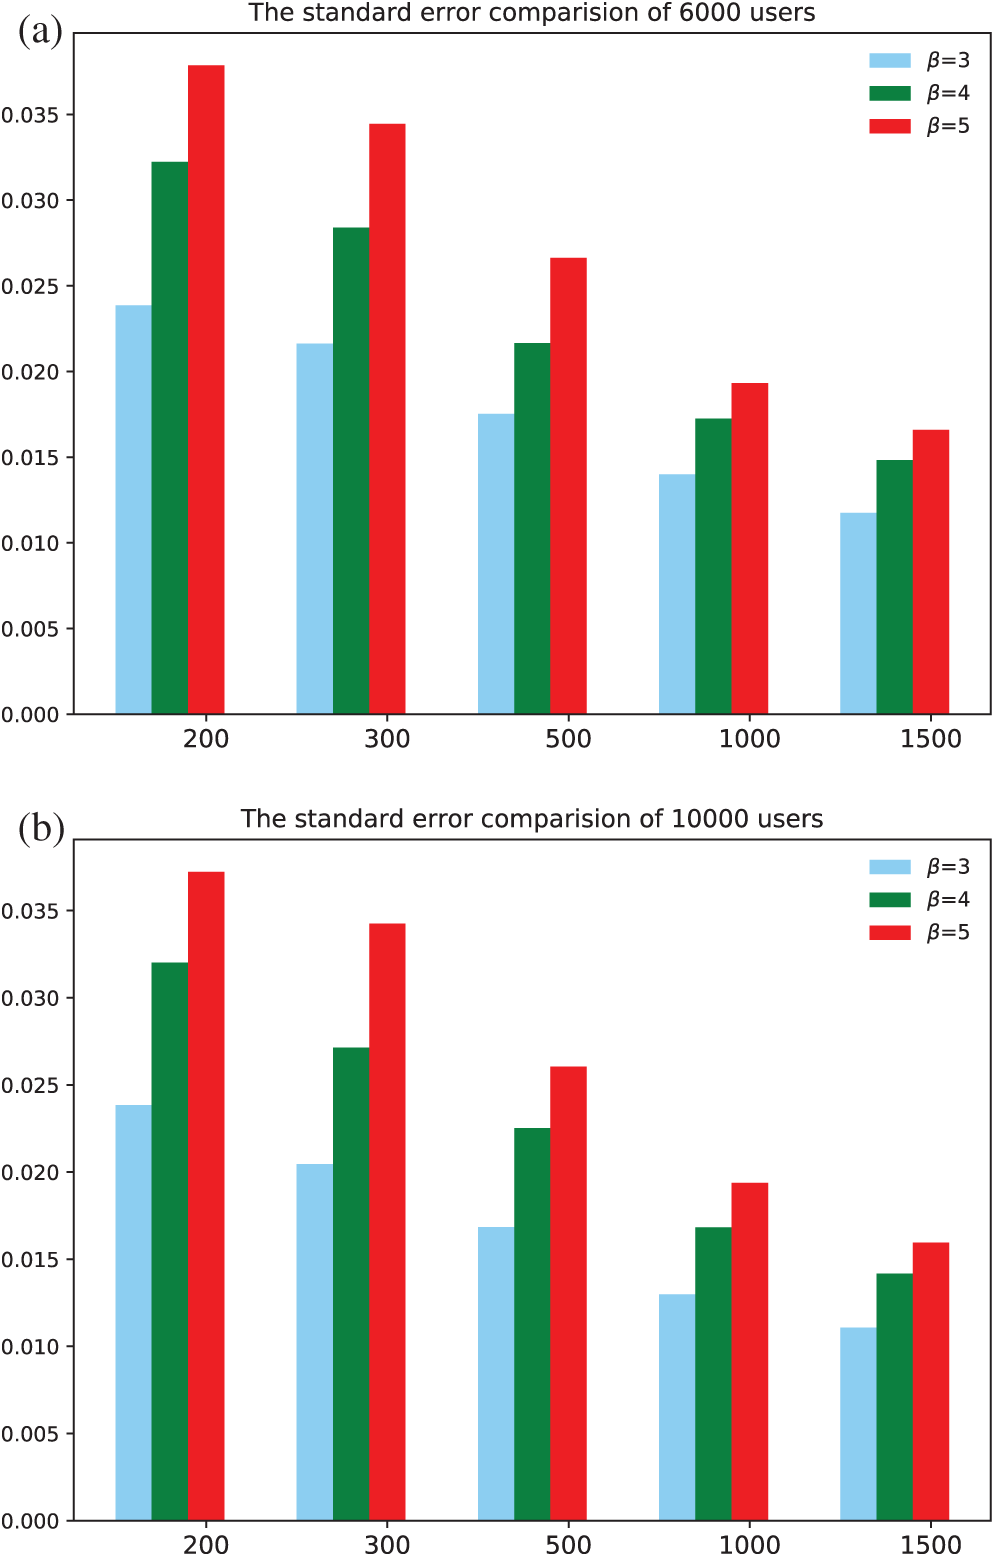
Figure 7: (a) The standard error comparison with different β and γ under 6000 users. (b) The standard error comparison with different β and γ under 10000 users
From Fig. 7, we can conclude that the standard error does not increase obviously with the increase of the agents’ number. The max standard error appears when γ = 200 and β = 5 (Algorithm l) in both figures. Furthermore, the standard error grows as β increases when γ is fixed. The standard error decreases as γ increases when β is fixed. Furthermore, the simulation process lasts 37.1 h when β = 3 and γ = 1500 with 10000 agents, and 14.6 h with 6000 agents. So, the longer the waiting time, the better the fitting effect and the closer to the real collective user web behavior in a specific range of the length of waiting time.
In our experiments, we first validate the connected social network construction algorithm with specified degree. Compared with the PLOD algorithm, the calculation cost of our proposed method is smaller and ensures that the generated social networked is connected. Base on the virtual social network, we then deploy 6000 and 10000 Docker containers with ten servers to simulate the collective user web behavior with the s-SIR algorithm respectively. By using UDP, we simulate the infection process that occurs among virtual users. The time intervals of the web behavior of the collective user are fitted to pow-law function with a lower standard error, which fits the human dynamics. From the experiments, we can conclude that the standard error is stable when increasing the scale of the users, and the standard error grows when increases β or decreases γ.
In this work, we have studied the collective user’s web behavior simulation method and validated our proposed method by driving 6000 and 10000 agents to reply to a specific post of the same forum. First, a construction method of a virtual social network whose degrees follow a power-law distribution is proposed. Then, we use a new data structure G = {vi, di, ti} to describe the agents in the virtual network. Based on this network, we design an algorithm named s-SIR to drive each agent to perform web behavior simulation. A calculation method, which can generate a data collection following a power-law distribution, is implemented to create the degrees and the waiting time of the agents in the virtual social work. The degree collection is employed to construct the virtual social network, and the waiting time collection is used to control the message dissemination process by our s-SIR algorithm. We have ignored the time of information dissemination and the replies to the post due to the expansion factor γ is much longer than those time. The experimental results show that the time intervals of the web behavior follow a power-law distribution.
To the best of our knowledge, this is the first work to study on the method of simulating the collective user web behavior in a real network environment. The study results can be widely employed in all kinds of network testbeds to construct a real network scenario in the construction of a large-scale users’ network behavior that follows human dynamics, such as mail behavior and web behavior.
Since our work is the first research in the area of collective user network simulation, it comes with certain limitations. One is that we only simulate 1,0000 users’ web behavior because of the limitation of the hardware. Another possible limitation is that we cannot directly calculate the collection of power-law distribution for degree and waiting time given the distribution function of collective user behavior time interval. In the future, we may want to study the power-law distributions calculation method of degree and waiting time, given the collective user behavior distribution.
Funding Statement: This research was supported by National Key Research and Development Plan under Grant 2017YFB0801804, Key Research and Development Plan of Shandong Province under Grant 2017CXGC0706, Peng Cheng Laboratory Project of Guangdong Province PCL2018KP004, frontier science and technology innovation of China under Grant 2016QY05X1002-2, national regional innovation center scientific and technological special projects Grant 2017QYCX14, University Co-construction Project in Weihai City.
Conflicts of Interest: The authors declare that they have no conflicts of interest to report regarding the present study.
1 B. Ferguson, A. Tall and D. Olsen. (2014). “National cyber range overview,” in IEEE Military Communications Conf., Baltimore, MD, pp. 123–128. [Google Scholar]
2 T. Miyachi, K. Chinen and Y. Shinoda. (2011). “StarBED and SpringOS architectures and their performance,” in Int. Conf. on Testbeds and Research Infrastructures, Berlin, Heidelberg, pp. 43–58. [Google Scholar]
3 B. Fang, Y. Jia, A. Li and W. Zhang. (2016). “Cyber ranges: State-of–the-art and research challenges,” Journal of Cyber Security, vol. 1, no. 3, pp. 1–9. [Google Scholar]
4 H. Kavak, J. J. Padilla and D. Vernon-Bido. (2016). “A characterization of cybersecurity simulation scenarios,” in Proc. of the 19th Communications & Networking Symposium, Society for Computer Simulation International, Pasadena, California, USA, pp. 1–8. [Google Scholar]
5 A. Amirkhanyan, A. Sapegin, M. Gawron, F. Cheng and C. Meinel. (2015). “Simulation user behavior on a security testbed using user behavior states graph,” in Int. Conf. on Security of Information & Networks, Sochi, Russia, pp. 217–223. [Google Scholar]
6 N. Li, W. Cushing, S. Kambhampati and S. Yoon. (2014). “Learning probabilistic hierarchical task networks as probabilistic context-free grammars to capture user preferences,” ACM Transactions on Intelligent Systems & Technology, vol. 5, no. 2, pp. 1–32.
7 J. Park, N. O’Hare, R. Schifanella, A. Jaimes and C. Chung. (2015). “A large-scale study of user image search behavior on the web,” in Proc. of the 33rd Annual ACM Conf. on Human Factors in Computing Systems—CHI’15, Seoul, Republic of Korea, pp. 985–994. [Google Scholar]
8 P. Loyola, P. E. Román and J. D. Velásquez. (2011). “Clustering-based learning approach for ant colony optimization model to simulate web user behavior,” in IEEE/WIC/ACM Int. Conf. on Web Intelligence & Intelligent Agent Technology, Lyon, France, pp. 457–464. [Google Scholar]
9 Z. Rajabi, A. Shehu and H. Purohit. (2019). User Behavior Modelling for Fake Information Mitigation on Social Web. Cham: Springer International Publishing. [Google Scholar]
10 Y. Liu, C. Wang, M. Zhang and S. Ma. (2017). “User behavior modeling for better Web search ranking,” Frontiers of Computer Science, vol. 11, no. 6, pp. 923–936. [Google Scholar]
11 J. Liu, M. Mitsui, N. Belkin and C. Shah. (2019). “Task, information seeking intentions, and user behavior: Toward a multi-level understanding of Web search,” in Proc. of the Conf. on Human Information Interaction and Retrieval, Glasgow, Scotland UK, pp. 123–132. [Google Scholar]
12 Y. Virkar and A. Clauset. (2014). “Power-law distributions in binned empirical data,” Annals of Applied Statistics, vol. 8, no. 1, pp. 89–119. [Google Scholar]
13 L. Leiva. (2012). “Automatic web design refinements based on collective user behavior,” in CHI’12 Extended Abstracts on Human Factors in Computing Systems, Austin, Texas, USA, pp. 1607–1612.
14 M. Mitrović, G. Paltoglou and B. Tadić. (2011). “Quantitative analysis of bloggers’ collective behavior powered by emotions,” Journal of Statistical Mechanics: Theory and Experiment, vol. 1, pp. 2005–2019.
15 D. Yang, D. Zhang and B. Qu. (2016). “Participatory cultural mapping based on collective behavior data in location-based social networks,” ACM Transactions on Intelligent Systems and Technology, vol. 7, no. 3, pp. 1–23. [Google Scholar]
16 J. Esquivel-Gómez, E. Stevens-Navarro, U. Pineda-Rico and J. Acosta-Elias. (2015). “A growth model for directed complex networks with power-law shape in the out-degree distribution,” Scientific Reports, vol. 5, 7670. [Google Scholar]
17 V. Zadorozhnyi and E. Yudin. (2014). “Growing network: Nonlinear extension of the Barabasi-Albert model,” Communications in Computer and Information Science, vol. 487, pp. 432–439. [Google Scholar]
18 V. N. Zadorozhnyi and E. B. Yudin. (2012). “Structural properties of the scale-free Barabasi-Albert graph,” Automation and Remote Control, vol. 73, no. 4, pp. 702–716. [Google Scholar]
19 J. Kaderka, M. Rozek, J. Arballo, D. Wagner and M. Ingham. (2018). “The behavior, constraint, and scenario (BeCoS) tool: A web-based software application for modeling behaviors and scenarios,” in AIAA Aerospace Sciences Meeting, Kissimmee, Florida, USA. [Google Scholar]
20 L. Yang, S. Dumais, P. Bennett and A. Awadallah. (2017). “Characterizing and predicting enterprise email reply behavior,” in Proc. of the 40th Int. ACM SIGIR Conf. on Research and Development in Information Retrieval, Shinjuku, Tokyo, Japan, pp. 235–244. [Google Scholar]
21 X. Si and Y. Liu. (2010). “Power-law distribution of human behaviors in internet forums,” in Int. Sym. on Intelligence Information Processing and Trusted Computing, Huanggang, China, pp. 286–289. [Google Scholar]
22 R. Sifa, A. Drachen and C. Bauckhage. (2015). “Large-scale cross-game player behavior analysis on steam,” in Eleventh Artificial Intelligence and Interactive Digital Entertainment Conf., Dortmund, Germany, pp. 1–8. [Google Scholar]
23 Y. Xiao, B. Wang, Y. Liu, Z. Yan, X. Chen et al. (2012). , “Analyzing, modeling, and simulation for human dynamics in social network,” Abstract & Applied Analysis, vol. 2012, no. 6684, pp. 552–582. [Google Scholar]
24 P. Caillou, B. Gaudou, A. Grignard, C. Truong and P. Taillandier. (2017). “A simple-to-use BDI architecture for agent-based modeling and simulation,” in Advances in Social Simulation, Springer, Cham, pp. 15–28. [Google Scholar]
25 C. Adam and B. Gaudou. (2016). “BDI agents in social simulations: A survey,” Knowledge Engineering Review, vol. 31, no. 3, pp. 207–238. [Google Scholar]
26 S. Chandramohan, M. Geist, F. Lefèvre and O. Pietquin. (2011). “User simulation in dialogue systems using inverse reinforcement learning,” in Interspeech, Florence, Italy, pp. 1025–1028. [Google Scholar]
27 S. Gottwalt, W. Ketter, C. Block, J. Collins and C. Weinhardt. (2011). “Demand side management—A simulation of household behavior under variable prices,” Energy Policy, vol. 39, no. 12, pp. 8163–8174.
28 K. Mezuman, S. Bauer and K. Tsigaridis. (2018). “Human behavior in global fire simulations,” in AGU Fall Meeting Abstracts, Washington, USA.
29 S. Kampmann, S. Seele, R. Herpers, P. Becker and C. Bauckhage. (2015). “Automatic mapping of human behavior data to personality model parameters for traffic simulations in virtual environments,” in IEEE Conf. on Computational Intelligence and Games, Tainan, Taiwan, pp. 336–343. [Google Scholar]
30 J. Flamino, W. Dai and B. K. Szymanski. (2019). “Modeling human temporal dynamics in agent-based simulations,” in Proc. of the 2019 ACM SIGSIM Conf. on Principles of Advanced Discrete Simulation,, Chicago, IL, USA: ACM, pp. 99–102. [Google Scholar]
31 B. Xu, R. Liu and Z. He. (2016). “Individual irrationality, network structure, and collective intelligence: An agent-based simulation approach,” Complexity, vol. 21, no. S1, pp. 44–54. [Google Scholar]
32 Y. Sheng, J. Rong and W. Xiang. (2015). “Simulation of the users’ email behavior based on BP-BDI model,” in 2015 Int. Conf. on Cyber-Enabled Distributed Computing and Knowledge Discovery, Xi’an, China, pp. 16–22. [Google Scholar]
33 S. Y. Diallo, R. Gore, J. J. Padilla, H. Kavak and C. J. Lynch. (2017). “Towards a world wide web of simulation,” Journal of Defense Modeling and Simulation: Applications, Methodology, Technology, vol. 14, no. 2, pp. 159–170. [Google Scholar]
34 Z. Yang, A. X. Cui and T. Zhou. (2011). “Impact of heterogeneous human activities on epidemic spreading,” Physica A: Statistical Mechanics and Its Applications, vol. 390, no. 23–24, pp. 4543–4548. [Google Scholar]
 | This work is licensed under a Creative Commons Attribution 4.0 International License, which permits unrestricted use, distribution, and reproduction in any medium, provided the original work is properly cited. |