DOI:10.32604/cmc.2021.012547
| Computers, Materials & Continua DOI:10.32604/cmc.2021.012547 | |
| Article |
Dealing with Imbalanced Dataset Leveraging Boundary Samples Discovered by Support Vector Data Description
1Graduate School of Information, Production and Systems, Waseda University, Tokyo, Japan
2Institute of Research and Development, Duy Tan University, Da Nang, 550000, Vietnam
3Faculty of Information Technology, Duy Tan University, Da Nang, 550000, Vietnam
4Department of Computer Science, Nourabad Mamasani Branch, Islamic Azad University, Mamasani, Iran
5School of Mathematics, Thapar Institute of Engineering and Technology, Deemed University, Patiala, Punjab, 147004, India
6Computer Science Department, College of Computer and Information Sciences, Al Imam Mohammad Ibn Saud Islamic University, Riyadh, Saudi Arabia
7Computer Science Department, Faculty of Applied Science, Taiz University, Taiz, Yemen
8Fractional Calculus, Optimization and Algebra Research Group, Faculty of Mathematics and Statistics, Ton Duc Thang University, Ho Chi Minh City, Vietnam
9Fakulti Teknologi dan Sains Maklumat, Universiti Kebangsaan Malaysia, Selangor, Malaysia
*Corresponding Author: Hamïd Parvïn. Email: parvin@iust.ac.ir
Received: 03 July 2020; Accepted: 08 August 2020
Abstract: These days, imbalanced datasets, denoted throughout the paper by ID, (a dataset that contains some (usually two) classes where one contains considerably smaller number of samples than the other(s)) emerge in many real world problems (like health care systems or disease diagnosis systems, anomaly detection, fraud detection, stream based malware detection systems, and so on) and these datasets cause some problems (like under-training of minority class(es) and over-training of majority class(es), bias towards majority class(es), and so on) in classification process and application. Therefore, these datasets take the focus of many researchers in any science and there are several solutions for dealing with this problem. The main aim of this study for dealing with IDs is to resample the borderline samples discovered by Support Vector Data Description (SVDD). There are naturally two kinds of resampling: Under-sampling (U-S) and over-sampling (O-S). The O-S may cause the occurrence of over-fitting (the occurrence of over-fitting is its main drawback). The U-S can cause the occurrence of significant information loss (the occurrence of significant information loss is its main drawback). In this study, to avoid the drawbacks of the sampling techniques, we focus on the samples that may be misclassified. The data points that can be misclassified are considered to be the borderline data points which are on border(s) between the majority class(es) and minority class(es). First by SVDD, we find the borderline examples; then, the data resampling is applied over them. At the next step, the base classifier is trained on the newly created dataset. Finally, we compare the result of our method in terms of Area Under Curve (AUC) and F-measure and G-mean with the other state-of-the-art methods. We show that our method has better results than the other state-of-the-art methods on our experimental study.
Keywords: Imbalanced learning; classification; borderline examples
Data mining is a sub-field in artificial intelligence [1–10]. It has wide applications in classification and clustering of data in real world problems [11–20]. Nowadays, different classifiers have been gradually proposed through different underlying assumptions and mechanisms in order to enhance classification accuracy [21–32]. One of the most challenging problems for classifiers has been to learn an Imbalanced Dataset (ID) problem. A dataset will be considered to be an imbalanced one, if it contains at least two classes where the number of data points in one class (majority class) overshadows the number of data points in the other class (minority class). Ordinary supervised learning algorithms are weak in learning ID problems. They are inclined to the majority class [33]. Ignoring the minority class is not tolerated in many problems such as the medical ones [34], risk financial assessment ones [35], etc. To tackle the challenges of IDs, different methods have been proposed that are divided into two categories: (a) external approaches and (b) internal approaches. The methods of the first category are the ones that try to balance the distribution of the class data points. The methods of the second category are the ones that try to manipulate machine learning algorithms so as to be able to handle IDs. In the current research as an approach of first type, it has been tried to boost the data points in sub-sampling trials that are error-prone. To do this, we have used an auxiliary set of the boundary data points discovered by Support Vector Data Description (SVDD).
Base classifiers perform poorly when dealing with IDs. Therefore, the learning of a given ID is considered to be a great challenge. Standard base classifiers poorly diagnose the minority class samples. Several approaches have been established for dealing with the problem of class imbalance in IDs, to improve the generalization in classification. We can categorize them into 2 general classes [36]: (1) the approaches which solve the mentioned problem in algorithm-level, (2) those which solve the mentioned problem in data-level. Those in the first class solve the learning ID problem through adjusting previous machine learning methods so as to learn better in the new imbalanced situation. The approaches in the second class solve the learning ID problem through manipulation of training data (minority class(es) and/or majority class(es)) so as to make the dataset balanced. It is generally done through an over-sampling (O-S) or an under-sampling (U-S) (or a hybrid of them). O-S increases the minority class size, but U-S decreases the majority class size [36]. It is widely acceptable that U-S is a better solution in the learning ID problem [37].
Nevertheless, most of these techniques neglect the effect of borders’ samples on classification performance; the high impact borderline samples might expose to misclassification. In this paper, a new framework is introduced to deal with learning ID problem. The performance of our framework is evaluated and compared with other state-of-the-art systems. A number of experiments have been performed under some benchmark datasets with different imbalanced ratios. The results obtained from our framework, when compared to the state-of-the-art works, confirm its better performance for the different datasets and different base classifiers.
Many attempts have been made to alleviate the problem of class imbalance. The Synthetic Minority Over-Sampling TEchnique (SMOTE) [38,39] is an O-S approach that was developed to deal with the problem of IDs’ learning by creating synthetic minority class samples. SMOTE resamples the minority class instances by synthesizing new samples of the minority class. Several variants of SMOTE have been proposed to overcome the drawbacks of SMOTE. Such as Borderline-SMOTE [39] which determines boundary minority class samples by using neighbor information and then applied SMOTE on the border samples; Safe-level-SMOTE [40] synthesizing the minority samples according to the safe level which is computed by using nearest neighbor minority instances; MWMOTE [41] generates samples from the weighted informative samples using a clustering approach; K-means SMOTE [42] and so on. Han et al. [39] proposed the borderline-SMOTE algorithm, which was modified later by He et al. [43], to improve SMOTE performance as it has inevitably randomness, where the numbers of the majority class instances and the border instances neighboring the minority class are compared. Then the O-S is done for the border samples of the minority class; that is, the interpolation is carried out in the proper area, they found that borderline-SMOTE performs better than SMOTE. Nevertheless, as SMOTE creates artificial instances with minority class label and ignores the majority class instances during creation of artificial instances, it is highly likely that it causes class mixture and makes over-generalization [44]. In this paper, a new approach is proposed which is suitable to address the ID problem. Our proposed approach is tested and assessed on different benchmarks and it is compared with many state of the art approaches that have been introduced to deal with learning ID problem.
In recent years, machine learning communities have paid much attention to imbalanced learning. Considering vast domain of the real-world problems, attention to imbalanced learning challenge grows every day. It is worthy to be mentioned that we are involved in imbalanced learning in many real-world problems. For example, the analysis of the satellite high-resolution images and healthcare recognition systems are two problems involving in imbalanced learning problem. It is a key point that minority class(es) is(are) target class(es); due to its(their) insufficient samples, it is (they are) hardly distinguishable from majority class(es) in imbalanced learning problems. For example, patients are hardly distinguishable from healthy individuals. The questions posed in the current study are: (a) “how is it possible to change skewed class distribution into balanced one?”, and (b) “when is the proposed method superior to the previous methods for learning IDs?”; and the answers to these questions are provided in the following.
In the current era, IDs are a great part of real world datasets. As for IDs, majority class(es) is(are) superior to minority class(es); therefore, correct classification of samples of minority class(es) is of high importance. For example, the problem of detection of diabetic or Escherichia coli-infected patients can be considered to be imbalanced learning. Diabetic patients go to the minority class showing the superiority of minority class to majority class in terms of importance. For each new sample, there are 4 possibilities: (a) a diabetic patient is diagnosed as a diabetic patient, (b) a diabetic patient is diagnosed as a healthy person, (c) a healthy person is diagnosed as a healthy person, and (d) a healthy person is diagnosed as a diabetic patient. Accordingly, if a healthy person is diagnosed as diabetic, it will not be a very bad thing (at least not fatal); but if a diabetic patient is diagnosed as a healthy one, we will face a misclassification which may threaten the life of a human.
The paper is organized into 5 sections. Section 1 includes topic and problem introduction. Section 2 is dedicated to definitions and literature. The presentation of the proposed method and its explanation are available in Section 3. Experimental results are presented in Section 4 in detail. Finally, Section 5 concludes the paper and presents future research directions.
Imbalanced dataset: A dataset which has more data points in one or multiple of its class(es) compared to data points in the other class(es) is an ID. The mentioned more frequent class(es) are called majority and the other(s) is(are) minority class(es). Fig. 1a shows an arbitrary ID with one minority class and one majority class.
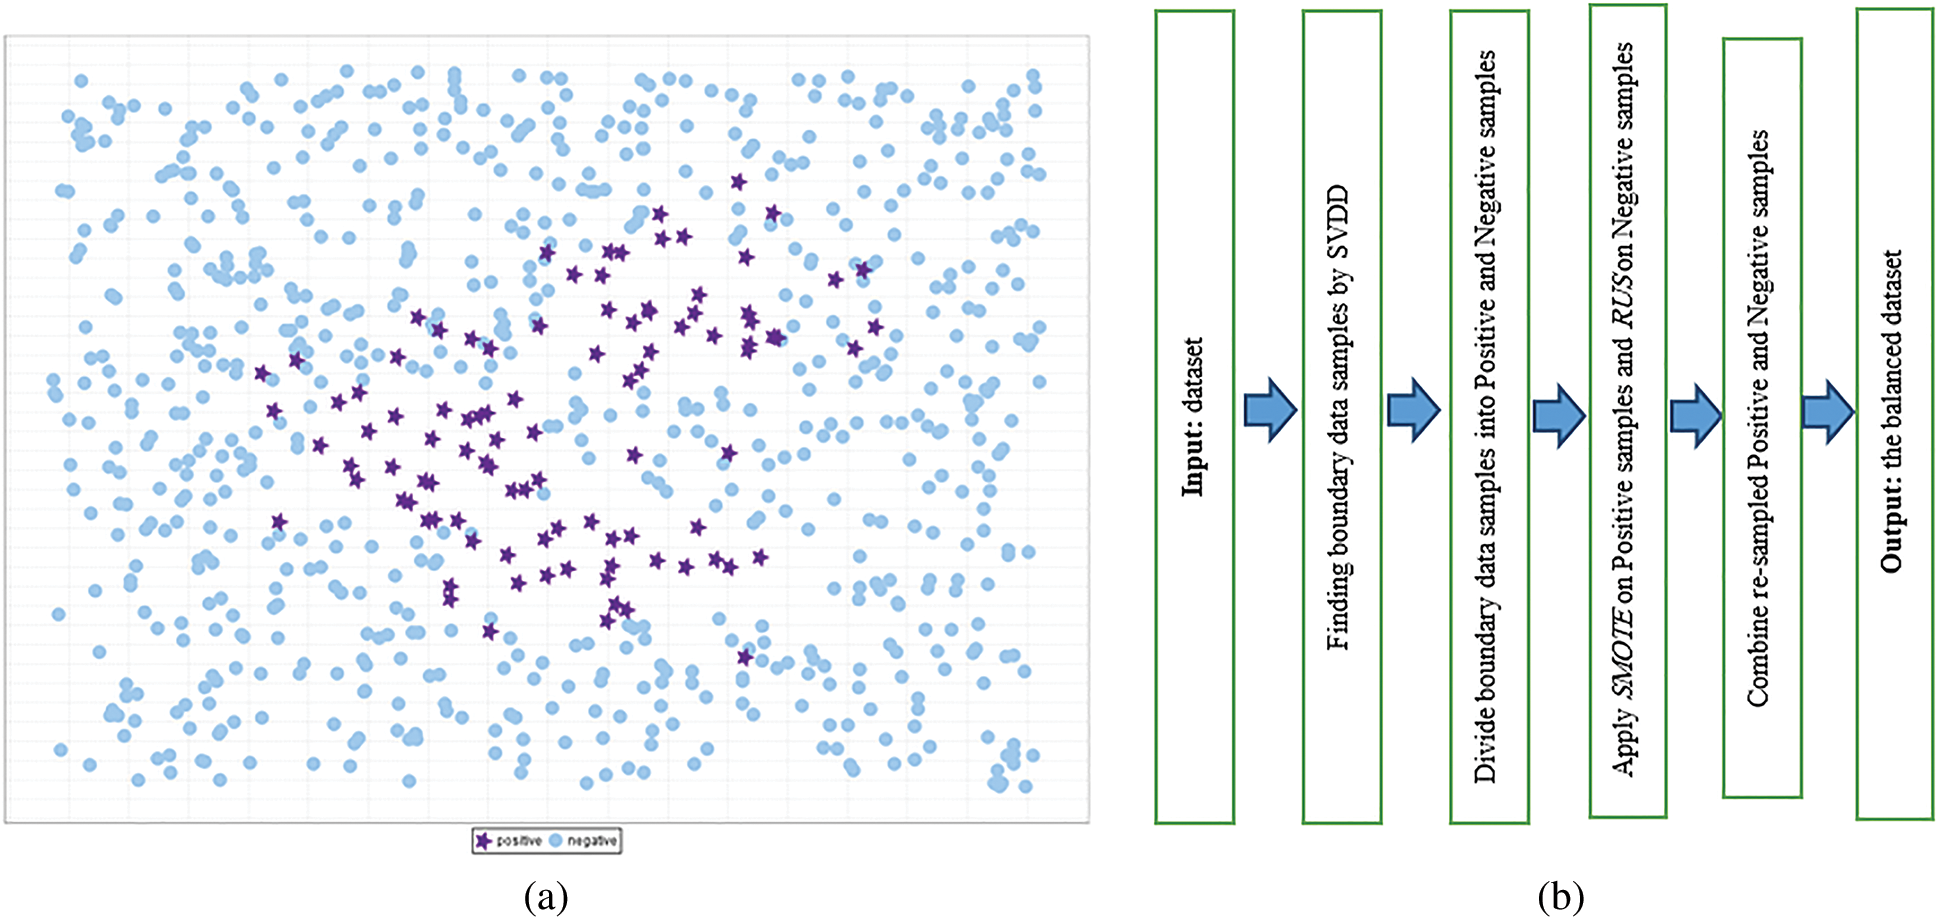
Figure 1: (a) An ID with one minority and one majority classes; (b) Flowchart of the proposed approach
The drawback in learning of IDs is that traditional classification algorithms are biased toward majority classes (negative samples). Consequently, increasing misclassification of samples in minority classes (positive samples) is likely. Recently, numerous solutions have been proposed to deal with the mentioned problem. The following definitions focus on some definitions needed for understanding these methods.
Cost-sensitive learning techniques: This type of solutions contains approaches at the data level, at the algorithmic level or at the both levels combined considering higher costs for the misclassification of examples of the positive class(es) (minority class(es)) with respect to the negative class(es) (majority class(es)). Most of the studies on the behavior of several standard classifiers in the ID domains have shown that significant loss of performance is mainly due to the skewed class distribution given by the imbalance ratio defined as the ratio of the number of instances in the majority class to the number of examples in the minority class [45].
Data sampling: In which the training instances are modified in a way to produce a more or less balanced class distribution that allows a basic classifier to perform in a similar manner to the standard classification. O-S and U-S techniques are applied on the training data distribution. The both techniques can be used for dealing with learning of IDs. Keep in mind that a change in training data distribution leads to biased training of dataset, because uniform misclassification costs are incurred. For example, the training dataset distribution is changed; the ratio of correct examples to false examples will change from 1:1 to 2:1. Accordingly, one example goes to misclassified class. Sampling is proposed for some reasons including: (a) First and the most important reason is that there is no need to administer cost-sensitive approach for all training algorithms. Therefore, only a learning-based approach is available, (b) There are numerous biased training datasets and the size of training dataset has to be reduced for academic learning, and (c) There is no precise cost defined for each misclassification.
Over-sampling: O-S is a process to extract a data superset from original set of minority class(es). It is a process of resampling or generating new examples from the existing ones in minority class(es).
Under-sampling: U-S is a process to extract a data subset from original set of majority class(es). It is a process of eliminating some of examples in majority class(es).
Artificial O-S techniques: Artificial O-S techniques (like SMOTE) are those that aim at increasing data samples of the minority class(es) to deal with effect of the low number of the samples in minority class(es) of ID. In this method, a set of synthetic data samples from minority class(es) are produced and then they are added to ID to be balanced. By producing an additional number of samples from minority class(es), traditional base classifiers, such as decision trees and support vector machine, artificial neural network, will be able to enhance their decision-making.
Ensemble methods: Ensemble classifiers are known as models with multiple classifiers. These methods aim at enhancing the performance of models with single classifiers. They generate multiple classifiers and combine them in order to introduce a new classifier having the capacity of all the combined classifiers in itself. The main idea is to develop multiple classifiers from the original dataset and then to sum up their predictions facing an unknown example. Ensemble methods are based on combination of ensemble learning algorithms using the techniques that are similar to the ones employed by cost-sensitive methods. A complete categorization of ensemble methods in ID problems has been recently introduced. Some ensemble methods, which have been specifically proposed for ID problems, are as follows [46]: (a) Easy Ensemble, (b) Balance Cascade, (c) Bagging-based method, (c.1) Over-Bagging (such as SMOTE Bagging), (c.2) Under-Bagging (such as Quasi-Bagging, Asymmetric Bagging, Roughly Balanced Bagging, and Bagging Ensemble Variation), (d) Boost methods, (d.1) Boost SMOTE, (d.2) Boost MSMOTE, (d.3) DataBoost-IM, (e) Cost-sensitive Boost methods, (e.1) AdaCost, (e.2) CSB, (e.3) CSB2, (e.4) RareBoost, (e.5) AdaC1, (e.6) AdaC2, (e.7) AdaC3.
In the following, the proposed method is introduced inspiring some of the mentioned methods using SVDD.
Seiffert et al. [47] have proposed a combined method called RUSBooST to reduce class errors. If the training dataset is an ID, achieving an efficient classifier may be challenging. Their paper studies the performance of RUSBooST in comparison to its components RUS and AdaBoost. They have indicated that RUSBooST outperforms RUS and AdaBoost in terms of classification accuracy. Additionally, RUSBooST is compared to another member of the same family, SMOTEBoost. The results are the same as that of SMOTE. The study shows the results for each basic learner with no sampling or bagging. This study proves that RUSBooST is a fast and simple algorithm with less complication in replacement compared to SMOTEBoost. SMOTEBoost has two major drawbacks: it is complicated to implement and time-consuming. The mentioned drawbacks could be solved replacing RUS by SMOTE.
Hajizadeh et al. [48] have studied the nearest neighbor classifier with locally weighted distance method (NNLWD). This study aims at promoting the performance of the nearest neighbor classifier in IDs without interrupting the original data distribution. The approach proposed in this study performs well in minority class(es). Also, it performs acceptable in majority class(es). The mentioned approach precisely classifies the samples of different classes. With regard to class distribution, each class is designated a weight. The distance between query examples and original examples has a direct relationship with the weight of the original examples. Using this approach, the examples with lower weights which are the nearest neighbors of new query examples have greater chances. Weighting which leads to better performance of nearest neighbors’ method is based on G-Mean. Generally, the study showed that O-S of minority class(es) and U-S of majority class(es) were useful in dealing with IDs. It also indicated that overuse of the two methods leads to some complications including loss of important information and over-fitting phenomenon.
Weiss et al. [45] have studied the comparison between cost-sensitive and sampling methods in dealing with IDs. Performance of a classification algorithm for a two-class problem (a problem which has only two classes: true or false) is evaluated. In the mentioned method, the optimized metric to investigate the classifier performance is the total costs if classification costs are miscalculated. In the mentioned study, the only metric is the total costs.
Chawla et al. [38] has studied AdaBoost algorithm to solve the ID problems. Synthetic minority O-S technique has been specifically designed to solve the imbalanced learning problems. In the mentioned study, SMOTEBoost has been incorporated with boost techniques in order to solve the imbalanced learning problems. Contrary to standard boost method designating equal weights for all misclassified examples, SMOTEBoost generates synthetic minority examples and directly changes the newly designated weights. It finally adjusts the skewed class distribution. In the given method, some synthetic minority examples are generated by operating on feature space. Having generated more synthetic minority examples, categorical training algorithms including decision tree have been applied. This study deals with the two features: continuous and discrete. For calculation of minority nearest neighbor, Euclidean distance is used and for continuous features and absolute-value distance is used for discrete features. Their proposed algorithm [38] uses the benefits of BOOST and SMOTE algorithms successfully. It is summarized as: “While BOOST algorithm enhances the prediction accuracy of classifiers focusing on complicated examples of all classes, SMOTE enhances the performance of minority example classifiers”.
Liu et al. [49] have studied the usability of decision tree in imbalanced learning problems. They have introduced a new decision tree. The decision tree of relative certainty enhanced the classifier performance. To produce a well-defined decision tree, the study started with data collection. C4.5 was used for measurement. It resulted in an explanation for why the final datasets skew toward the majority class. To solve the bias, a variable named CCP has been introduced. The newly introduced variable has been a basis for CCPDT. To develop statistically meaningful rules, a set of methods have been derived from bottom-up and top-down methods using Fisher test to prune the statistically meaningless branches. In their method, the statistical classifier performance enhanced and trees have faced balanced datasets. Their study geometrically and theoretically indicated that CCP is sensitive to class distribution. Accordingly, CCP is embedded in datasets to use the optimized variables in decision tree.
Chawla [50] has studied the IDs and sampling alternatives and also decision tree. A dataset has been considered imbalanced by him if the class(es) is(are) presented unequally. A question is posed in this study that what is the proper dataset distribution according to different dataset distributions? Observations show that normal data distribution is mostly the optimized distribution for classifier learning algorithm. Additionally, IDs lead to greater dispersion with regard to IDs in feature space. Therefore, O-S and U-S may lose their usability. Accordingly, this study frequently uses O-S and U-S along with synthetic minority sampling. In this study, C4.5 has been used for 3 sampling methods. The experimental analysis has aimed at evaluating the structural effects, estimation and sampling methods upon Area Under Curve (AUC).
SVDD [51] has a sphere borderline surrounding datasets. Similar to SVM, SVDD uses flexible kernel matrices. Generally speaking, data distribution description is of many advantages: first, it helps elimination of irrelevant and poor-defined data. Second, it is useful to classify datasets a class of which is well-sampled and another class is poor-sampled. Another advantage is the ability to compare datasets. Imagine a dataset is trained after multiple expensive stages have been completed. If there is a new dataset for the similar process, the two mentioned datasets can be compared. If the old and the new datasets are similar, training can be eliminated but if they are different, new training dataset would be obligatory.
Another work [52] has proposed to categorize majority examples into  -member classes, where
  ,
,  is number of negative samples and
  is number of positive samples. The
  partitions extracted from negative (majority) class are without overlapping. For each partition of negative class, we add all samples minority classes, and then an AdaBoost classifier is run. Finally, the obtained results for all
  datasets are incorporated.
Balanced Random Forest [53] abbreviated as BRF is different from Random Forest in that it uses balanced initiators. It also is different from under-sampling+random forest in which it pre-processes training datasets and then applies random forest.
ASYMBoost [54] is a cost-sensitive AdaBoost algorithm. In the mentioned algorithm  is defined as imbalanced surface.
  is the number of majority examples and
  is the number of minority examples. For each run of the mentioned algorithm, the positive example weight is multiplied by
  .
.  is the
  th repetition. In ASYM, all datasets are used as input.
Liu et al. [55] have conducted a study titled exploratory U-S for imbalanced class training to deal with imbalanced class problems. U-S is a popular method for ID problems using majority subsets. It leads to an efficient method. The mentioned study has aimed at proposing two methods to solve the ID problem. First known as easy ensemble derive multiple majority subsets for each of which a training algorithm is assigned. Then their results are incorporated. Second known as balance cascade trains the training algorithms consecutively. In this way, well-classified majority examples of each class would be eliminated from the given dataset at the next classification stage.
The family of Spider method [56] has been proposed to solve the problem of cost-sensitivity. To this end, majority class clearance stages are incorporated into minority class US.
In 2015, some researchers have proposed a new method to deal with ID problems [57]. Their method, KernelDASYN, has introduced an adaptive synthetic kernel matrix for IDs. In their method, an adaptive synthetic structure has been built-up for minority classes. Adaptive data distribution is estimated by kernel matrix and weighted by stiffness degree. In the mentioned method, a function named PDF is used to estimate likelihood density. After that, numerous potent classification methods have been recently proposed [58].
In [59], a new synthetic classification method has been proposed for ID problems. It is called ISEOMs. In the mentioned method, SOM-based learning modification is possible by searching the winner neuron based on energy function and by minimizing the local error at competitive learning stage. The current method has enhanced the classifier performance extracting knowledge from minority classes. Positive and negative examples of training phase are used for minority and majority classes, respectively. Positive SOM has been developed based on the original minority class.
In [60], some researchers have proposed a new method to design a balanced classifier on imbalanced training data based on margin distribution theory. Recently, Large margin Distribution Machine (LDM) has been put forward and it has obtained superior classification performance compared with Support Vector Machine (SVM) and many state-of-the-art methods. However, one of the deficiencies of LDM is that it easily leads to the lower detection rate of the minority class than that of the majority class on ID which contradicts to the needs of high detection rate of the minority class in the real application. In the mentioned paper, Cost-Sensitive Large margin Distribution Machine (CS-LDM) has been brought forward to improve the detection rate of the minority class by introducing cost-sensitive margin mean and cost-sensitive penalty.
In [61], the performance of a novel method, Parallel Selective Sampling (PSS), has been assessed. It is able to select data from the majority class to reduce imbalance in large datasets. PSS was combined with the Support Vector Machine (SVM) classification. PSS-SVM has showed excellent performances on synthetic datasets, much better than SVM. Moreover, it has been shown that on real datasets PSS-SVM classifiers had performances slightly better than those of SVM and RUSBoost classifiers with reduced processing times. In fact, their proposed strategy was conceived and designed for parallel and distributed computing. In conclusion, PSS-SVM is a valuable alternative to SVM and RUSBoost for the problem of classification by huge and imbalanced data, due to its accurate statistical predictions and low computational complexity.
In [62] some researchers have proposed a feature learning method based on the autoencoder to learn a set of features with better classification capabilities of the minority and the majority classes to address the imbalanced classification problems. Two sets of features are learned by two stacked autoencoders with different activation functions to capture different characteristics of the data and they are combined to form the Dual Autoencoding Features. Samples are then classified in the new feature space learnt in this manner instead of the original input space.
In [63], the authors have described preprocessing, cost-sensitive learning and ensemble techniques, carrying out an experimental study to contrast these approaches in an intra and inter-family comparison. They have carried out a thorough discussion on the main issues related to using data intrinsic characteristics in this classification problem. This has helped them to improve the given models with respect to: the presence of small disjuncts, the lack of density in the training data, the overlapping between classes, the identification of noisy data, the significance of the borderline instances, and the dataset shift between the training and the test distributions. Finally, they have introduced several approaches and recommendations to address these problems in conjunction with ID, and they have shown some experimental examples on the behavior of the learning algorithms on data with such intrinsic characteristics.
A geometric structural ensemble (GSE) has been introduced [64]. GSE partitions instances of majority class and then eliminates useless instances through constructing a hypersphere using the Euclidean criterion. By repeating the mentioned task, the simple models will be created.
According to the previous sections, the classification algorithms well-tuned for ID outperform the conventional classification methods. The current study aims at introducing a new method well-tuned for ID that is based on O-S concept (like methods such as SMOTE) and also U-S concept (like methods such as RUS). It uses SVDD to find the borderline (or error-prone) data samples. Then, using the mentioned data samples, we introduce a hybrid O-S and U-S mechanism. The study uses a different method for ID classification.
SMOTE and RUS-based borderline finding techniques and classifiers including RF, IBK and AdaBoost have been used in the proposed method. The proposed method approaches the predefined goal focusing on the desired classification accuracy. The final results have been significantly optimized. Before introducing the complete description of the proposed method, the three classification frameworks used in this method are briefed.
Random Forest (RF) [53] is a concept of random-decision forest. RF is an ensemble learning method for classification conducting the classification process by building a number of decision trees during its training phase. The output aims at determining class tag of test instances. As a matter of fact, RF solves the problem of the decision tree over-fitting to training dataset. AdaBoost [65] can be used in combination with other learning algorithms to enhance the performance of those algorithms. The outputs of other simple learning algorithms are incorporated into weights to provide a powerful synthetic output. AdaBoost is called adaptive because the next poor-learning algorithms easily find the misclassified instances. AdaBoost is sensitive to noise and irrelevant data. IBK is a k-nearest-neighbors classifier using the attribute of distance. The number of  in the k-nearest neighbors (the default is
  ) can be clearly described. Predictions related to more than one neighbor can be assigned to different weights based on their distances from the test example. The mentioned algorithm proposes two relationships for changing distance into weight. The number of training examples holding with classifier is limited. Generally speaking, there is a data distribution description for each dataset. The data distribution description means the location of dataset examples in feature space based on features of each example. The current study is started by dividing data samples into healthy and unhealthy groups through classification task. Healthy samples are those accurately classified and unhealthy ones are those wrongly classified. In different datasets, there would be some misclassified samples or wrongly dropped samples locating near to or on the borderline between classes. This study aims at finding these borderline samples using SVDD. After the borderline samples have been identified, the process aims at resampling of borderline data samples to find a novel balanced dataset. Finally, well-known classifiers come into help to classify the novel balanced dataset. Keep in mind that the proposed method uses 80% of data as training data and 20% of data as test data. This section introduces SVDD and resampling methods along with our solution to ID classification. As mentioned before, the present method finds the borderline samples using SVDD. SVDD receives a dataset as input to determine the kernel using kernel matrix. The next step aims at finding the dataset borderline denoted by
  . Then, each sample distance from kernel is calculated. It is obvious that samples near to
  are called borderline samples. Borderline samples are classified into two groups: positive samples (the samples with class values equal to 1) and negative samples (the samples with class values equal to 0). According to ID features, negative samples outnumber positive ones. So, positive samples undergo O-S and negative ones undergo U-S to balance the dataset. The balanced dataset is a novel dataset. Then, the novel dataset is classified. The pseudo codes of the mentioned algorithms are described as follows. In SVDD, a constant named sigma is required as cross-sectional variable in kernel radial basis matrix. This study achieves the optimized numerical value of 23 after assigning different values to the sigma parameter. The proposed approach has summarized in Fig. 1b. SMOTE pseudo code is presented in Fig. 3. SMOTE has been described in Section 2. In the following, RUS and SVDD are shown in Fig. 3. Fig. 3 also shows the proposed algorithm composing of the three above methods.
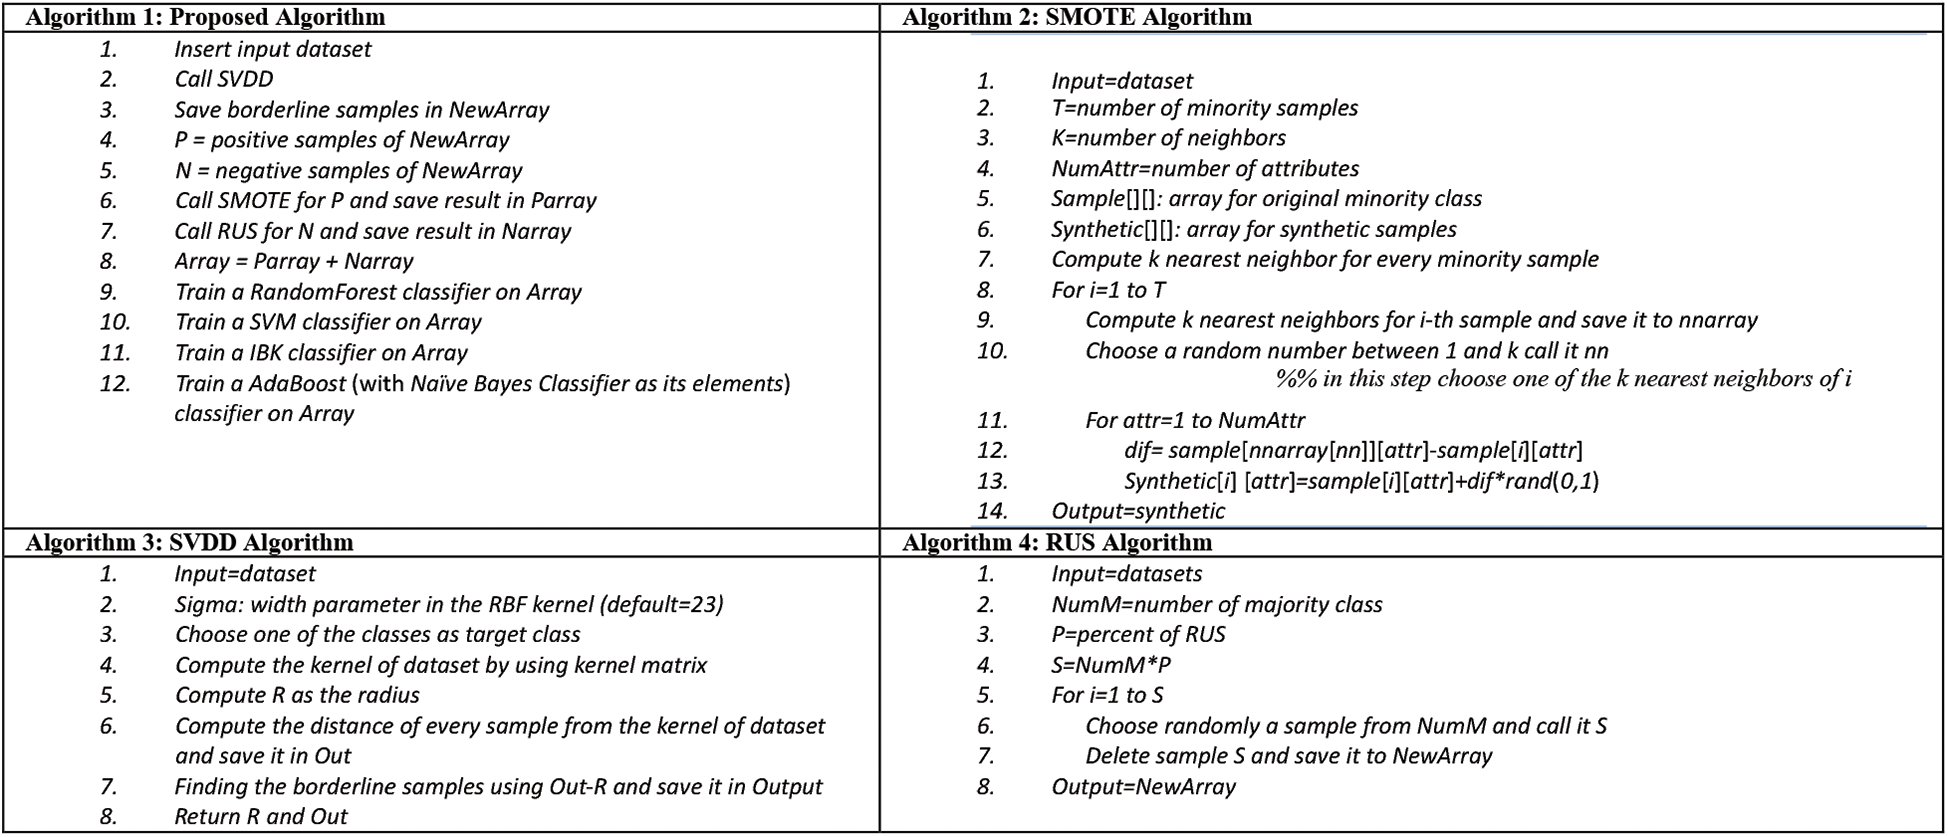
Figure 3: Pseudo codes of SMOTE, RUS and SVDD
There are different methods to evaluate the classification quality. The current study uses AUC, F-measure and G-mean. Classification accuracy ranges from 0 to 1 meaning whether a data is accurately classified or not. Most of the classifiers determine the uncertainty with roughly estimated values. To calculate accuracy, a threshold boundary has to be defined. The average threshold boundary is 0.5. Assume that there is a classifier being able to provide correct answers for all questions. Assume threshold 0.7 leads to 100 correct answers for negative samples and threshold 0.9 results in 100 correct answers for positive ones. Under the predefined condition, choosing threshold 0.8 leads to undesirable results neither for negative samples nor positive samples. But, threshold 0.8 can be a good value for threshold. Keep in mind that AUC considers all possibilities for threshold. Different threshold values result in different true positive and false positive values. The greater the threshold value, the greater true positive value. Different definitions point to the area under curve as AUC. The point is that AUC is not defined as the area under the ROC curve. In case of IDs, AUC is useful to call curve accuracy. The AUC values are calculated as  . F-Measure uses precision and calls to retrieve information. It is obvious that the greater value of F-Measure leads to higher classification quality. Geometric mean (or G-Mean) in mathematics is an effective method to find the centroid attitude of a dataset by their values multiplication. The advantage of G-mean is that real values of members are not required to be defined. G-mean is calculated as:
  , where
  shows the true positive rate and
  indicates the true negative rate. To have the optimized comparison between results of different datasets, the time period needed to run various algorithms on various datasets to obtain the assumed answer is summarized as a timetable. Among various methods for statistical test, paired k-hold-out t-test has been chosen [66]. In the t-test, experimental
  is calculated and compared to real
  considering the confidence interval of 0.05. If estimated
  is bigger than real
  , there is meaningful difference.
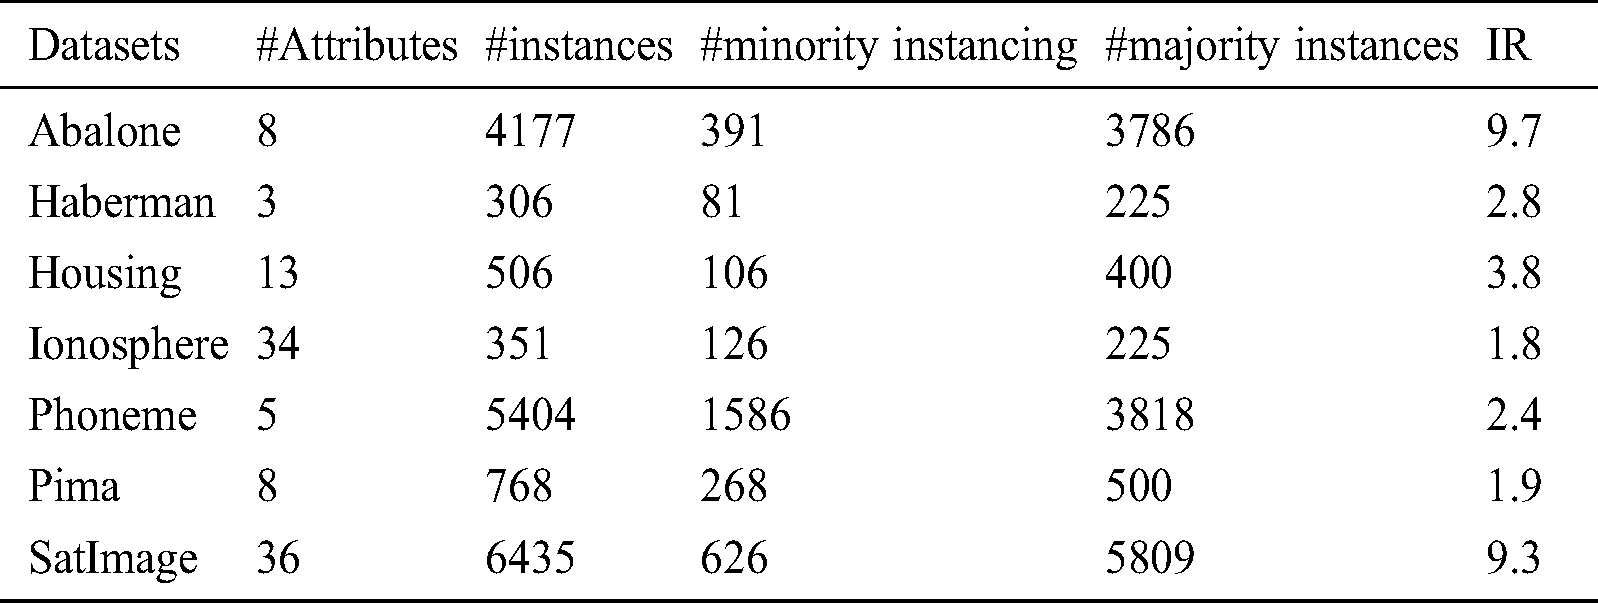
This section aims at evaluating the results of the proposed calcification algorithm. The results of the proposed and the previous state-of-the-art algorithms are compared in terms of F-measure, G-mean and AUC. In the current study, some of the datasets frequently used for ID problems are experimented; including Pima, Abalone, Haberman, Housing, Phoneme, SatImage and Ionosphere. They have been studied in the previous studies. These datasets are extracted from UCI [67] and their details are given in Tab. 1.
Table 1: Datasets and their detailed features
In the following, the proposed method is compared to the previous state-of-the-art methods. Fig. 4 provides the results of the proposed method based on the evaluated measures in comparison to other methods. The compared methods are Bagging [68], AdaBoost [65], SMOTE [39], Borderline-SMOTE [39], KernelADASYN [57], RF [53], BRF [53], Under-RF [53], Over-RF [53], Asym [55], Easy [56,69] and Cascade [56,69]. Split-balancing and cluster-balancing [70] are compared in three different classification models. Borderline-SMOTE used in the paper has been the method mentioned “borsmote1” by their authors and the sampling is done so as to equally balance the both classes.
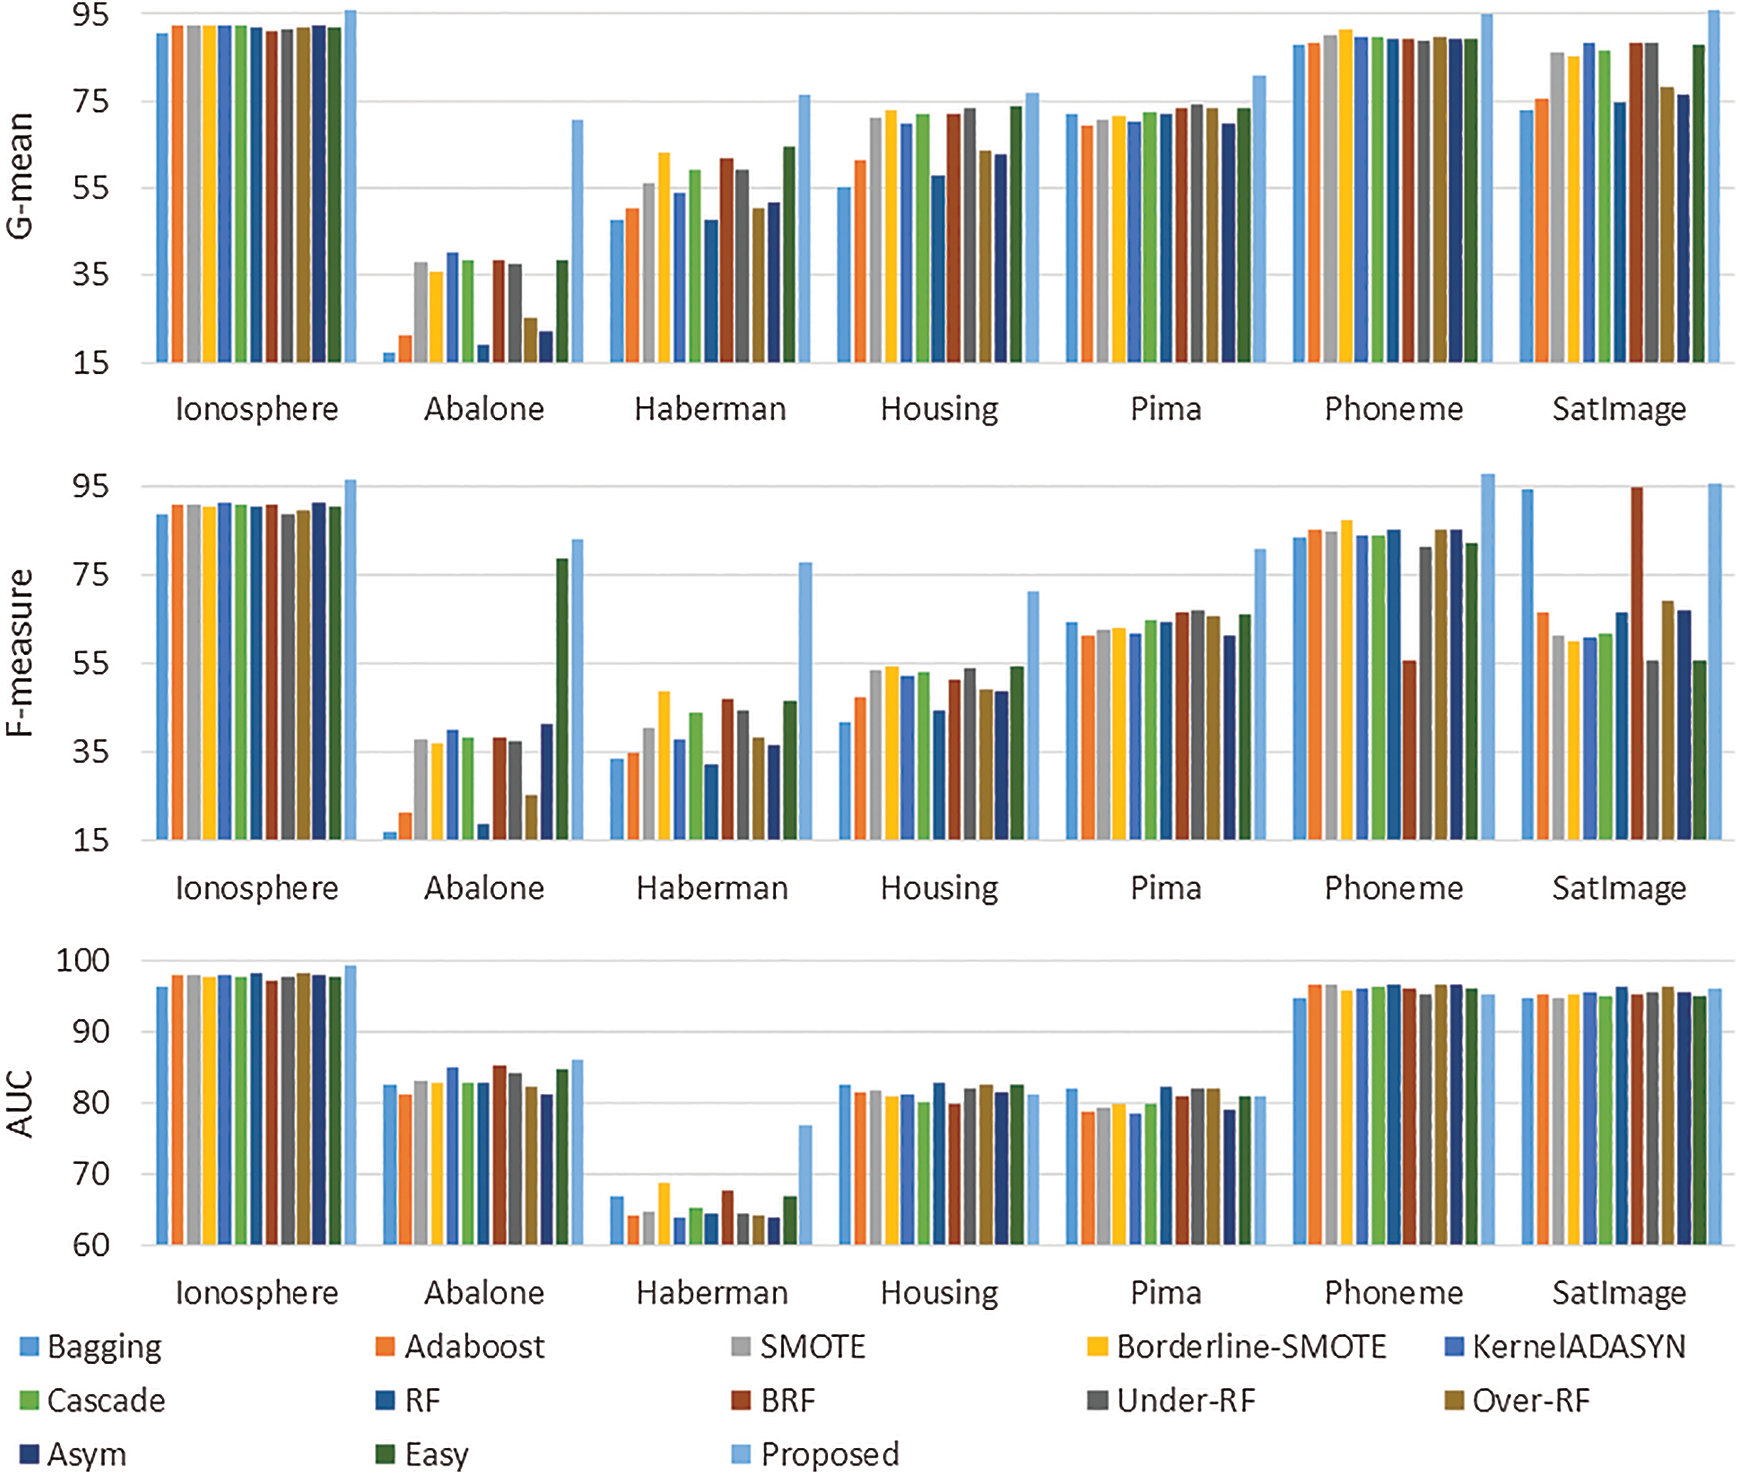
Figure 4: The results of the proposed method in comparison with other methods
According to Fig. 4, the proposed method is superior to the state-of-the-art methods in the Ionosphere, Abalone and Haberman benchmarks in terms of F-measure, G-mean and AUC. But it fails to be superior to some the state-of-the-art methods in the Housing, Pima, Phoneme and SatImage benchmarks in terms of AUC. Tab. 2 shows the results of 100 runs of the proposed algorithm on the datasets given in Tab. 1 in terms of F-measure, G-mean and AUC.
According to Tab. 2, F-measure, G-mean and AUC obtained after 100 runs of various algorithms are summarized and SVDD is known for providing the optimized mean value. Tab. 3 indicates the AUC mean obtained via split-balancing and cluster-balancing. Tab. 3 summarizes the results of each method based on RF, SMO and IBK as basic classifier.
Table 2: The results averaged over 100 independent runs of different methods (the results are also averaged over all benchmark datasets)
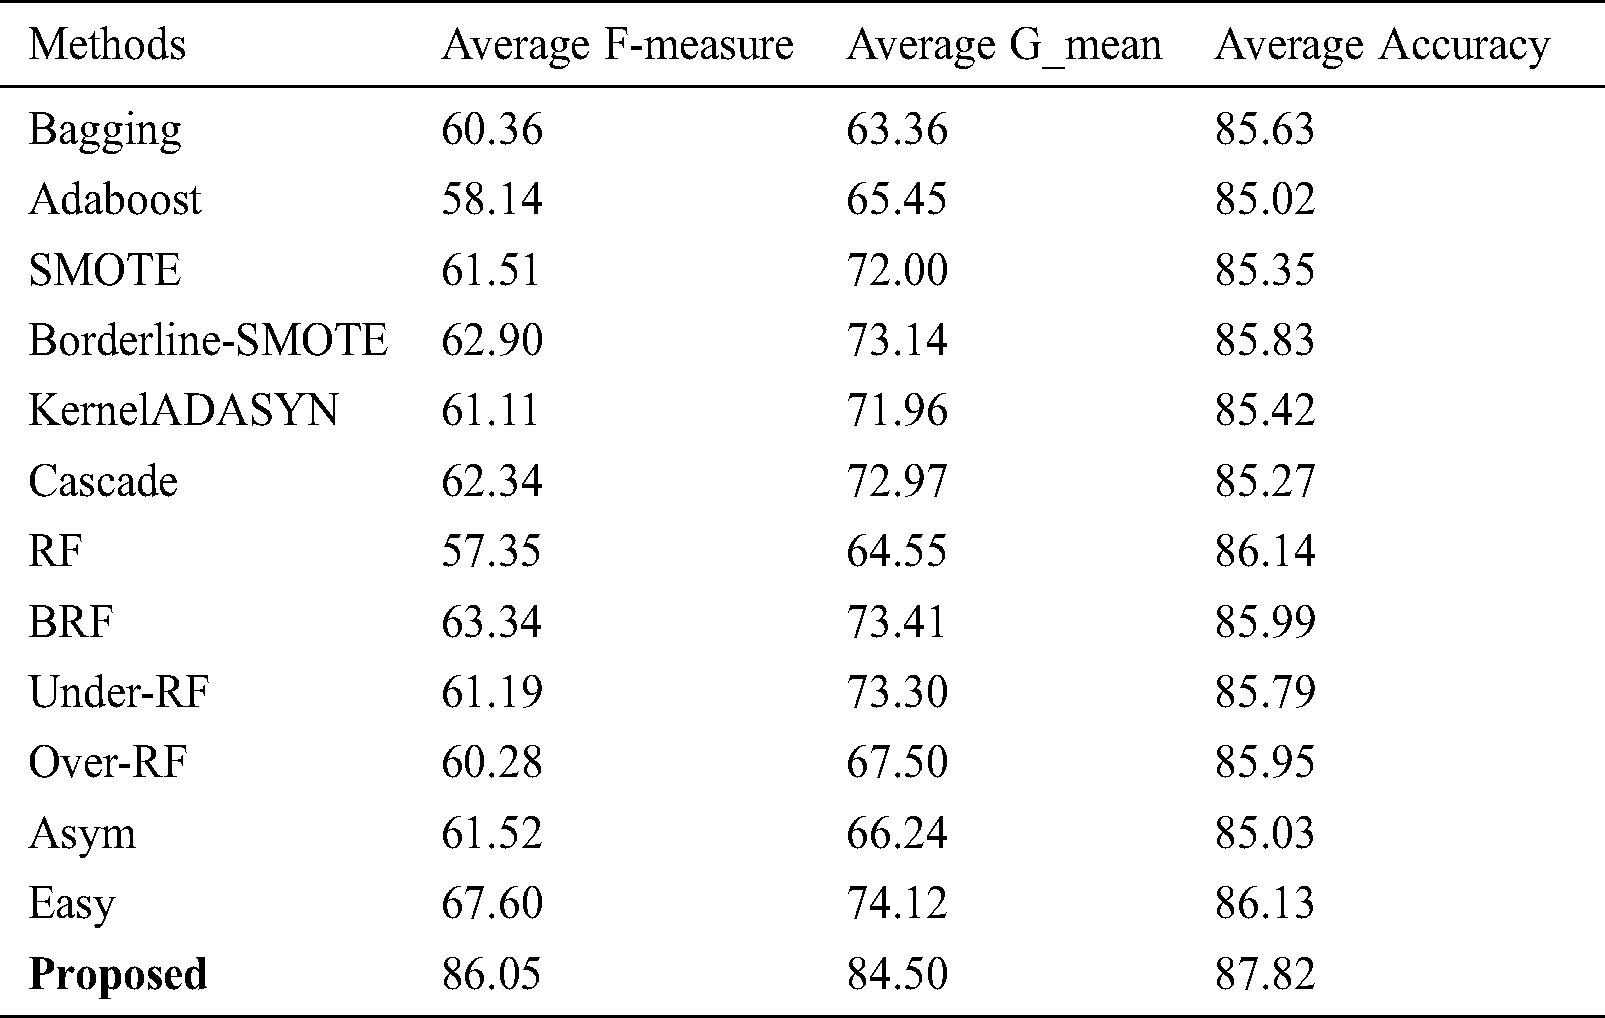
Table 3: AUC mean values obtained via Split-balancing and Cluster-balancing and its comparison to other methods (the results are also averaged over all benchmark datasets)
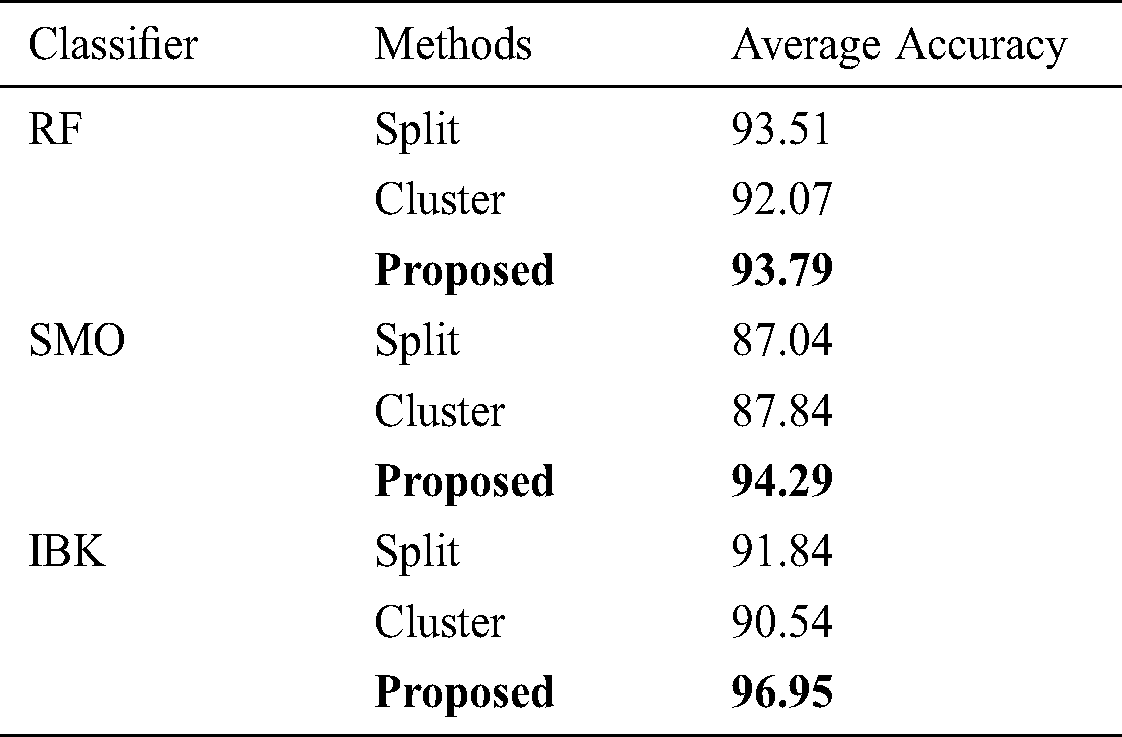
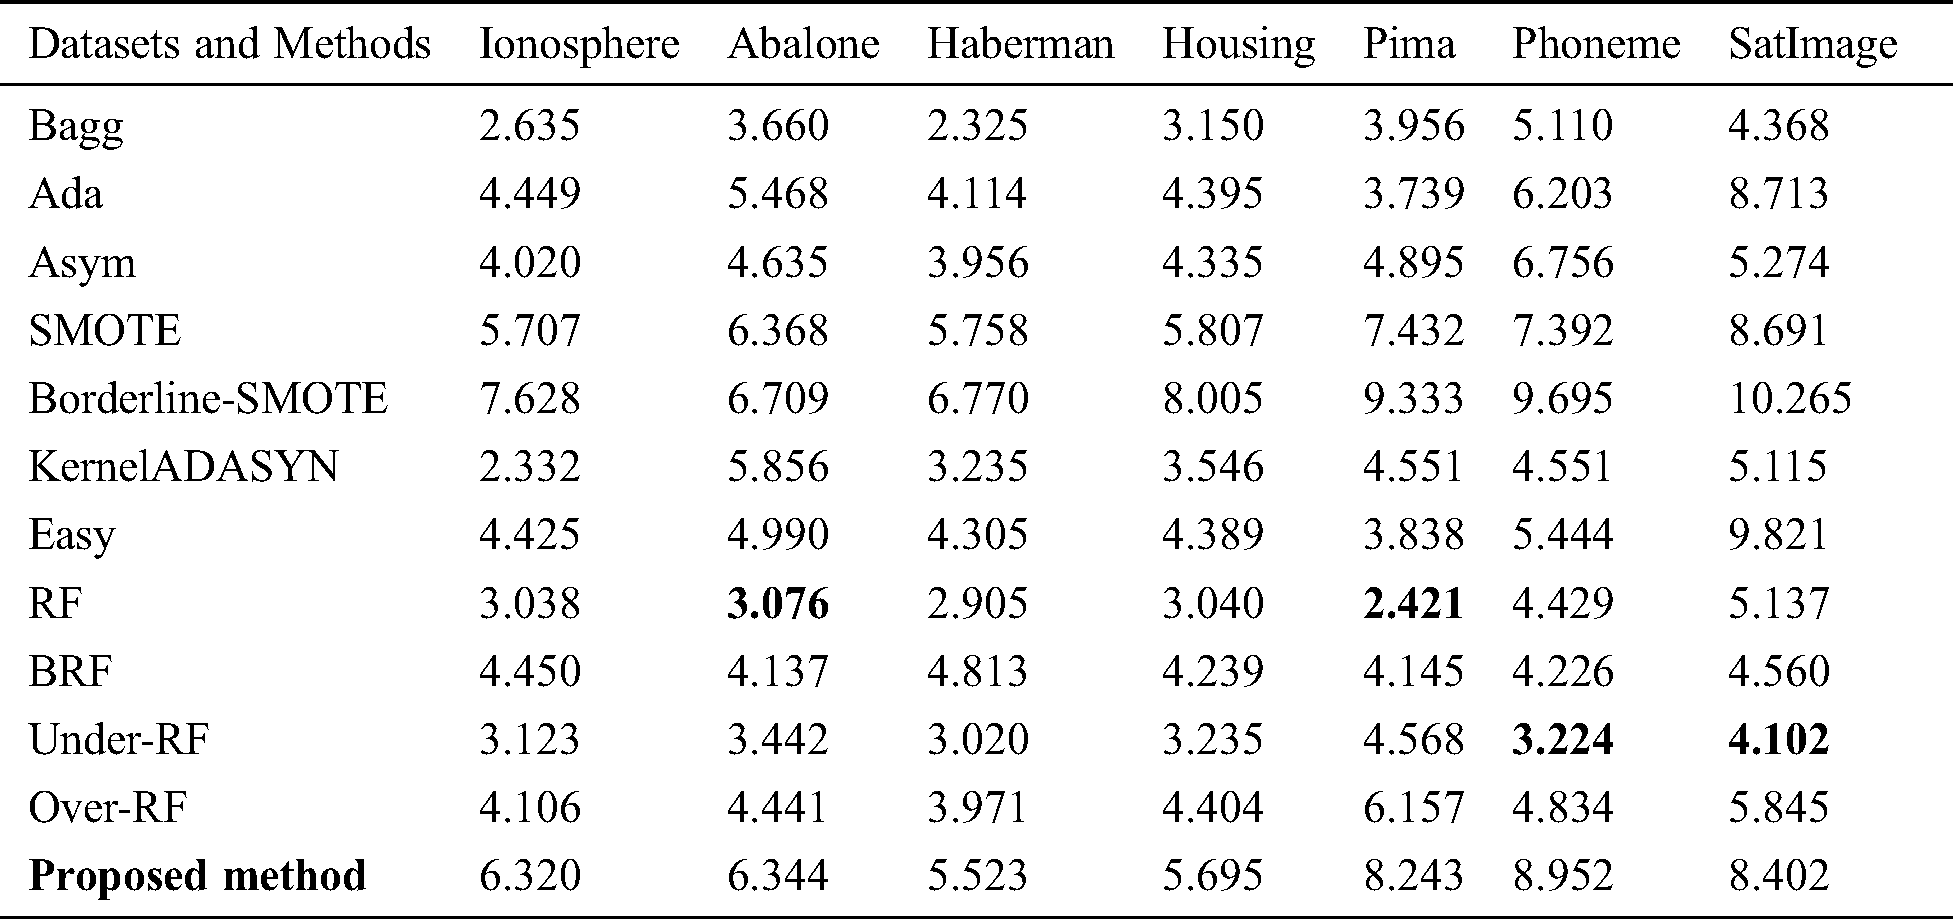
According to Tab. 3, the proposed method provides the optimized performances for all of basic classifiers such as RF, SMO and IBK. Tab. 4 introduces the results of t-test run on the proposed method in comparison with other methods using various datasets. Let’s assume the number of the methods that are meaningfully outperformed by any given method is  . Let’s also assume the number of the methods that meaningfully outperform that given method is
  . Each number in Tab. 4 for a method indicates its
  .
.
Table 4: Summary results of t-test on the proposed method in comparison with other state-of-the-art methods
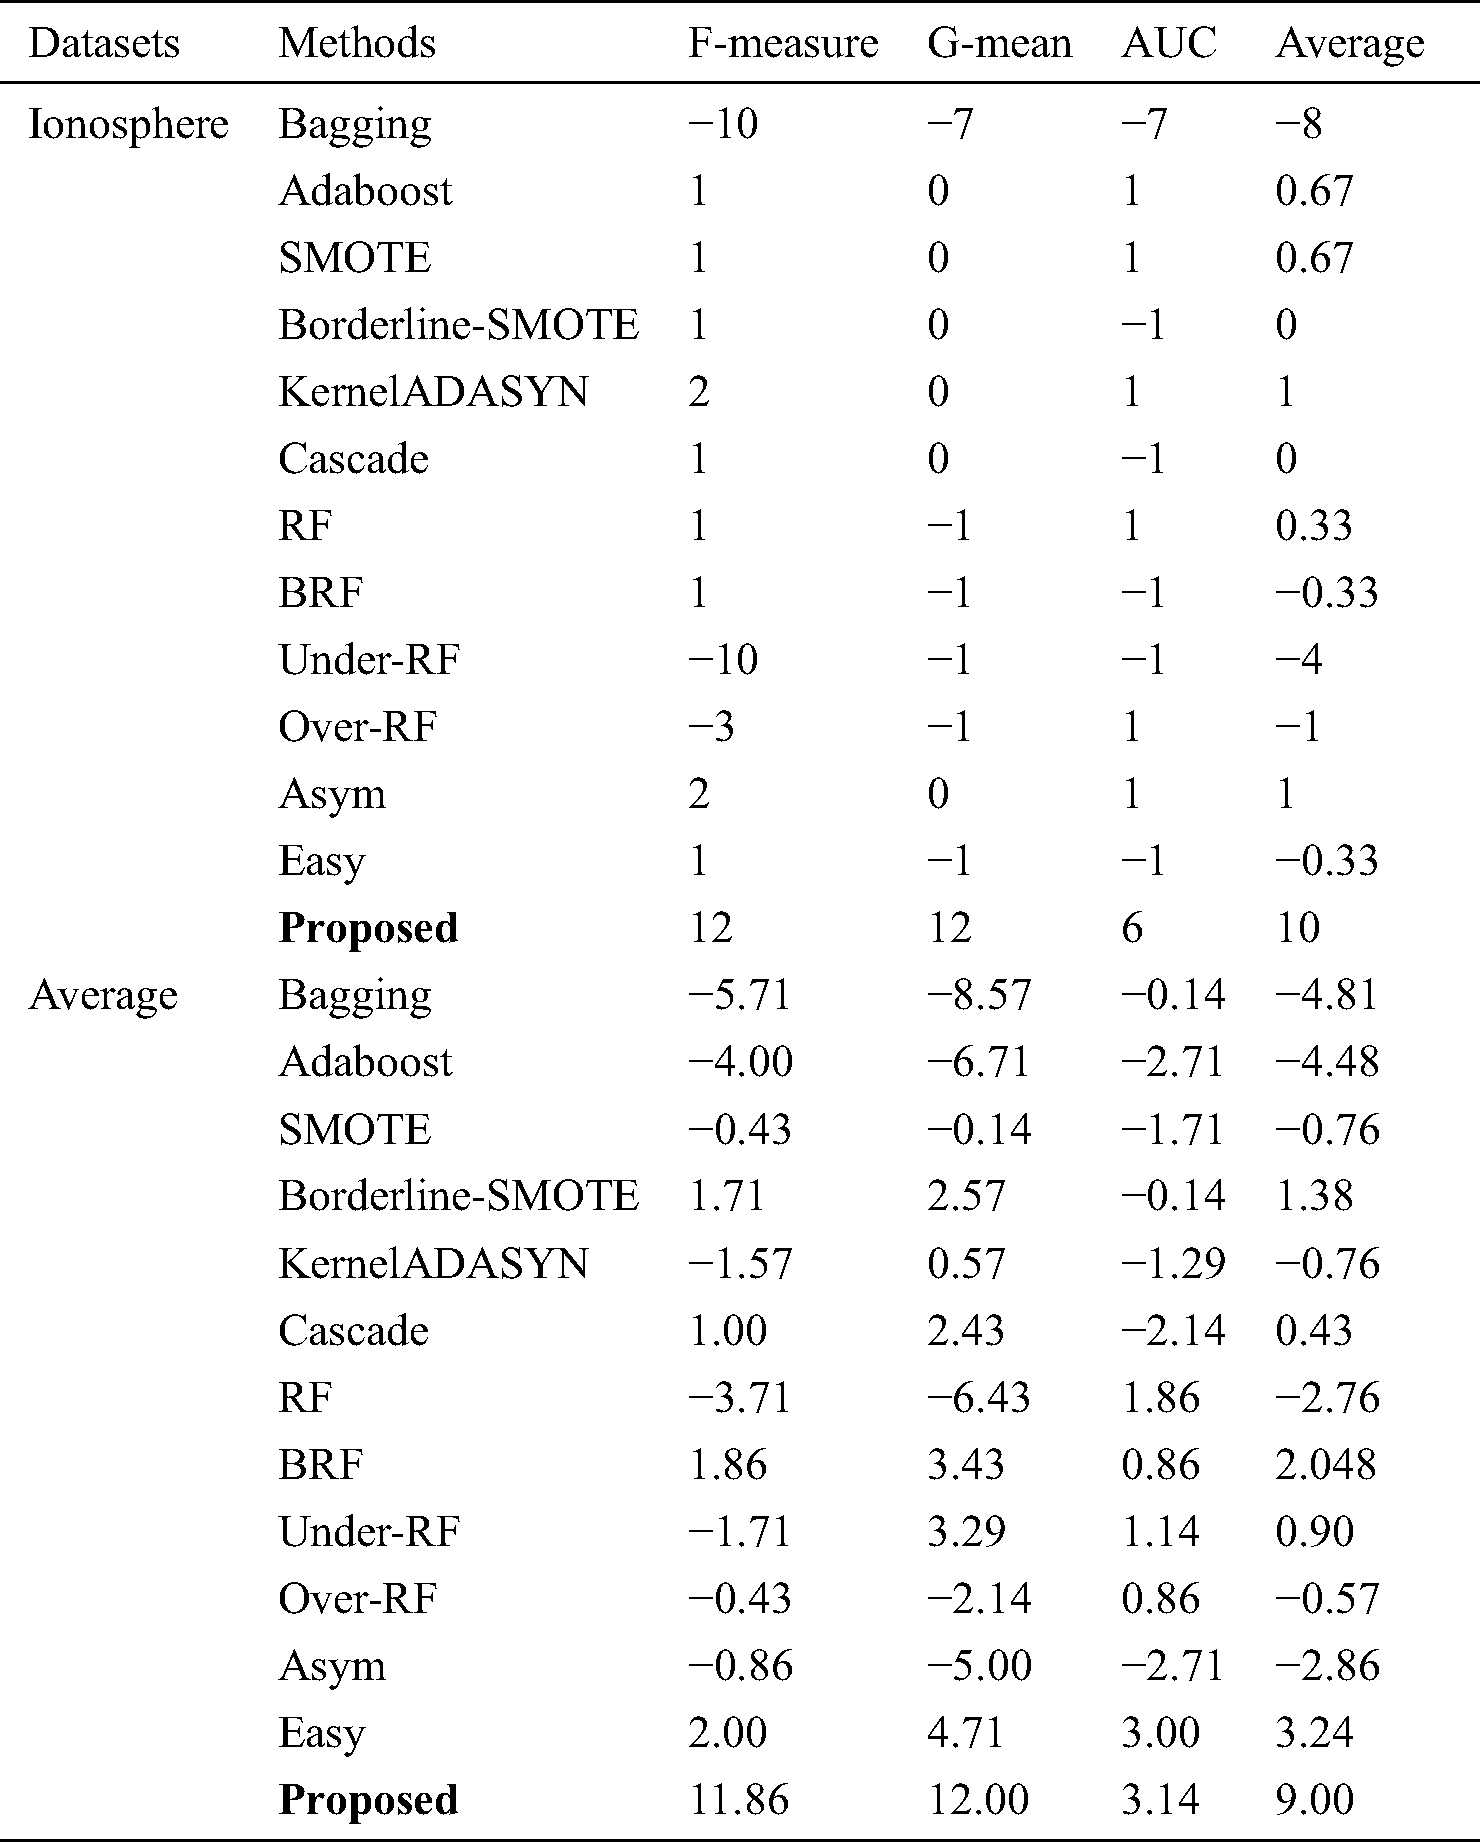
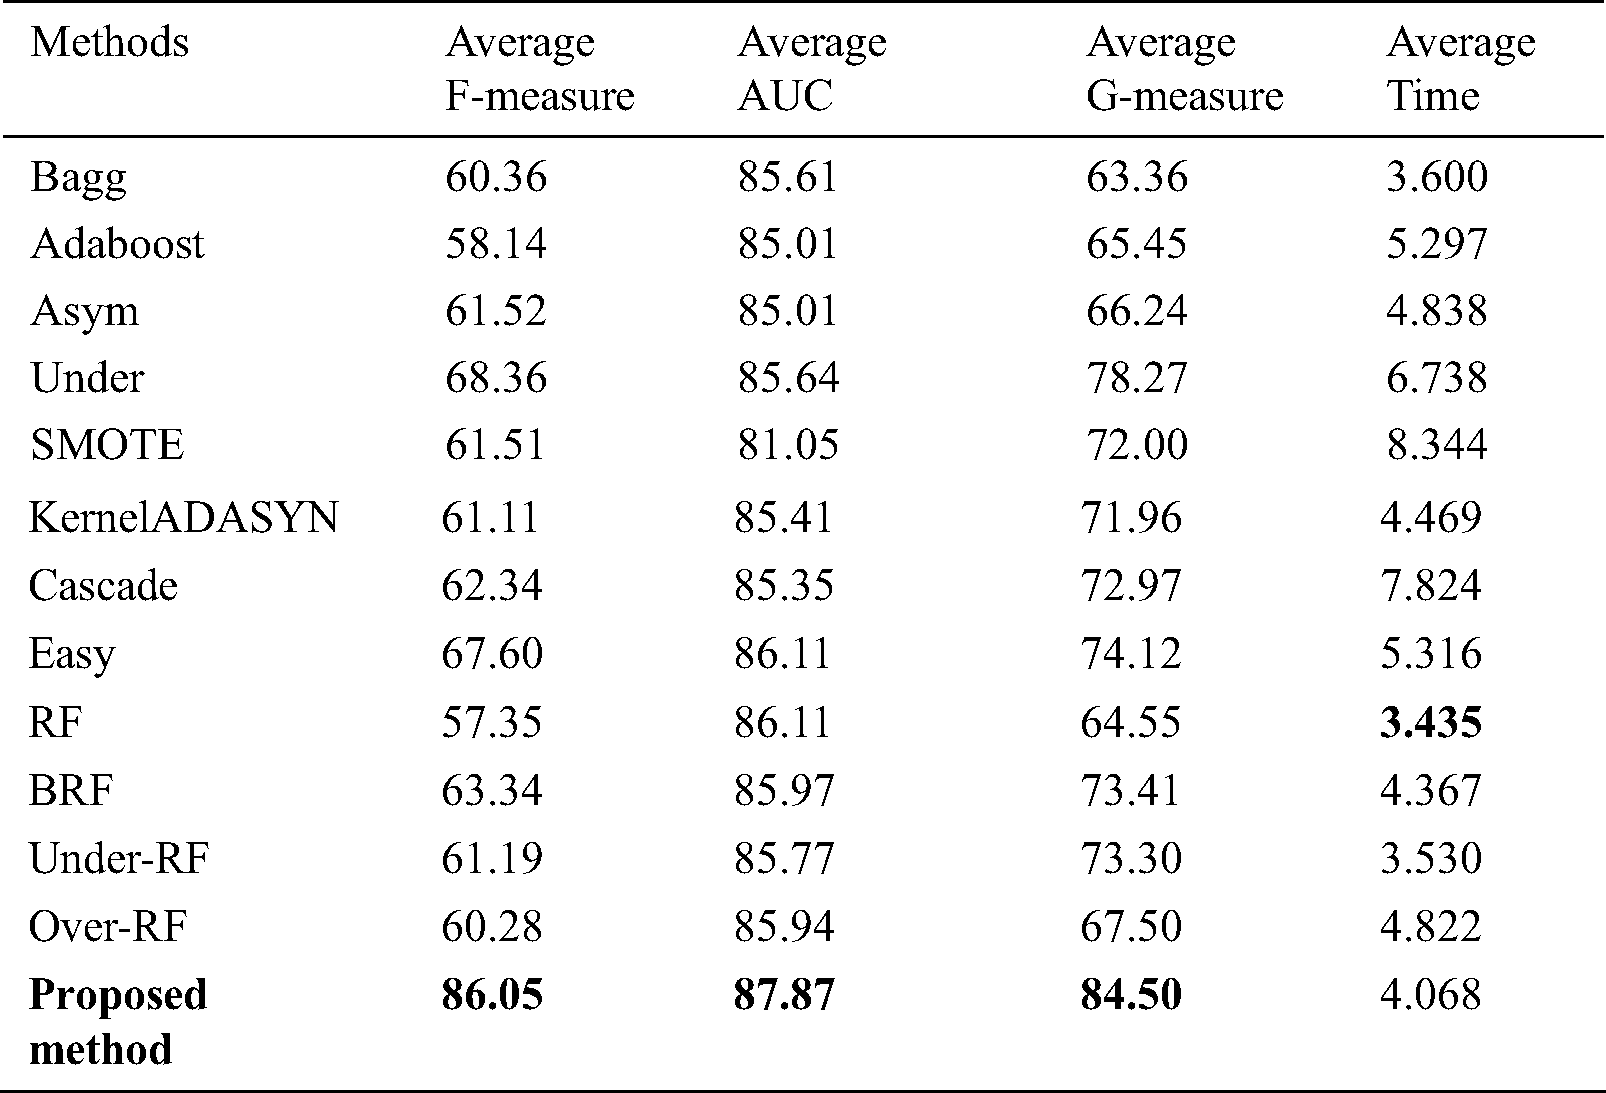
Tab. 4 shows the relationship between methods and datasets. It is obvious that the most meaningful relationship has been found between the proposed method and datasets. Tab. 5 shows the time required to run the algorithm in comparison with other methods averaged on all datasets. According to Tab. 5, the proposed algorithm takes longer time to run in comparison with other state-of-the-art methods because it preprocesses datasets many times. Tab. 5 also summarizes mean values of F-Measure, G-mean and AUC.
Table 5: Mean values for F-Measure, AUC, G-measure, and consumed time
Tab. 6 shows the time required to run the proposed algorithm in comparison with other state-of-the-art methods on each dataset mentioned in Tab. 1.
Table 6: The time required to run the algorithms on each mentioned dataset
Data mining is frequently used in various scientific fields. It has been recently developed. One of the tasks in data mining is considered to be classification. Nowadays, an obstacle that classification algorithms face is IDs. Simple classification algorithms will not be applicable if the dataset contains at least two classes, one with very numerous data samples (called also majority class) and one with a few samples (called also minority class). Two common approaches widely used to tackle with the ID problem are O-S and U-S. A shared disadvantage of all U-S methods is the elimination of useful samples. A shared drawback of O-S methods is that they can be the reason of over-fitting occurrence.
The proposed solution to the mentioned problems is borderline resampling in the current study. To accomplish the mentioned solution, the current study aims at focusing on the error-prone data samples (the samples that highly likely are misclassified). The mentioned samples are located on the borderline between classes. To find the error-prone data samples, Support Vector Data Description (SVDD) has been employed.
Therefore, the primary aim is to find these datasets to run O-S and U-S. Finally, the new dataset can be classified using various traditional classification methods. The results are compared to the previous ones to show that the current method is superior to the previous stat-of-the-art ones. According to experimental result analysis section, the proposed algorithm provides better values in terms of F-measure, G-mean and AUC. For future studies, it is recommended to run the proposed algorithm using KNN. Advantages of this method are its simplicity, efficacy and cost-effectiveness of learning process.
Funding Statement: This study is supported by grants to HAR and HP. HAR is supported by UNSW Scientia Program Fellowship and is a member of the UNSW Graduate School of Biomedical Engineering.
Conflicts of Interest: The authors declare that they have no conflicts of interest.
1. H. Niu, N. Khozouie, H. Parvin, H. Alinejad-Rokny, A. Beheshti. (2020). et al., “An ensemble of locally reliable cluster solutions,” Applied Sciences, vol. 10, no. 5, pp. 1891. [Google Scholar]
2. M. R. Mahmoudi, M. Mahmoudi and A. Pak. (2019). “On comparing, classifying and clustering several dependent regression models,” Journal of Statistical Computation and Simulation, vol. 89, no. 12, pp. 2280–2292.
3. A. R. Abbasi, M. R. Mahmoudi and Z. Avazzadeh. (2018). “Diagnosis and clustering of power transformer winding fault types by cross-correlation and clustering analysis of FRA results,” IET Generation, Transmission & Distribution, vol. 12, no. 19, pp. 4301–4309.
4. S. B. Rodzman, S. Hasbullah, N. K. Ismail, N. A. Rahman, Z. M. Nor. (2020). et al., “Fabricated and Shia Malay translated hadith as negative fuzzy logic ranking indicator on Malay information retrieval,” ASM Science Journal, vol. 13, no. 3, pp. 100–108.
5. M. M. Abdulnabi, R. Hassan, R. Hassan, N. E. Othman and A. Yaacob. (2018). “A fuzzy-based buffer split algorithm for buffer attack detection in internet of things,” Journal of Theoretical and Applied Information Technology, vol. 96, no. 17, pp. 5625–5634.
6. M. A. A. M. Zainuri, E. A. Azari, A. A. Ibrahim, A. Ayob, Y. Yusof. (2019). et al., “Analysis of adaptive perturb and observe-fuzzy logic control maximum power point tracking for photovoltaic boost DC-DC converter,” International Journal of Advanced Trends in Computer Science and Engineering, vol. 8, no. 1. 6, pp. 201–210.
7. Z. M. Rodzi and A. G. Ahmad. (2020). “Fuzzy parameterized dual hesitant fuzzy soft sets and its application in TOPSIS,” Mathematics and Statistics, vol. 8, no. 1, pp. 32–41.
8. A. M. S. Bahrin and J. M. Ali. (2020). “Hybrid fuzzy-disturbance observer for estimating disturbance in styrene polymerization process,” IOP Conference Series Materials Science and Engineering, vol. 778, no. 1, pp. 012089.
9. E. Dodangeh, B. Choubin, A. N. Eigdir, N. Nabipour, M. Panahi. (2020). et al., “Integrated machine learning methods with resampling algorithms for flood susceptibility prediction,” Science of the Total Environment, vol. 705, 135983.
10. B. Choubin, M. Abdolshahnejad, E. Moradi, X. Querol, A. Mosavi. (2020). et al., “Spatial hazard assessment of the PM10 using machine learning models in Barcelona, Spain,” Science of the Total Environment, vol. 701, 134474. [Google Scholar]
11. B. Choubin, A. Mosavi, E. H. Alamdarloo, F. S. Hosseini, S. Shamshirband. (2019). et al., “Earth fissure hazard prediction using machine learning models,” Environmental research, vol. 179, 108770. [Google Scholar]
12. S. Qummar, F. G. Khan, S. Shah, A. Khan, S. Shamshirband. (2019). et al., “A deep learning ensemble approach for diabetic retinopathy detection,” IEEE Access, vol. 7, pp. 150530–150539.
13. B. Choubin, M. Borji, A. Mosavi, F. Sajedi-Hosseini, V. P. Singh. (2019). et al., “Snow avalanche hazard prediction using machine learning methods,” Journal of Hydrology, vol. 577, pp. 123929.
14. S. Shamshirband, E. J. Nodoushan, J. E. Adolf, A. A. Manaf, A. Mosavi. (2019). et al., “Ensemble models with uncertainty analysis for multi-day ahead forecasting of chlorophyll a concentration in coastal waters,” Engineering Applications of Computational Fluid Mechanics, vol. 13, no. 1, pp. 91–101.
15. S. Golzari, M. N. Zardehsavar, A. Mousavi, M. R. Saybani, A. Khalili. (2019). et al., “KGSA: A gravitational search algorithm for multimodal optimization based on k-means niching technique and a novel elitism strategy,” Open Mathematics, vol. 16, no. 1, pp. 1582–1606.
16. S. M. J. Jalali, S. Ahmadian, A. Khosravi, S. Mirjalili, M. R. Mahmoudi. (2020). et al., “Neuroevolution-based autonomous robot navigation: a comparative study,” Cognitive Systems Research, vol. 62, pp. 35–43.
17. M. Maleki, D. Wraith, M. R. Mahmoudi and J. E. Contreras-Reyes. (2020). “Asymmetric heavy-tailed vector auto-regressive processes with application to financial data,” Journal of Statistical Computation and Simulation, vol. 90, no. 2, pp. 324–340.
18. M. H. Heydari, A. Atangana, Z. Avazzadeh and M. R. Mahmoudi. (2020). “An operational matrix method for nonlinear variable-order time fractional reaction-diffusion equation involving Mittag-Leffler kernel,” European Physical Journal Plus, vol. 135, no. 2, pp. 1–19.
19. A. R. Soltani, A. R. Nematollahi and M. R. Mahmoudi. (2019). “On the asymptotic distribution of the periodograms for the discrete time harmonizable simple processes,” Statistical Inference for Stochastic Processes, vol. 22, no. 2, pp. 307–322.
20. M. H. Heydari, Z. Avazzadeh and M. R. Mahmoudi. (2019). “Chebyshev cardinal wavelets for nonlinear stochastic differential equations driven with variable-order fractional Brownian motion,” Chaos Solitons & Fractals, vol. 124, pp. 105–124. [Google Scholar]
21. M. Maleki, J. E. Contreras-Reyes and M. R. Mahmoudi. (2019). “Robust mixture modeling based on two-piece scale mixtures of normal family,” Axioms, vol. 8, no. 2, pp. 38. [Google Scholar]
22. A. R. Zarei, A. Shabani and M. R. Mahmoudi. (2019). “Comparison of the climate indices based on the relationship between yield loss of rain-fed winter wheat and changes of climate indices using GEE model,” Science of the Total Environment, vol. 661, pp. 711–722.
23. M. R. Mahmoudi, M. H. Heydari and Z. Avazzadeh. (2018). “On the asymptotic distribution for the periodograms of almost periodically correlated (cyclostationary) processes,” Digital Signal Processing, vol. 81, pp. 186–197.
24. M. Maleki and M. R. Mahmoudi. (2017). “Two-piece location-scale distributions based on scale mixtures of normal family,” Communications in Statistics-Theory and Methods, vol. 46, no. 24, pp. 12356–12369.
25. A. R. Nematollahi, A. R. Soltani and M. R. Mahmoudi. (2017). “Periodically correlated modeling by means of the periodograms asymptotic distributions,” Statistical Papers, vol. 58, no. 4, pp. 1267–1278.
26. M. Maleki, R. B. Arellano-Valle, D. K. Dey, M. R. Mahmoudi and S. M. J. Jalali. (2017). “A Bayesian approach to robust skewed autoregressive processes,” Calcutta Statistical Association Bulletin, vol. 69, no. 2, pp. 165–182.
27. M. R. Mahmoudi, M. Mahmoudi and E. Nahavandi. (2016). “Testing the difference between two independent regression models,” Communications in Statistics: Theory and Methods, vol. 45, no. 21, pp. 6284–6289.
28. J. J. Pan, M. R. Mahmoudi, D. Baleanu and M. Maleki. (2019). “On comparing and classifying several independent linear and non-linear regression models with symmetric errors,” Symmetry, vol. 11, no. 6, pp. 820.
29. M. R. Mahmoudi, M. H. Heydari and R. Roohi. (2019). “A new method to compare the spectral densities of two independent periodically correlated time series,” Mathematics and Computers in Simulation, vol. 160, pp. 103–110.
30. M. R. Mahmoudi, M. H. Heydari and Z. Avazzadeh. (2019). “Testing the difference between spectral densities of two independent periodically correlated (cyclostationary) time series models,” Communications in Statistics: Theory and Methods, vol. 48, no. 9, pp. 2320–2328.
31. M. R. Mahmoudi. (2018). “On comparing two dependent linear and nonlinear regression models,” Journal of Testing and Evaluation, vol. 47, no. 1, pp. 449–458.
32. M. R. Mahmoudi, M. Maleki and A. Pak. (2018). “Testing the equality of two independent regression models,” Communications in Statistics: Theory and Methods, vol. 47, no. 12, pp. 2919–2926. [Google Scholar]
33. Y. Yan, R. Liu, Z. Ding, X. Du, J. Chen. (2019). et al., “A parameter-free cleaning method for smote in imbalanced classification,” IEEE Access, vol. 7, pp. 23537–23548. [Google Scholar]
34. M. Zhu, J. Xia, X. Jin, M. Yan, G. Cai. (2018). et al., “Class weights random forest algorithm for processing class imbalanced medical data,” IEEE Access, vol. 6, pp. 4641–4652. [Google Scholar]
35. D. Veganzones and E. Severin. (2018). “An investigation of bankruptcy prediction in imbalanced datasets,” Decision Support Systems, vol. 112, pp. 111–124. [Google Scholar]
36. B. Santoso, H. Wijayanto, K. Notodiputro and B. Sartono. (2017). “Synthetic over sampling methods for handling class imbalanced problems: A review, ” in IOP Conf. Series: Earth and Environmental Science, Volume 58, The 3rd Int. Seminar on Sciences “Sciences on Precision and Sustainable Agriculture” (ISS-2016) 4, Bogor, Indonesia. [Google Scholar]
37. C. Drummond and R. C. Holte. (2003). “C4. 5, class imbalance, and cost sensitivity: Why under-sampling beats over-sampling,” Workshop on learning from imbalanced datasets II, ICML, Washington DC, vol. 11, pp. 1–8. [Google Scholar]
38. N. Chawla, K. Bowyer, L. Hall and W. Kegelmeyer. (2002). “SMOTE: Synthetic minority over-sampling technique,” Journal of Artificial Intelligence Research, vol. 16, no. 1, pp. 321–357. [Google Scholar]
39. H. Han, W. Wang and B. Mao. (2005). “Borderline-SMOTE: A new oversampling method in imbalance data set learning,” in Proc. ICIC, Hefei, China, pp. 878–887. [Google Scholar]
40. C. Bunkhumpornpat, K. Sinapiromsaran and C. Lursinsap. (2009). “Safe-level smote: Safe-level-synthetic minority over-sampling technique for handling the class imbalanced problem,” in 13th Pacific-Asia Con., PAKDD 2009 April 27-30, 2009 Proc., Bangkok, Thailand, pp. 475–482. [Google Scholar]
41. S. Barua, M. M. Islam, X. Yao and K. Murase. (2012). “Mwmote-majority weighted minority oversampling technique for imbalanced data set learning,” IEEE Transactions on Knowledge and Data Engineering, vol. 26, no. 2, pp. 405–425. [Google Scholar]
42. F. Last, G. Douzas and F. Bacao. (2017). “Oversampling for imbalanced learning based on k-means and smote,” Information Sciences, vol. 465, no. 2018, pp. 1–20. [Google Scholar]
43. H. He, Y. Bai, E. Garcia and S. A. Li. (2008). “Adaptive synthetic sampling approach for imbalanced learning,” in Proc. IJCNN, Hong Kong, China, pp. 1322–1328. [Google Scholar]
44. S. Susan and A. Kumar. (2019). “Ssomaj-smote-ssomin: Three-step intelligent pruning of majority and minority samples for learning from imbalanced datasets,” Applied Soft Computing, vol. 78, pp. 141–149. [Google Scholar]
45. G. M. Weiss, K. McCarthy and B. Zabar. (2007). Cost-Sensitive Learning vs. Sampling: Which is Best for Handling Unbalanced Classes with Unequal Error Costs. Bronx, NY, USA: Department of Computer and Information Science, Fordham University. [Google Scholar]
46. M. Galar, A. Fernandez, E. Barrenechea and H. Bustince. (2008). “A review on ensembles for the class imbalance problem: Bagging-, boosting-, and hybrid-based approaches,” IEEE Transactions on Systems, Man, and Cybernetics—Part C: Applications and Reviews, vol. 42, no. 4, pp. 463–484. [Google Scholar]
47. C. Seiffert, T. M. Khoshgoftaar and J. V. Hulse. (2010). “RUSBoost: A hybrid approach to alleviating class imbalance,” IEEE Transactions on Systems, Man, and Cybernetics—Part A: Systems and Humans, vol. 40, no. 1, pp. 185–197. [Google Scholar]
48. Z. Hajizadeh, M. Taheri and M. Zolghadri-Jahromi. (2014). “Nearest neighbor classification with locally weighted distance for imbalanced data,” International Journal of Computer and Communication Engineering, vol. 3, no. 2, pp. 81–86. [Google Scholar]
49. W. Liu, S. Chawla, D. A. Cieslak and N. V. Chawla. (2010). “A robust decision tree algorithm for imbalanced dataset,” Lecture Notes in Computer Science, vol. 8443, pp. 212–223. [Google Scholar]
50. N. V. Chawla. (2003). “C4.5 and imbalanced data sets: Investigating the effect of sampling method, probabilistic estimate, and decision tree structure,” in Proc. of Workshop on Learning from Imbalanced Data Sets (II). Washington DC: ICML, vol. 3, pp. 66–73. [Google Scholar]
51. S. Garcia and I. Triguero. (2012). “Evolutionary-based selection of generalized instances for imbalanced classification,” Knowledge-Based Systems, vol. 25, no. 1, pp. 3–12. [Google Scholar]
52. P. K. Chen and S. J. Stolfo. (1995). “A comparative evaluation of voting and meta-learning on partitioned data,” in Proc. of ICML, San Francisco, USA, pp. 90–98. [Google Scholar]
53. L. Breiman. (2001). “Random forest,” Machine Learning, vol. 45, no. 1, pp. 5–32. [Google Scholar]
54. P. Viola and M. Jones. (2002). “Fast and robust classification using asymmetric adaboost and a detector cascade,” Advances in Neural Information Processing Systems, vol. 14, pp. 1311–1318. [Google Scholar]
55. X. Liu, J. Wu and Z. Zhou. (2009). “Exploratory under-sampling for class-imbalance learning,” IEEE Transactions on Systems, Man and Cybernetics: Part B, vol. 39, no. 2, pp. 539–550. [Google Scholar]
56. P. Yang, L. Xu, B. B. Zhou, Z. Zhang and A. Y. Zomaya. (2009). “A particle swarm based hybrid system for imbalanced medical data sampling,” BMC Genomics, vol. 10, no. Suppl 3, S34. [Google Scholar]
57. B. Tang and H. He. (2015). “KernelADASYN: Kernel based adaptive synthetic data generation for imbalanced learning,” in Proc. IEEE CEC, Sendai, Japan, pp. 664–671. [Google Scholar]
58. B. Tang, H. He, Q. Ding and S. Kay. (2015). “A parametric classification rule based on the exponentially embedded family,” IEEE Transactions on Neural Networks and Learning Systems, vol. 26, no. 2, pp. 367–377. [Google Scholar]
59. Q. Cai, H. He and H. Mang. (2014). “Imbalanced evolving self-organizing learning,” Neurocomputing, vol. 133, pp. 258–270. [Google Scholar]
60. F. Cheng, J. Zhang and C. Wen. (2016). “Cost-sensitive large margin distribution machine for classification of imbalanced data,” Pattern Recognition Letters, vol. 80, pp. 107–112. [Google Scholar]
61. A. D’Addabbo and R. Maglietta. (2015). “Parallel selective sampling method for imbalanced and large data classification,” Pattern Recognition Letters, vol. 62, pp. 61–67. [Google Scholar]
62. W. W. Ng, G. Zeng, J. Zhang, D. S. Yeung, W. Pedrycz. (2016). et al., “Dual autoencoders features for imbalance classification problem,” Pattern Recognition, vol. 60, pp. 875–889. [Google Scholar]
63. V. López, A. Fernández, S. García, V. Palade and F. Herrera. (2013). “An insight into classification with imbalanced data: Empirical results and current trends on using data intrinsic characteristics,” Information Sciences, vol. 250, pp. 113–141. [Google Scholar]
64. Z. Zhu, Z. Wang, D. Li, Y. Zhu and W. Du. (2018). “Geometric structural ensemble learning for imbalanced problems,” IEEE transactions on cybernetics, vol. 50, no. 4, pp. 1617–1629. [Google Scholar]
65. Y. Freund and R. Schapire. (1997). “A decision-theoretic generalization of on-line learning and an application to boosting,” Journal of Computer and System Sciences, vol. 55, no. 1, pp. 119–139. [Google Scholar]
66. T. G. Dietterich. (1998). “Approximate statistical tests for comparing supervised classification learning algorithms,” Neural Computation, vol. 7, no. 10, pp. 1895–1924. [Google Scholar]
67. C. L. Blake and C. J. Merz. (1998). “UCI repository of machine learning databases,” . [Online]. Available: http://www.ics.uci.edu/~mlearn/MLRepository.html. [Google Scholar]
68. L. Breiman. (1996). “Bagging predictors,” Machine Learning, vol. 24, no. 2, pp. 123–140. [Google Scholar]
69. S. Nejatian, H. Parvin and E. Faraji. (2018). “Using sub-sampling and ensemble clustering techniques to improve performance of imbalanced classification,” Neurocomputing, vol. 276, pp. 55–66. [Google Scholar]
70. S. J. Yen and Y. S. Lee. (2009). “Cluster-based under-sampling approaches for imbalanced data distributions,” Expert Systems with Applications, vol. 36, no. 3, pp. 5718–5727. [Google Scholar]
 | This work is licensed under a Creative Commons Attribution 4.0 International License, which permits unrestricted use, distribution, and reproduction in any medium, provided the original work is properly cited. |