DOI:10.32604/cmc.2021.012624
| Computers, Materials & Continua DOI:10.32604/cmc.2021.012624 | |
| Article |
Space-Time Cluster Analysis of Accidental Oil Spills in Rivers State, Nigeria, 2011–2019
1Department of Fundamental & Applied Sciences, Universiti Teknologi PETRONAS, 32610, Seri Iskandar, Perak, Malaysia
2School of Mathematical and Computer Sciences, Heriot-Watt University Malaysia, 62200, Putrajaya, Malaysia
3Department of Statistics, University of Peshawar, Pakistan
4Center for Applied Intelligent Systems Research (CAISR), Halmstad University, Halmstad, Sweden
5Faculty of Mathematics and Statistics, Ton Duc Thang University, Ho Chi Minh City, 72915, Vietnam
*Corresponding Author: Ilyas Khan. Email: ilyaskhan@tdtu.edu.vn
Received: 07 July 2020; Accepted: 12 September 2020
Abstract: Oil spills cause environmental pollution with a serious threat to local communities and sustainable development. Accidental oil spills can be modelled as a stochastic process where each oil spill event is described by its spatial locations and incidence-time and hence allow for space-time cluster analysis. Space-time cluster analysis can detect space-time pattern distribution of oil spills which can be useful for implementing preventive measures and evidence-based decision making. This study aims to detect the space-time clusters of accidental oil spills in Rivers state, Nigeria through the Space-time Scan Statistic. The Space-time Scan Statistic was applied under the permutation model to the oil spill data (each for sabotage and operational oil spills) collected at Local Government Area (LGA)-level during the period from 2011 to 2019. The results show that the sabotage oil spill clusters have covered most of the LGAs in the southern part of the state at the start of the study period and then in 2018–2019, it moved to the west covering a single LGA. The operational oil spill clusters covered two neighboring LGAs in the south. In addition, the temporal cluster of sabotage oil spills was seen in 2019 and operational oil spills in 2011–2012. The sabotage oil spills show an increasing trend with the maximum in 2019 while the operational oil spills show a decreasing trend with the minimum in 2019. These findings assist in more effective decision-making for combating the environmental problems and controlling the future spill incidence in the cluster-regions.
Keywords: Oil spills; space-time clusters; SaTScan™; permutation model; Nigeria
Oil spills are frequently occurred in oil exploration, refining, and processing units [1], and thus exposing the nearby societies to environmental pollution [2]. The oil spills are mainly caused by operational failure (pipeline erosion, production, poor infrastructure and maintenance, faults during oil processing phases), third-party interference (attempts of thievery or intentional sabotage) [3,4]. Oil spills have an impact on soil and water, and consequently on the health of resident population and agricultural productions [5]. Toxic contaminants (e.g., polycyclic aromatic hydrocarbons and heavy metals) contained in the oil, seep into the soil, reach the groundwater and hence damage the vulnerable ecosystems [6,7].
Africa and especially Nigeria has suffered unprecedented pipeline interdictions. The Shell Petroleum Development Company (SPDC), Nigeria has been recording an average of 200 oil spill events each year since 2005 [8]. About 75% of the oil spills events during 2007–2013 were attributed to sabotage/theft [8]. Indeed, the presence of gangs in some communities sabotages pipelines in order to impede operations of oil companies, while claiming compensation for the farmlands or rivers contaminated by oil spills [9].
Although several studies have focused on oil spills detection and mapping [10–14], environmental, health and socioeconomic impacts of oil spills [15–21], and geospatial analysis of oil spill distribution [22,23] in different parts of Nigeria. However, space-time cluster analysis of oil spills at LGA-level seems to be lacking. The availability of spatially and temporally stamped information on oil spills in Nigeria allows for space-time cluster analysis of oil spill occurrence in the country. Spatiotemporal cluster analysis can detect important patterns in oil spill occurrence which could be helpful for oil spill management and environmental protection authorities in evidence-based interventions. In addition, it assists the officials of the oil industry in proper allocation of limited resources for quick response, cost and benefits distribution, exposure mitigation, and foster public-level involvement for sustainable development.
In this context, the main objective of this study is to identify the significant space-time clusters of oil spill events in the Rivers state, Nigeria during the period from 2011 to 2019 using Space-time Scan Statistic [24,25]. The Space-time Scan Statistic is implemented in the freely available software called SaTScan™ [26]. It has been widely used in environmental studies such as clusters detection of forest fire events [27–29], and pollution [30]. It has the additional advantage of detecting the cluster’s location and time-frame, while also evaluating its statistical significance as recommended for environmental studies by Tonini et al. [31] and Tuia et al. [32]. A useful functionality of SaTScan™ to assist decision making, is the integration of the model outputs and a geographic information system, for a map-visualization of the oil spill-prone regions. SaTScan™ is a group of methods, applied in many domains to search for spatial, temporal, and space-time clusters. It was first developed for health sciences but nowadays it is used in a variety of fields such as environment [27,28], road traffic [33,34], criminology [35], and public health [36].
This study was carried out in the Rivers state located in the eastern part of the Niger Delta region of Nigeria. The total area of the Rivers state is 11,077 km2, making it the 26th largest state of the country [37]. The total land area of the state is divided into twenty-three Local Government Areas (LGAs). It is surrounded on the north by Imo, Abia and Anambra state, on the east by Akwa-Ibom and Bayelsa states, on the west by Delta state and on the south by the Atlantic Ocean. Its geography ranges from plains, with a network of big rivers to tributaries. The inland area of the state is covered by tropical rainforest and the coastal area by mangrove swamps. The oil exploration activities in this area have severely affected the economic, cultural, and daily living conditions of the local communities [38].
The yearly data on oil spills in each LGA of the Rivers state, Nigeria were collected from the database of SPDC Nigeria [39]. SPDC Nigeria, in collaboration with government officials, quickly responds to spill incidents and cleans up spills from its facilities. SPDC Nigeria provides the monthly record of oil spills publicly on its website under the sustainability report to enhance the transparency on spills in SPDC Joint Venture (SPDC-JV) facilities. The SPDC records the location, time, and cause of each oil spill incidence in the joint investigation report which is available publicly on its website [39].
This study analyzes the oil spills due to each sabotage and operation separately, because these are the major causes of oil spills in Nigeria as shown in Fig. 1. Two datasets each for sabotage and operational oil spills were collected.
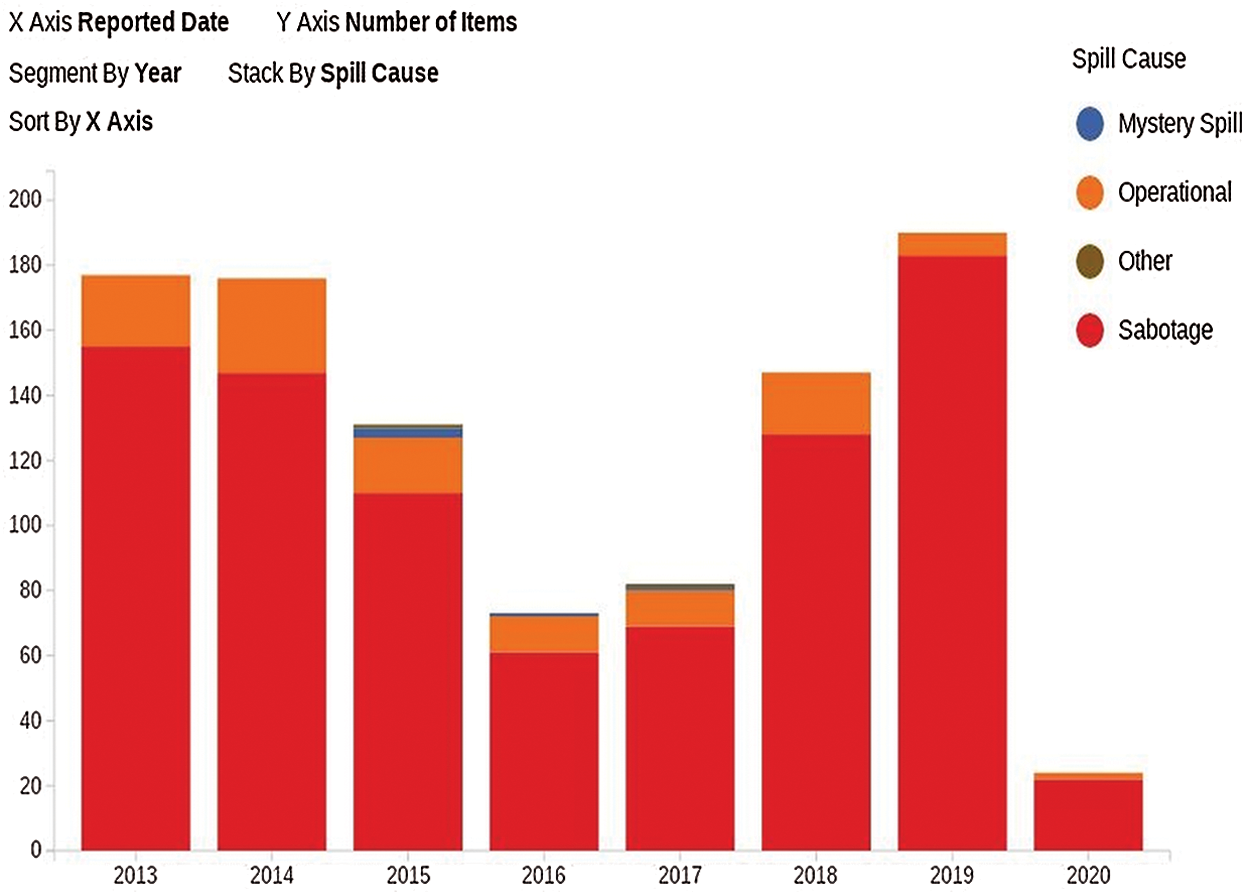
Figure 1: Oil spills graph in Nigeria [39]
The Space-time Scan Statistic is characterized by a cylindrical scanning window with a circular base. The circular base of the scanning window is related to the spatial size and the height to the temporal length of the cluster. The cylindrical window visits each location as well as each time point (day, month, or year). The size of the cylinder continuously increases from zero up to a fixed value in both radius (space) and height (time). Hence, a large number of overlapping cylinders of different sizes are obtained that mutually cover the total study-area. Each of the cylinders denotes a possible candidate cluster.
Events are supposed to be distributed with a Poisson model with a constant risk inside and outside all cylinders under the null hypothesis, and with different risk inside and outside at least one of the cylinders under the alternative hypothesis. For each possible cylinder, the observed and expected numbers of events inside and outside the cylinder are calculated. Based on these numbers, the likelihood is calculated for each cylinder and the one with the maximum Log-Likelihood Ratio (LLR) is considered to be the most likely cluster. The other cylinders with a higher LLR and with statistical significance are considered as the secondary clusters. The statistical significance of the detected clusters is evaluated by a Monte-Carlo simulation [40].
The Poisson model requires a control-population for estimating the expected number of events inside each cylinder. However, for scenarios like ours, where the control population is not relevant or unknown, this problem is solved by using the Space-time Scan Statistic Permutation (STSSP) model [24]. This model requires the input data on observed events only. Thus, the number of expected events is estimated on the basis of the observed events under the assumption of no space-time interaction in observed events. For instance, for a cylinder A, the expected number of events EA can be calculated as the sum of  (the expected counts for ith sub-region and jth time-point) belonging to cylinder A as in Eq. (1).

where  can be calculated as in Eq. (2)

where Eij is the expected events for ith sub-region over the jth time-point;  is the observed/reported events in the ith sub-region at the jth time-point;
  is the grand total of the observed/reported events.
Based on the observed and expected events, the Poisson Generalized Likelihood Ratio can be calculated according to Eq. (3).

where  is the observed/reported count in a cylinder, A is considered to follow the Poisson-distribution with mean,
  [31].
[31].
The GLR is computed and maximized for each possible cylinder and the statistical significance is tested by Monte Carlo simulations.
The STSSP model is a very useful statistical tool to analyze environmental data [29,31,32]. Its main advantage is that it requires input data on the observed events instead of both: observed events and the control-population. In the context of oil spill events, the control-population is not relevant, limiting the application of other models in SaTScan™. Therefore, we used the STSSP model for detecting space-time clusters of oil spills in the Rivers state, Nigeria. The STSSP model was applied with the circular shape and with the default setting of maximum spatial and temporal window sizes [40]. The Monte-Carlo method was used to test the statistical significance of the clusters. The clusters having a P-value of less than 0.05 were considered to be the significant clusters.
3.1 Sabotage Oil Spill Clusters
The Space-time Scan Statistic under permutation model detected three significant clusters of sabotage oil spills in the Rivers state, Nigeria during the year 2011 to 2019 as given in Tab. 1).
Table 1: Space-time clusters of sabotage oil spills in Rivers state, Nigeria, 2011–2019
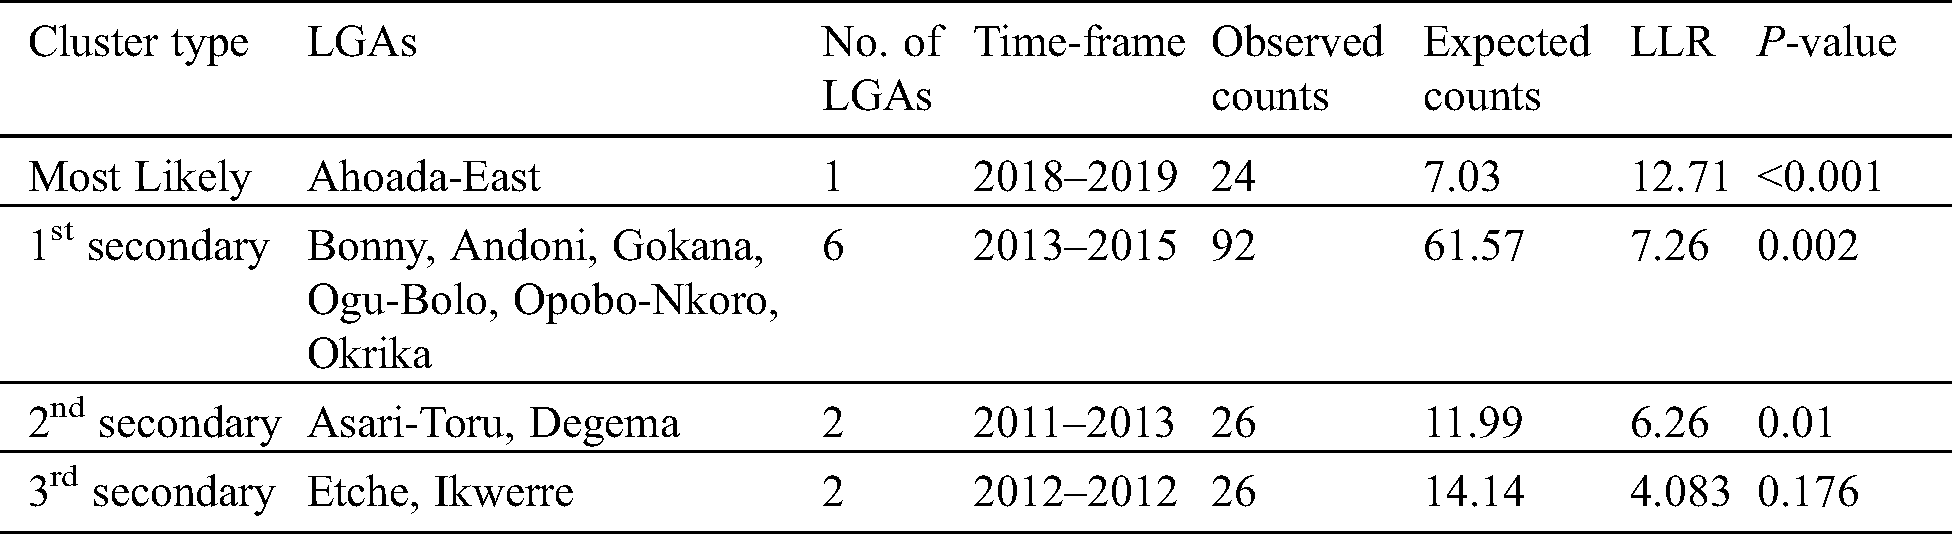
The geographic locations of the statistically significant clusters of sabotage oil spills in the Rivers state are shown in Fig. 2. The most-likely cluster was viewed in the western LGA (Ahoada-West) for two-years, 2018–2019. The six LGAs (Bonny, Andoni, Gokana, Ogu-Bolo, Opobo-Nkoro, Okrika) in the south-East appeared as a 1st secondary cluster for three years 2013–2015. The 2nd secondary cluster was seen in two LGAs (Asari-Toru, Degema) in the south for the first three years of the study period (2011–2013). These three clusters are statistically significant (P-value < 0.05) as shown in Tab. 1.
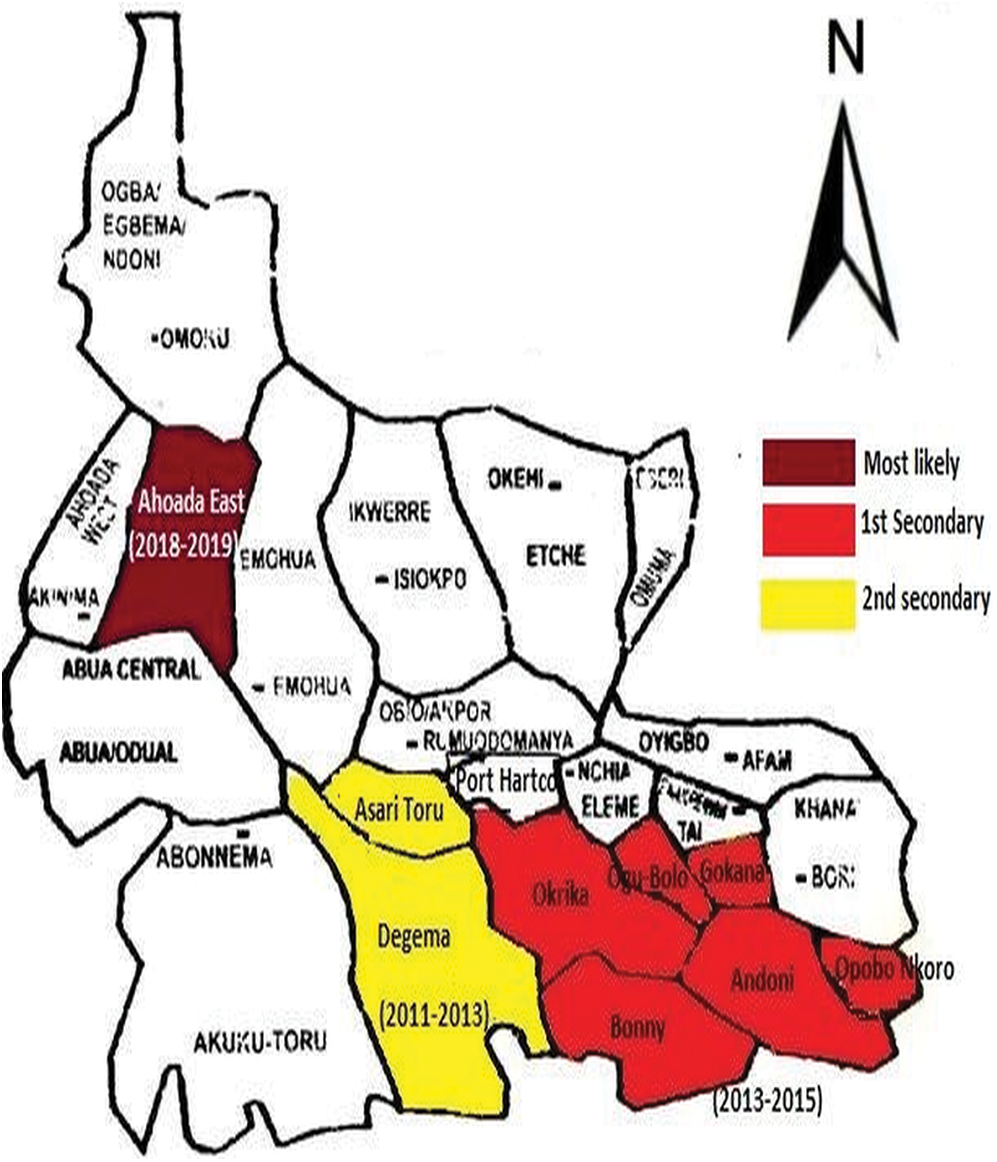
Figure 2: Locations of sabotage oil spills clusters in Rivers state, Nigeria
Moreover, the results show that during the start of the study-period (2011–2013), the cluster of sabotage oil spill occurred in the two LGAs in the south, and then in 2013–2015, it moved toward the neighboring LGAs in East covering six LGAs. In the years 2016–2017, no cluster was detected, and then during the last two years of the study-period, it appeared again with a higher intensity in the western part covering a single LGA. These three clusters of the sabotage oil spill are not persistent geographically, i.e., they have not occurred repeatedly in the same sites.
The most likely cluster is still present until the end of the study period identifying an important target for the possible interventions of oil and gas officials to control the current sabotage oil spills in this area and to reduce the environmental pollution. In addition, this most likely cluster can identify the areas susceptible to spills contamination (Fig. 2) which provide clues for the environment protection agencies to combat the oil spill pollution in the targeted area. Moreover, the results show that the potential sabotage oil spill clusters covered the LGAs mostly in the south-Eastern part of the Rivers state which might be due to the presence of gangs or poor pipeline maintenance in these areas. Also, the easy access to crude oil through waterways and streams in these LGAs may give rise to the theft of crude oil.
The resulting temporal graph showing the purely temporal cluster of sabotage oil spills is given in Fig. 3. The year 2019 was detected as a potential temporal cluster of sabotage oil spills in the study area. The temporal graph shows that the sabotage oil spills have increased from 2011 to 2012, declined from 2012 to 2016 to the minimum, and then increased from 2016 to 2019 to the maximum (Fig. 3). The increasing trend in the later year may be associated to the surveillance efforts that might be less consistent than in previous years.
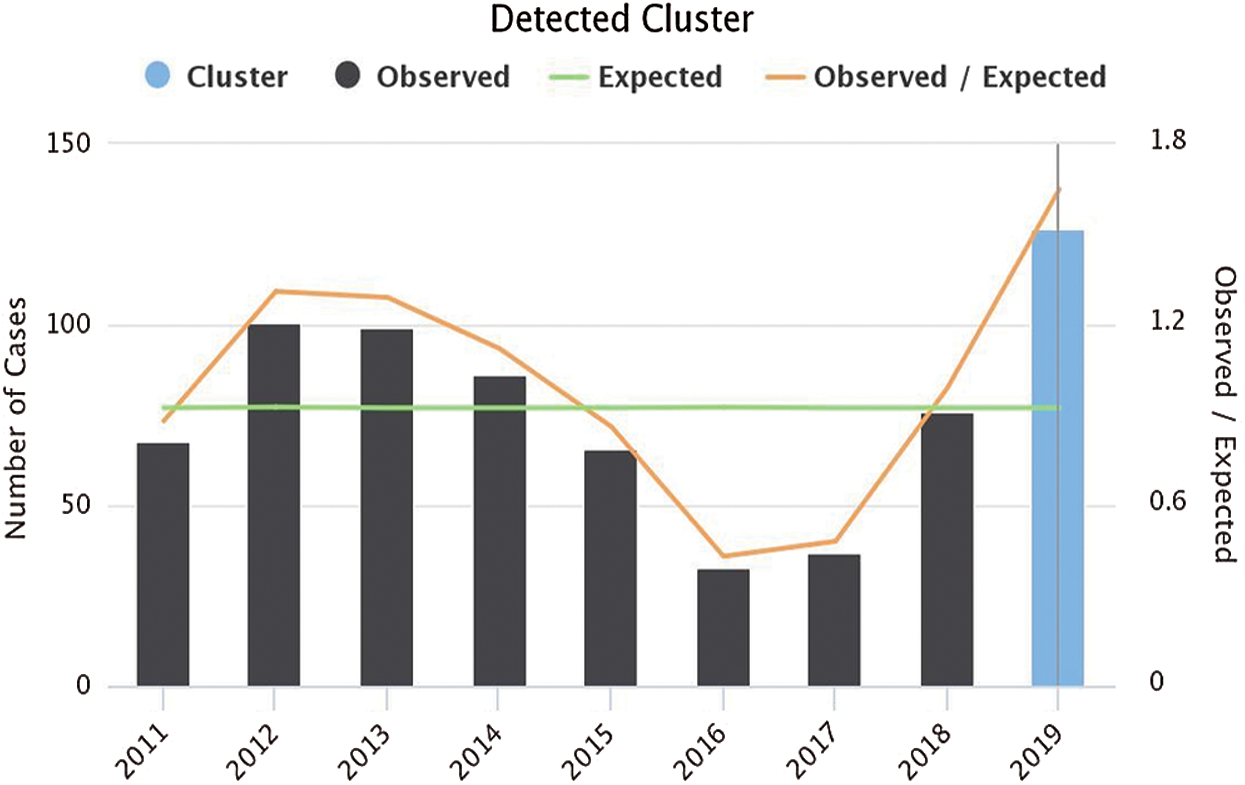
Figure 3: Temporal cluster of Sabotage oil spills in Rivers state, Nigeria
3.2 Operational Oil Spill Clusters
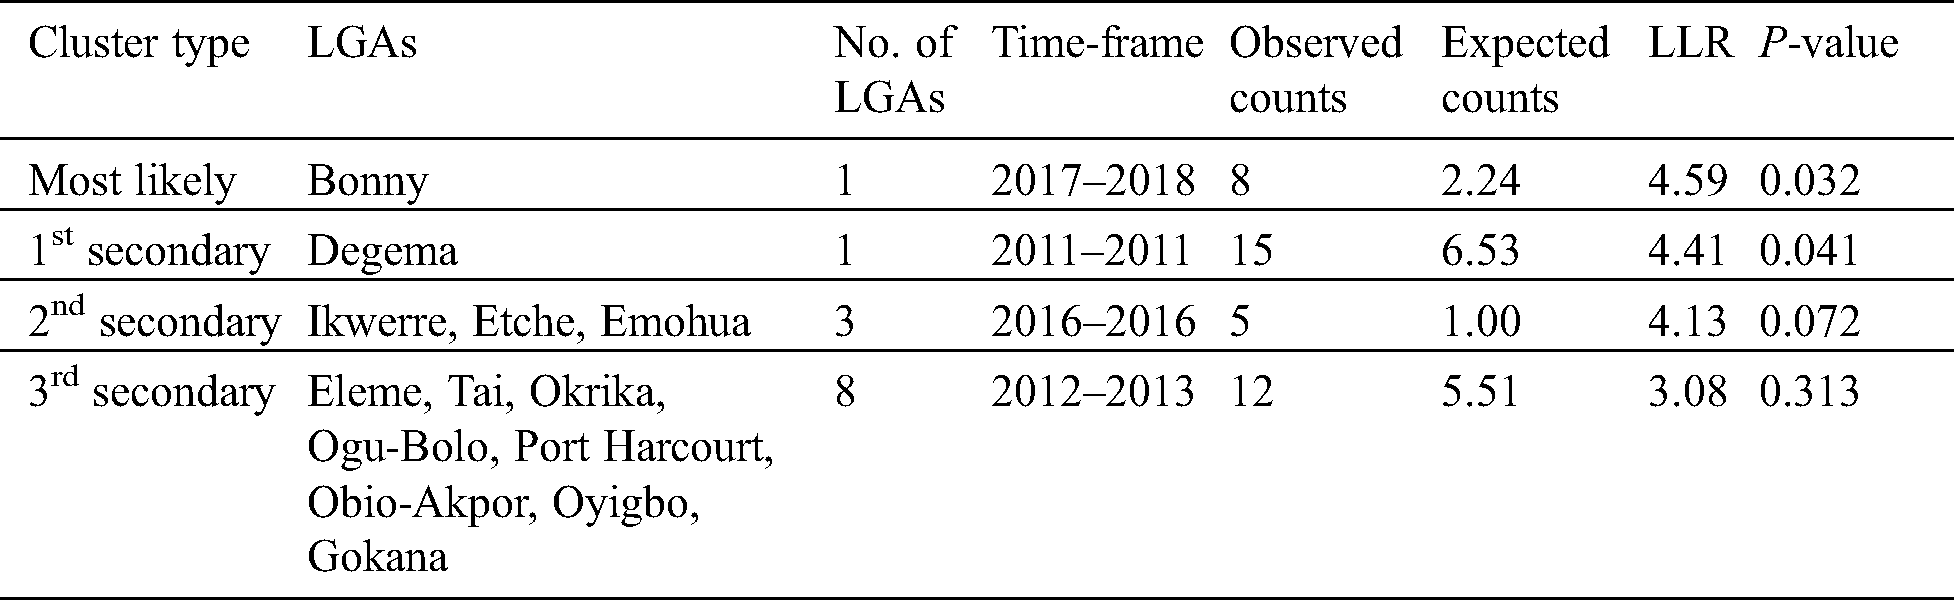
In the operational oil spill dataset, the Space-time Scan Statistic under the permutation model identified a total of two significant space-time clusters (Tab. 2). The most likely cluster was seen in Bonny LGA for two years 2017–2018, and the secondary cluster in Degema for one-year 2011. These two clusters are statistically significant (P-value < 0.05). Both operational oil spill clusters occurred in the southern part of the Rivers state covering each a single LGA. These clusters have disappeared before the end of the study period and no present cluster of operational oil spills was seen at the end of the study period.
Table 2: Space-time clusters of operational oil spills in Rivers state, Nigeria, 2011–2019
The geographic sites of the significant clusters of operational oil spills in the Rivers state are shown in Fig. 4. The geographic sites in Fig. 4 show that during the first year of the study period (2011), the cluster of operational oil spill occurred in one LGA in the south, and then in 2017–2018, it moved toward the neighboring LGA in the East. Similar to the sabotage oil spill clusters, the operational oil spill clusters are not geographically persistent.
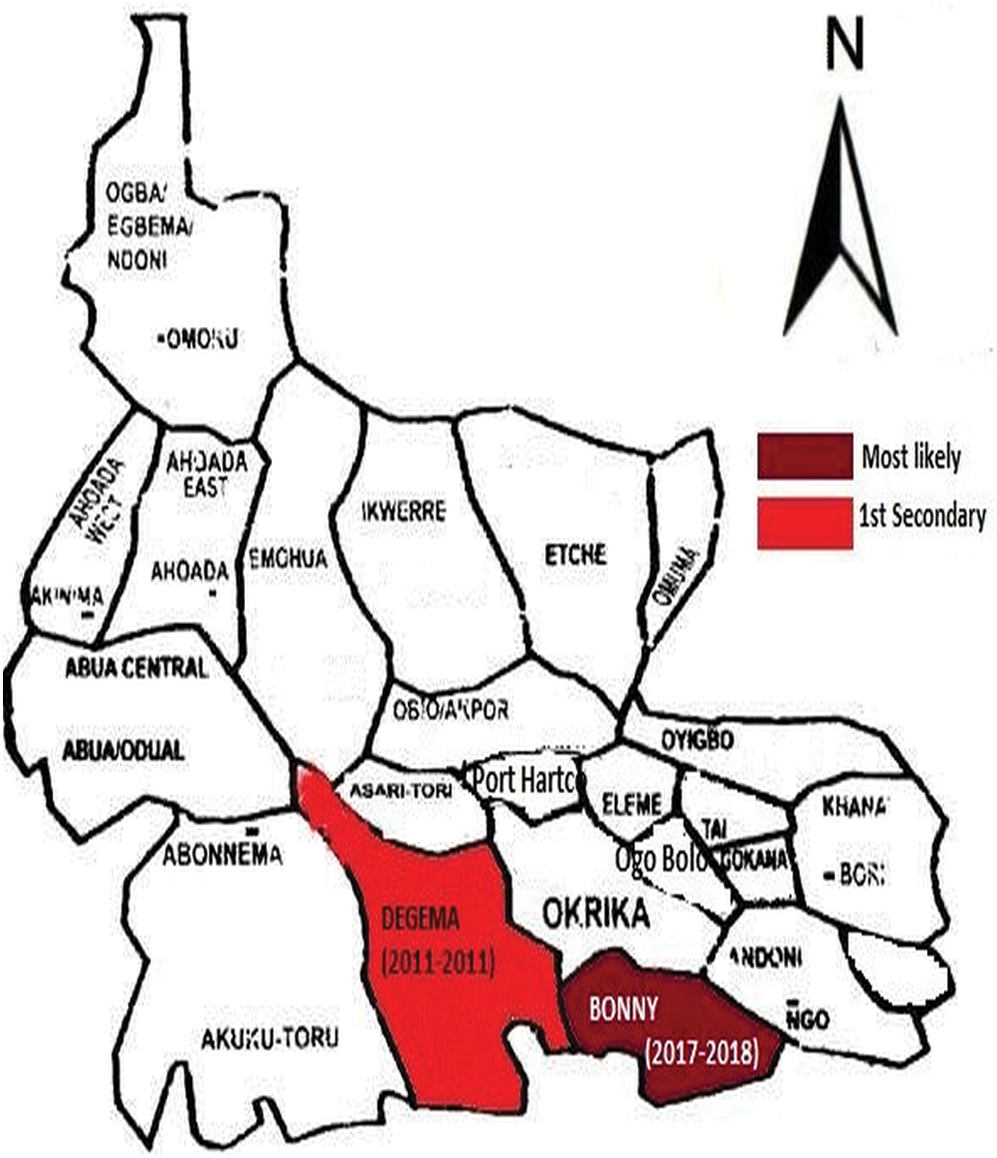
Figure 4: Locations of operational oil spills clusters in Rivers state, Nigeria
The resulting temporal graph showing the temporal cluster of operational oil spills is given in Fig. 5. The period (2011–2012) was detected as a potential temporal cluster of operational oil spills in the study area. The temporal graph shows a decreasing trend in operational oil spills from 2011 to 2019 with a maximum in the year 2011 and minimum in 2019. This substantial decrease in the operational oil spill might be due to the efficient control strategies for operational oil spills in the study area.
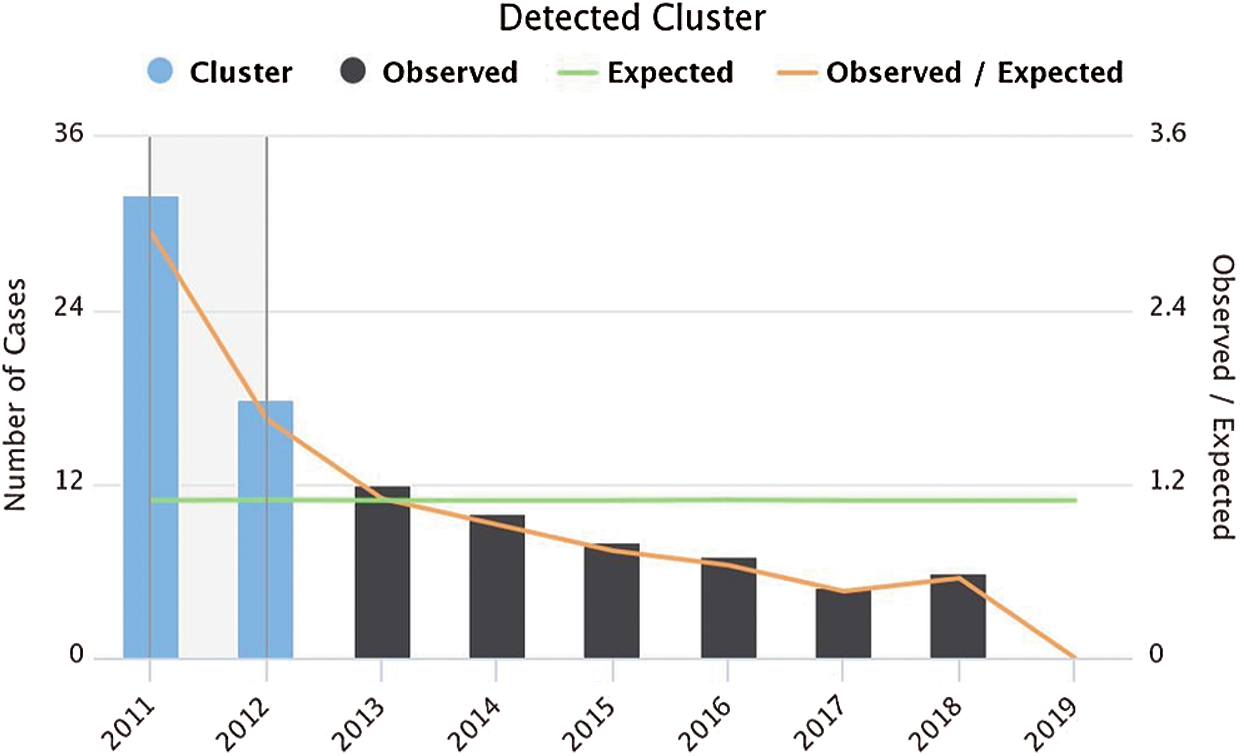
Figure 5: Temporal cluster of operational oil spills in Rivers state, Nigeria
Our data analysis does differentiate the temporal and space-time clusters where oil spill accidents were frequent. The space-time cluster analysis shows that in both datasets (sabotage and Operational oil spills) most of the potential clusters occurred in the southern LGAs. However, the temporal graphs show opposite trends in both datasets (Figs. 3 and 5). The operational oil spills seem to be controlled while controlling the sabotage oil spills in the study area is still a challenge.
The Space-time Scan Statistic approach detected temporaneous hotspots of oil spills in the Rivers state, Nigeria, thus provides clues for policymakers for better designing and targeting oil spill pre-suppression and control facilities at the local level. The results of the space-time cluster analyses provide useful information regarding the characteristics and occurrence-structure of the oil spill clusters in the study area. Most of the space-time clusters (sabotage and operational) have occurred in the southern part of the state. However, one potential cluster of sabotage oil spill occurred in the western LGA (Ahoada West) which is still present at end of the study period highlighting a current oil spill pollution hotspot for an immediate intervention of the oil spill control and environmental protection authorities. Similarly, the temporal graph of the sabotage oil spill also shows a tremendous increase at the end of the study period alerting the oil spill control and environmental protection authorities for taking preventive measures. Moreover, the detection of oil spill clusters could be a starting point for the deeper analysis of observing the social and environmental factors of oil spills in the study area.
Acknowledgement: The authors are grateful to Universiti Teknologi PETRONAS for providing facilities for conducting this study.
Funding Statement: This article was funded by a Yayasan Universiti Teknologi PETRONAS-Fundamental Research Grant (YUTP-FRG) with a cost center of 015LC0-013.
Conflicts of Interest: The authors declare no conflicts of interest.
1. N. Chrisman, Exploring Geographic Information Systems. New York, USA: John Wiley & Sons, 2002. [Online]. Available: https://www.worldcat.org/title/exploring-geographic-information-systems/oclc/1158646557. [Google Scholar]
2. R. Steiner. (2010). Double Standard: Shell Practices in Nigeria Compared with International Standards to Prevent and Control Pipeline Oil Spills and the Deepwater Horizon Oil Spill. Amsterdam: Milieudefensie, pp. 11–15. [Google Scholar]
3. A. Ambituuni, P. Hopkins, J. M. Amezaga, D. Werner and J. M. Wood. (2015). “Risk assessment of a petroleum product pipeline in Nigeria: The realities of managing problems of theft/sabotage, in C. A. Brebia, F. Garzia, D. Poljak, Safety and Security Engineering, VI. Southampton: WIT Press, pp. 49–60. [Google Scholar]
4. R. Kandiyoti, Pipelines: Flowing Oil and Crude Politics. London, UK: Bloomsbury Academic, 2012. [Online]. Available: https://www.bloomsbury.com/uk/pipelines-9781848858398/. [Google Scholar]
5. S. E. Chang, J. Stone, K. Demes and M. Piscitelli, “Consequences of oil spills: A review and framework for informing planning,” Ecology and Society, vol. 19, no. 2, pp. 26, 2014. [Google Scholar]
6. V. G. Bondur. (2011). “Aerospace methods and technologies for monitoring oil and gas areas and facilities,” Izvestiya, Atmospheric and Oceanic Physics, vol. 47, no. 9, pp. 1007–1018. [Google Scholar]
7. A. S. Wernersson. (2004). “Aquatic ecotoxicity due to oil pollution in the ecuadorian amazon,” Aquatic Ecosystem Health & Management, vol. 7, no. 1, pp. 127–136. [Google Scholar]
8. O. B. Akpomuvie and B. Orhioghene. (2011). “Tragedy of commons: Analysis of oil spillage, gas flaring and sustainable development of the Niger Delta of Nigeria,” Journal of Sustainable Development, vol. 4, no. 2, pp. 200–210. [Google Scholar]
9. A. Adebayo and A. S. Dada. (2008). “An evaluation of the causes of oil pipeline incidents in oil and gas industries in Niger Delta region of Nigeria,” Journal of Engineering and Applied Sciences, vol. 3, no. 3, pp. 279–281. [Google Scholar]
10. T. F. Balogun. (2015). “Utility of microwave and optical remote sensing in oil spill detection in the Mangrove region of Nigeria,” Journal of Geoscience and Environment Protection, vol. 3, no. 1, pp. 16. [Google Scholar]
11. H. O. Nwankwoala and C. Nwaogu, “Utilizing the tool of GIS in oil spill management-a case study of Etche LGA, Rivers State, Nigeria,” Global Journal of Environmental Sciences, vol. 8, no. 1, pp. 19–29, 2009.
12. M. Udjoh. (2019). “Demonstrating the potential of geographical information science in oil spill risk management in the Niger Delta region of Nigeria,” Ph.D. Dissertation. Southern Illinois University at Edwardsville.
13. O. T. Badejo, P. Evarie, E. O. Makinde, F. Akanro, P. C. Nwilo et al., “Validation of oil spill map with CLS marge/T buoy on Nigerian coastal waters,” Journal of Engineering Research, vol. 22, no. 2, pp. 73–89, 2017.
14. A. D. Moses, D. C. Okujagu and F. T. Beka, “Geospatialization of spilling facility from SPDC, 2015 oil spill reports of the Niger Delta region of Nigeria,” Journal of Applied Geospatial Information, vol. 3, no. 1, pp. 160–165, 2019. [Google Scholar]
15. Z. A. Elum, K. Mopipi and A. Henri-Ukoha. (2016). “Oil exploitation and its socioeconomic effects on the Niger Delta region of Nigeria,” Environmental Science and Pollution Research, vol. 23, no. 13, pp. 12880–12889. [Google Scholar]
16. E. S. Ndeh, J. O. Okafor, G. U. Akpan and M. A. Olutoye. (2017). “Environmental impacts of crude oil spillages on water in Ibeno local government area of Akwa Ibom state,” Nigeria Bayero Journal of Pure and Applied Sciences, vol. 10, no. 1, pp. 315–319.
17. M. S. Ozigis, J. D. Kaduk and C. H. Jarvis. (2019). “Mapping terrestrial oil spill impact using machine learning random forest and Landsat 8 OLI imagery: A case site within the Niger Delta region of Nigeria,” Environmental Science and Pollution Research, vol. 26, no. 4, pp. 3621–3635.
18. S. I. Azubuike and O. Songi. (2020). “A rights-based approach to oil spill investigations: A case study of the Bodo community oil spill in Nigeria,” Global Energy Law and Sustainability, vol. 1, no. 1, pp. 28–54.
19. B. Mohamadi, F. Liu and Z. Xie, “Oil spill influence on Vegetation in Nigeria and its determinants,” Polish Journal of Environmental Studies, vol. 25, no. 6, pp. 2533–2540, 2016.
20. C. Anyanwu. (2019). “A geospatial analysis of the health impacts of oil spills in the Niger Delta region of Nigeria,” Ph.D. Dissertation. Ohio University.
21. C. I. Anyanwu and J. K. Lein. (2019). “A geospatial appraisal of oil spill health impacts: A Niger Delta case study,” Journal of Basic & Applied Sciences, vol. 15, pp. 78–88. [Google Scholar]
22. S. Whanda, O. Adekola, B. Adamu, S. Yahaya and P. Pandey. (2016). “Geo-spatial analysis of oil spill distribution and susceptibility in the Niger Delta region of Nigeria,” Journal of Geographic Information System, vol. 8, no. 4, pp. 438–456. [Google Scholar]
23. C. B. Obida, J. D. Whyatt, A. G. Blackburn and K. T. Semple, “Spatial analysis along a network: Human and environmental exposure to pipeline hydrocarbon pollution in the Niger Delta,” in Proc. 25th GIS Research UK Conference, Manchester, UK, 2017. [Google Scholar]
24. M. Kulldorff, R. Heffernan, J. Hartman, R. Assunção and F. Mostashari. (2005). “A space-time permutation scan statistic for disease outbreak detection,” PLoS Medicine, vol. 2, no. 3, pp. 216–224. [Google Scholar]
25. M. Kulldorff, W. F. Athas, E. J. Feuer, B. A. Miller and C. R. Key. (1998). “Evaluating cluster alarms: A space-time scan statistic and brain cancer in Los Alamos, New Mexico,” American Journal of Public Health, vol. 88, no. 9, pp. 1377–1380. [Google Scholar]
26. M. Kulldorff. (2018). “SaTScan v9.6,” . [Online]. Available: https://www.satscan.org. [Google Scholar]
27. J. Parente, M. G. Pereira and M. Tonini. (2016). “Space-time clustering analysis of wildfires: The influence of dataset characteristics, fire prevention policy decisions, weather and climate,” Science of the Total Environment, vol. 559, pp. 151–165. [Google Scholar]
28. M. R. Coughlan. (2016). “Wildland arson as clandestine resource management: A space-time permutation analysis and classification of informal fire management regimes in Georgia,” USA Environmental Management, vol. 57, no. 5, pp. 1077–1087. [Google Scholar]
29. C. V. Orozco, M. Tonini, M. Conedera and M. Kanveski. (2012). “Cluster recognition in spatial-temporal sequences: The case of forest fires,” Geoinformatica, vol. 16, no. 4, pp. 653–673. [Google Scholar]
30. G. Stojan, A. Kvit, F. C. Curriero and M. Petri, “A Spatiotemporal analysis of organ-specific lupus flares in relation to atmospheric variables and fine particulate matter pollution,” Arthritis & Rheumatology, vol. 72, no. 7, pp. 1134–1142, 2020. [Google Scholar]
31. M. Tonini, D. Tuia and F. Ratle. (2009). “Detection of clusters using space-time scan statistics,” International Journal of Wildland Fire, vol. 18, no. 7, pp. 830–836. [Google Scholar]
32. D. Tuia, F. Ratle, R. Lasaponara, L. Telesca and M. Kanevski. (2008). “Scan statistics analysis of forest fire clusters,” Communications in Nonlinear Science and Numerical Simulation, vol. 13, no. 8, pp. 1689–1694. [Google Scholar]
33. J. R. Olsen, R. Mitchell, D. Ogilvie and M. S. Team, “Effect of a new motorway on social-spatial patterning of road traffic accidents: A retrospective longitudinal natural experimental study,” PLoS One, vol. 12, no. 9, p. e0184047, 2017. [Google Scholar]
34. J. Song, R. Wen and W. Yan, “Identification of traffic accident clusters using Kulldorff’s space-time scan statistics,” in Proc. IEEE Int. Conf. on Big Data, Seattle, WA, USA, pp. 3162–3167, 2018. [Google Scholar]
35. Y. Yeom, “Detecting spatial-temporal clusters of violent behavior in South Korea with space-time permutation scan statistics,” Policing: An International Journal, vol. 42, no. 3, pp. 490-502, 2019. [Google Scholar]
36. S. Ullah, H. Daud, S. C. Dass, H. Fanaee-T, H. Kausarian et al. (2020). , “Space-time clustering characteristics of tuberculosis in Khyber Pakhtunkhwa province, Pakistan, 2015–2019,” International Journal of Environmental Research and Public Health, vol. 17, no. 4, pp. 1413. [Google Scholar]
37. Wikipedia (2020Geography of Rivers State. [Online]. Available: https://en.wikipedia.org/wiki/Rivers_State. [Google Scholar]
38. E. C. Okonkwo. (2014). “Oil spills in Nigeria: Are there social and economic impacts?,” in Proc. Int. Oil Spill Conf., vol. 2014, no. 1, 300289. [Google Scholar]
39. Shell Petroleum Development Company of Nigeria Limited (SPDC) (2019Oil spill data-2019. [Online]. Available: https://www.shell.com.ng/sustainability/environment/oil-spills.html. [Google Scholar]
40. M. Kulldorff (2020SaTScan User Guide. [Online]. Available: https://www.satscan.org/cgi-bin/satscan/register.pl/SaTScan_Users_Guide.pdf?todo=process_userguide_download. [Google Scholar]
 | This work is licensed under a Creative Commons Attribution 4.0 International License, which permits unrestricted use, distribution, and reproduction in any medium, provided the original work is properly cited. |