DOI:10.32604/cmc.2021.012941
| Computers, Materials & Continua DOI:10.32604/cmc.2021.012941 | |
| Article |
Deep Learning Based Optimal Multimodal Fusion Framework for Intrusion Detection Systems for Healthcare Data
1Department of Project Management, Ho Chi Minh City Open University, Ho Chi Minh City, 700000, Vietnam
2Department of Learning Material, Ho Chi Minh City Open University, Ho Chi Minh City, 700000, Vietnam
3Faculty of Computers and Information, Mansoura University, Dakahlia Governorate, 35516, Egypt
4Institute of Research and Development, Duy Tan University, Danang, 550000, Vietnam
5Faculty of Information Technology, Duy Tan University, Danang, 550000, Vietnam
*Corresponding Author: Dac-Nhuong Le. Email: ledacnhuong@duytan.edu.vn
Received: 18 July 2020; Accepted: 24 August 2020
Abstract: Data fusion is a multidisciplinary research area that involves different domains. It is used to attain minimum detection error probability and maximum reliability with the help of data retrieved from multiple healthcare sources. The generation of huge quantity of data from medical devices resulted in the formation of big data during which data fusion techniques become essential. Securing medical data is a crucial issue of exponentially-pacing computing world and can be achieved by Intrusion Detection Systems (IDS). In this regard, since singular-modality is not adequate to attain high detection rate, there is a need exists to merge diverse techniques using decision-based multimodal fusion process. In this view, this research article presents a new multimodal fusion-based IDS to secure the healthcare data using Spark. The proposed model involves decision-based fusion model which has different processes such as initialization, pre-processing, Feature Selection (FS) and multimodal classification for effective detection of intrusions. In FS process, a chaotic Butterfly Optimization (BO) algorithm called CBOA is introduced. Though the classic BO algorithm offers effective exploration, it fails in achieving faster convergence. In order to overcome this, i.e., to improve the convergence rate, this research work modifies the required parameters of BO algorithm using chaos theory. Finally, to detect intrusions, multimodal classifier is applied by incorporating three Deep Learning (DL)-based classification models. Besides, the concepts like Hadoop MapReduce and Spark were also utilized in this study to achieve faster computation of big data in parallel computation platform. To validate the outcome of the presented model, a series of experimentations was performed using the benchmark NSLKDDCup99 Dataset repository. The proposed model demonstrated its effective results on the applied dataset by offering the maximum accuracy of 99.21%, precision of 98.93% and detection rate of 99.59%. The results assured the betterment of the proposed model.
Keywords: Big data; data fusion; deep learning; intrusion detection; bio-inspired algorithm; spark
Internet of Things (IoT), embedded devices, sensors, mobile applications, patient records and online sources are some of the complicated data sources for decision support in the healthcare industry. The data supported by medical devices significantly support the earlier identification of diseases and respective medication. The term ‘Big Data’ is generally used to denote diverse data types of homogeneous size, from heterogeneous source, which have been stacked on memory devices and can be calculated in peta-bytes as well as zeta-bytes [1]. The application of security in big data is one of the complex tasks to be achieved in the past few decades and there is a drastic increase in the data size during recent times. Further, huge volumes of data are produced from heterogeneous sources which arrive in various formats like structured, semi-structured as well as unstructured that tend to degrade the commodity hardware. The security in big data is comprised of protecting the data produced, structure security, data accessibility, user authorization and communication integrity. In order to resolve these problems, IDS is applied. Here, it is assumed with two significant factors of big data. Fig. 1 shows the general fusion framework of network intrusion detection model.
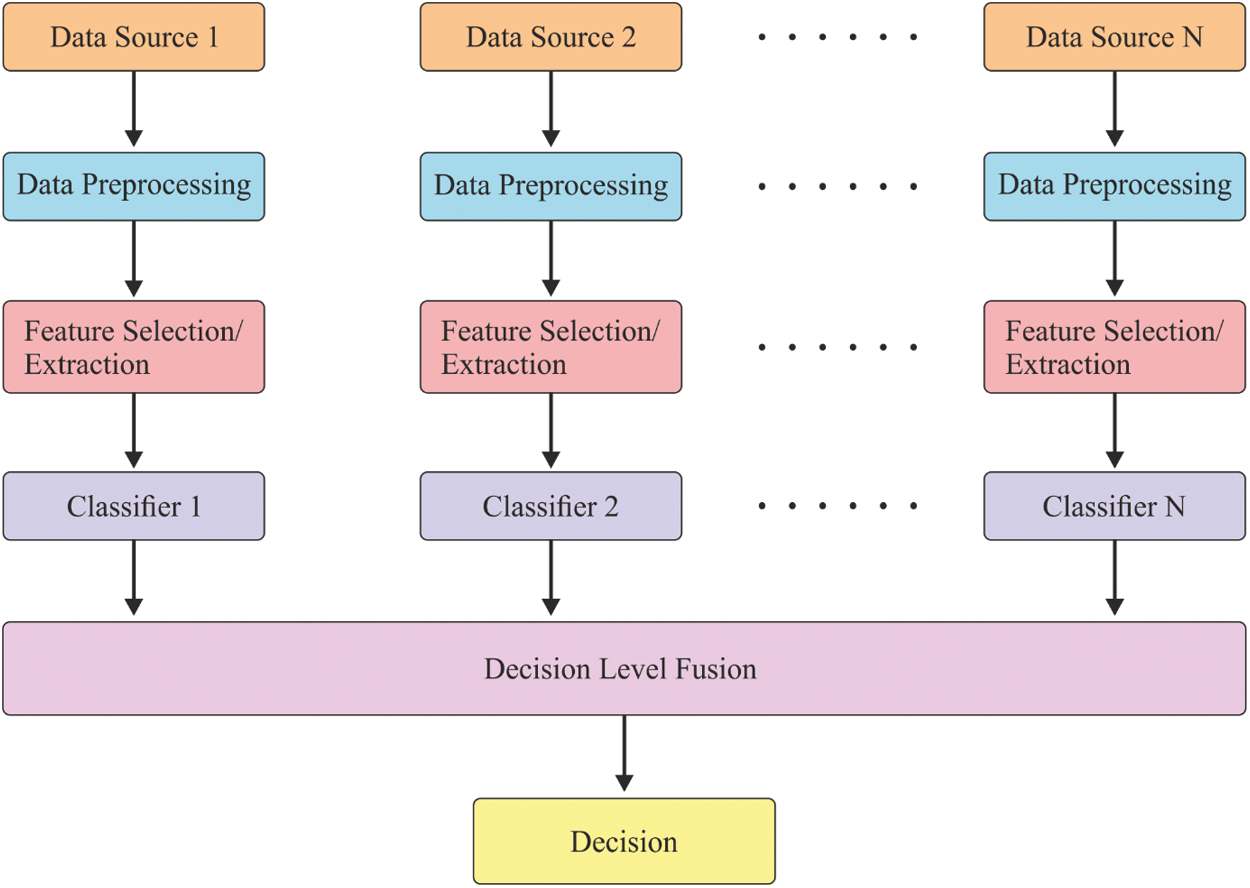
Figure 1: General fusion framework of IDS model
Network IDS (NIDS) is defined as the new production of network security by applying conventional security parameters like firewall and data encryption [2] in a rapid manner. These security metrics are capable of preventing attacks and malicious events named as second line of defense on internet. But, due to big data management in recent times, dense quantity of data makes the NIDS undergo crucial issues. Initially, massive high-dimensional data improves the difficulty and demands more amount of processing as well as memory storage [3]. Then iterations of repeated and unwanted data affect the network security prediction adversely. Finally, few attacks are very complex to predict due to the presence of big data and analysis. The inherent vulnerabilities of NIDS enhance the immediate request on productive solutions. Data Fusion (DF) is one of the challenging models in big data which is used in the application of NIDS to resolve the predefined complications in the last few decades.
DF method was developed by US Department of Defence, initially presented by Joint Directors of Laboratories (JDL). The DF method depends upon national defence supervision system [4]. Consecutively, this method was modelled and implemented in alternate domains like automated management, image prediction, target forecasting, and cyber security while other developers have presented description of DF centric studies and works [5]. DF method is primarily used at three stages in terms of processing the fusion. In general, three major stages exist namely data, feature, and decision. Various fusion models are utilized in diverse levels to enhance the entire function of data processing [6]. Every detection process is performed using the fundamental prediction under different stages such as pre-processing, feature reduction, as well as identification to deploy primary inferences on the monitored objectives. Followed by, these inferences are combined into extensive and correct decision making by applying decision fusion modules.
In the domain of NIDS, DF mainly concentrates on feature layer and decision layer. It is due to networking data that has to be fused with public datasets which are combined earlier at data layer itself [7]. The application of DF approach, at feature level, heavily decreases the size of data processing and increases the effectiveness of NIDSs. On the other hand, the refined data produced by feature fusion supports the decision making and enhances the robust nature as well as accuracy of the system. Since the DF model should be applied at decision level, the decision fusion center merges all the decisions arrived from several local detectors to achieve maximum accuracy and stable identifications of network characteristics [8–10].
Recently, the DL models become popular and finds useful among several applications like image processing, speech recognition, object detection, etc. The DL models are commonly employed due to its inherent characteristics. The DL model has the ability of executing the feature engineering on its own. The DL model scans the data for searching the features which correlates and combines them enable faster learning without being explicitly. In the recent times, various studies were conducted on DF for IDS to extend the function of NIDS [11]. Therefore, it identifies open dataset, number of simulation data instances, and fusion models which are applied in several domains. It is challenging to learn and examine the robustness and weaknesses of diverse fusion approaches. Also, it is mandatory to imply uniform criteria to estimate a greater number of references and provide the performance statistics of the recent study. Since it is simple to learn the features of recent DF approaches, the developers apply it in massive range. Fig. 2 shows the Apache Spark components.
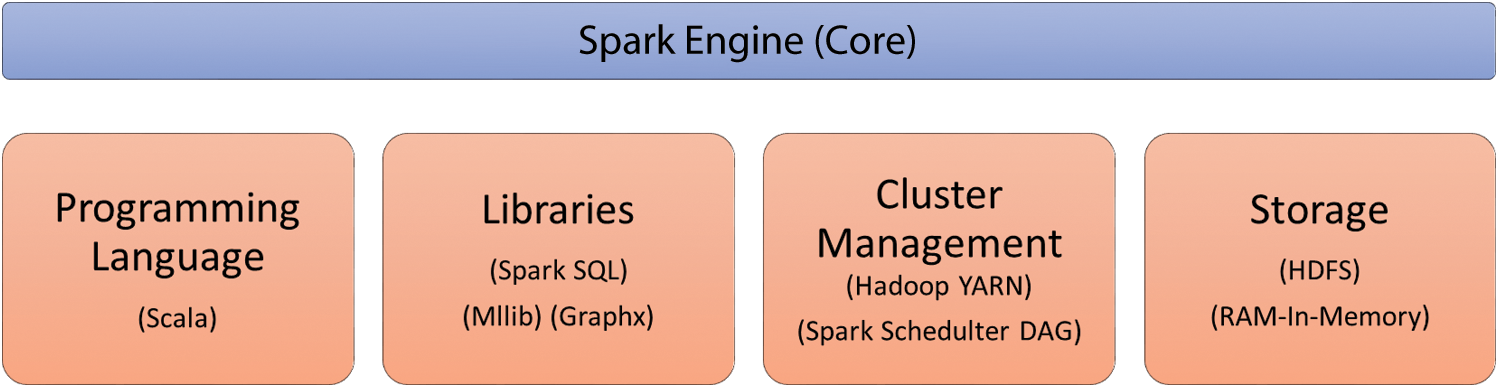
Figure 2: Apache spark components
This paper presents a new multimodal fusion-based IDS for secure big data platform using Spark. The proposed IDS model mainly focuses on effective FS and classification process. To extract the effective set of features, Chaotic Butterfly Optimization (CBO) algorithm is introduced in this study followed by multimodal classification process. Since singular-modality is inadequate to attain higher detection rate, the diverse techniques need to be merged using decision-based multimodal fusion process. In this case, a set of three DL-based classifier models namely Convolutional Neural Network (CNN), Long Short-Term Memory (LSTM) and Gated Recurrent Unit (GRU) was used. Besides, Hadoop MapReduce and Spark were utilized in this study to accomplish rapid computation of big data in parallel computational platform.
The remaining sections of the study are arranged as follows. Section 2 briefs the works related to the study. Section 3 explains the proposed model and Section 4 validates the performance of the proposed model. Finally, Section 5 concludes the work.
DF model is applied in a wide range of applications namely automated control, image analysis, target detection and IDS. In the study conducted Cao et al. [12], a free automation control system was proposed on the basis of DF using smart building. These layers are used in smart home to attain exact free alarm as well as free integrity. Zhang et al. [13] presented a DF-relied smart home controlling system. The projected smart home controlling system is composed of internet access, data acquisition, internal network service module along with Bluetooth connection, Data Fusion (DF) controller which applies Fuzzy Logic (FL), Fuzzy Neural Network (FNN), and incorporated system in home appliances.
In the literature [14], a DF model was applied to extract the features and find the missile target. According to D-S evidence reasoning, the developers analyze missile targets, jamming light on region square feature, clutter and free stack on position features, correspondingly. The possibility of identification gets higher with a combination of three sensors along with D-S evidence. The results showed improvement when compared with the approach in which only one sensor was applied. Hu et al. [15] used DF fuzzy theory to deploy an alarming system on the basis of Wireless Sensor Network (WSN). These systems are capable of providing detection accuracy; however, it enhances the intelligence of observing. The newly deployed model performed well using a sensor, when compared with conventional diagnostic approaches.
Yan et al. [16] utilized DF in reputation production and projected an opinion fusion as well as mining. These opinions were integrated and categorized as main opinion in a set which has same attitudes. Liu et al. [17] reviewed four studies to understand the application of DF in Internet of Things (IoT). When massive WSN is applied, IoT produces dense volume of maximum, multi-sourced and dynamic data. In this case, it is evident that DF is a major device that can be used to process and control the data with the purpose of enhancing the efficiency of advanced intelligence. A DF approach for IDS was proposed in the literature [18], on the basis of clustering. It was also applied with centralized technique for the purpose of DF from diverse analyzers that help in decision making process. The key objective of the presented model is based on accuracy to fuse data collected from various detection systems and applicability-to-scalability. Also, the DF has been considered with respect to efficiency of every analyzer in DF process which detects the future network attacks.
DF model is composed of two major classes for feature fusion in NIDS namely filters and wrappers [19]. Here, the filters are used by statistical models, information theory, and searching approaches [20]. ML model is applied by the wrapper to estimate and combine features so as to find the optimal subset. These models depend upon two portions: Feature search as well as evaluation algorithms. The wrapper models were applied in previous study [21] to produce optimal feature subset which incurs high cost and memory space when compared with filter.
The filters as well as wrappers are two integrated complementary modes. Usually, a hybrid model is constrained with two phases. In the beginning, the filter method is applied to get rid of the irrelevant features by leaving some vital features. This resulted in limiting the size of data processing. Later, the residual feature represents the actual data which is employed as input parameter to transfer into wrapper for future optimization of significant features. Therefore, the decision fusion technologies are classified as two classes: winner-take-all and weighted sum, by assuming the combination of decisions derived from fundamental classification models [22]. In weighted sum, the weight of every basic classifier is based on corresponding abilities. The weights of basic classification are estimated and simulation outcome with weights are combined to provide final decision. Hence, the weighted sum is composed of both average as well as Neural Network (NN) [23–30].
The overall process of the proposed model is illustrated in Fig. 3. Hadoop MapReduce and Spark were utilized in this study to achieve faster computation of big data in parallel computational platform. The projected approach involves a set of processes namely initialization, pre-processing, FS and multimodal classification for effective detection of intrusions. Once the data was initialized and pre-processed, CBOA-based FS process was performed to select the optimal set of features. Followed by, DL-based multimodal data classification was conducted to detect intrusions.
In the beginning, the architecture of the system is validated, when the extended systems are capable of supporting parallel processing of dense dataset. During initial stage, NetBeans is initialized on JDK8.0 and the essential libraries are acquired to NetBeans. Then, Hadoop is applied which tends to employ Yarn, MapReduce and HDFS. After which, this is initialized with Apache Spark in the similar cluster with Hadoop MapReduce. These modules are implemented in recent decade that again initiates parallel processing. At last, the initializing stage gets completed with the import of NSL KDD dataset to NetBeans.
Hadoop MapReduce: Hadoop is named as ‘Big Data Handler’ since the system is mainly used to control huge volumes of data generated. Hadoop 2.6.0 was used in this research for model implementation. The Hadoop is utilized through various methods like Hadoop Distributed File System (HDFS), MapReduce, HBase, Hive, Pig and so on. For Hadoop, YARN manages the related resources and job scheduling operation. For specific situations, the data is required adversely that gets saved in HDFS. Hadoop is capable of saving data in peta-bytes and zetabytes without any limited storage. At the same time, when applied with MapReduce, it offers rapid processing. MapReduce is defined as batch-centric programming approach in Hadoop which performs data management and job scheduling. MapReduce divides the data into autonomous chunks which are computed wholly by mapping functions tasks in parallel manner.
Apache Spark: Spark is referred as a BDS deployed on Hadoop and implemented on Hadoop Yarn. Here, it is employed with Apache Spark version 2.1.0. Spark could be a standalone with MapReduce and HDFS. The units of Spark are SQL, Streaming and MLlib (Machine Learning library). Some of the classification models in Apache Spark are still applied. Hadoop clusters run on interactive query, streaming data, and Apache Spark.
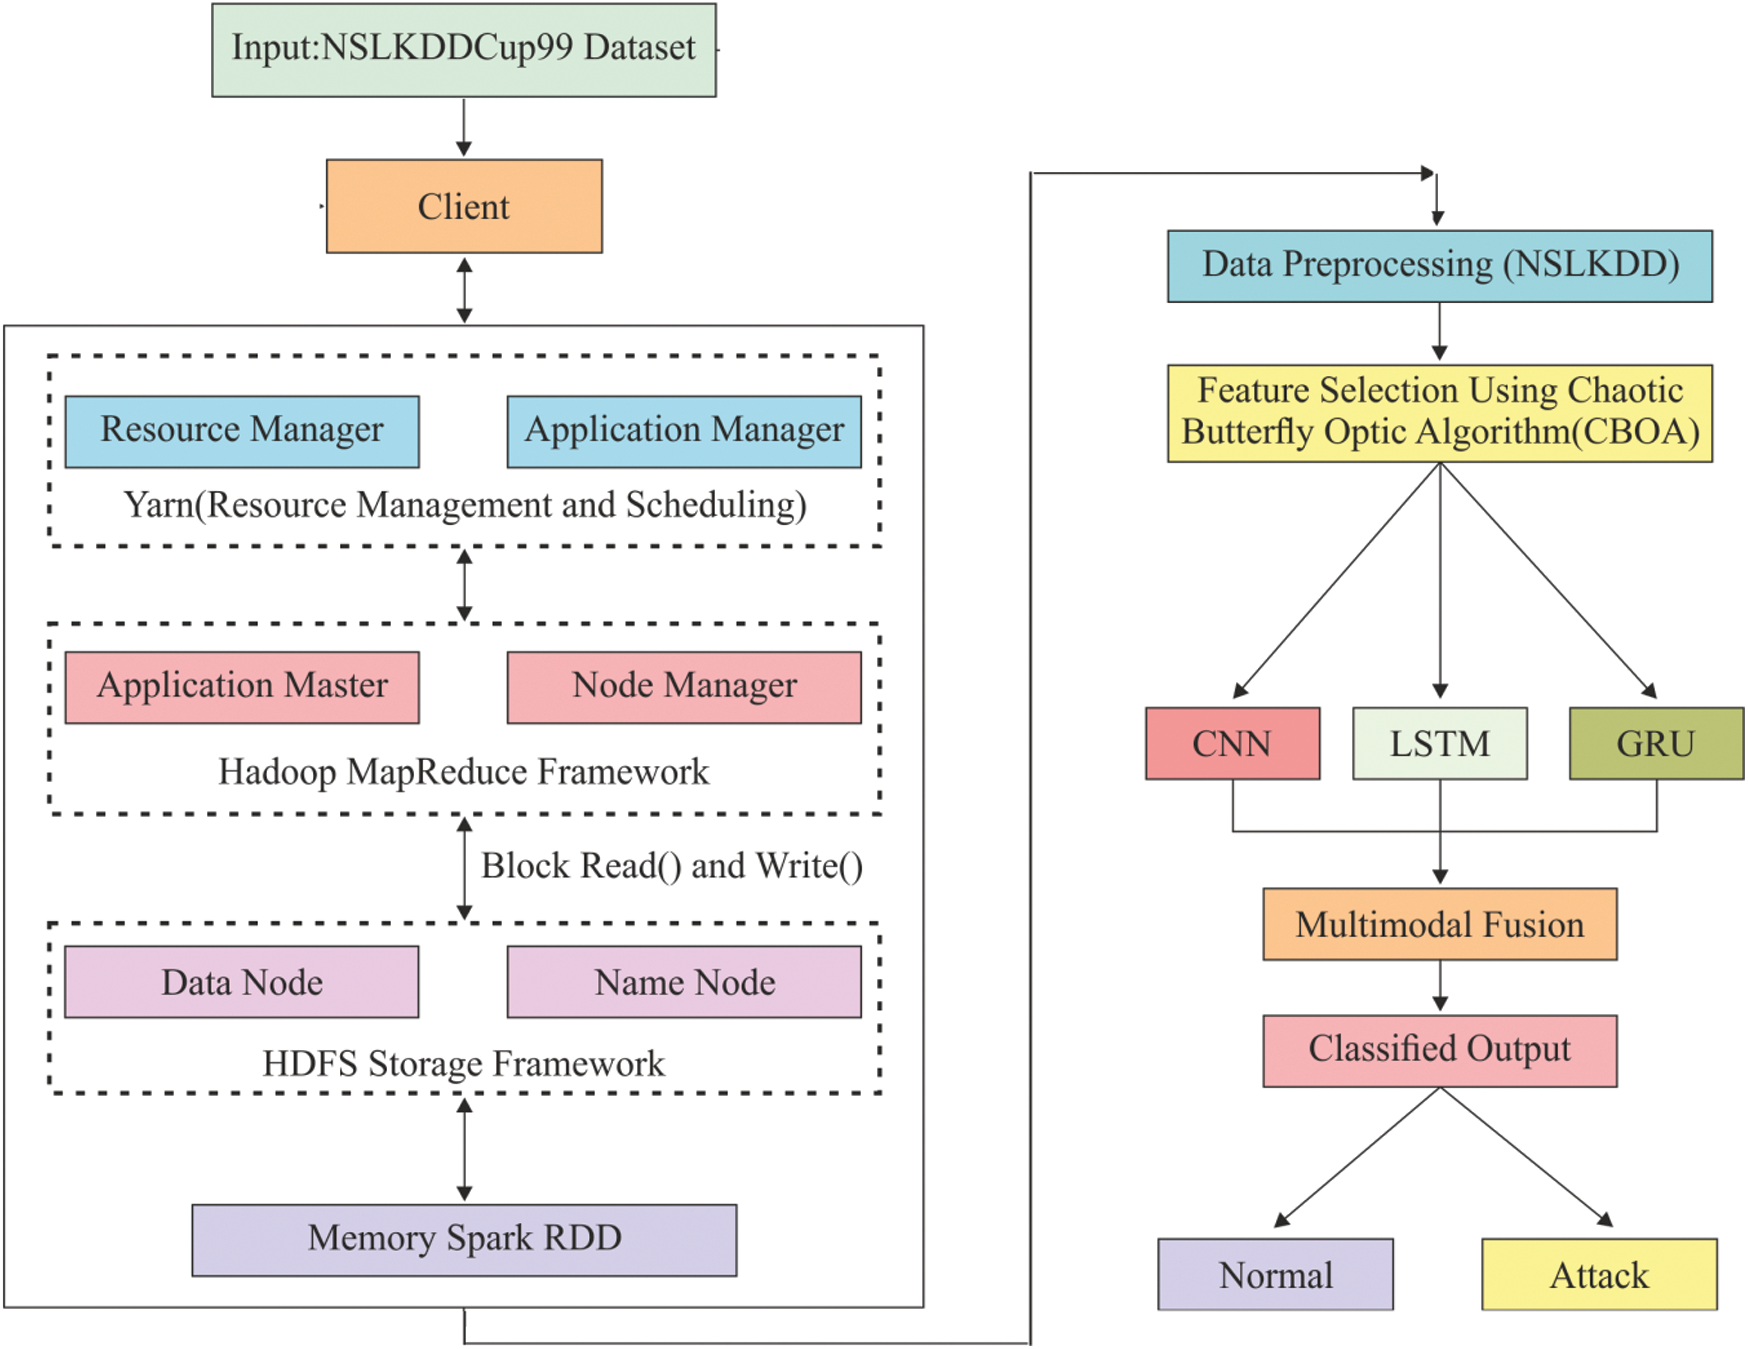
Figure 3: Block diagram of the proposed model
Spark RDD: It supports a systematic method that is identical to MapReduce; but expands with ‘Resilient Distributed Dataset’s (RDD) which is a data-sharing abstraction. With the application of these abstractions, the Spark is capable of capturing a wider processing overhead that requires unique engines such as streaming, Machine Learning (ML), SQL, and graph computation.
NSL KDD cup dataset has been processed earlier itself since it is applied for IDS and has been updated by removing repeated measures in training set as well as without any duplicate records in test set. Therefore, it is processed in this study to attain a dataset with robust processing, absence of repetitive values, and lack of values in a column. It is pre-processed again by applying Parse-labelled-point. In MLlib, the labelled points are employed in supervised learning models. Also, it employs a double to store the label, thus the labelled points could be utilized in regression as well as classification. Spark.ml package offers ML whereas API developed the data frame which becomes the main portion of Spark SQL library.
Butterfly Optimization Algorithm (BOA) is a novel, speed optimizing model with minimum processing complexity and optimal resolving convergence. This method was developed on the basis of food exploring behavior of butterfly. Butterflies are types of insects with various capabilities like hearing, smelling, and taste. These capabilities help the species find applicable nectar, partner mating, and egg laying in adoptable place and escape from attackers. The study shows that the smelling nature of butterflies is a vital feature in identifying the food in faraway distance. Butterflies search food by chemoreceptors. It is capable of sensing and placing diverse aromas inside an optimal precise. The population in BOA is defined by a set of butterflies as “searching agents”. The expense of an objective function in BOA differs on the basis of butterflies’ place. BOA is defined as Swarm Optimization Algorithm (SOA) in which all the agents share the knowledge by alternate butterflies on the basis of fragrance distance. Under the sensation of a fragrance, it migrates through the phase of global searching point. The procedure involved in the BO algorithm is provided in Algorithm 1.
Fragrance: Fragrance in BOA, is classified into three parts: Power exponent (a), Sensory modality (c), Stimulus intensity (I). Power is an exponent used for selecting important density which leads to linear response, regular, and response compression. Alternatively, sensory is defined as the form of energy whereas the modality defines the applied input by sensors. The substances of butterflies are developed by two vital cases: difference of fragrance (f) and stimulus intensity (I). It is expressed as given below.

where, and  are in a range [0,1].
Movement of butterflies: It is composed with three major phases, such as Initialization, Searching, and Finalizing. Here, the algorithm metrics are fixed. Once the parameters are fixed, the optimization process is initiated. The primary location of a butterfly can be generated in random manner from solution space. After the initiation of the iteration, the artificial butterflies, present in a search space, migrate to the new place and reach the cost values. Then, butterflies produce a fragrance in the same location as given below

where, g* shows the best solution for iteration  ,
,  defines the solution vector
  for
for  th butterfly, fragrance of
  th butterfly is mentioned by and
  and
and  depict random constant from (0,1).
The BOA parameters, along with partner mating as well as food exploration of butterflies, could be executed in global and local scales.
The local search in this model can be attained as provided below:

3.3.2 Chaotic Butterfly Optimization (CBO) Algorithm
BOA model has achieved better outcome in searching the best measures which has few restrictions in the convergence. In this study, a novel approach is projected to change the required metrics of BOA in terms of convergence speed. In order to resolve these issues, the vector of major parameters for BOA, is given by  that depends upon chaos theory. Chaos science is referred as the learning task which is about random and unpredictable task. It is highly used in maximum sensation that gets affected by minimum adjustments. The feature produces the points with greater distribution as well as resolves the complexity to enhance the points’ distribution. A common format for chaos theory is represented by:

where,  shows the map dimension, and
  implies a chaotic model generator. Here, logistic mapping can be applied as,


where,  denotes the iteration value,
  is the initial arbitrary measure, and
  defines a control parameter in the interval of
  –
– . It is pointed that
  during which the function might be in a chaos state. Fig. 4 demonstrates the flowchart for the proposed optimization algorithm.
Figure 4: Flowchart of CBO algorithm
3.3.3 CBO-Based Feature Selection Process
Feature Selection (FS) is defined as a binary optimization issue where the searching agents are confined with binary {0, 1} values. Here, all the solutions undergo characterization as 1D vector with length of vector based on the value attributes in dataset. Each cell of a vector contains two values, (1 or 0), where value 1 shows the adjacent attribute as selected while 0 indicates the attribute to be non-selected. FS issue could be assumed as a multi-objective optimization issue where two contrast goals to be attained; selection of low number of features as well as higher classification accuracy. To resolve multi-objective issue, two binary optimization models are presented. In FS issue, the solution is named as the optimal one when it is composed of a smaller number of features along with maximum classification accuracy.
The intention is to find a balance among number of attributes as well as classification accuracy; Fitness Function (FF) in Eq. (10) is used in optimization models to estimate these solutions.

where  refers a classification error rate. Therefore, |R| is a cardinality of selected feature subset while
  shows the overall features in actual dataset, α and β are two parameters to the significance of classifying quality and subset length,
 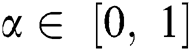 and
and  applied in the study.
The CNN, LSTM and GRU process the essential classification in the pre-processed as well as the dataset chosen by classification phase, according to the training principles used. The attained results are induced as input for the next iteration. Usually, the input is classified as attack and not-attack. By analysing the input and output traffic, it computes the DoS attack.
CNN is a typically-applied ANN method [31]. It belongs to the class of deep, feed-forward ANN which is used in examining visual imagery. Also, it is familiar feature extraction as well as time-series data classification. CNN is identical to Multilayer Perceptron (MLP). It enables CNN to have translational as well as rotational invariance that tend to structure a method. Generally, the CNN is comprised of more than one convolutional layer and fully connected (FC) layer such as weights and pooling layers.
Convolutional layer: A dot product of every sub-region of input data with a kernel is included by a bias through an activation function to generate a feature map for consecutive layer. When the beat undergoes a sampling, the data input vector is  , where ‘n’ implies the number of samples for each beat and resultant values are determined on the basis of Eq. (9).

Here,  shows a layer index;
  implies an activation function that is used to establish a non-linearity to layer;
  represents the bias term for
  th feature map;
  indicates a kernel size, and
  is a weight.
Max-pooling layer: This layer is defined as a sub-sampling layer. It applies convolutional layer and performs down-sampling task to minimize the size of a feature. It is employed with tiny rectangular blocks of data and generates a single output for all blocks. Here, a Maxpooling task is applied to estimate the maximum value. The pooling of a feature map from a layer is provided as given in Eq. (10).

Here,  shows the size of pooling window and T implies a pooling stride.
LSTM is defined as time Recurrent Neural Network (RNN) [32]. It is composed of a cell, an input gate, an output gate, and a forget gate. The unit has the values at diverse time intervals whereas three gates are used in data flow management. The forget gate can be managed using a simple 1-layer NN. The activation of a gate is estimated by applying Eq. (11).

Here,  denotes an input sequence;
  shows the existing block output;
  implies traditional LSTM block memory;
  depicts a bias vector;
  is a separate weight, and a logistic sigmoid function.
The input gate contains novel memory developed by easy NN along with tanh activation function and existing memory block effect. Such task is evaluated by Eqs. (12) and (13).


The resultant gate is comprised with result of recent LSTM block. It is determined by applying Eqs. (14) and (15).


The Gated Recurrent Unit (GRU) is an alternate model [33] of gate-relied recurrent unit that contains minimum structure and similar operation of LSTM unit. GRU has two gates: Reset and update.  and
and  are the measures of reset and update gates at time step t, correspondingly.
  shows 1D input vector to GRU block at time step
  represents the output candidate of GRU block.
  defines the recurrent GRU block output of time step
  and the present output at time
  is
is  . These functions are estimated in the following equations.


where  ,
,  , and
, and  are feedforward weights and
  ,
,  , and
, and  are RNN weights of update gate, reset gate, and output candidate activation.
  ,
,  and
and  are biases of these gates and output candidate activation
  , correspondingly.
Here, the decision-based fusion is used on inputs obtained from existing phase. It is employed with big data; an effective and accurate classification is required to perform rapid processing and provide exact results with low false alarm rate and greater value for detection value. Thus, rather to combine every classifier, it concatenates CNN, LSTM and GRU. The results from classification phase are two classes such as attack and not-attack respectively.
The proposed model was executed in Windows10 platform on a 64-bit OS and a system with configuration of i7 processor with 6 GB RAM. The simulation was carried out using NetBeans 8.2 to execute all the applications like Hadoop MapReduce task, and Spark (RDD). A detailed set of experiments was conducted using NSLKDDCup99 Dataset. The applied dataset and simulation outcome of the presented technique are explained in the upcoming section.
NSLKDDCup99 Dataset [20] is a current model of the older KDD Cup 99dataset. It has no repetitive instances in training and testing datasets. Obviously, it is a minimized version of the KDD cup 99 dataset and comprises of a set of 1, 25,973 instances in the training set and 22,544 records in the testing set, along with a set of 41 features. It is the current version of KDD Cup 99 dataset that is applied to work on IDS. Tab. 1 tabulates the details of the applied dataset. The attacks and normal instances exist in the NSL KDD 99 dataset are shown in the Fig. 5. Then, different kinds of attacks that exist in the NSL KDD dataset with their patterns are shown in Fig. 6. For experimentation, 10 fold cross validation process is applied to split the applied dataset into training and testing parts.
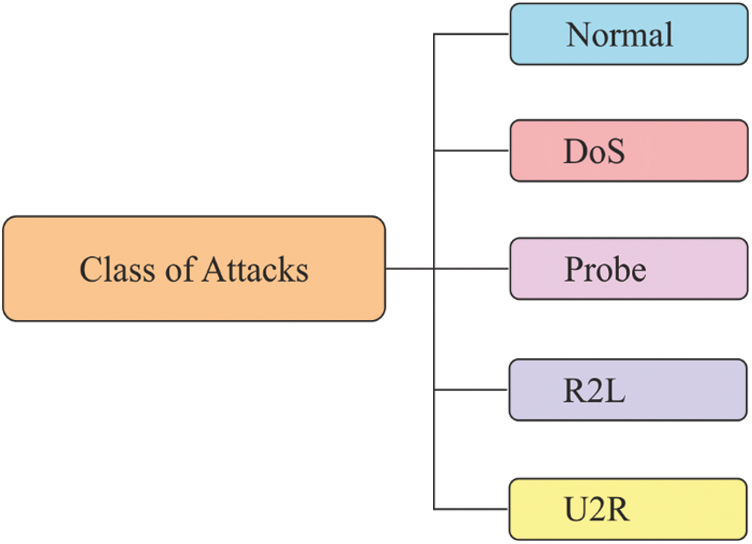
Figure 5: Types of attacks in NSLKDDCup99 dataset

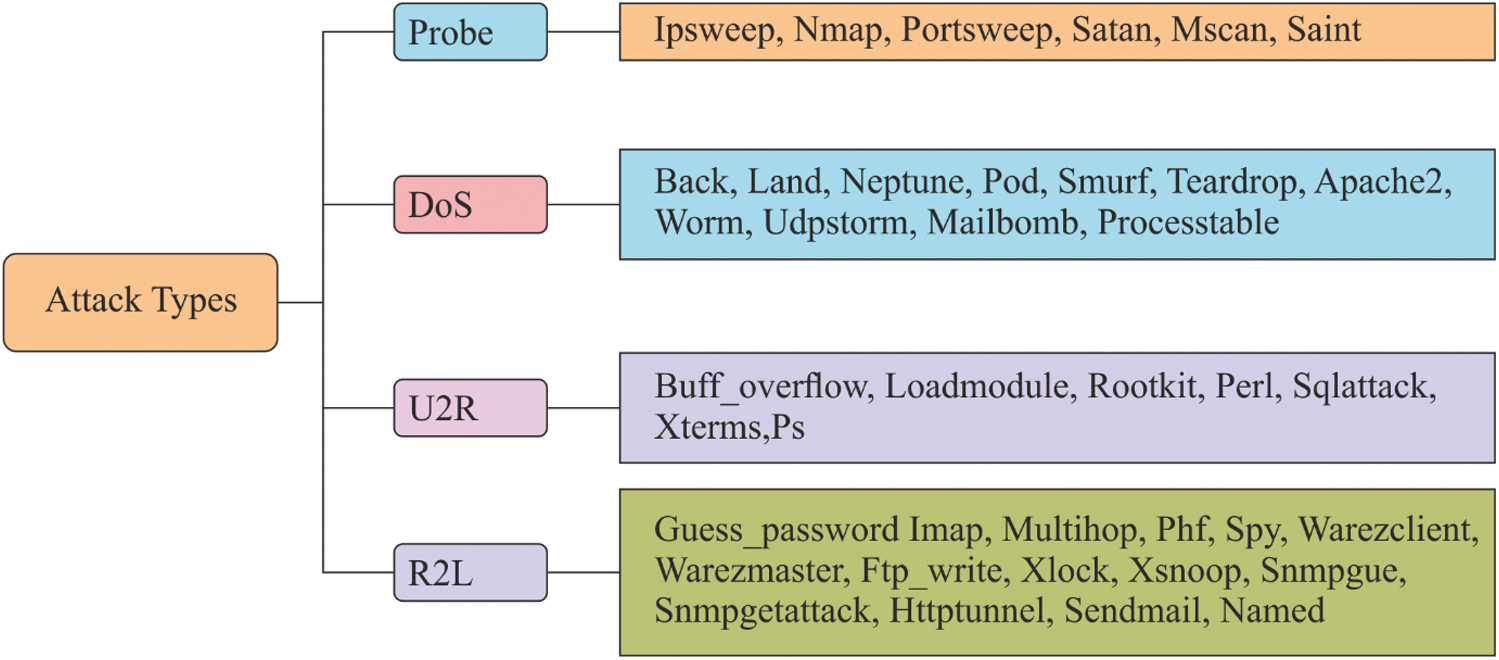
Figure 6: Types of attack patterns in NSLKDDCup99 dataset
Tab. 2 and Fig. 7 examine the FS results of diverse models on the applied dataset in terms of best cost and chosen features. The table values indicate that the PSO-FS algorithm achieved ineffective FS results by attaining the maximum best cost of 0.009139. At the same time, the results also indicate that the GA-FS technique exhibited slightly better FS outcome over PSO-FS algorithm by offering a slightly lower best cost of 0.008150. In the same way, the BGOA-FS algorithm achieved near optimal results with the best cost of 0.006530. At last, the proposed model outperformed with best optimal FS results with the selection of 21 features and best cost of 0.002345.
Table 2: Result analysis of existing FS with proposed CBOA FS method for applied dataset
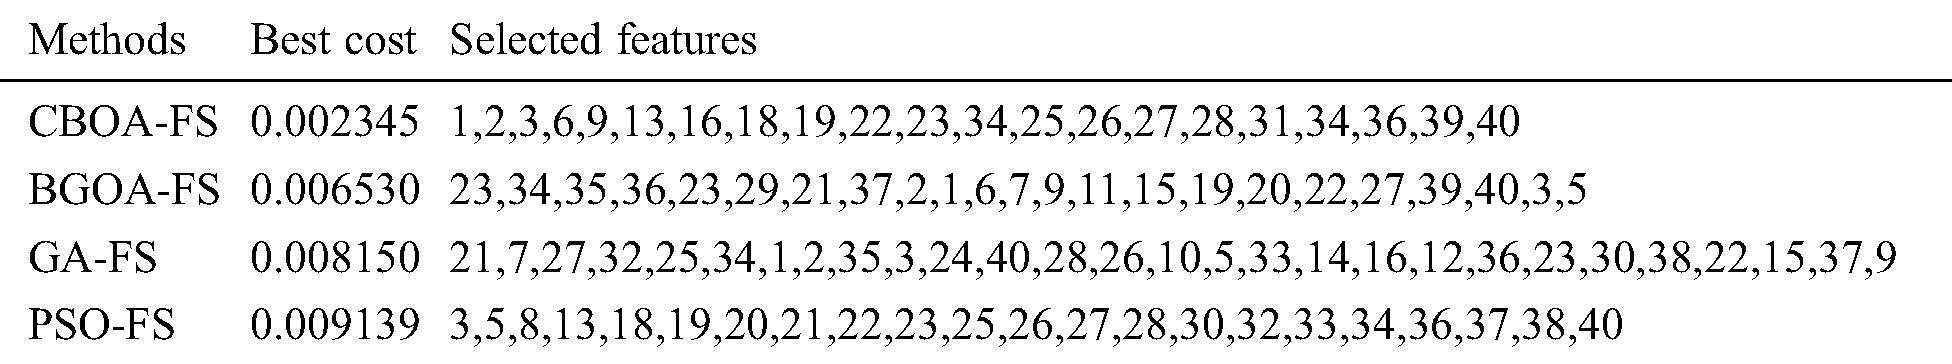
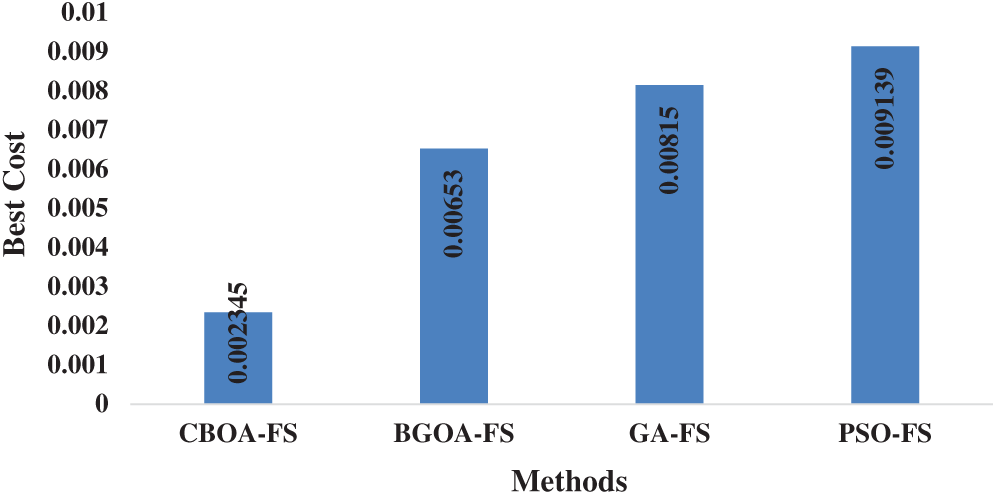
Figure 7: Best cost analysis of diverse FS models
Tab. 3 and Fig. 8 show the multimodal classifier results of the analysis in terms of different measures under the absence and presence of FS process.
Table 3: Result analysis of the proposed method in terms of accuracy, precision and detection rate
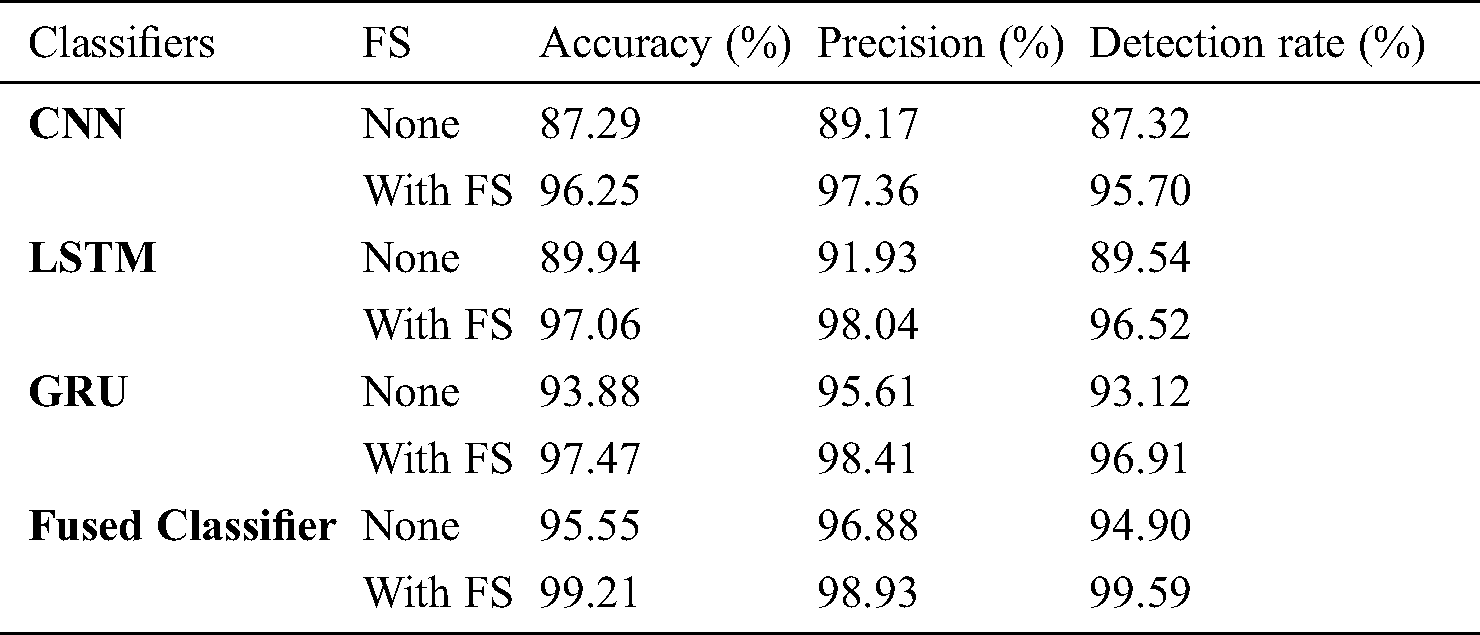
The table values pointed out that CNN is the least performer since it attained minimal results over other compared methods. At the same time, the LSTM model generated slightly better classification outcome over CNN, but not superior than GRU and fused classifier. In line with this, the GRU model resulted in a manageable outcome over other models. However, the proposed fused classifier, without FS itself, outperformed the compared methods with FS. In addition, the fused classifier with FS process was observed to have achieved an optimal accuracy of 99.21%, precision of 98.93% and detection rate of 99.59%.
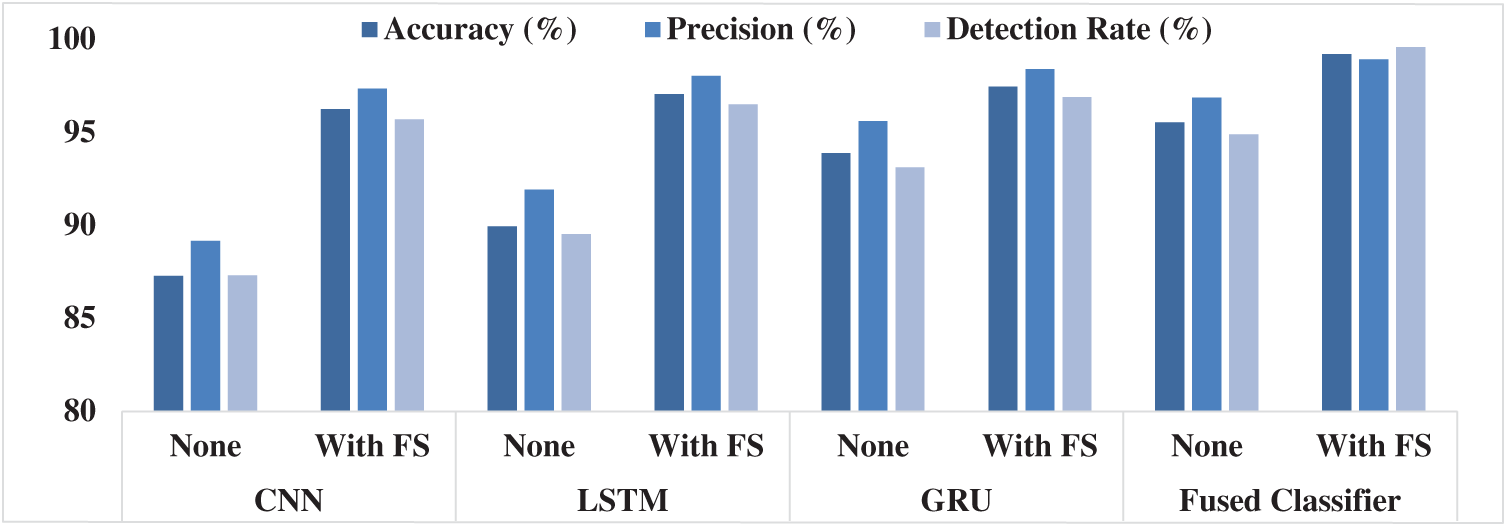
Figure 8: Multimodal fusion results analysis
Tab. 4 provides a detailed comparison of the results attained by the proposed model with a set of existing methods [21] namely SVM, GBT, DT, RF, LR and SVM + GBT + DT + RF + LR models.
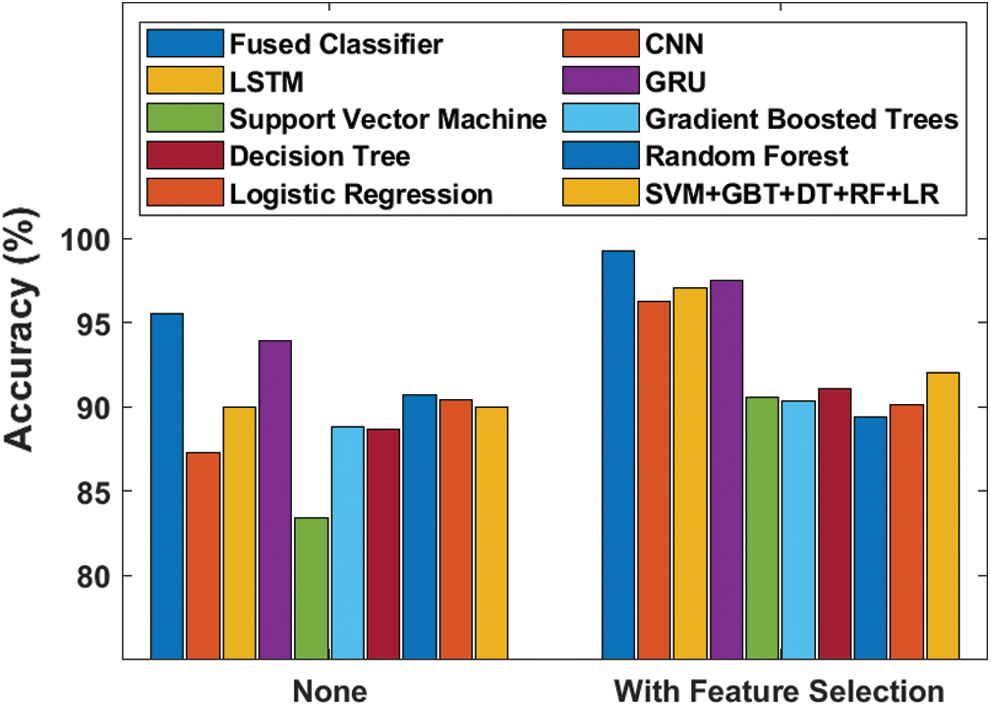
Figure 9: Accuracy analysis of diverse models
Fig. 9 showcases the effectiveness of the proposed model in terms of accuracy with and without FS process. The figure portrays that the SVM model failed to yield better results with the least accuracy value of 83.38%, which then got improved to 90.58% when using FS process. Besides, the GBT and DT models attained slightly higher and near-identical results with their accuracy values being 88.79% and 88.68% respectively. This also got increased to 90.36% and 91.04% respectively when utilizing FS process. At the same time, RF, LR and SVM + GBT + DT + RF + LR models attempted their best to attain manageable results with the accuracy values of 90.69%, 90.37% and 89.95% respectively. This also got improved to 89.39%, 90.13% and 92.30% correspondingly when using FS process. Followed by, the CNN model attained slightly lower accuracy value of 87.29% which further got significantly increased to 96.25% with the induction of FS process. The LSTM model reached higher accuracy value of 89.94% without FS and 97.06% when using FS process. Moreover, it can be noticed that the GRU model produced competitive results with accuracy values of 93.88% and 97.47% respectively with and without FS processes. However, the proposed model attained the best results compared to other methods by yielding the maximum accuracy of 95.55%, which got further increased to 99.21% when FS process was included.
Table 4: Result analysis of the proposed method with existing methods in terms of accuracy, precision and detection rate
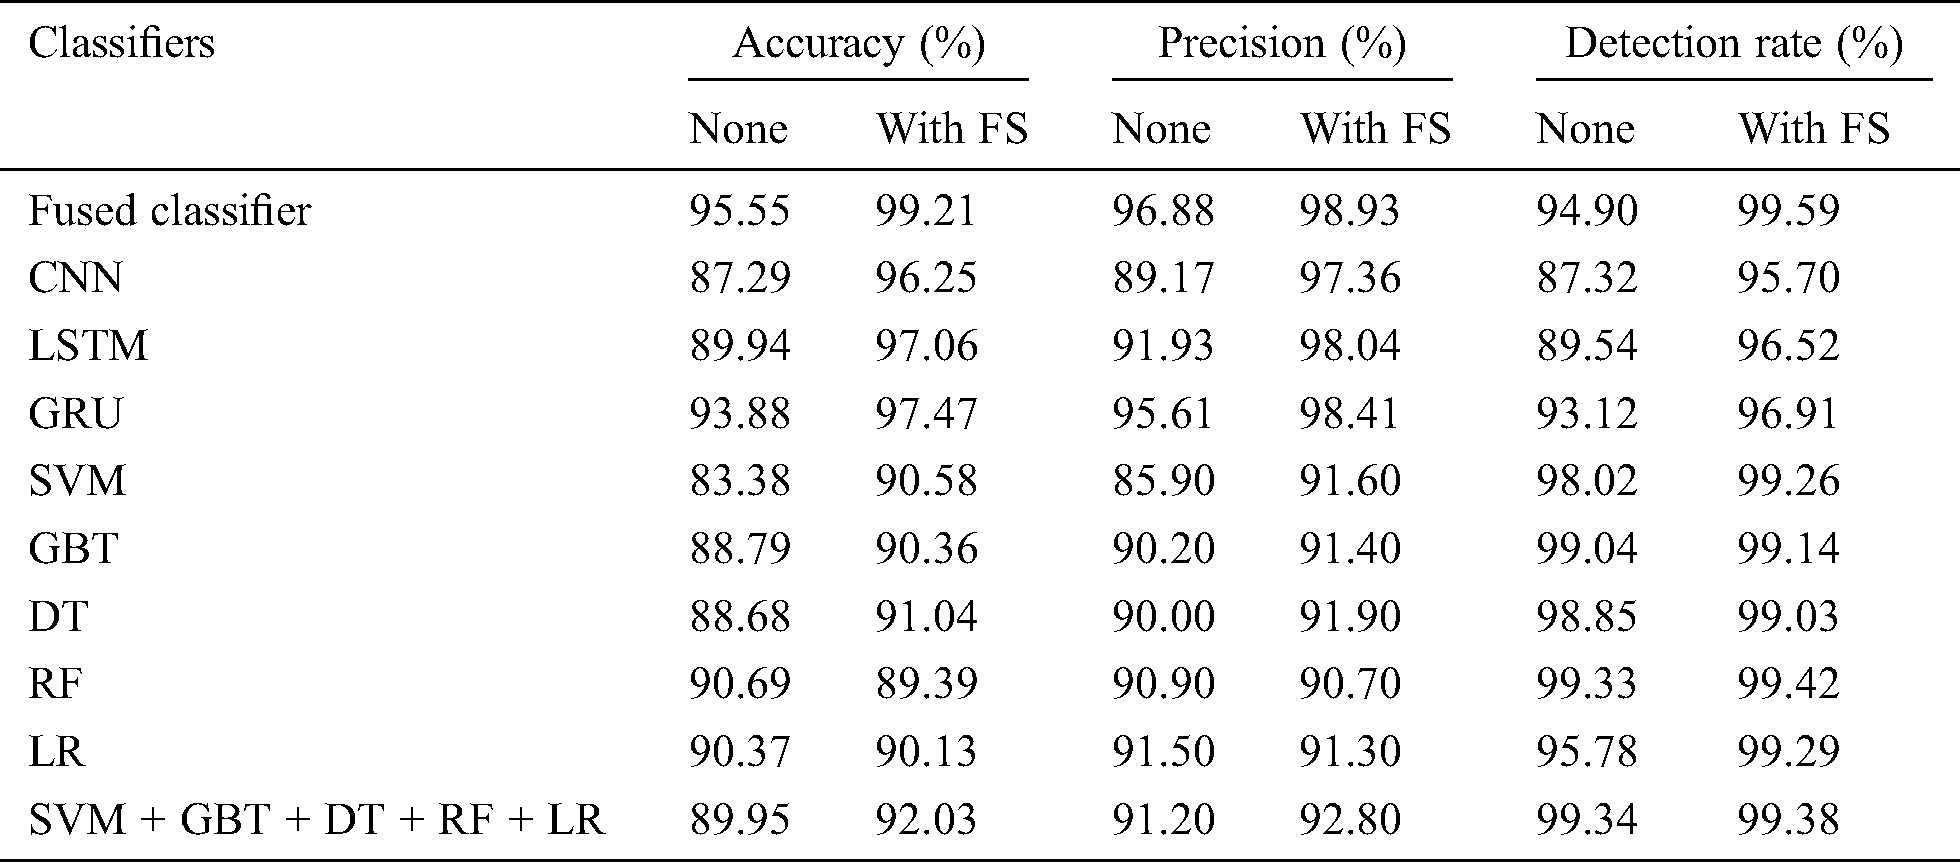
Fig. 10 examines the efficiency of the proposed method with respect to precision with and without FS tasks. The figure states that the SVM model failed to produce good results with 85.90% minimum precision value which then got enhanced to 91.60% when FS process was applied. On the other hand, both CNN and DT model reached slightly better and closer identical results with the precision values of 89.17% and 97.36% respectively. When FS process was applied, these values also got improved to 90% and 91.90% respectively. Simultaneously, GBT, RF and SVM + GBT + DT + RF + LR models attempted to reach appreciable outcome with precision values of 90.20%, 90.90% and 91.20% which then got improved to 91.40%, 90.70% and 92.80% correspondingly by the employment of FS process. The LR model accomplished slightly lower precision value of 91.50% which got significantly increased to 91.30% when FS process was deployed. The LSTM model attained uniform higher precision value of 91.93% without FS and 98.04% with FS process. Furthermore, it is evident that the GRU model achieved competitive results with 95.61% with FS process and 98.41% without FS process. But the presented system attained qualified results compared to other methods by achieving a higher precision of 96.88% which got further improved to 98.93% when FS process was added.
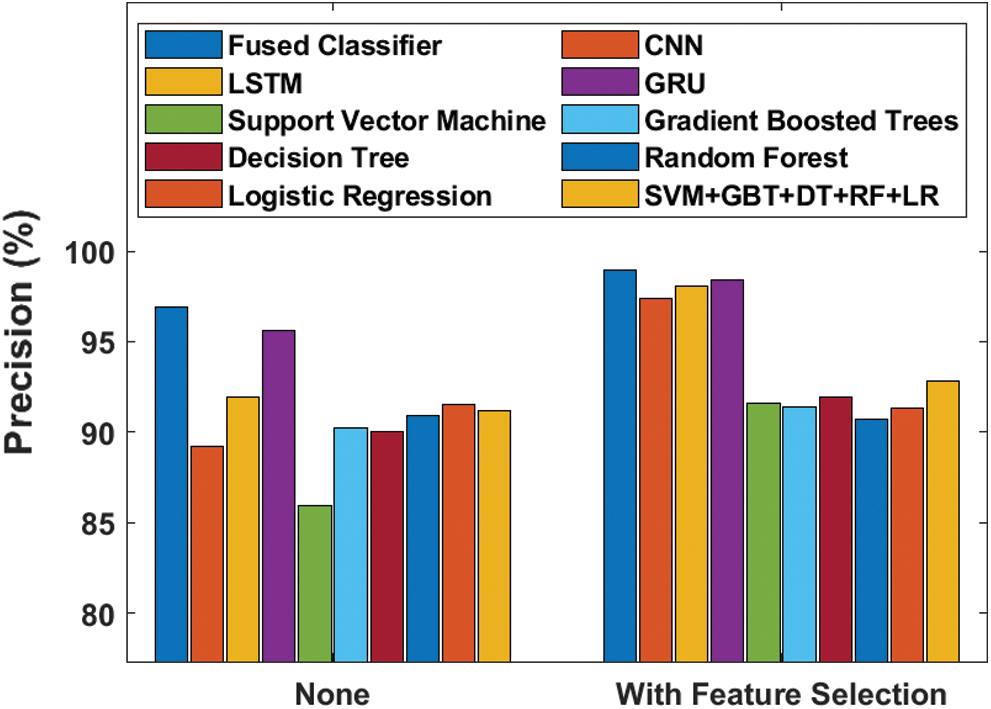
Figure 10: Precision analysis of diverse models
Fig. 11 analyzes the efficiency of the proposed model by means of detection rate with and without FS processes. The figure shows that the CNN model was not at all capable of providing better results with lower detection rate i.e., 87.32% though it got increased to 95.70% when FS task was applied. Meanwhile, LSTM and GRU models achieved detection rates of 89.54% and 94.90% respectively which got improved to 93.12% and 96.91% when employing FS model. Similarly, in the proposed system, LR and SVM models tried to reach acceptable results with detection rate values of 94.90%, 95.78% and 98.02%, which got further enhanced to 99.59%, 99.29% and 99.26% respectively by the exploitation of FS process. A low detection rate value of 98.85% was achieved by DT model and this value got incremented to 99.03% when using FS process. Then, the GBT model reached even higher detection rate value of 99.04% without FS and 99.14% when using FS process.
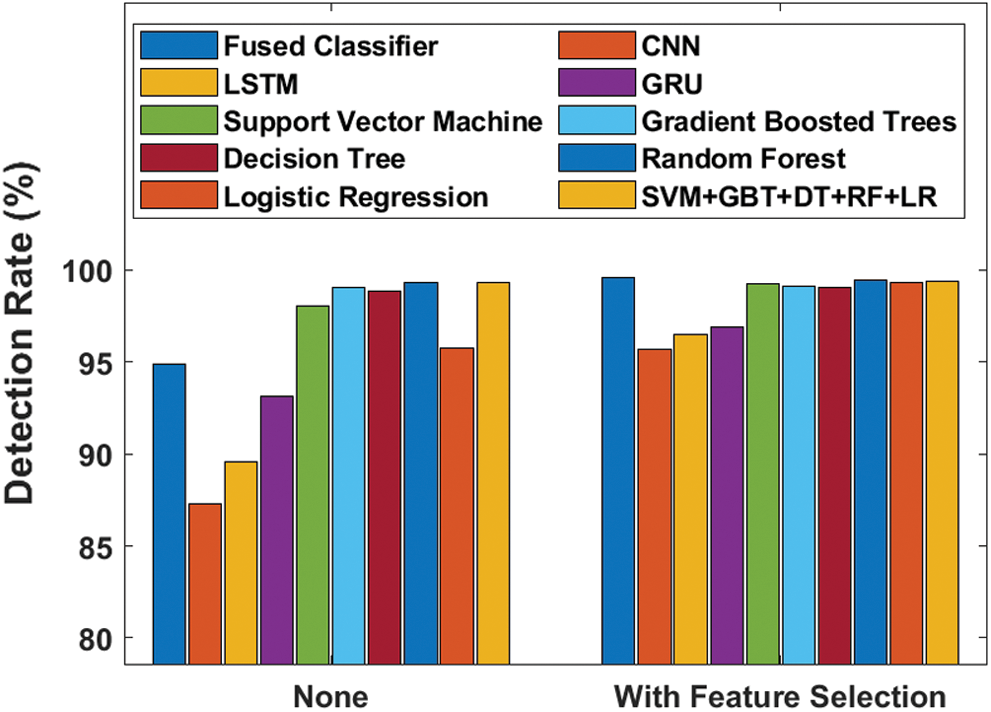
Figure 11: Detection rate analysis of diverse models
Furthermore, it can be noticed that the SVM + GBT + DT + RF + LR model yielded competitive results with detection rate values of 99.34% and 99.38% with and without FS processes. Therefore, the RF model achieved qualified results compared to other methods by yielding 99.33% optimal detection rate that got further enhanced to 99.42% with the inclusion of FS process. After observing the experimental results offered by the proposed and existing models, it is inferred that the proposed model is superior to other compared methods since it produced maximum results in several aspects. The increased performance of the proposed model might be attributed to the multimodal fusion process of CNN, LSTM and GRU models. Besides, the inclusion of CBO algorithm for FS also had a positive impact on the classification performance.
This research work has developed an effective multimodal IDS for healthcare environment in Spark. The proposed model made use of the CBO algorithm to select the features by optimizing the parameters of the classical BO algorithm and followed chaos theory to achieve faster convergence. Then, the multimodal DL classifiers namely CNN, LSTM and GRU models were applied to improve the detection rate. Besides, Hadoop MapReduce and Spark were utilized to achieve faster computation of big data in a parallel computational environment. The experimental validation of the proposed model was undertaken using a benchmark dataset. From the experimental analysis, it is observed that the proposed model resulted in optimal FS results with the selection of 21 features and the best cost of 0.002345. The proposed model demonstrated its effective results on the applied dataset by offering the maximum accuracy of 99.21%, precision of 98.93% and detection rate of 99.59%. In future, the performance of the proposed model can be enhanced by a bio-inspired algorithm-based multimodal classification technique.
Funding Statement: The authors received no specific funding for this study.
Conflicts of Interest: The authors declare that they have no conflicts of interest to report regarding the present study.
1. F. Castanedo. (2013). “A review of data fusion techniques,” Scientific World Journal, vol. 2013, no. 6, pp. 1–19. [Google Scholar]
2. H. Bostrom, S. F. Andler and M. Brohede. (2007). “On the definition of information fusion as a field of research,” Neoplasia, vol. 13, pp. 98–107. [Google Scholar]
3. J. Tian, W. Zhao, R. Du and Z. Zhang. (2005). “A new data fusion model of intrusion detection—IDSFP,” in Parallel and Distributed Processing and Applications. vol. 3758, Springer, Berlin, Heidelberg, pp. 371–382. [Google Scholar]
4. F. E. White. (1991). Data Fusion Lexicon. Defense Technical Information Center, Joint Directors of Labs Washington DC. [Google Scholar]
5. H. Boström, S. F. Andler, M. Brohede, R. Johansson and A.Karlsson. (2007). “On the definition of information fusion as a field of research,” Neoplasia, vol. 13, pp. 98–107. [Google Scholar]
6. A. N. Steinberg and C. L. Bowman, “Revisions to the JDL data fusion model,” in Handbook of Multisensor Data Fusion. Chapman and Hall/CRC Press, pp. 65–88, 2017. [Google Scholar]
7. R. Gravina, P. Alinia, H. Ghasemzadeh and G. Fortino. (2017). “Multi-sensor fusion in body sensor networks: State-of-the-art and research challenges,” Information Fusion, vol. 35, pp. 68–80. [Google Scholar]
8. R. Gifty, R. Bharathi and P. Krishnakumar. (2019). “Privacy and security of big data in cyber physical systems using Weibull distribution-based intrusion detection,” Neural Computing and Applications, vol. 31, no. 1, pp. 23–34. [Google Scholar]
9. I. Ahmad, M. Hussain, A. Alghamdi and A. Alelaiwi. (2014). “Enhancing SVM performance in intrusion detection using optimal feature subset selection based on genetic principal components,” Neural Computing and Applications, vol. 24, no. 7, pp. 1671–1682.
10. J. Kevric, S. Jukic and A. Subasi. (2017). “An effective combining classifier approach using tree algorithms for network intrusion detection,” Neural Computing and Applications, vol. 28, no. 1, pp. 1051–1058. [Google Scholar]
11. I. S. Thaseen and C. A. Kumar. (2017). “Intrusion detection model using fusion of chi-square feature selection and multi class SVM,” Journal of King Saud University-Computer and Information Sciences, vol. 29, no. 4, pp. 462–472. [Google Scholar]
12. L. Cao, J. Tian and W. Jiang. (2007). “Information fusion technology and its application to fire automatic control system of intelligent building,” in Proc. of the Int. Conf. on Information Acquisition, Seogwipo-si, South Korea, pp. 445–450. [Google Scholar]
13. L. Zhang, H. Leung and K. C. C. Chan. (2008). “Information fusion based smart home control system and its application,” IEEE Transactions on Consumer Electronics, vol. 54, no. 3, pp. 1157–1165. [Google Scholar]
14. Y. Xiao and Z. Shi, “Application of multi-sensor data fusion technology in target recognition,” in Proc. of the 3rd IEEE Int. Conf. on Advanced Computer Control, Harbin, China, pp. 441–444, 2011. [Google Scholar]
15. X. Hu and X. Wang, “Application of fuzzy data fusion in multi-sensor fire monitoring,” in Proc. of the 2012 Int. Sym. on Instrumentation and Measurement, Sensor Network and Automation, Sanya, China, vol. 1, pp. 157–159, 2012. [Google Scholar]
16. Z. Yan, X. Jing and W. Pedrycz. (2017). “Fusing and mining opinions for reputation generation,” Information Fusion, vol. 36, pp. 172–184. [Google Scholar]
17. J. Liu, Z. Yan and L. T. Yang. (2015). “Fusion—An aide to data mining in internet of things,” Information Fusion, vol. 23, pp. 1–2. [Google Scholar]
18. B. A. Fessi, S. Benabdallah, Y. Djemaiel and N. Boudriga, “A clustering data fusion method for intrusion detection system,” in Proc. of the 11th IEEE Int. Conf. on Computer and Information Technology CIT, 2011, Paphos, Cyprus, pp. 539–545, 2011 [Google Scholar]
19. G. H. John, R. Kohavi and K. Pfeger, “Irrelevant features and the subset selection problem,” in Proc. of the Eleventh Int. Conf. on Machine Learning, New Brunswick, New Jersey, USA, pp. 121–129, 1994. [Google Scholar]
20. E. D. L. Hoz, A. Ortiz, J. Ortega and A. M. Alvarez. (2014). “Feature selection by multi-objective optimisation: Application to network anomaly detection by hierarchical self-organizing maps,” Knowledge-Based Systems, vol. 71, pp. 322–338. [Google Scholar]
21. S. Mukherjee and N. Sharma. (2012). “Intrusion detection using Naive Bayes classifier with feature reduction,” Procedia Technology, vol. 4, pp. 119–128. [Google Scholar]
22. A. P. Chan, D. S. Yeung, E. C. Tsang and W. W. Ng. (2006). “Empirical study on fusion methods using ensemble of RBFNN for network intrusion detection,” Lecture Notes in Artificial Intelligence, vol. 3930, pp. 682–690. [Google Scholar]
23. University of New Brunswick, NSL-KDD dataset, 2009. [Online]. Available: https://www.unb.ca/cic/datasets/nsl.html. [Google Scholar]
24. G. Donkal and G. K. Verma. (2018). “A multimodal fusion based framework to reinforce IDS for securing big data environment using Spark,” Journal of Information Security and Applications, vol. 43, pp. 1–11.
25. K. Shankar, S. K. Lakshmanaprabu, A. Khanna, S. Tanwar, J. J. Rodrigues et al. (2019). , “Alzheimer detection using group grey wolf optimization based features with convolutional classifier,” Computers & Electrical Engineering, vol. 77, pp. 230–243.
26. M. Elhoseny and K. Shankar. (2019). “Optimal bilateral filter and convolutional neural network based denoising method of medical image measurements,” Measurement, vol. 143, pp. 125–135.
27. S. K. Lakshmanaprabu, S. N. Mohanty, S. Krishnamoorthy, J. Uthayakumar and K. Shankar. (2019). “Online clinical decision support system using optimal deep neural networks,” Applied Soft Computing, vol. 81, 105487.
28. M. Elhoseny, G. B. Bian, S. K. Lakshmanaprabu, K. Shankar, A. K. Singh et al. (2019). , “Effective features to classify ovarian cancer data in internet of medical things,” Computer Networks, vol. 159, pp. 147–156.
29. S. Kathiresan, A. R. W. Sait, D. Gupta, S. K. Lakshmanaprabu, A. Khanna et al., “Automated detection and classification of fundus diabetic retinopathy images using synergic deep learning model,” Pattern Recognition Letters, vol. 133, pp. 210–216, 2020.
30. K. Shankar, Y. Zhang, Y. Liu, L. Wu and C. H. Chen. (2020). “Hyperparameter tuning deep learning for diabetic retinopathy fundus image classification,” IEEE Access, vol. 8, pp. 118164–118173. [Google Scholar]
31. H. Lee and H. Kwon. (2017). “Going deeper with contextual CNN for hyperspectral image classification,” IEEE Transactions on Image Processing, vol. 26, no. 10, pp. 4843–4855. [Google Scholar]
32. Q. Liu, F. Zhou, R. Hang and X. Yuan. (2017). “Bidirectional-convolutional LSTM based spectral-spatial feature learning for hyperspectral image classification,” Remote Sensing, vol. 9, no. 12, pp. 1330. [Google Scholar]
33. H. Luo. (2018). “Shorten spatial-spectral RNN with parallel-GRU for hyperspectral image classification”. arXiv preprint arXiv:1810.12563. [Google Scholar]
 | This work is licensed under a Creative Commons Attribution 4.0 International License, which permits unrestricted use, distribution, and reproduction in any medium, provided the original work is properly cited. |