DOI:10.32604/cmc.2021.013191
| Computers, Materials & Continua DOI:10.32604/cmc.2021.013191 | |
| Article |
Classification of Positive COVID-19 CT Scans Using Deep Learning
1Department of Computer Science, HITEC University Taxila, Pakistan
2College of Computer Science and Engineering, University of Ha’il, Ha’il, Saudi Arabia
3Division of Computer Science, Mathematics and Science, Collins College of Professional Studies, St.’John’s University, New York, USA
4Department of Mathematics and Computer Science, Beirut Arab University, Lebanon
5Department of Computer Science and Engineering, Soonchunhyang University, Asan, South Korea
6Department of Informatics, University of Leicester, Leicester, UK
*Corresponding Author: Yunyoung Nam. Email: ynam@sch.ac.kr
Received: 29 July 2020; Accepted: 17 October 2020
Abstract: In medical imaging, computer vision researchers are faced with a variety of features for verifying the authenticity of classifiers for an accurate diagnosis. In response to the coronavirus 2019 (COVID-19) pandemic, new testing procedures, medical treatments, and vaccines are being developed rapidly. One potential diagnostic tool is a reverse-transcription polymerase chain reaction (RT-PCR). RT-PCR, typically a time-consuming process, was less sensitive to COVID-19 recognition in the disease’s early stages. Here we introduce an optimized deep learning (DL) scheme to distinguish COVID-19-infected patients from normal patients according to computed tomography (CT) scans. In the proposed method, contrast enhancement is used to improve the quality of the original images. A pretrained DenseNet-201 DL model is then trained using transfer learning. Two fully connected layers and an average pool are used for feature extraction. The extracted deep features are then optimized with a Firefly algorithm to select the most optimal learning features. Fusing the selected features is important to improving the accuracy of the approach; however, it directly affects the computational cost of the technique. In the proposed method, a new parallel high index technique is used to fuse two optimal vectors; the outcome is then passed on to an extreme learning machine for final classification. Experiments were conducted on a collected database of patients using a 70:30 training: Testing ratio. Our results indicated an average classification accuracy of 94.76% with the proposed approach. A comparison of the outcomes to several other DL models demonstrated the effectiveness of our DL method for classifying COVID-19 based on CT scans.
Keywords: Coronavirus; contrast enhancement; deep learning; features optimization; fusion; classification
In December 2019, a new disease appeared in China’s Hubei province and then spread worldwide as a pandemic in 2020 [1,2]. Named coronavirus 2019 (COVID-19) by the World Health Organization (WHO) in February 2020 [3], the virus has as its root diseases severe acute respiratory syndrome (SARS-CoV) and the Middle East respiratory syndrome (MERS-CoV) [4]. Specifically, COVID-19 is caused by the SARS-CoV-2 virus [4] and potentially serious outcomes that include severe respiratory problems, organ failure, and death [5,6]. As of June 24, 2020, according to the WHO, 85,070 confirmed cases of COVID-19 in China and 4,646 deaths. After contracting COVID-19, 16%–21% of China’s population became seriously ill, with a 2%–3% [7]. The WHO reported 9,274,343 cases globally as of June 24, 2020, with 476,772 deaths, 4,994,670 recoveries, and a mortality rate of 5%. The United States registered 2,406,105 cases, 123,155 deaths, 29,271,214 tests, and 1,005,688 recoveries. Brazil reported 1,117,430 total cases, 51,502 deaths, and 594,104 recoveries from COVID-19; the total number of tests performed to date was 2,510,717. Of the 17,522,752 tests performed in Russia, 599,705 were positive for COVID-19, and there were 8,359 deaths. In India, the total number of COVID-19 cases was 455,859, with 258,523 recoveries and 14,483 deaths. The total number of COVID-19 cases and deaths in other countries during this period were as follows: the United Kingdom, 306,210 cases and 42,927 deaths; Spain, 293,832 cases and 28,325 deaths; Peru, 257,447 cases and 8,223 deaths; Chile, 250,767 cases and 4,505 deaths; Italy, 238,833 cases and 34,675 deaths; and Iran, 209,970 cases and 9,863 deaths. Pakistan reported 185,034 cases, 3,695 deaths, 1,126,761 tests, and 73,471 recoveries to date.
Reverse-transcription polymerase chain reaction (RT-PCR) is a time-consuming process that was less sensitive to COVID-19 identification in the disease’s early stages. However, deep learning (DL) techniques are showing progress for detecting the virus in its initial stages [8] in chest X-rays (CXRs) [9] and computed tomography (CT) images of infected patients. DL has successfully identified various diseases from medical images [10,11]. However, the application of DL to COVID-19 recognition requires customization of DL-based features. In one study, different convolutional neural network (CNN) models, such as AlexNet, VGG-16, GoogleNet, SqueezNet, Xception, ResNet-18, ResNet-50, and ResNet-101, were used to identify COVID-19 in chest CT images [12]. Of all of the DL models, ResNet-101 and Xception showed exceptional performance, with an area under the curve (AUC) of 0.994. Apostolopoulos et al. [13] performed transfer learning (TL) with pretrained CNN models and achieved a predictive accuracy of 98.75% with VGG-19. Three DL-based models, Inception-V3, ResNet-50, and Inception-ResNetV2 have also been used successfully to recognize COVID-19, with ResNet-50 showing a maximum accuracy of 98% [14].
Feature optimization is an important step in medical imaging, as some extracted features contain irrelevant information. However, this process is time-consuming for high dimensional feature sets used for disease detection. Different feature optimization algorithms [15] have been proposed, such as particle swarm optimization (PSO) [16], entropy selection, the use of genetic algorithms (GAs) [17], and others [18]. Recently the use of blockchain in DL networks has received much attention for securing important feature information from images. In the medical domain, the purpose of blockchain is to improve system efficiency [19,20].
The main problem faced by computer vision researchers in the medical field is choosing features for the development of a computerized approach, as the features were chosen to determine the overall accuracy of the method. In this study, DL optimization was used for feature extraction and classification of medical CT images of patients potentially infected with COVID-19. The significant contributions of this research are as follows:
• Use of linear contrast enhancement to enhance the optical quality of images for the extraction of the most relevant features
• Use of a TL-based retrained DenseNet-201 CNN model for DL feature extraction
• Optimization of DL features using a meta-heuristic Firefly algorithm (FA) to select the most relevant features for obtaining better information from images of healthy and COVID-19-affected individuals
• Use of a parallel high index (PHID) approach to fuse optimal selected features for final classification using an extreme learning machine (ELM)
The rest of this article is organized as follows. Existing techniques are discussed in Section 2. The proposed framework for the COVID-19 CT images is presented in Section 3, with detailed mathematical modeling and visual effects. Section 4 discusses the results of the proposed method, and conclusions are presented in Section 5.
Several methods have been used to detect and classify COVID-19 using X-ray and CT images. The use of deep CNNs for detecting and recognizing COVID-19 has proven to be efficient and robust. Pereira et al. [21] introduced a hierarchical multiclass technique for identifying COVID-19. They resampled imbalanced data using a sampling algorithm to remove the class imbalance. Then they extracted texture and deep features and performed classification after the features were fused. They validated the technique using the RYDLS-20 data set, in which F1 scores of 0.65 and 0.89 were achieved in multiclass and hierarchical classifications of COVID-19 [21]. Apostolopoulos et al. [13] used TL to train a CNN model for COVID-19 detection. A total of 224 images of COVID-19 infection, 714 images of pneumonia, and 504 healthy X-ray images were used to evaluate the model’s performance. The model showed 96.78% accuracy, 98.66% sensitivity, and 96.46% specificity on X-ray images to efficiently detect the disease. Hasan et al. [22] introduced an approach for discriminating healthy, COVID-19, and pneumonia patients based on their CT scans. Preprocessing was performed to remove noise from the CT images slices. Histogram thresholding was used to subtract the background from foreground imagery. Deep and entropy-controlled handcrafted features were extracted and fused for better results. Also, long short-term memory classifiers were used for classification, achieving 99.68% accuracy in a data set of CT images from 321 patients. A novel hybrid technique has been proposed to detect COVID-19 based on a ranking-based diversity reduction (RDR) strategy and an improved marine predators algorithm (IMPA) [23]. With this method, small regions are extracted from X-ray images for virus detection. IMPA is used to segment X-ray images, and RDR is used to improve IMPA’s detection performance. The proposed IMPA tends to outperform other state-of-the-art methods. Further advancements include an auxiliary classifier generative adversarial network (ACGAN) [24] for COVID-19 called CovidGAN to increase synthetic X-ray data for deep CNN models; experimental results showed that the conventional CNN model achieved 85% accuracy, whereas 95% accuracy was obtained with synthetic images created using CovidGAN.
Ozturk et al. [25] presented a new DL technique for automated detection of COVID-19. Their approach has been used successfully in binary and multiclass classifications using a deep model consisting of 17 convolutional layers with different filters for each layer. A DarkNet classifier used for real-time virus detection with heat maps achieved 98.08% and 87.02% accuracy in binary and multiclass classifications. A deep CNN model, COVID-Net [26], was used to detect COVID-19 from X-ray images in the pandemic’s early days. The publicly available benchmark data set COVIDx was introduced that contained 13,975 CXR images of 13,870 patients. This deep CNN model was made publicly available to facilitate the efficient detection of COVID-19 from CXR images. COVID-CAPS [27], a new deep CNN-based approach, has been introduced to detect COVID-19 in smaller X-ray image databases. This model has fewer parameters but has demonstrated robust performance, with an AUC of 0.97%, 90% sensitivity, 95.7% accuracy, and 95.8% specificity. Pretraining of the presented deep models on the same type of database has increased by 98.3% accuracy. For example, Loey et al. [28] used GAN with deep TL to detect the novel virus, overcoming the challenge of a lack of data. Pretrained deep CNN models have also been used with TL in AlexNet, GoogleNet, and ResNet-18. The selected deep models reduce system complexity by having a simple architecture and a smaller number of layers. The overall testing accuracy of GoogleNet and AlexNet was 80.6% and 85.2%, respectively. GoogleNet achieved 100% testing accuracy and 99.9% validation accuracy on two-class classification. Ucar et al. [29] presented an artificial intelligence light model for novel virus detection; data augmentation was used to reduce data deficiencies. squeezeNet, a light deep network, is another fine-tuned Bayesian optimization technique for COVID-19 detection that has demonstrated robust performance.
In summary, the studies as mentioned above used pretrained networks, in which the sampling sizes of the patient databases varied considerably, for classification purposes. In several of these studies, optimization methods were used to obtain better accuracy but did not achieve significance. Besides, many of these works cite computational cost as a drawback to their use, particularly for diagnosing disease. In the current study, our main focus was to improve the accuracy of the DL framework for identifying COVID-19 from CT scans and to minimize the system prediction time.
The proposed methodology is presented in this section with technical details and visual effects. Fig. 1 illustrates the flow of the preferred DL framework for assessing positive COVID-19 scans and healthy scans, which involves five key steps to achieving a final output. The first step is database preparation. In the second step, the contrast of the original image is improved through linear contrast stretching. The third step involves the computation of features using a DL method. The fourth step involves feature optimization for the final step, in which the relevant features are fused in a parallel approach. The fused vector is classified using an ELM to obtain two outputs: labeled images and numerical results.
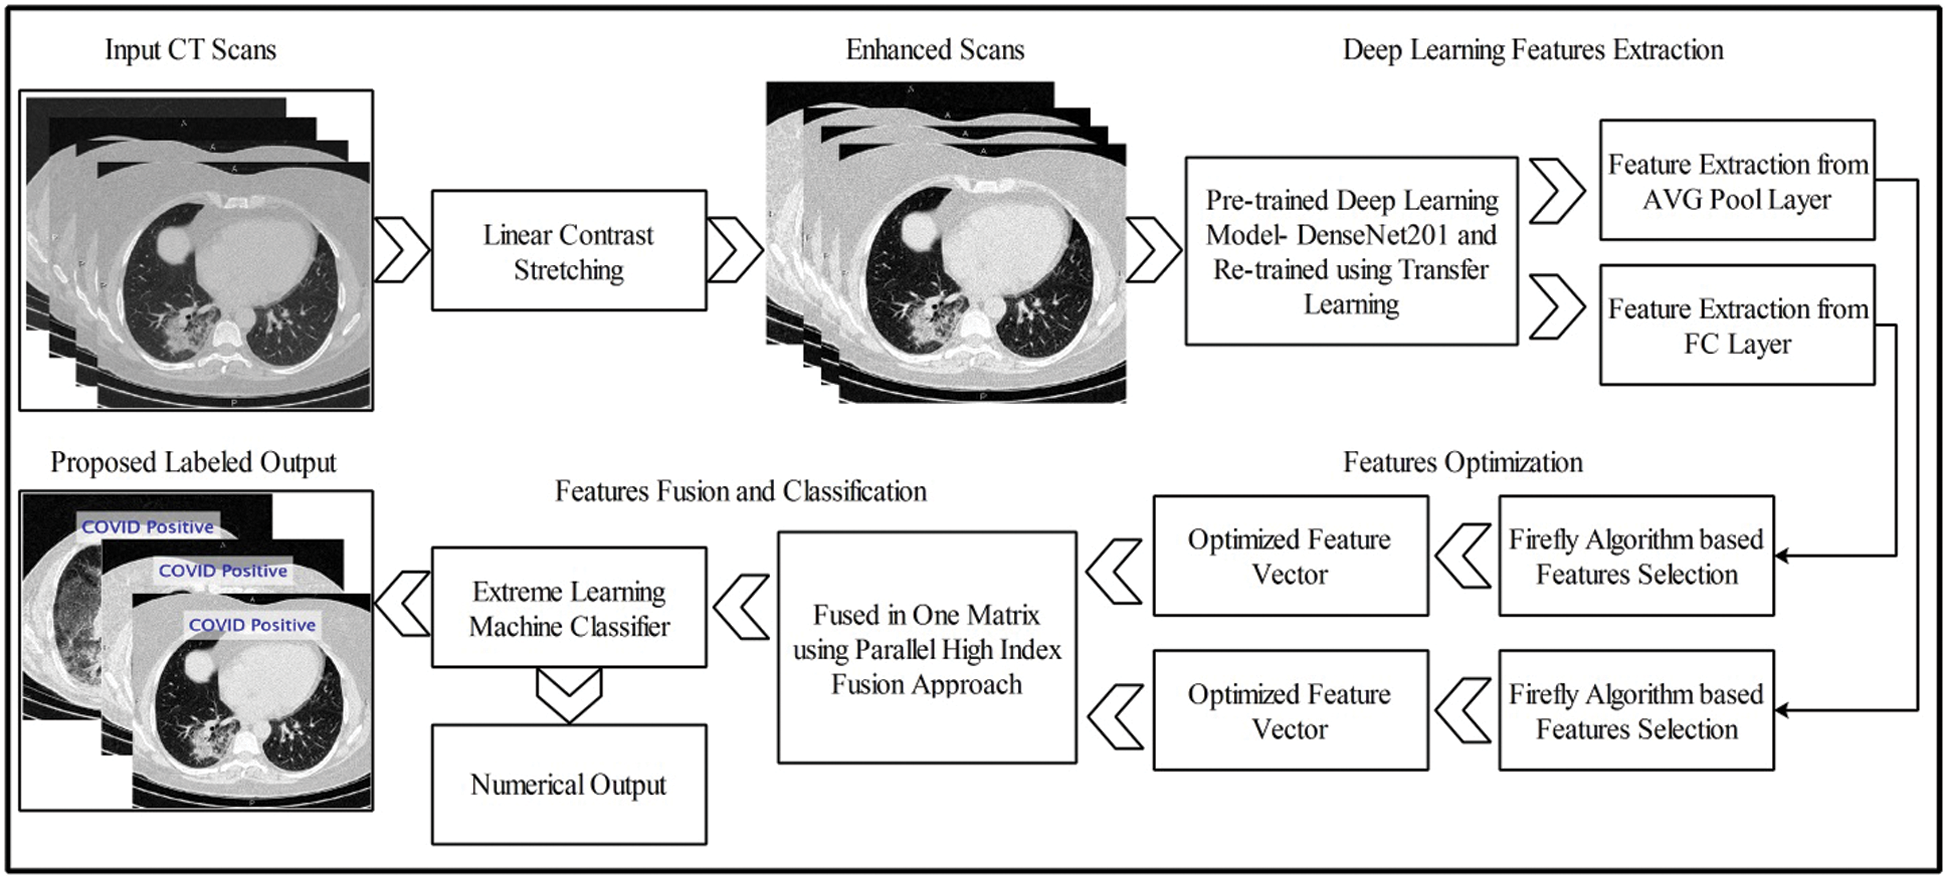
Figure 1: Proposed deep TL based end-to-end system for classification of positive COVID CT scans
This section discusses the details of the self-created data set for evaluating the proposed scheme, as presented in Fig. 2. Data from 62 patients were collected from Radiopaedia (https://radiopaedia.org/articles/covid-19-4). This website contains data from 93 patients, of which the first 62 patients were selected for this work. Data from patients’ records included CT images, positive RT-PCR tests, travel history, and sex. The primary target of this research was to obtain information about positive COVID-19 scans. Also, 4,000 healthy CT images were obtained for classification. Several samples positive COVID-19 CT scans are shown in Fig. 2.
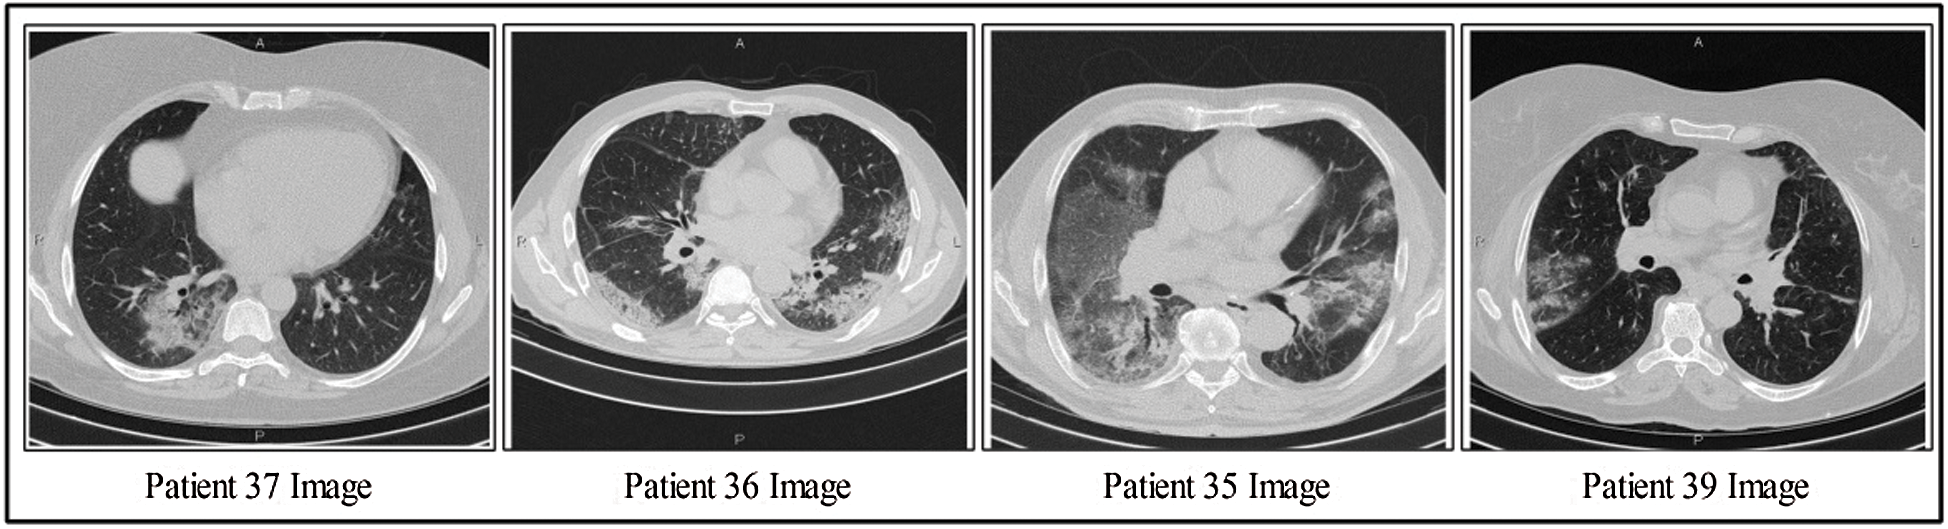
Figure 2: Few samples COVID-19 positive CT scans
Contrast enhancement is an essential step in medical imaging that effectively increases the amount of visual information obtained from an image. The main objective of contrast enhancement in this work was to identify infected patients’ scans while distinguishing the most relevant features visually for a COVID-19 diagnosis. In this approach, a mean equation was used to improve the intensity range based on output. The mean value is computed mathematically as in Eq. (1):

Here  denotes the mean value;
  and
and  represent the
  and
and  pixel values;
  and
and  denote row and column pixels, respectively; and
  is the original image. The size of the input image is
 . The computed mean value is then used in a threshold function, and the pixel intensity range is increased. The threshold function is defined mathematically as in Eq. (2):

This equation shows that image pixels less than the mean value are updated with  , whereas pixels greater than
  are not updated. Linear contrast is then used to amplify the infection region further. This is represented mathematically by Eq. (3):

where  denotes the updated pixel value,
  is the gradient, and
  represents the vertical offset. Based on this equation, previous image pixels are updated by
  , as shown in Fig. 3.
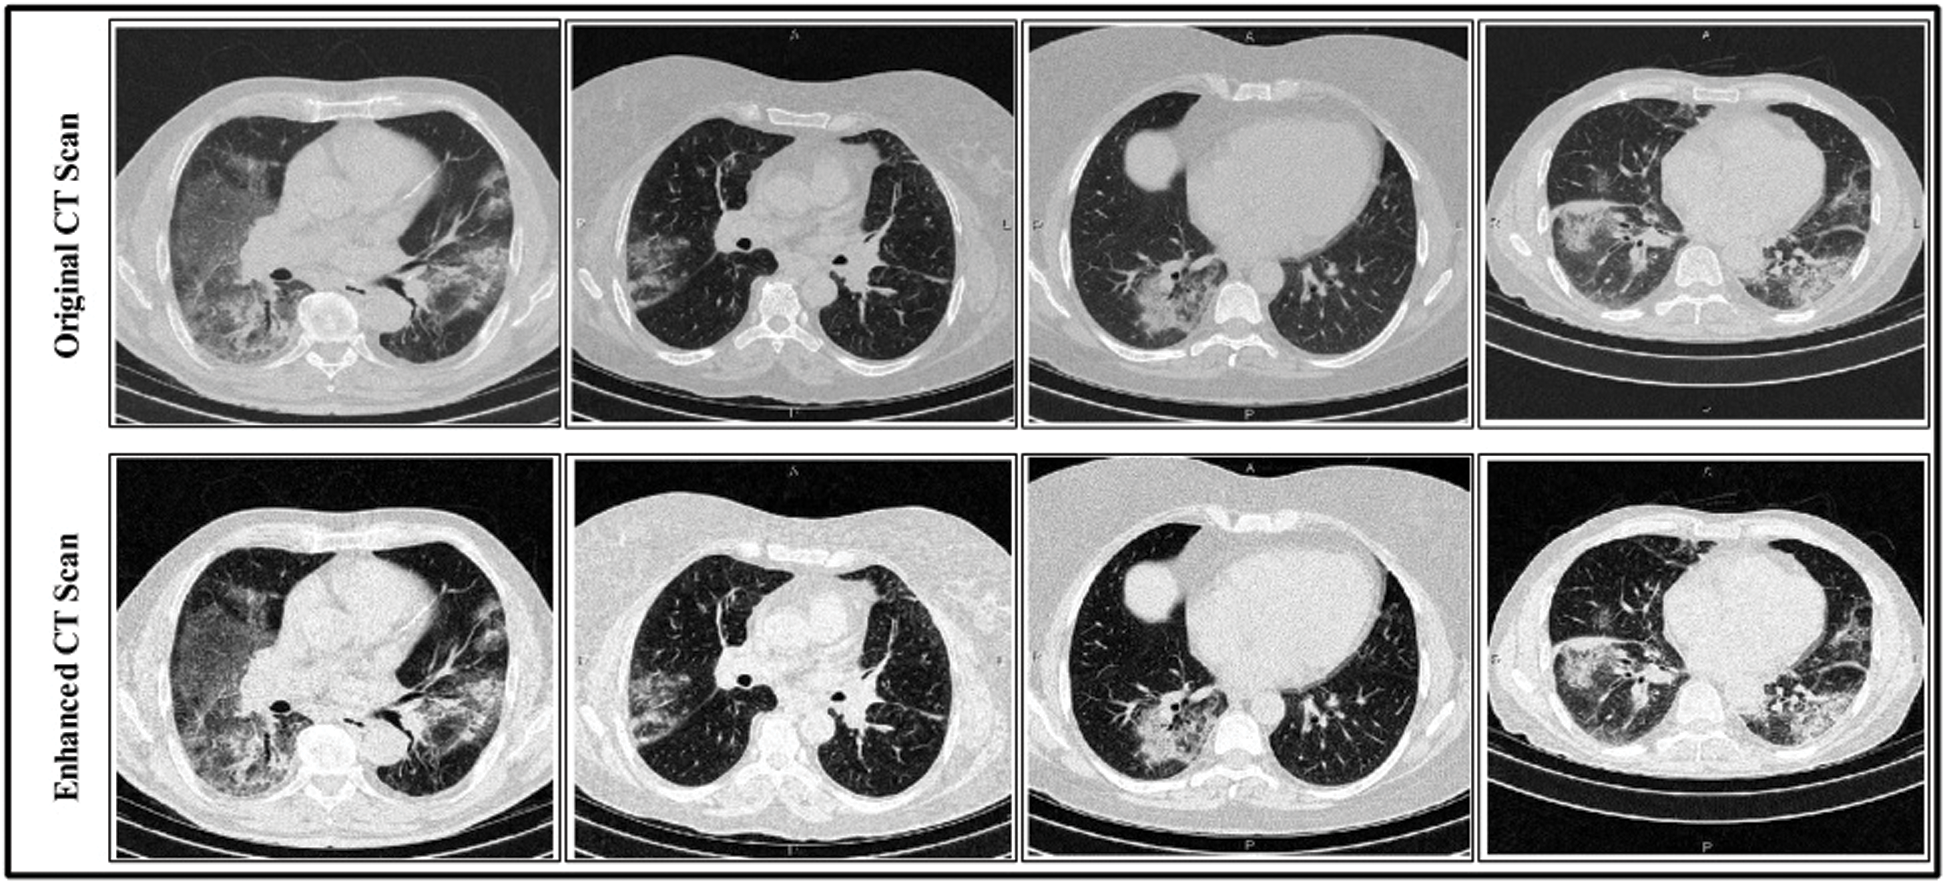
Figure 3: Linear contrast enhancement results
A deep TL approach was used in this work for deep feature extraction. The pretrained deep CNN model, named Densenet201, was used for this purpose [30]. Densenet201 includes a total of 709 layers and 806 connections. The input layer size of this network is  (Fig. 4). The first convolutional layer is
  , with stride 2; the output is
  . Each convolutional layer
  creates
  convolution kernels of dimension
  that is convolved with the layer input
 , where
  . Here
  and
and  represent the height and width of the output of the convolution layer, respectively. The final output of the convolution layer is given by Eq. (4):

where  denotes the bias matrix and
  represents the convolution operation. After each convolution operation, an activation layer referred to as the ReLu layer is added. This layer’s main purpose is to avoid negative features, as this layer only generates positive values. It is defined mathematically as in Eq. (5):

Later a pooling layer is added to resolve the problem of overflow; note that researchers tend to use the max-pooling layer and select only active neurons for the next iteration. Another layer referred to as the fully connected (FC) layer is the most important layer in the CNN architecture with regard to deep feature extraction. All nodes in this layer are connected directly in both the forward and reverse directions. Many parameters may be involved in the FC layer, which can lead to a computationally complex network for the training step. To address this, a dropout layer is added among the FC layers. The features matrix of the dropout layer is one dimensional and is passed in a softmax function for final classification, as described in Eq. (6):

where  represents output units and
  denotes the categorical output probability of each unit.
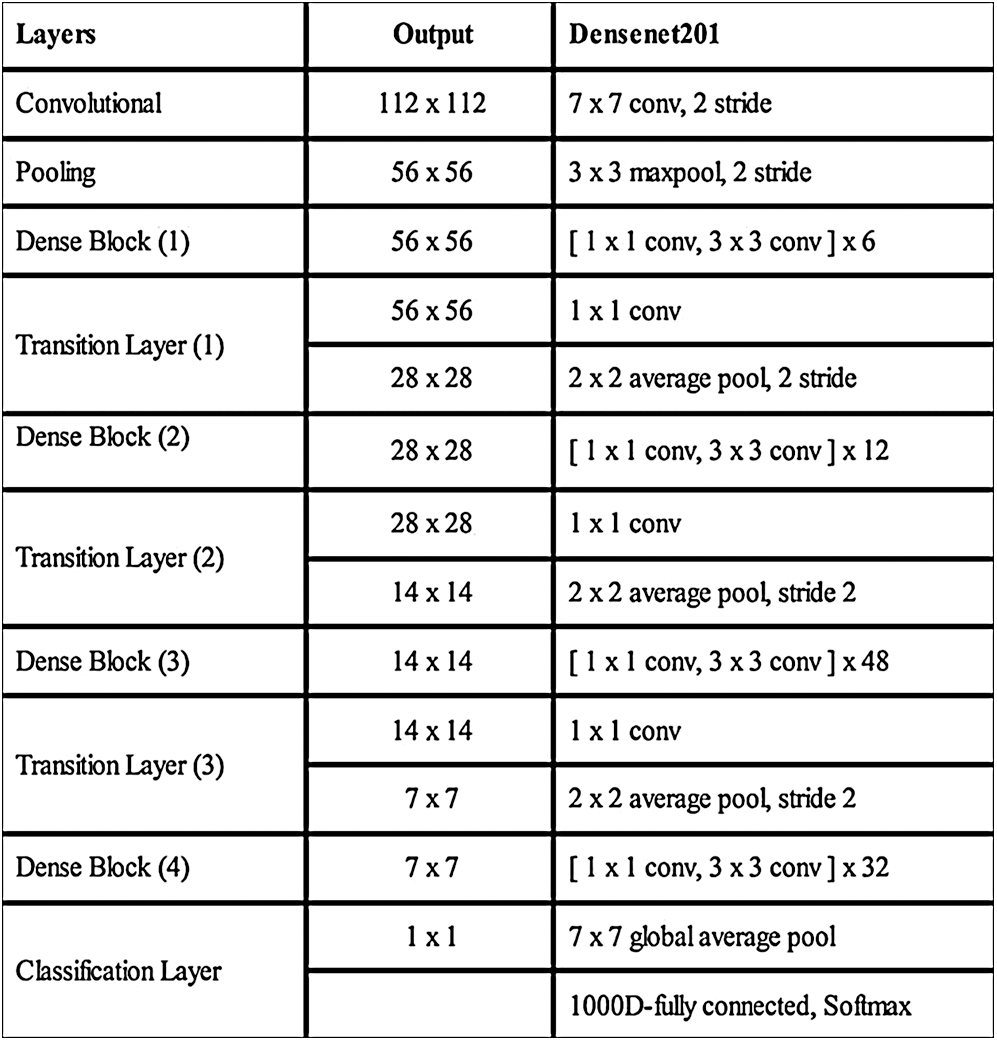
Figure 4: Detail of Densenet201 deep CNN model
For feature extraction, we pretrained the selected DL model trained on collected COVID-19 and healthy scans using TL [31]. To retrain a new model, we used a mini batch size of 64, a learning rate of 0.002, and a momentum of 0.1. In addition, a 70:30 training: Testing approach was used with a cross-validation value of 10. After retraining, the average pool and FC layers for feature extraction were selected. The dimensions of the extracted features of both layers were  and
and  , respectively. These extracted features were later optimized with the meta-heuristic FA, as described in the following section.
The FA, which was first introduced by Yang [32], was inspired by the flashing behavior of fireflies, in which the flashing effectively acts as a system for communicating attraction among fireflies. The FA mimics this system with its own version of the flashing to optimize DL methods. The FA has shown its effectiveness with GAs and PSOs. Three rules are followed in the development of the FA:
i) A firefly is tempted by all other fireflies, irrespective of their sex.
ii) The attraction is proportional to the brightness of the firefly. A firefly with relatively low brightness will be tempted by another that is brighter. Greater brightness corresponds to less distance between fireflies.
iii) The fitness function is responsible for the brightness of fireflies.
The brightness of a firefly with source brightness  is defined by Eq. (7):

where  is the distance between two fireflies,
  is the original brightness, and the light absorption coefficient
  controls the intensity of light. As the attraction corresponds to brightness, the attractiveness
  of a firefly is given mathematically by Eq. (8):

where  is the attractiveness at
  . When firefly
  is attracted to firefly
 , movement is given, as in Eq. (9):

where  is the iteration number,
  is the randomization parameter, and the term
  generates random numbers between 0 and 1.
  denotes the distance between the
  and
and  fireflies and is defined as in Eq. (10):

The FA is applied to both DL feature vectors separately to obtain two optimal vectors with dimensions of  and
and  as the output. Note that the length of these vectors depends on the number of images and always varies depending on the number of iterations. Once identified, the two optimal vectors are fused by the PHID approach. In this approach, first entropy value-based padding is used to equalize the vector lengths. Then the entropy value is calculated from less dimensional feature vector. Entropy is formulated mathematically by Eqs. (11) and (12):


where  denotes total information and
  denotes information about the occurrence of each feature. The indices of both vectors are then compared to select the highest feature value for the final fused vector. The indices are compared to each other in Eq. (13):

where  denotes the final fused feature vector and
  denotes the higher value function that selects the highest features from the
  index and the
  index. After the fusion of both vectors, the ELM classifier is used for final classification.
3.5 Extreme Learning Machine Algorithm
Consider that the output function of a given  node is
  , where
  and
and  express the parameters of the hidden layer. The output function of SLFN with
  hidden layers is defined in Eq. (14):

where  expresses the
  node hidden output and
  is the equation for measuring the output of the hidden layer.
  training samples based on the hidden layer output matrix
  are calculated using Eq. (15):
 represents the training data, given the matrix of
  as in Eq. (16):
The ELM [33] is a generalized NN and cannot accommodate parameter fine-tuning. The object function is given in Eq. (17):

where  and
and 
Here  are used in different combinations for classification, regression, sparse coding, feature learning, and clustering. The output of the ELM is in the form of labeled images and numerical results, as shown in Fig. 5; numerical results are presented in Section 4. In this study, we compared the ELM performance to well-known classification techniques to demonstrate its effectiveness in the proposed scheme.
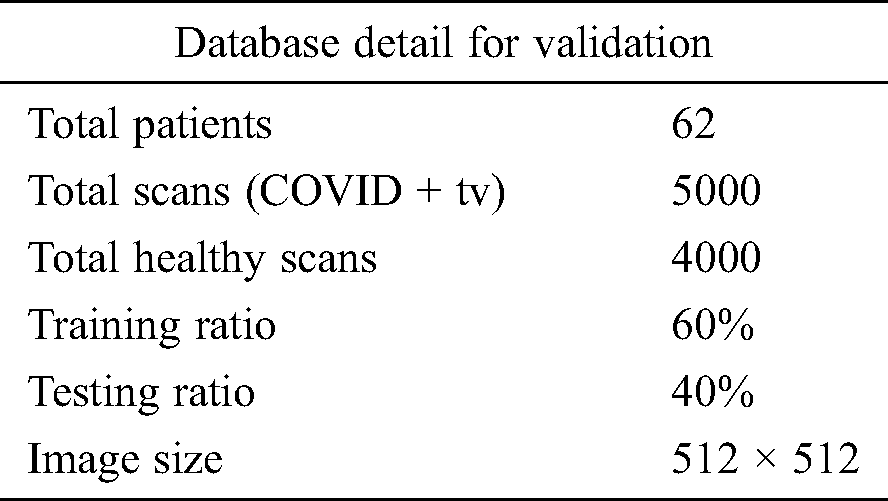
In this section, the results of the proposed method are presented in the form of numerical values and plots. Details of the data set are given in Section 3.1. A total of 9,000 CT images were used, including 5,000 positive COVID-19 images and 4,000 healthy images. Of all CT images, 60% were used for the proposed model training and 40% were used to test the technique. Tab. 1 lists the experimental parameters. Fig. 1 shows the sequence of steps in the proposed method; the results of each step were computed to emphasize their importance. The computed results include the following: (i) An average pool layer extracted feature evaluation; (ii) FC layer feature evaluation; (iii) FA-based optimized average pool layer feature evaluation; (iv) FA-based optimized FC layer feature evaluation; and (v) fusion of both optimized feature vectors. A 10-fold cross-validation was conducted for training as well as testing of the proposed system. The ELM was used as a key classifier for feature classification; its performance was compared to that of other techniques such as naïve Bayes, linear support vector machine (LSVM), weighted k-nearest neighbor (KNN), and ensemble tree (bagging). In the simulation process, MATLAB 2019b was used on Desktop Compute (16 GB RAM; 256 SSD). In addition, an 8 GB graphics card was used to minimize the computation time.
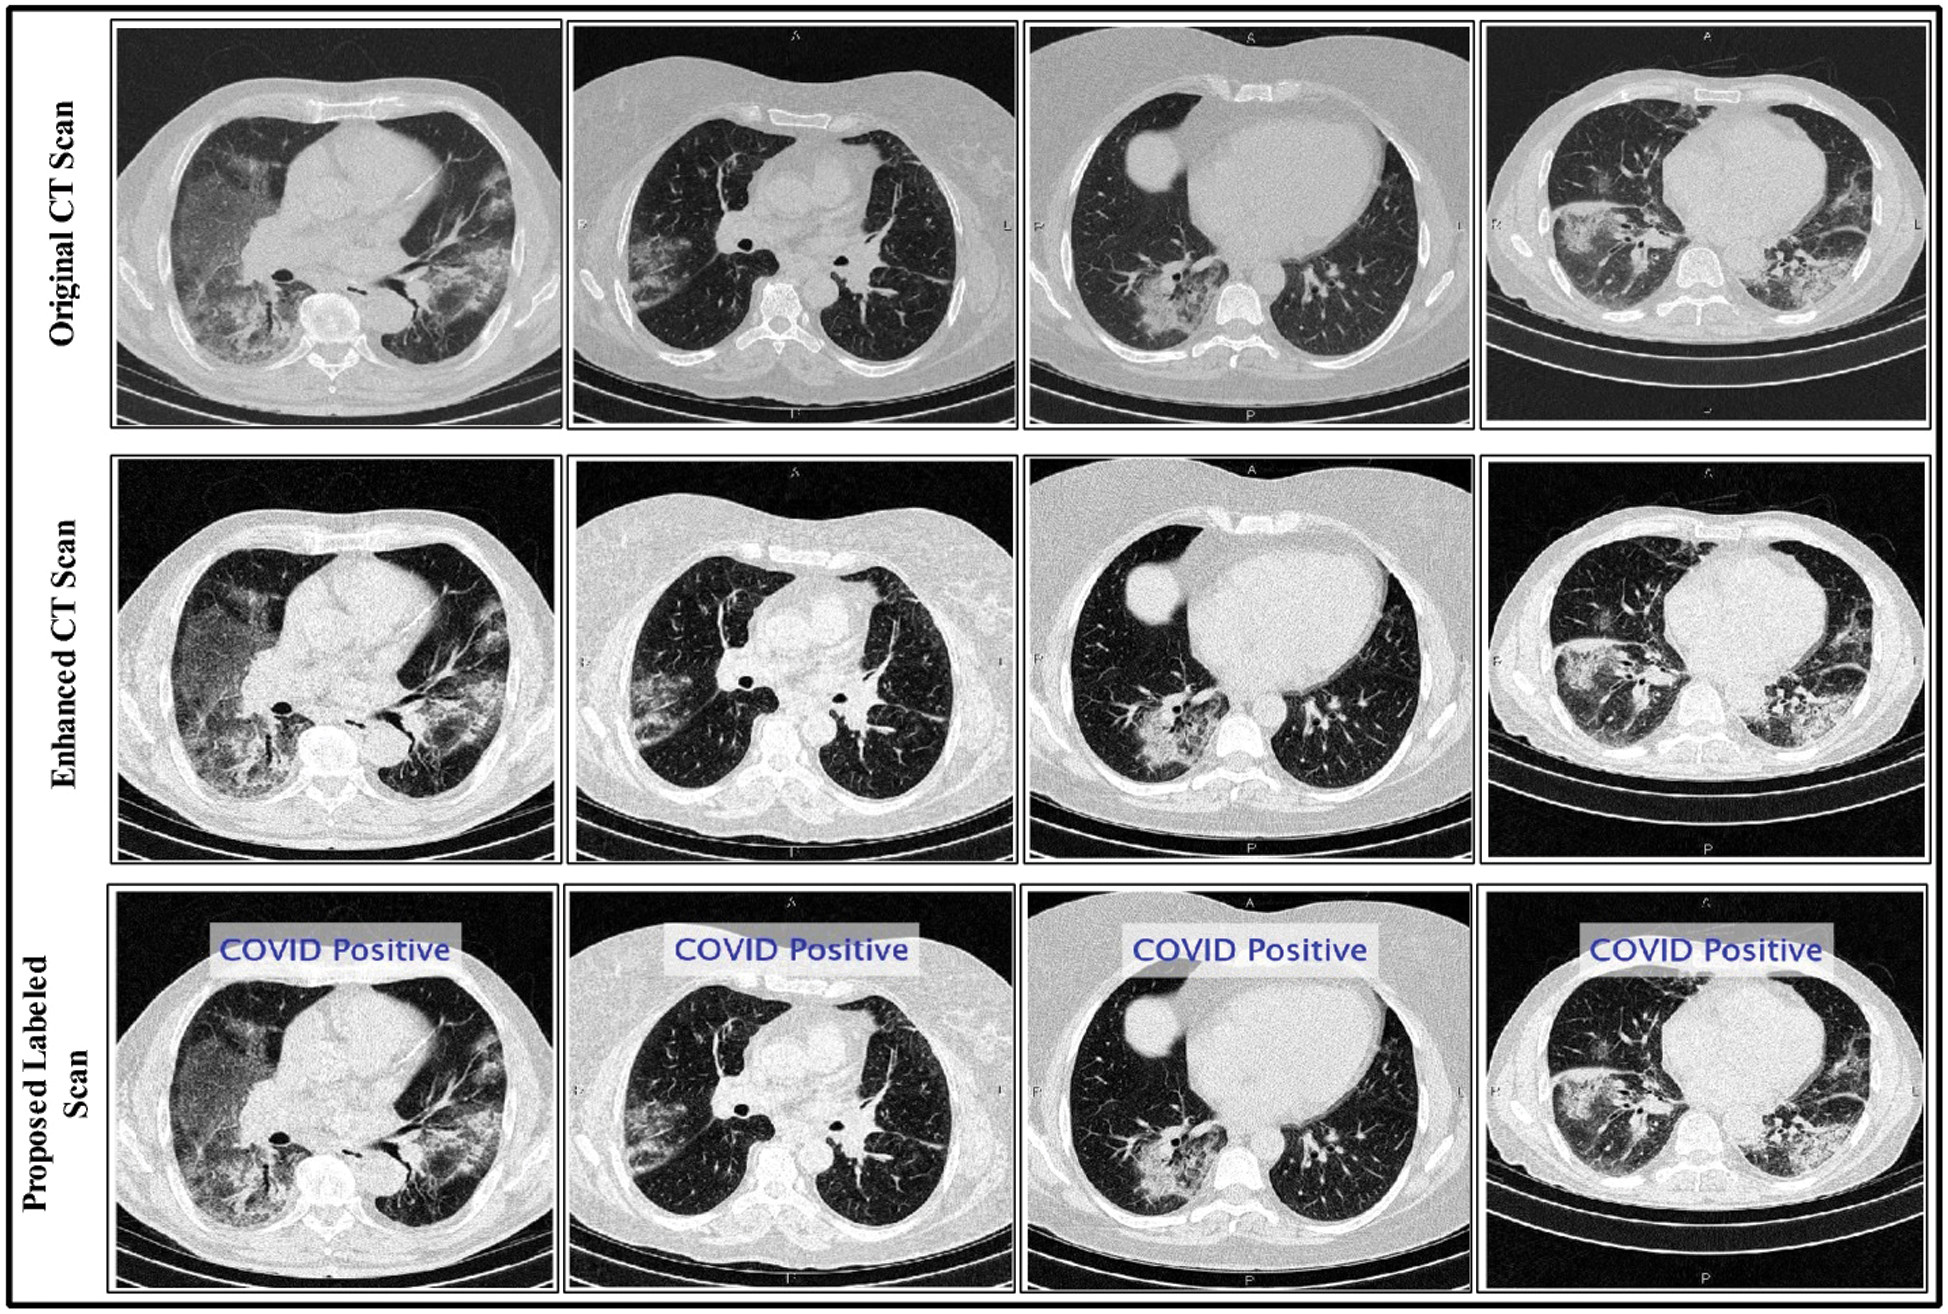
Figure 5: Proposed method labeled results
Table 1: Experimental detail of database
Tab. 2 shows the proposed classification performance using the deep features of the average pool layer. We passed the originally extracted features of this layer in the ELM classifier without applying feature optimization. A maximum accuracy of 84.71% on ELM classification was achieved, with an FNR and testing time of 15.29% and 71.501 s, respectively. The performance of this layer feature was also validated by the other classifiers mentioned. The naïve Bayes classifier demonstrated accuracy of 81.46%, with a testing time of 83.261 s. Ensemble tree also provided good results, with accuracy of 82.21% and a testing time of 101.442 s. LSVM, a popular classification method, achieved accuracy of 83.74%.
Tab. 3 lists the classification performance with respect to the FC layer features. The ELM classifier showed 84.48% accuracy, with a testing time of 53.278 s. The change in accuracy was not significant; however, the testing time improved by an average of 20 s. This change in testing time depends on the dimensionality of features. Similarly, naïve Bayes, LSVM, weighted KNN, and ensemble tree achieved accuracy of 81.92%, 83.96%, 82.17%, and 81.01%, respectively, with testing times of 61.003, 67.271, 71.926, and 77.926 s.
Table 2: Classification performance on selected classifiers using average pool layer deep features
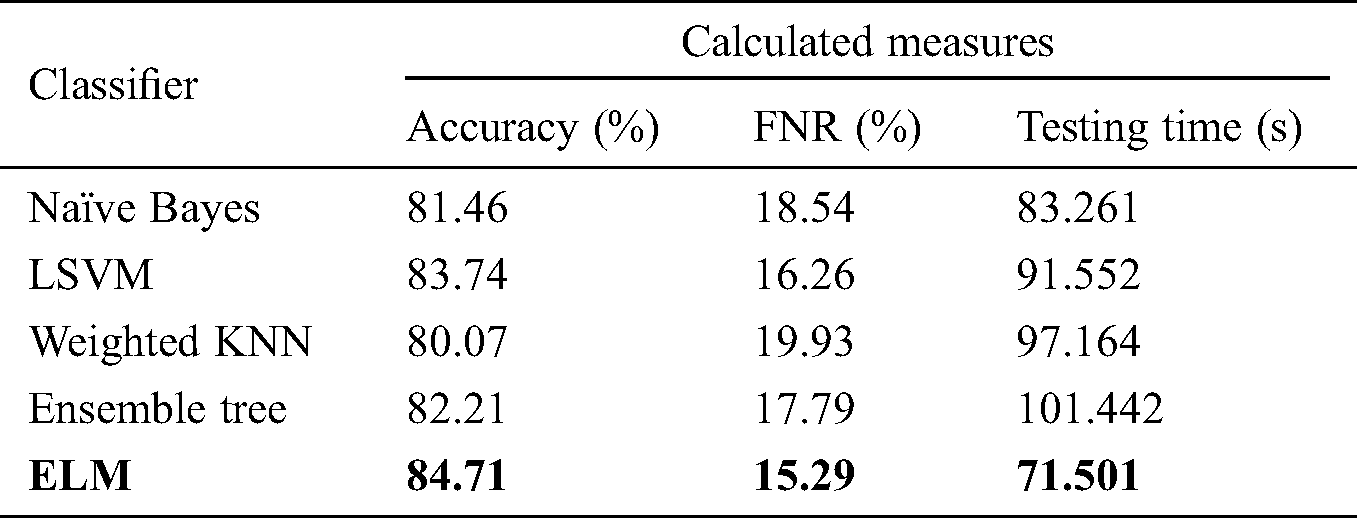
Table 3: Classification performance on selected classifiers using FC layer deep features

Tab. 4 shows the classification performance after the use of FA optimization, in which deep features were optimized to select the most relevant features for final classification. The highest accuracy obtained was 91.96% with a testing time of 41.991 s. Compared to the results shown in Tab. 3, the optimal FC layer feature performance improved by up to 7% for the ELM classifier. In addition, the time required for ELM classifier operation for the original FC layer features was 53.278 s, a reduction of approximately 12 s on average. Similarly, for naïve Bayes, the update accuracy was 85.92% after feature optimization with a testing time of 48.116 s compared to 61.003 s for the original FC layer features. LSVM, weighted KNN, and ensemble tree also showed improved accuracy, by 4% on average, compared to the results shown in Tab. 3.
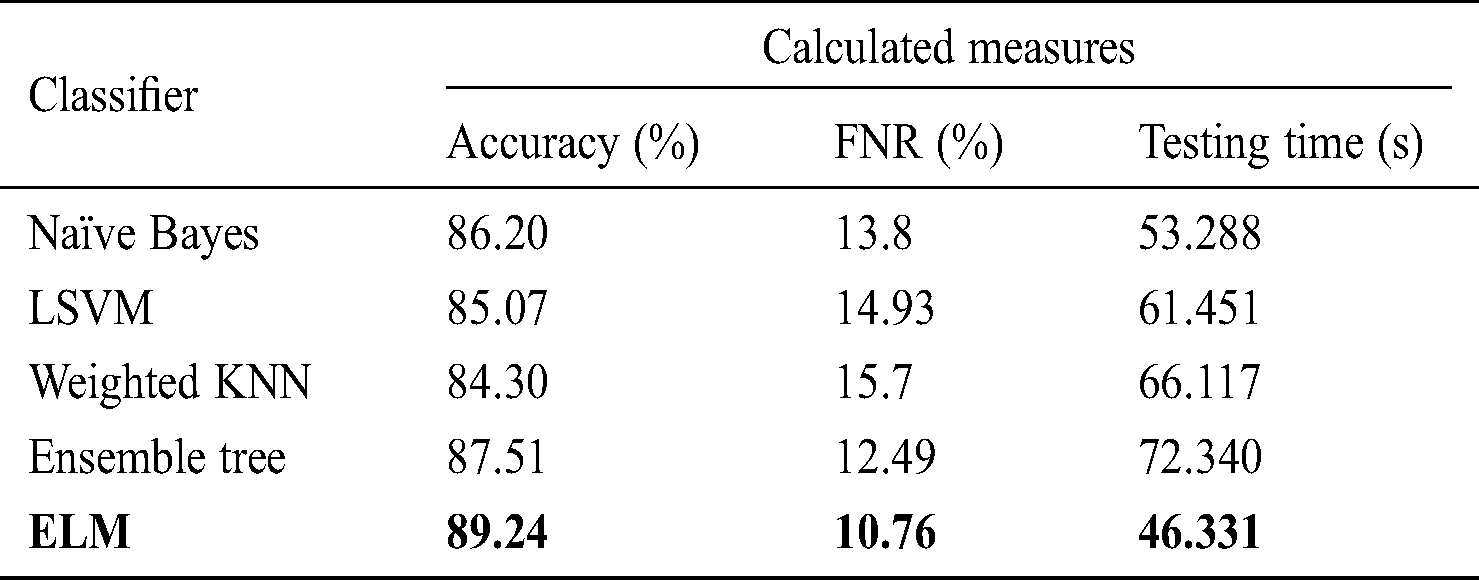
Tab. 5 describes the classification performance with optimized average pool layer features. The highest accuracy achieved was 89.24%, and the noted testing time was 46.331 s. Comparing the accuracy and testing time to Tab. 2, we see that the accuracy improved by an average of 5%, and time was minimized to an average of 25 s. Similarly, the other classification methods of naïve Bayes, LSVM, weighted KNN, and ensemble tree achieved accuracy of 86.20%, 85.07%, 84.30%, and 87.51%, respectively.
Table 4: Classification performance on selected classifiers using optimized FC layer deep features
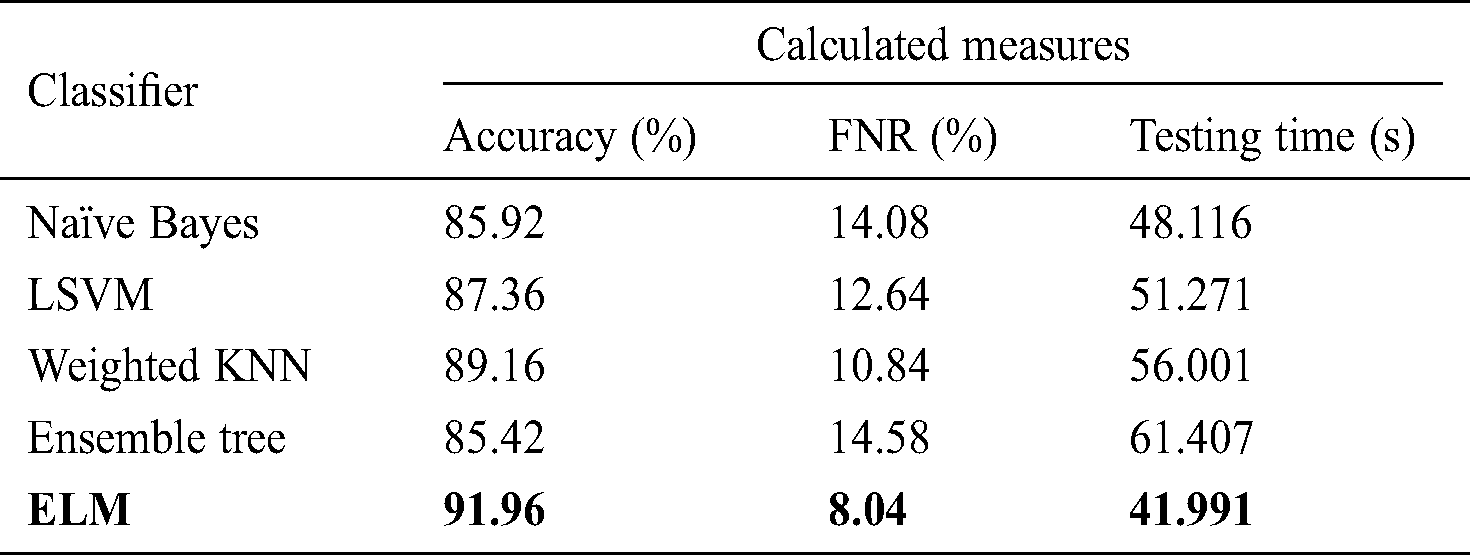
Table 5: Classification performance on selected classifiers using optimized average pool layer deep features
Tab. 6 shows the performance using the fused optimized FC layer and average pool layer feature vectors in one vector to obtain maximum information from the image. After fusion, the highest accuracy reading of 94.765% was obtained using the ELM classifier, with a testing time of 58.193 s. The accuracy of naïve Bayes, LSVM, weighted KNN, and ensemble tree was 89.62%, 91.25%, 90.39%, and 92.84%, respectively, with testing times of 59.188, 62.882, 64.002, and 69.527 s, respectively. Compared to the data in Tabs. 2–5, the accuracy improved after the fusion process by 4% on average. However, the testing time increased because of the fusion of the two optimal vectors.
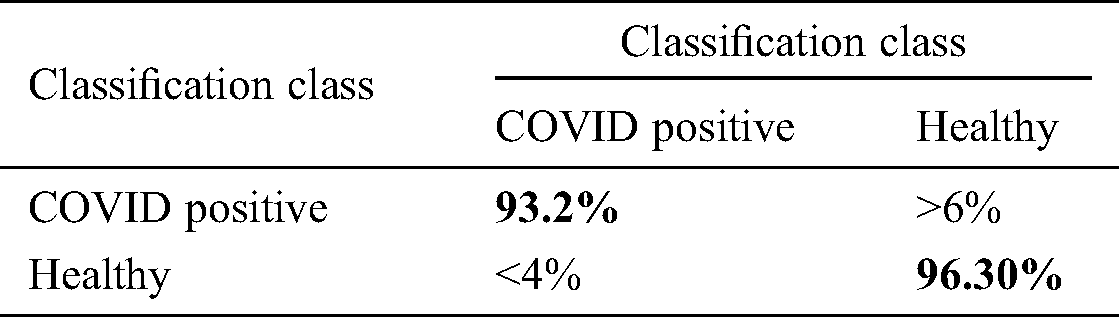
We also verified the accuracy of the ELM using a confusion matrix. The sensitivity of the ELM after the fusion process was 94.75%, and the specificity was 96.30% (Tab. 7).
Table 6: Classification performance on selected classifiers using optimized features fusion
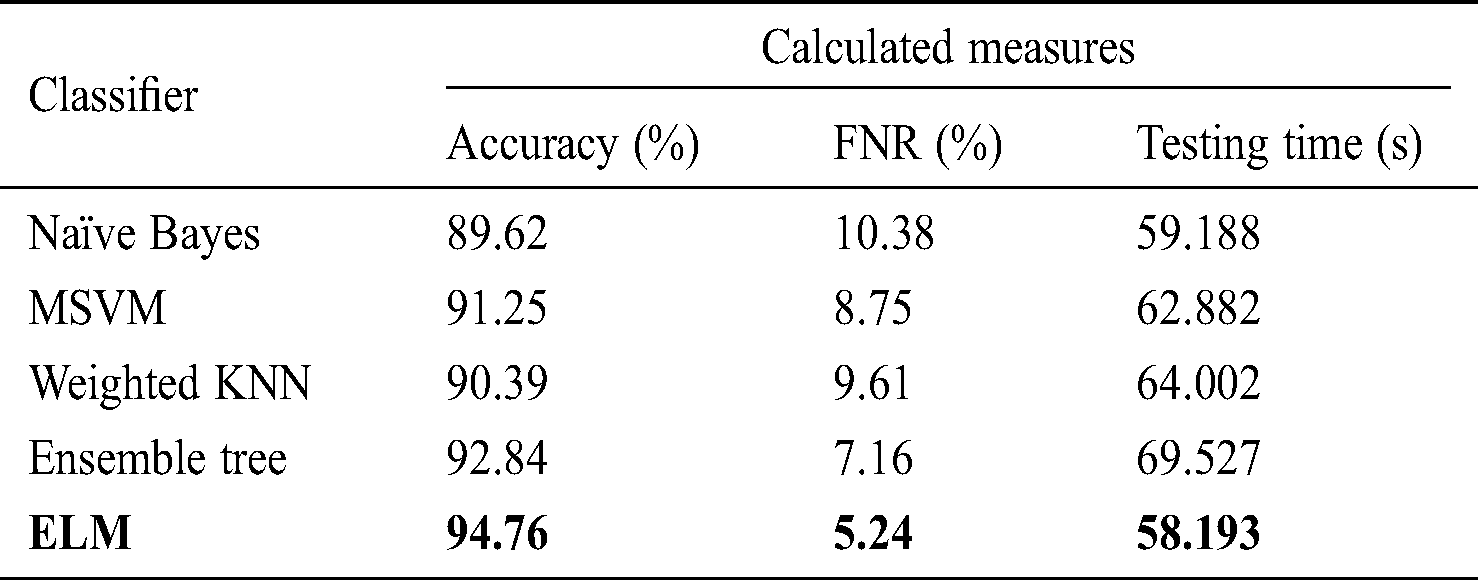
Table 7: Confusion matrix of proposed method after optimal features fusion for ELM classifier
In this section, we interpret the accuracy of the method when an ELM classifier is used. Section 4.1 presents detailed classification results for combinations of the original features, optimal features, and fusion of optimal vectors. To determine the importance of contrast enhancement, we performed an experiment without this step. The features were processed following the optimal feature optimization. After fusion, these features were passed through the ELM classifier. The results, shown in Fig. 6, depict an average 6% change in accuracy compared to the results shown in Tab. 6. Based on this plot, it can be concluded with confidence that contrast enhancement plays a key role in improving classification accuracy. In addition, we analyzed the performance of the DenseNet-201 pretrained CNN model used for feature extraction by comparing it to other pretrained models. Fig. 7 compares DL models, including GoogleNet, AlexNet, VGG16, VGG19, ResNet50, ResNet101, Inception V3, and the proposed scheme; the effectiveness of the pretrained Densenet-201 deep model is evident in this comparison as well.
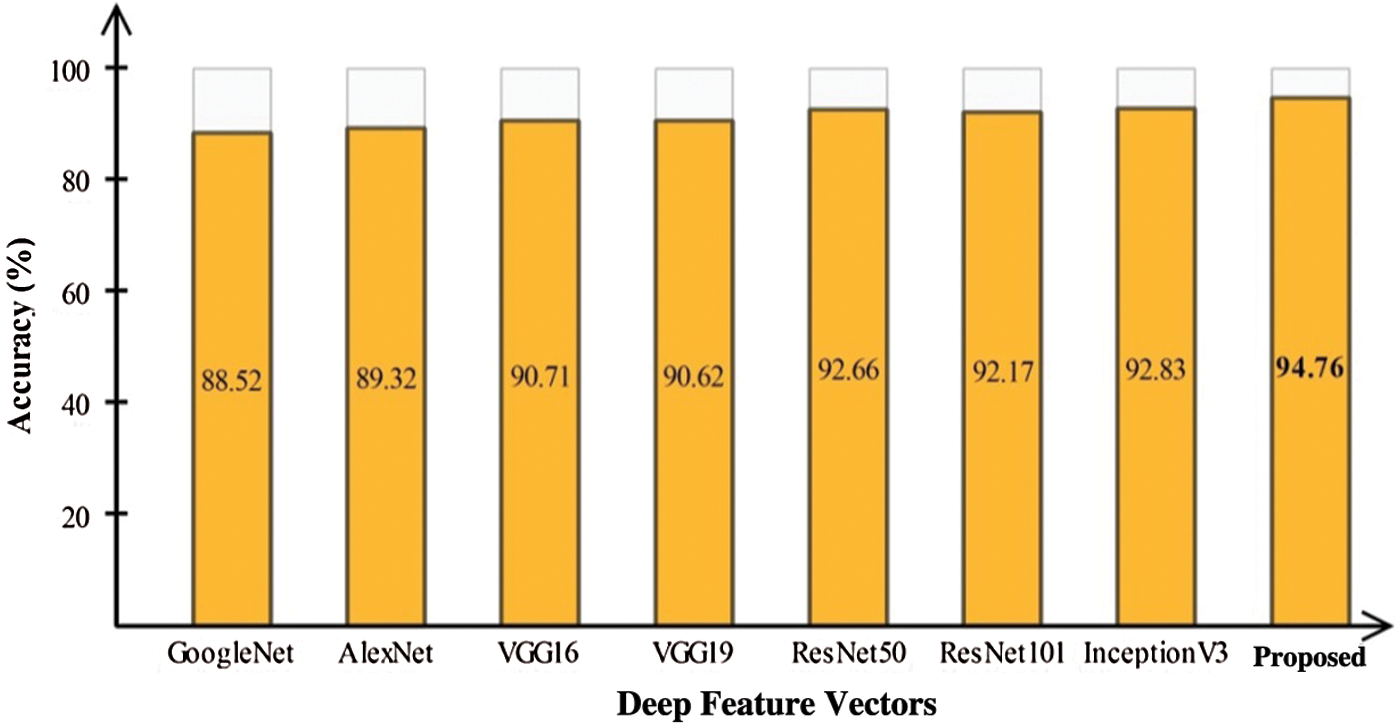
Figure 7: Comparison of proposed deep features with other CNN models for classification infected and healthy COVID-19 scans
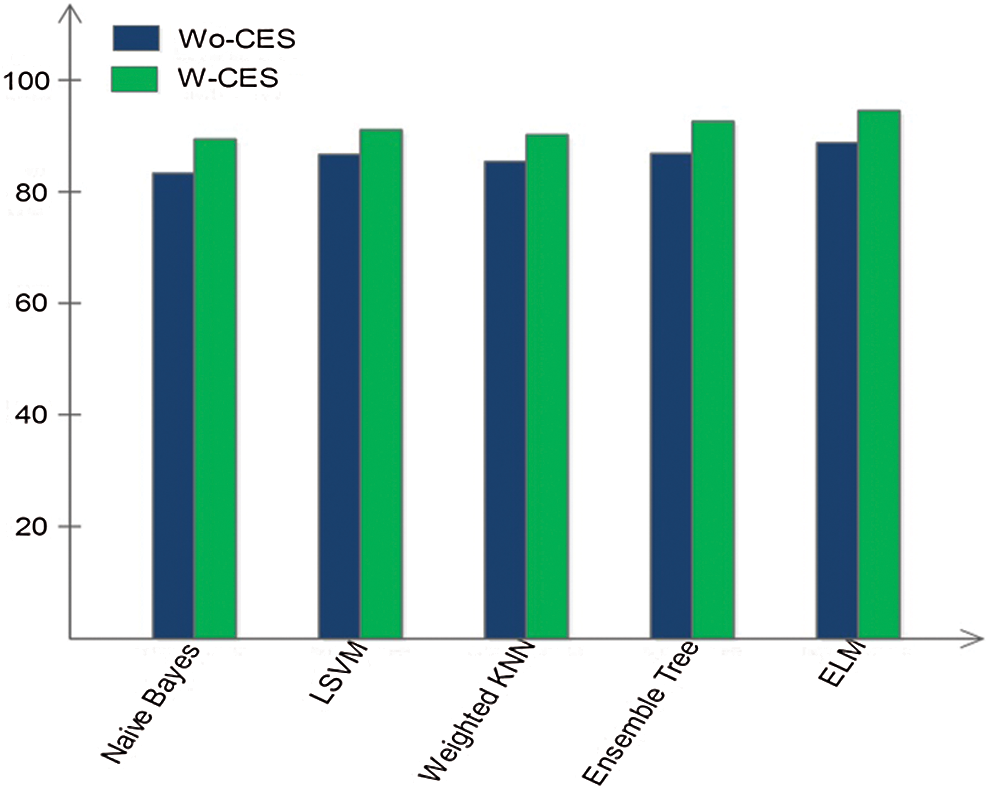
Figure 6: Impact of classification accuracy by including contrast enhancement step (W-CES) and without contrast enhancement step (Wo-CES)
In this work, we improved a computerized DL method for identifying COVID-19-infected and a healthy patient from CT scans by using a new contrast enhancement approach to extract essential and robust information about the infected region in the scans. In our proposed approach, a pretrained model is retrained using TL to compute features from an average pool and FC layers. The most relevant features are identified with FA optimization and then fused into one vector using the proposed PHID technique, with final classification using an ELM classifier. Our results showed marked improvement in the visual contrast of CT images resulting in the generation of robust DL features. However, a few irrelevant features were also extracted from the outlier regions that were not important in the final classification. Thus, optimization is a key step in selecting the appropriate solution. In addition, concatenation of features increased the accuracy rate but also the computation time. A comparison of the proposed method to several well-known DL models indicated that our approach is reliable. The main limitation of this work is in the selection of optimal features with the FA, which does not always select the most important features. Thus, there is a possibility that in some cases, the FA rejects important features of an object. In future work, the performance of the feature selection step will be analyzed more closely and compared using a larger patient data set for evaluation.
Funding Statement: This research was supported by Korea Institute for Advancement of Technology(KIAT) grant funded by the Korea Government (MOTIE) (P0012724, The Competency Development Program for Industry Specialist) and the Soonchunhyang University Research Fund.
Conflicts of Interest: The authors declare that they have no conflict of interest to report regarding the present study.
1. N. Zhu, D. Zhang, W. Wang, X. Li, B. Yang et al. (2020). , “A novel coronavirus from patients with pneumonia in China,” 2019 New England Journal of Medicine, vol. 382, pp. 727–733. [Google Scholar]
2. K. Kaye, F. Paprottka, R. Escudero, G. Casabona, J. Montes et al. (2020). , “Elective, non-urgent procedures and aesthetic surgery in the wake of SARS-COVID-19: Considerations regarding safety, feasibility and impact on clinical management,” Aesthetic Plastic Surgery, pp. 1–29. [Google Scholar]
3. A. E. Gorbalenya, S. C. Baker, R. Baric, R. J. D. Groot, C. Drosten et al. (2020). , “Severe acute respiratory syndrome-related coronavirus: The species and its viruses—A statement of the coronavirus study group,”. [Google Scholar]
4. S. B. Stoecklin, P. Rolland, Y. Silue, A. Mailles, C. Campese et al. (2020). , “First cases of coronavirus disease 2019 (COVID-19) in France: Surveillance, investigations and control measures,” Eurosurveillance, vol. 25, no. 6. [Google Scholar]
5. D. Wang, B. Hu, C. Hu, F. Zhu, X. Liu et al. (2020). , “Clinical characteristics of 138 hospitalized patients with 2019 novel coronavirus-infected pneumonia in Wuhan, China,” Jama, vol. 323, no. 11, pp. 1061–1069. [Google Scholar]
6. Q. Li, X. Guan, P. Wu, X. Wang, L. Zhou et al. (2020). , “Early transmission dynamics in Wuhan, China, of novel coronavirus-infected pneumonia,” New England Journal of Medicine, vol. 382, no. 13, pp. 1199–1207. [Google Scholar]
7. C. Wang, Z. Liu, Z. Chen, X. Huang, M. Xu et al. (2020). , “The establishment of reference sequence for SARS-CoV-2 and variation analysis,” Journal of Medical Virology, vol. 92, no. 6, pp. 667–674. [Google Scholar]
8. D. S. Kermany, M. Goldbaum, W. Cai, C. C. Valentim, H. Liang et al. (2018). , “Identifying medical diagnoses and treatable diseases by image-based deep learning,” Cell, vol. 172, no. 5, pp. 1122–1131. [Google Scholar]
9. M. A. Khan, M. Sharif, T. Akram, M. Yasmin and R. S. Nayak. (2019). “Stomach deformities recognition using rank-based deep features selection,” Journal of Medical Systems, vol. 43, no. 12, pp. 329. [Google Scholar]
10. M. A. Khan, M. Y. Javed, M. Sharif, T. Saba and A. Rehman. (2019). “Multi-model deep neural network based features extraction and optimal selection approach for skin lesion classification,” in 2019 Int. Conf. on Computer and Information Sciences, SA: IEEE, pp. 1–7. [Google Scholar]
11. S. Rajaraman, S. Candemir, I. Kim, G. Thoma and S. Antani. (2018). “Visualization and interpretation of convolutional neural network predictions in detecting pneumonia in pediatric chest radiographs,” Applied Sciences, vol. 8, no. 10, 1715. [Google Scholar]
12. A. A. Ardakani, A. R. Kanafi, U. R. Acharya, N. Khadem and A. Mohammadi. (2020). “Application of deep learning technique to manage COVID-19 in routine clinical practice using CT images: Results of 10 convolutional neural networks,” Computers in Biology and Medicine, vol. 121, 103795. [Google Scholar]
13. I. D. Apostolopoulos and T. A. Mpesiana. (2020). “Covid-19: Automatic detection from X-ray images utilizing transfer learning with convolutional neural networks,” Physical and Engineering Sciences in Medicine, vol. 43, pp. 635–640. [Google Scholar]
14. A. Narin, C. Kaya and Z. Pamuk. (2020). “Automatic detection of coronavirus disease (COVID-19) using X-ray images and deep convolutional neural networks,” Physical and Engineering Sciences in Medicine, vol. 43, pp. 635–640. [Google Scholar]
15. A. Majid, M. A. Khan, M. Yasmin, A. Rehman, A. Yousafzai et al. (2020). , “Classification of stomach infections: A paradigm of convolutional neural network along with classical features fusion and selection,” Microscopy Research and Technique, vol. 83, no. 5, pp. 562–576. [Google Scholar]
16. H. T. Rauf, U. Shoaib, M. I. Lali, M. Alhaisoni, M. N. Irfan et al. (2020). , “Particle swarm optimization with probability sequence for global optimization,” IEEE Access, vol. 8, pp. 110535–110549. [Google Scholar]
17. S. Namasudra, P. Roy, P. Vijayakumar, S. Audithan and B. Balusamy. (2017). “Time efficient secure DNA based access control model for cloud computing environment,” Future Generation Computer Systems, vol. 73, pp. 90–105. [Google Scholar]
18. A. Liaqat, M. A. Khan, J. H. Shah, M. Sharif, M. Yasmin et al. (2018). , “Automated ulcer and bleeding classification from WCE images using multiple features fusion and selection,” Journal of Mechanics in Medicine and Biology, vol. 18, no. 04, pp. 1850038. [Google Scholar]
19. S. Namasudra, G. C. Deka, P. Johri, M. Hosseinpour and A. H. Gandomi. (2020). “The revolution of blockchain: State-of-the-art and research challenges,” Archives of Computational Methods in Engineering, vol. 6, no. 2, pp. 20632. [Google Scholar]
20. M. Rashid, M. A. Khan, M. Alhaisoni, S. H. Wang, S. R. Naqvi et al. (2020). , “A sustainable deep learning framework for object recognition using multi-layers deep features fusion and selection,” Sustainability, vol. 12, no. 12, pp. 5037. [Google Scholar]
21. R. M. Pereira, D. Bertolini, L. O. Teixeira, C. N. Silla Jr and Y. M. Costa. (2020). “COVID-19 identification in chest X-ray images on flat and hierarchical classification scenarios,” Computer Methods and Programs in Biomedicine, vol. 194, pp. 5037. [Google Scholar]
22. A. M. Hasan, M. M. AL-Jawad, H. A. Jalab, H. Shaiba, R. W. Ibrahim et al. (2020). , “Classification of COVID-19 coronavirus, pneumonia and healthy lungs in CT scans using Q-Deformed entropy and deep learning features,” Entropy, vol. 22, no. 5, pp. 517. [Google Scholar]
23. M. Abdel-Basset, R. Mohamed, M. Elhoseny, R. K. Chakrabortty and M. Ryan. (2020). “A hybrid COVID-19 detection model using an improved marine predators algorithm and a ranking-based diversity reduction strategy,” IEEE Access, vol. 8, pp. 79521–79540. [Google Scholar]
24. A. Waheed, M. Goyal, D. Gupta, A. Khanna, F. Al-Turjman et al. (2020). , “ Covidgan: Data augmentation using auxiliary classifier gan for improved COVID-19 detection,” IEEE Access, vol. 8, pp. 91916–91923. [Google Scholar]
25. T. Ozturk, M. Talo, E. A. Yildirim, U. B. Baloglu, O. Yildirim et al. (2020). , “Automated detection of COVID-19 cases using deep neural networks with X-ray images,” Computers in Biology and Medicine, vol. 28, pp. 103792. [Google Scholar]
26. L. Wang and A. Wong. (2020). “COVID-Net: A tailored deep convolutional neural network design for detection of COVID-19 cases from chest X-Ray images. arXiv preprint arXiv: 2003.09871. [Google Scholar]
27. P. Afshar, S. Heidarian, F. Naderkhani, A. Oikonomou, K. N. Plataniotis et al. (2020). , “Covid-caps: A capsule network-based framework for identification of COVID-19 cases from X-ray images,” arXiv preprint arXiv: 2004.02696. [Google Scholar]
28. M. Loey, F. Smarandache and N. E. M. Khalifa. (2020). “Within the lack of chest COVID-19 X-ray dataset: A novel detection model based on GAN and deep transfer learning,” Symmetry, vol. 12, no. 4, pp. 651. [Google Scholar]
29. F. Ucar and D. Korkmaz. (2020). “COVIDiagnosis-Net: Deep bayes-squeezenet based diagnostic of the coronavirus disease 2019 (COVID-19) from X-ray images,” Medical Hypotheses, vol. 140, 109761. [Google Scholar]
30. X. Yu, N. Zeng, S. Liu and Y. D. Zhang. (2019). “Utilization of DenseNet201 for diagnosis of breast abnormality,” Machine Vision and Applications, vol. 30, no. 7–8, pp. 1135–1144. [Google Scholar]
31. S. J. Pan and Q. Yang. (2009). “A survey on transfer learning,” IEEE Transactions on Knowledge and Data Engineering, vol. 22, no. 10, pp. 1345–1359. [Google Scholar]
32. X. S. Yang and X. He. (2013). “Firefly algorithm: Recent advances and applications,” International Journal of Swarm Intelligence, vol. 1, no. 1, pp. 36–50. [Google Scholar]
33. G. B. Huang, Q. Y. Zhu and C. K. Siew. (2006). “Extreme learning machine: Theory and applications,” Neurocomputing, vol. 70, no. 1–3, pp. 489–501. [Google Scholar]
 | This work is licensed under a Creative Commons Attribution 4.0 International License, which permits unrestricted use, distribution, and reproduction in any medium, provided the original work is properly cited. |