DOI:10.32604/cmc.2021.013489
| Computers, Materials & Continua DOI:10.32604/cmc.2021.013489 | |
| Article |
Statistical Inference of Chen Distribution Based on Two Progressive Type-II Censoring Schemes
Department of Mathematics & Statistics, Faculty of Science, Taif University, Taif, 21944, Saudi Arabia
*Corresponding Author: Hassan M. Aljohani. Email: hmjohani@tu.edu.sa
Received: 08 August 2020; Accepted: 29 October 2020
Abstract: An inverse problem in practical scientific investigations is the process of computing unknown parameters from a set of observations where the observations are only recorded indirectly, such as monitoring and controlling quality in industrial process control. Linear regression can be thought of as linear inverse problems. In other words, the procedure of unknown estimation parameters can be expressed as an inverse problem. However, maximum likelihood provides an unstable solution, and the problem becomes more complicated if unknown parameters are estimated from different samples. Hence, researchers search for better estimates. We study two joint censoring schemes for lifetime products in industrial process monitoring. In practice, this type of data can be collected in fields such as the medical industry and industrial engineering. In this study, statistical inference for the Chen lifetime products is considered and analyzed to estimate underlying parameters. Maximum likelihood and Bayes’ rule are both studied for model parameters. The asymptotic distribution of maximum likelihood estimators and the empirical distributions obtained with Markov chain Monte Carlo algorithms are utilized to build the interval estimators. Theoretical results using tables and figures are adopted through simulation studies and verified in an analysis of the lifetime data. We briefly describe the performance of developed methods.
Keywords: Chen distributions; progressive type-II censoring; maximum likelihood; mean posterior; Bayesian estimation; MCMC
Several types of monitoring data are available. One is the censoring scheme, which is a popular problem in life testing experiments. The oldest censoring projects are the so-called “type-I”, and the other is “type-II”. In practice, there are usually two random variables, i.e., time and the number of failures of items. This strategy of censoring projects shows how the examiner imagines the experiment based on a predetermined time. A random number of units is accounted for the first type-I of a censoring scheme, which means it may be assumed the exact time of stopping experiment. While the predetermined number of failure units and a random time in the type-II censoring scheme. In these two types of censoring schemes, companies cannot be removed from an experiment until the final stage or the number of units fail. This process allows the detection of some units that are defective after running the experiment. The mixture of these types of censoring schemes is the so-called hybrid censoring system [1]. To remove elements from the test at any stage of the trial is known as a progressive censoring scheme [2]. The topic of progressive censoring has developed in different scientific fields, and has attracted much attention in recent years. Several authors have studied this type of data [3,4]. There are different types of progressive censoring schemes. The idea of the progressive type-I censoring scheme is to test time  and determine the number m of failure units, and suppose n independent elements are tested under the censoring scheme
  . The failure unit is removed at
  , where Tm is the stopping time of the number of failure units m. After each failure time (Ti, ri), survival units are removed from the trial, where
  and
and  . In a progressive type-II censoring project, the number m of failure units and
  are determined, and we suppose n independent units are examined and the experiment is stopped at Tm. After each failure time (Ti, ri), survival units are removed from the test, where
  . The lifetime products come from different production lines [5,6]. The exact likelihood inference using bootstrap algorithms was studied [7], as was the type-II progressive censoring scheme [8,9] and two censoring schemes [10]. Consider manufactured products that come from two production lines
  and
and  under the same conditions. Assume two independent samples S1 and S2 are chosen from these lines for experimental testing. The experiment runs under some consideration of time and cost, and the experimenter reports that it terminates after a predetermined time or number of failures. This is called a joint censoring scheme [11]. The procedure of joint progressive type-II censoring was described previously, where the sample size S1 +S2 is taken as S1 from line
  and S2 from line
  . The integers m and
  are determined to satisfy the form
  . The element r1 is removed immediately from the experiment. We observe the first failure unit, say T1 and has line W1 from line
  or
or  , say
, say  . Also, the number r2 is removed from the test after we examine the second failure unit, say T2 and has line W2, say
  . The experiment continues until
  is observed, where wi takes the value 1 or 0, depending on lines
  or
or  . The result of the previous examination
  is called the joint progressive type-II censoring procedure. The concept of a balanced joint progressive type-II censoring scheme was considered by [12] for analytically more straightforward estimators than the other type of progressive censoring procedure. Several authors have discussed statistical inference using different distributions, such as two exponential distributions [12]. The procedure of lifetime using Weibull distributions was investigated [13]. The interpretation of the balanced joint progressive type-II censoring procedure starts with samples of size S1 +S2, taken from production lines
  and
and  , respectively. Integers m and the integers
  are determined to satisfy
  . The failure times and types are observed, say
  ,
,  . Fig. 1 shows the main idea of a joint progressive type-II censoring scheme. This study discusses the properties of Chen lifetime estimation procedures under a joint progressive type-II censoring scheme. The Chen lifetime distribution with two parameters was introduced by [14]. This study’s objective is to build a balanced joint progressive type-II censoring procedure for the Chen lifetime distribution and parameter estimation with the maximum likelihood estimator (MLE) and Bayes methods. The developed methods are also used to measure the same Chen lifetime products’ relative merits under the same conditions. Estimators are evaluated through numerical data analysis and assessed through a simulation study. The remainder of this article is organized as follows. The main principle and model formulation are given in Section 2. Point MLE and interval estimators are introduced in Section 3. Section 4 discusses Bayes point and credible intervals. Estimators under numerical examples and simulation studies are discussed in Section 5. We summarize some comments which are extracted from numerical methods in Section 6.
Figure 1: Example of the structure of joint progressive type-II censoring procedures
Assume two production lines, and a random sample of size S1 +S2, where S1 comes from line  and S2 from line
  . The integers m and
  are determined to satisfy
  . Suppose t1 is observed from some units that are taken from line
  then, r1 survival component is removed from S1 and r1 +1 survival component is removed from S2 when the second failure t2 is observed if t2 is chosen from the line
  In that case, r2 +1 survival component is removed from S1 − r1 −1, and r2 survival component is removed from the sample S2 − r2 −1. The test continues in this manner until the mth failure tm is observed. If the final failure is from line
  , then the survival components
  are removed from
  , and
, and  are removed from
  . If the final failure belongs to line
  , then the survival units
  are removed from
  , and
, and  are removed from
  . Fig. 1 shows the scheme of joint balanced progressive type-II censoring. The observed data
  are called balanced joint progressive type-II censoring samples. Under consideration that S1 comes from the line
  , and it has independent and identically distribution of lifetimes
  and S2 comes from the line
  , and ithas independent and identically distribution of lifetimes
  . These samples distributed with populations have probability density (PDFs) and cumulative distribution (CDFs) functions are given, respectively, by the functions fj(.) and
  , j = 1, 2. Then the balanced joint progressive type-II sample
  is taken from
  , where m = m1 +m2, m1 is the number of failed units from line
  , and m2 is the number of failed units from line
  . The observed balanced joint progressive type-II censoring sample is
  where
where  takes the value 1 or 0, depends on line
  or
or  ,
,  and
and  .
.
The joint likelihood rule under two progressive type-II censoring samples  is
is
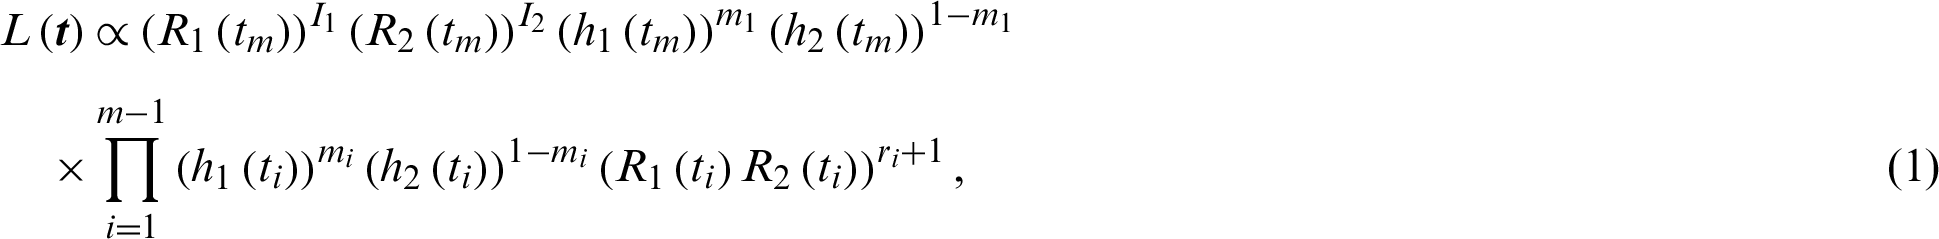
where

and Rj(.) and hj(.) are reliability and hazard rate functions, respectively. Under the described model, the probability density functions (PDFs) and cumulative distribution functions (CDFs) of the tested unit and chosen from two lines  and
and  have Chen lifetime distributions with PDFs given by

Reliability and hazard rate functions, respectively, are given by


and

where  and
and  are the respective shape and scale parameters of the Chen distribution. Hence, a bathtub-shaped failure rate is noticed when
  1, and an exponential form can be obtained when
  [15]. Fig. 2d plots the properties of the Chen distribution. It is clearly seen that
  provides a bathtub-shaped curve when
  .
.
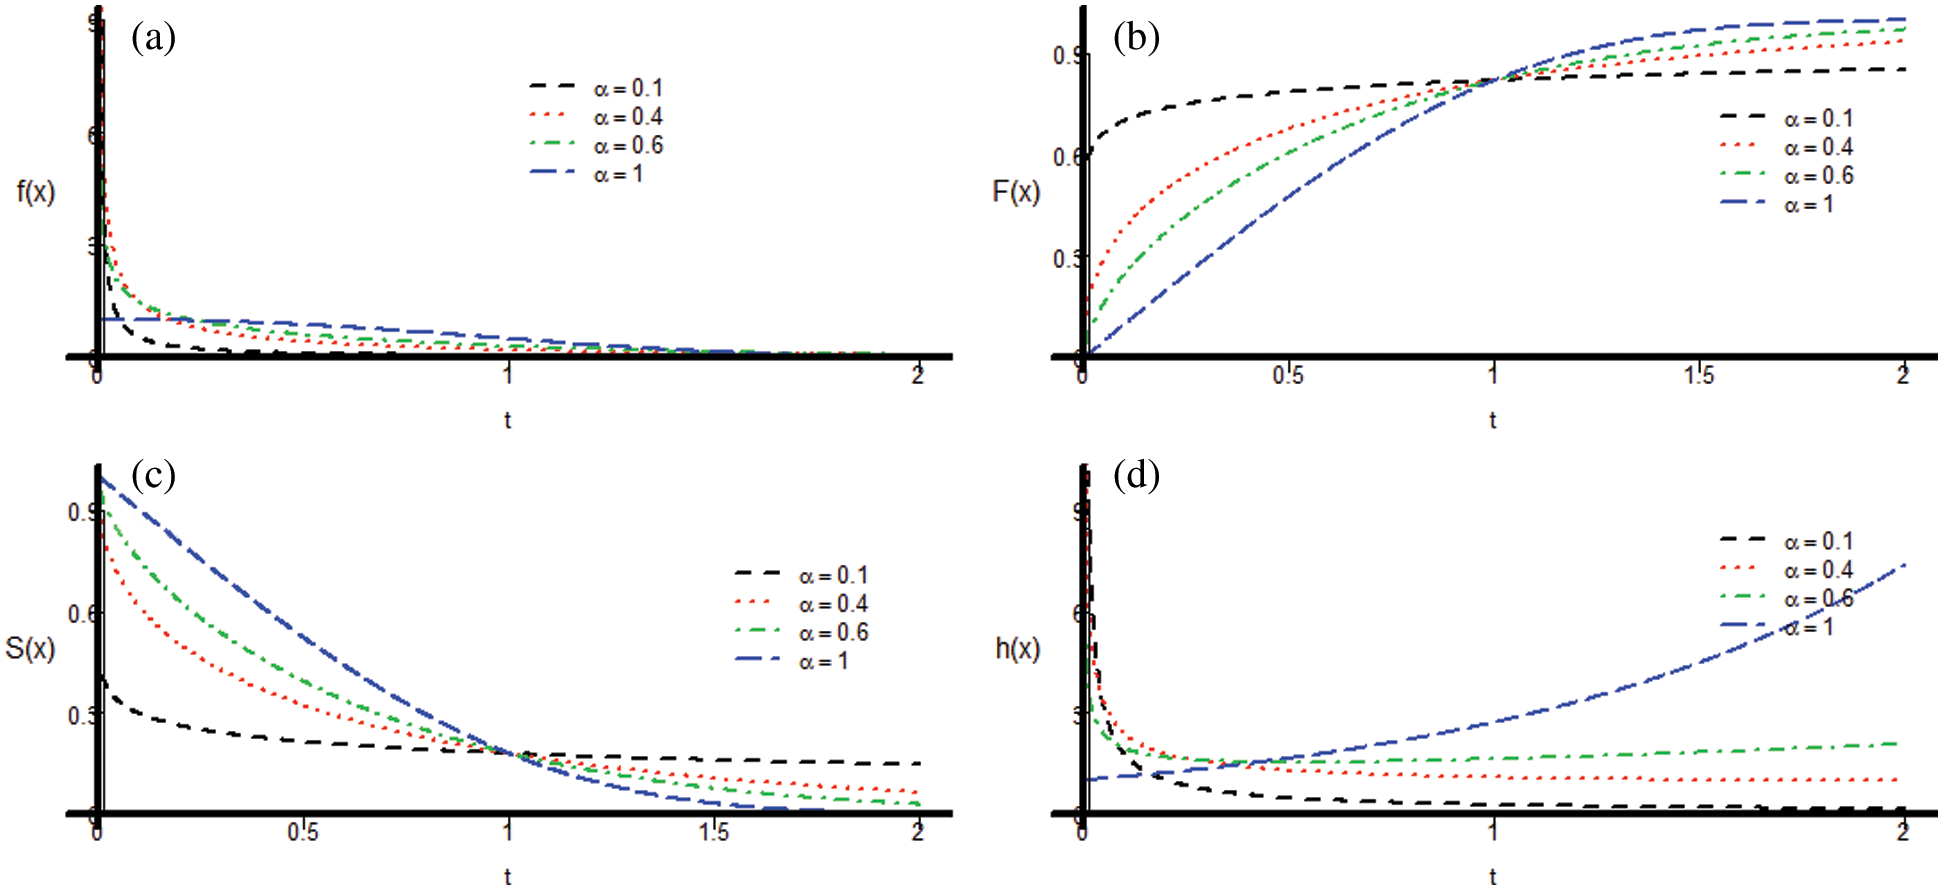
Figure 2: Examples of the scaled Chen distribution for different values of  with
with  : (a) Chen distribution; (b) Cumulative distribution; (c) Reliability function; and (d) Hazard rate function
3 Maximum Likelihood Estimation
The joint likelihood function in Eq. (1) without a normalized constant under a Chen lifetime distribution is defined as
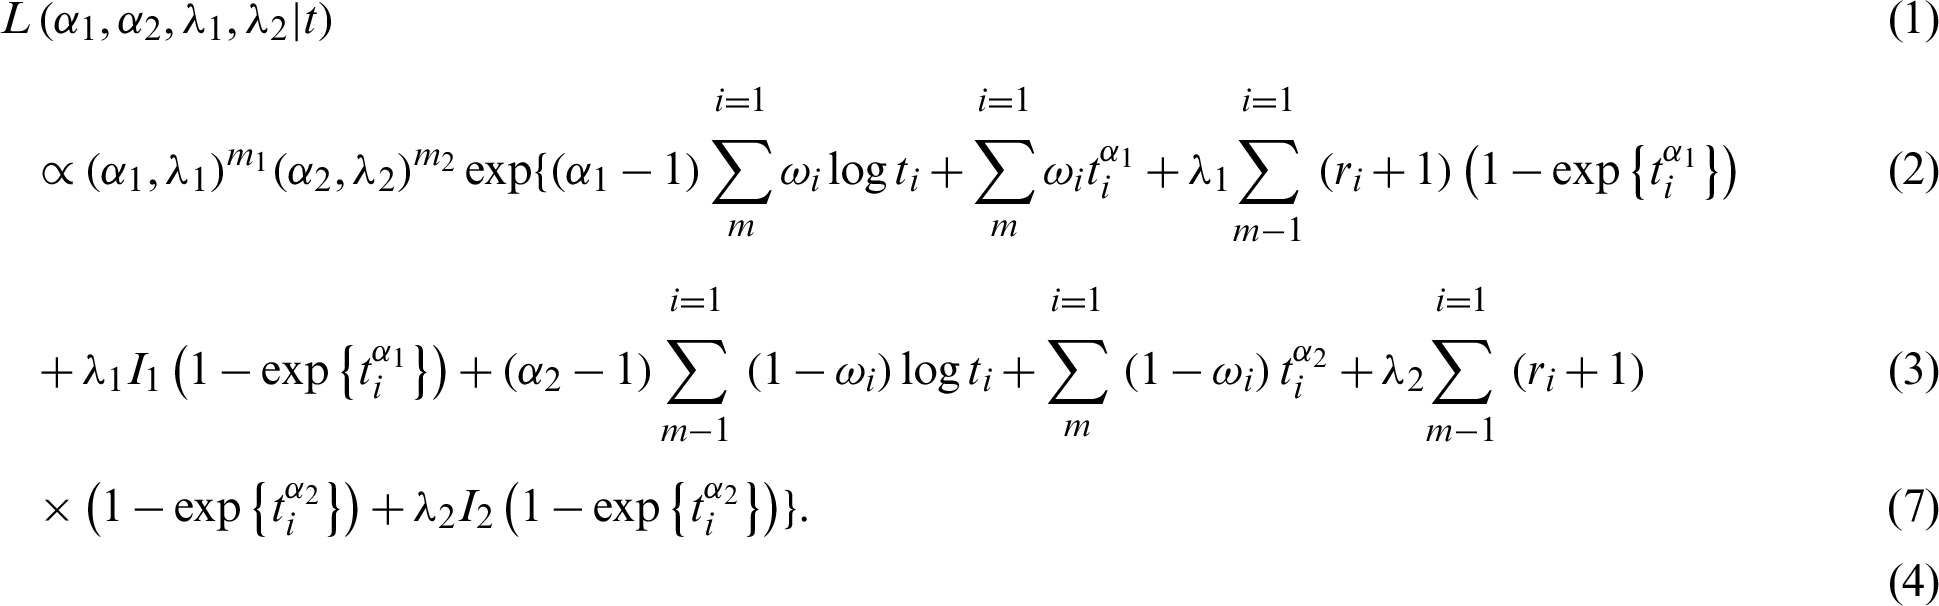
After taking the logarithms of both sides, the joint likelihood function in Eq. (7) becomes
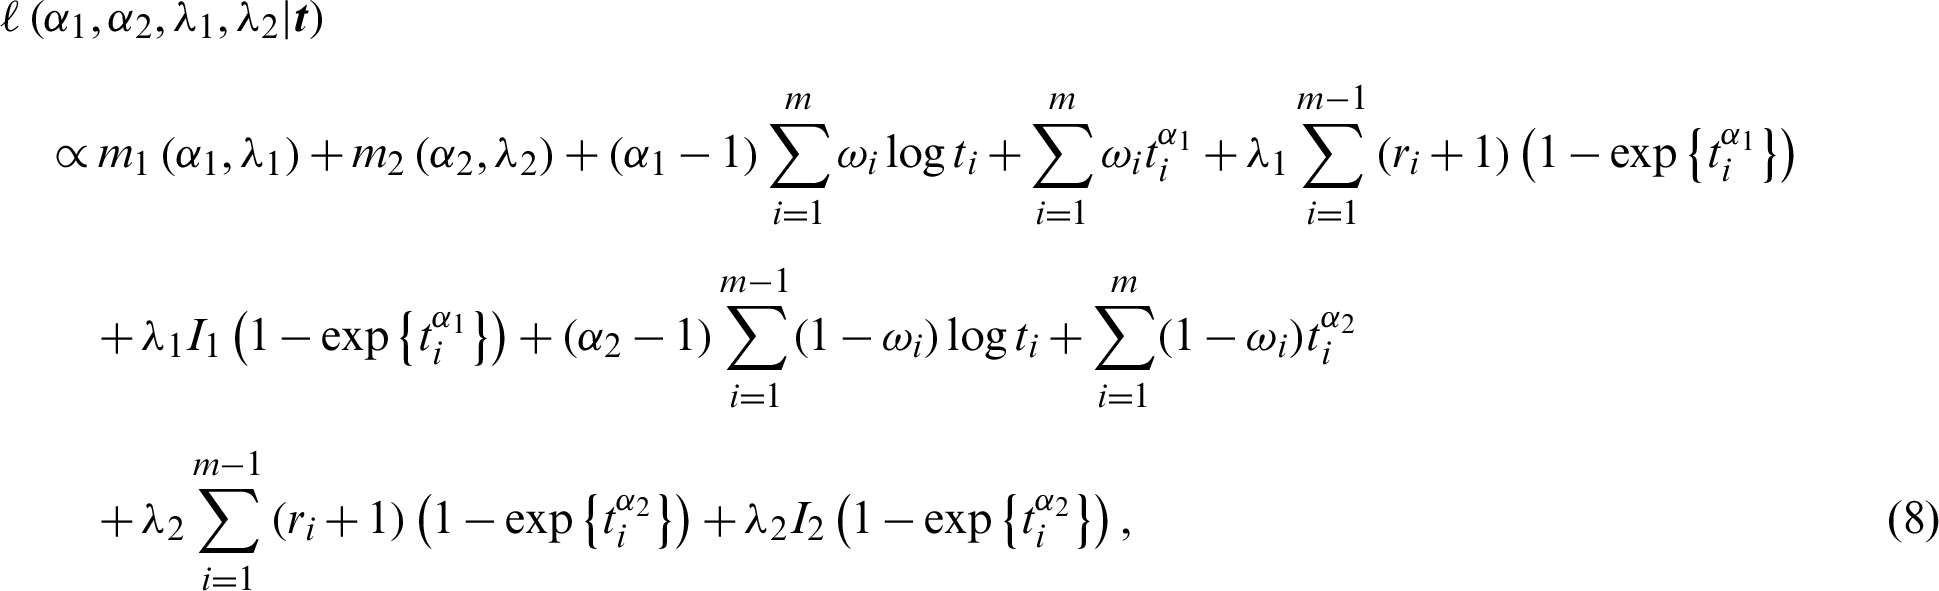
which is used to represent the point and interval estimators of underlying parameters.
The likelihood rule is obtained from Eq. (8) by taking partial derivatives with respect to the parameter vectors  and equating to zero.
The equation  is reduced to

The equation  is reduced to

The equation  is reduced to

The equation  is reduced to

After replacing  in (9)–(11) and
  in (10)–(12), we obtain

and

Nonlinear Eqs. (13) and (14) with only one parameter can be solved using any iteration method such as Newton-Raphson or fixed point iteration. The parameter estimates  and
and  are obtained, and parameter estimates
  and
and  are obtained from Eqs. (9) and (10) after replacing
  and
and  by
by  and
and  . If m1 = 0 or m2 = 0, then the parameter values
  and
and  or
or  and
and  cannot be obtained [16].
3.2 Asymptotic Confidence Interval
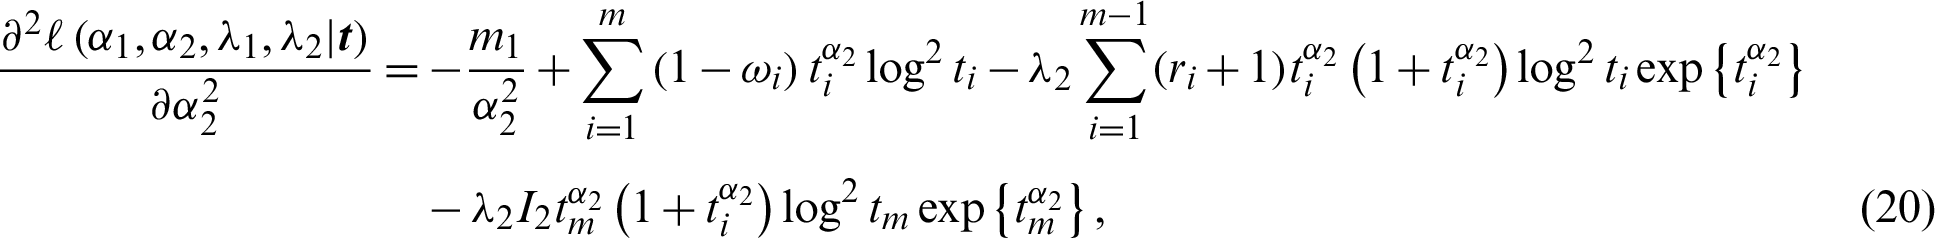
To obtain interval estimates of unknown parameters requires the computation of the Fisher information matrix, which is defined by the negative expectation of the partial second derivative of the log-likelihood rule using (8),

where  . In practice, the Fisher information matrix with a large sample can be approximated using the approximate information matrix,

Therefore, under the rule of asymptotic normality distribution of computing  with mean
  and variance covariance matrix
  . The approximate confidence intervals for model parameters are defined as
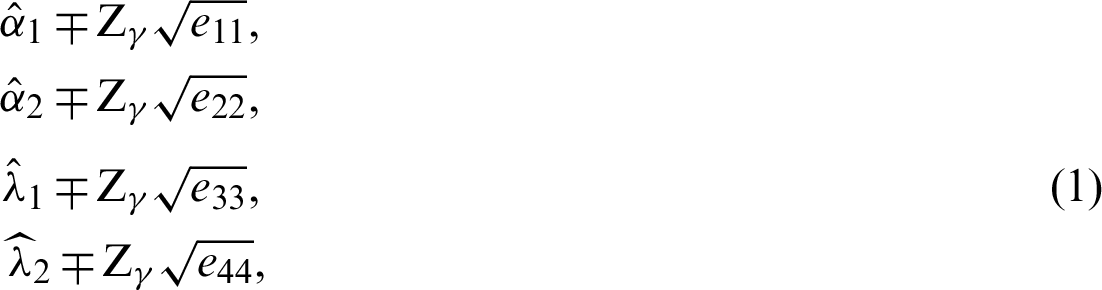
where the diagonal of the approximate variance-covariance matrix  represents the values e11, e22, e33, and e44, and
  has a standard normal distribution with right-tail probability
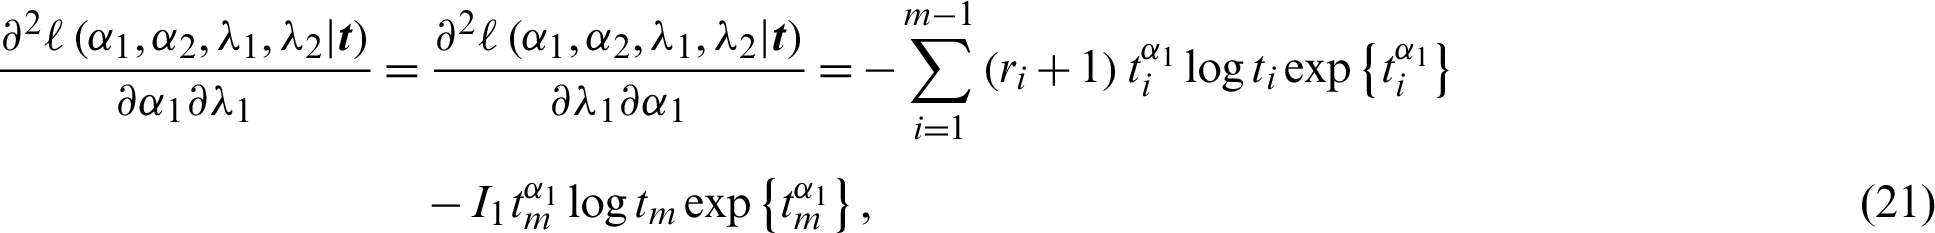
  . The other variances are obtained using the partial derivative of the log-likelihood rule in Eq. (8),

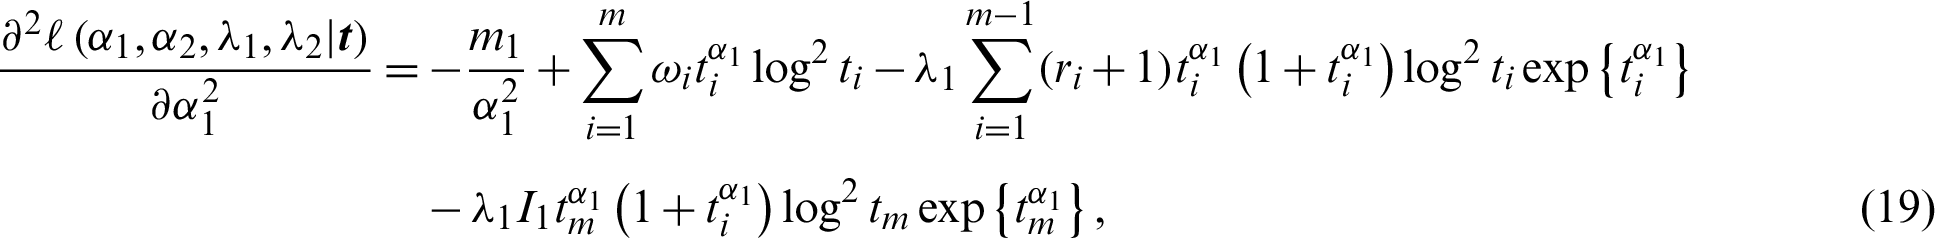

and
We need to use Bayes approaches with the MCMC method because of the dimensionality of the model. Bayes estimation requires prior information about the model parameters, which are considered in this study to be independent gamma priors. Then, the available prior information is modeled as

where  . The joint distribution of prior densities is formed by

Following this, the information about the model parameters is obtained from the prior information and the data, which provides the posterior distribution as

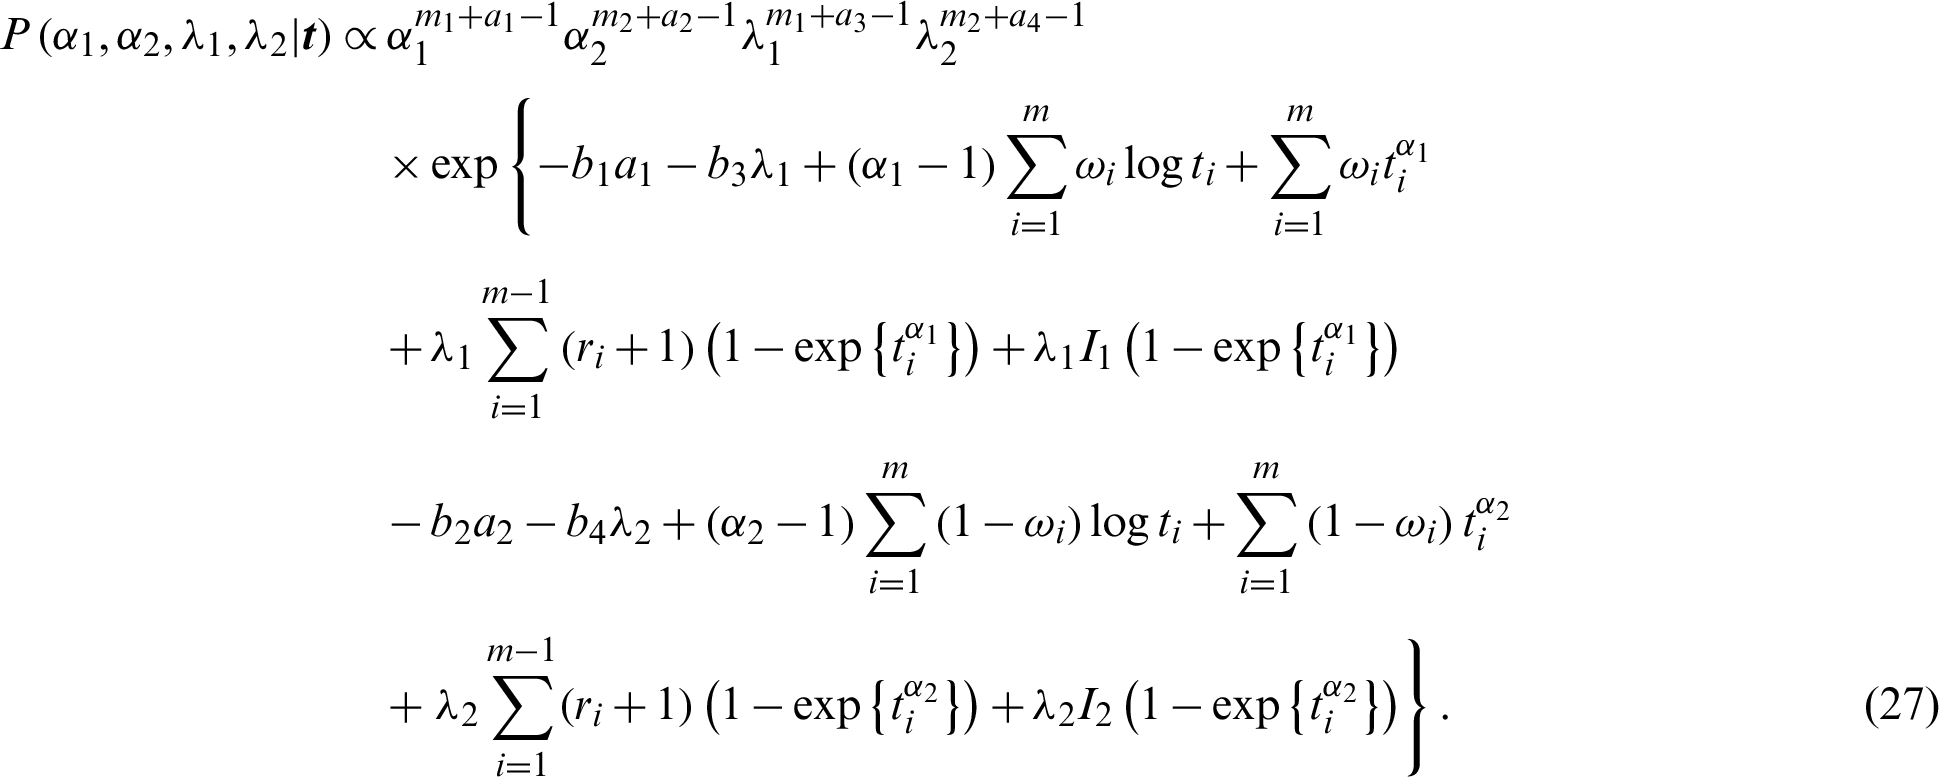
where the denominator of the fraction can be removed since it contains no information about  . The proportional form from posterior distribution (26) with prior distribution (25) and likelihood rule (7) is defined as
The Bayes estimators are computed with respect to the loss rule; then the Bayes method of any function  under the rule of the squared-error loss (SEL) function is presented by

The integrals in Eqs. (26) and (28) generally cannot be obtained in explicit form, but can be solved by approximation, such as numerical integration or Lindley approximation. One of the most frequently applied methods is the MCMC method, which is used to compute point and interval estimates as follows. The full conditional distributions can be described as
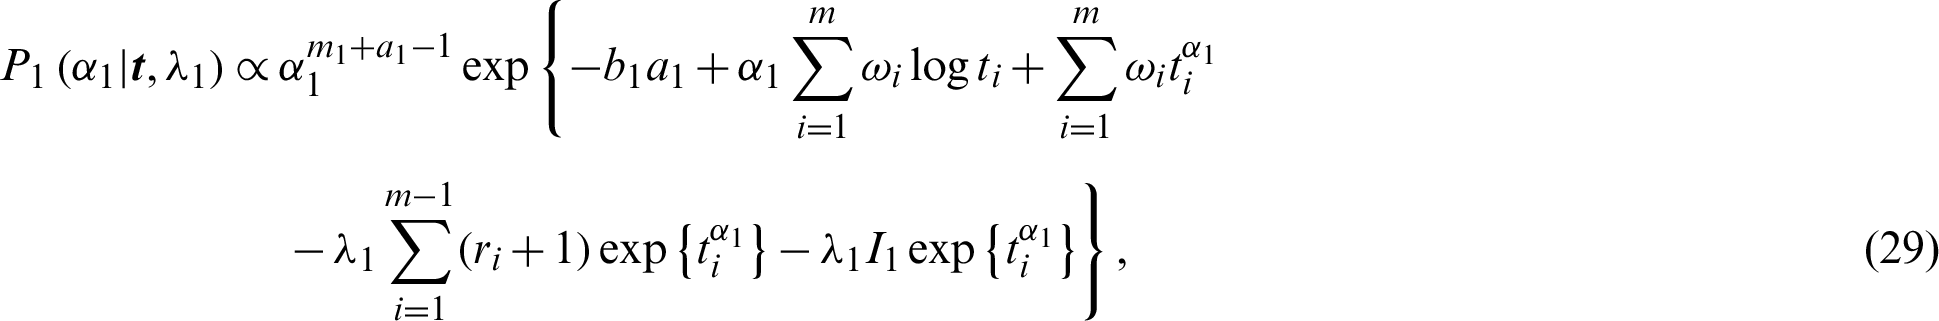
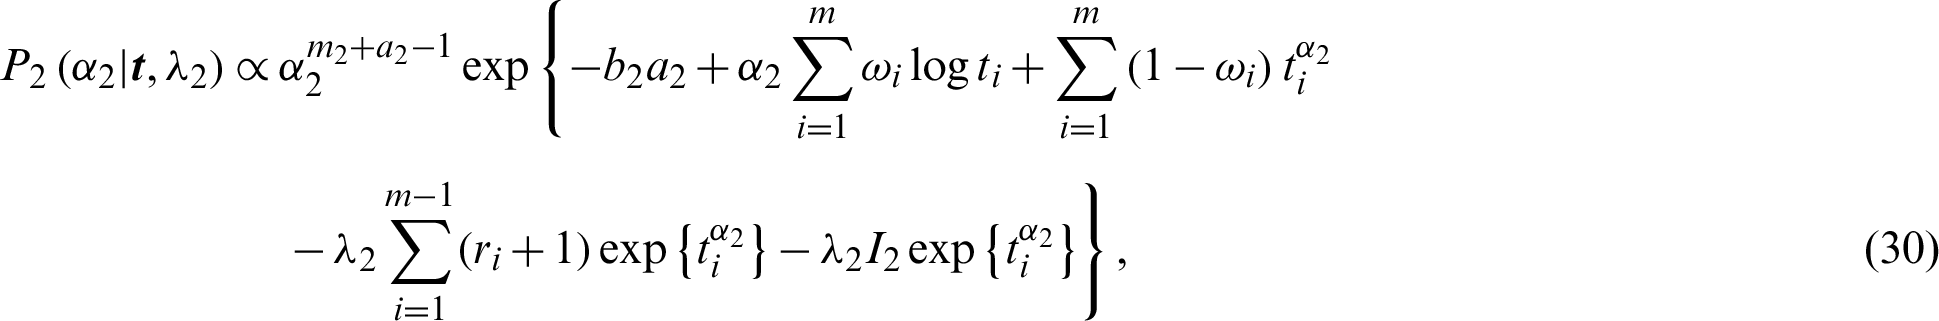
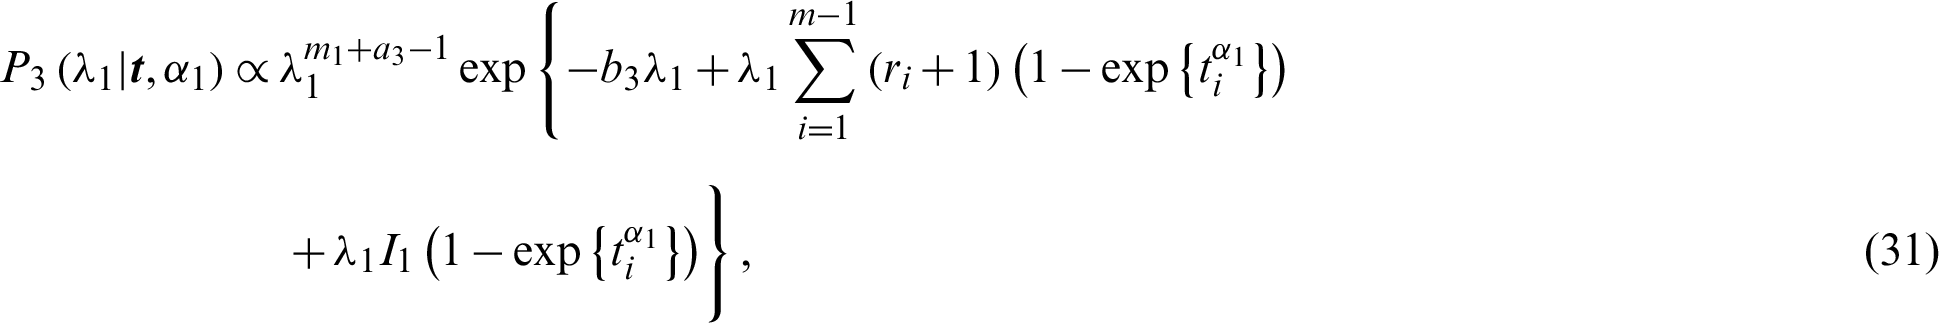
and

Then the full conditional distributions are reduced to gamma distributions represented by Eqs. (31) and (32), and two distributions similar to normal distributions, shown as Eqs. (29) and (30). The MCMC methods have the forms of Gibbs algorithms, and the more general Metropolis-Hastings (MH) under Gibbs algorithms [17]. The following algorithm describes MCMC methods.
Step 1: Start with an initial vector  and indicator
  .
.
Step 2: The values  , j = 1, 2 are generated from conditional distributions presented by Eqs. (31) and (32), respectively.
Step 3: The values  , j = 1, 2 are generated from conditional distributions presented by Eqs. (29) and (30) with the MH algorithm using normal proposal distributions with mean
  and variance obtained from approximate information matrix, respectively.
Step 4: The vector  is recorded; hence,
  .
.
Step 5: Steps (2) to (4) are repeated S times.
Step 6: If we need to the number of iterations to reach convergence in the equilibrium, which called burn-in, say S*; hence, the Bayes estimators of model parameters are represented by

with posterior variance of  ,
,

Step 7: The  credible intervals can be obtained from the empirical distribution of
  after putting the values in ascending order; hence, a credible interval is formed by

where  .
.
Two estimation methods, classical ML and Bayes estimation under Chen lifetime distribution, are discussed and developed in this study. We compare and assess these methods under the MCMC algorithms. We report the results with various sample sizes (S1, S2), several sample sizes of failure units m, and censoring procedures r. We fix parameters at  and
and  . The validity of numerical results is determined by the mean value (MV) and mean squared-error (MSE) for point estimators. The probability coverage (PC) and average interval length (AL) are used to measure interval estimators. The results are summarized in Tabs. 1 and 2 for two sets of prior information (non-informative prior 0 and informative prior 1). The simulation study used 1000 balanced progressive type-II samples. For Bayes results, the producer was considered under the rule of the squared-error loss function and 11000 iterations of MCMC, with the first 1000 iterations as burn-in. The results are reported in Tabs. 1 and 2.
Table 1: MVs and MSEs of estimators of Chen distributions with 
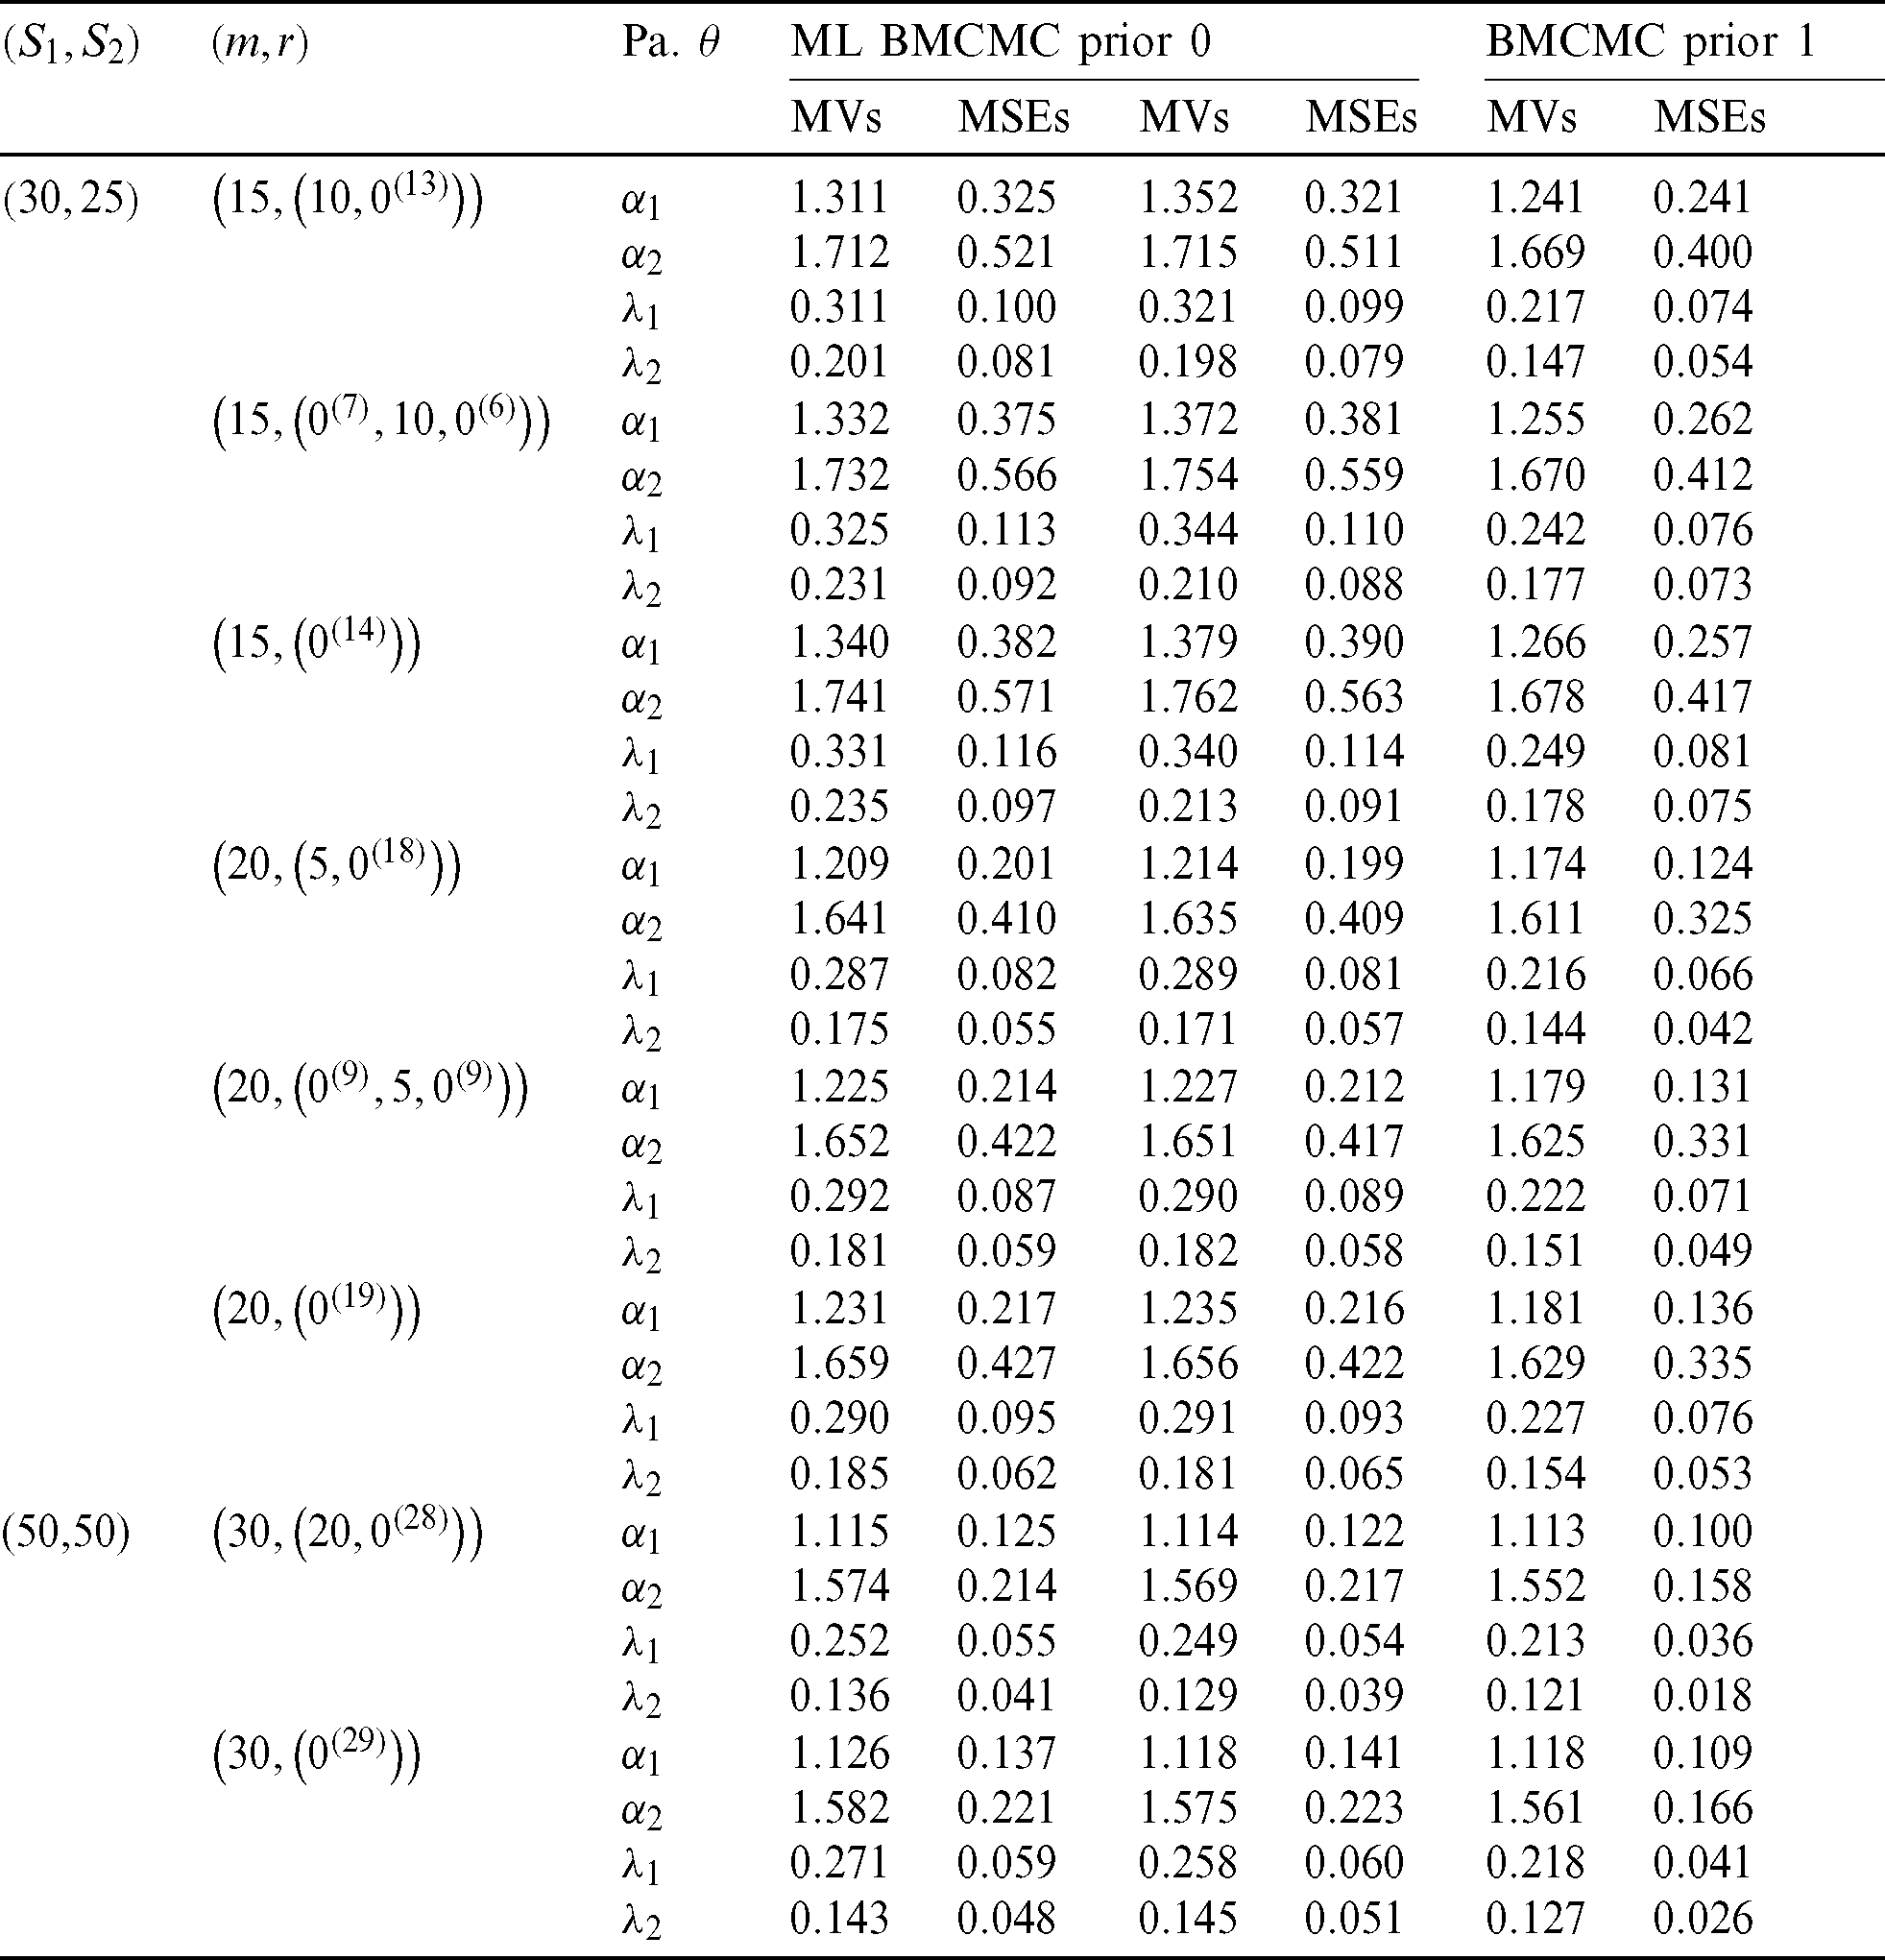
Table 2: Two ALs (PCs) of Chen distributions with 

Let Chen distribution with parameter values 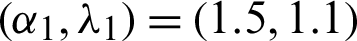 and
and  and the prior distributions with parameters (a1, b1) = (4, 2),
  (a3, b3) = (2.0, 1.5) and (a4, b4) = (2, 2.5) are used to apply Bayes approaches.
Under consideration two sample of size (S1, S2) = (40, 40), censoring scheme  with the number of failures m = 30. Then the sample can be generated with sample size S1 = 30 from a Chen distribution with parameters (1.5, 1.1) and with size S2 from a Chen distribution with parameters (1.8, 0.9) using the algorithms [18]. The two progressive type-II samples are used to generate balanced joint progressive type-II samples with respect to
  and m = 30. The joint sample and its type are reported in Tab. 3. The results of point estimation and interval MLEs are reported in Tab. 4. We plot the monitoring of the MCMC and the corresponding histogram in Figs. 3–10, which show the quality of the empirical posterior distribution generated by MCMC methods.
Table 3: Balanced joint progressive type-II censoring data
Table 4: Point and 95% confidence and credible intervals (ACIs and CIs)

Figure 3: Recording of parameter  generated by the MCMC algorithm

Figure 4: Summary of the analysis for  generated by the MCMC algorithm

Figure 5: Recording of parameter  generated by the MCMC algorithm

Figure 6: Summary of the analysis for  generated by the MCMC algorithm

Figure 7: Recording of parameter  generated by the MCMC algorithm
Figure 8: Summary of the analysis for  generated by the MCMC algorithm

Figure 9: Recording of parameter  generated by the MCMC algorithm

Figure 10: Summary of the analysis for  generated by the MCMC algorithm
Products from different production lines were investigated using a joint censoring procedure under the same conditions. The balanced joint censoring procedure has been shown considerable attention over the last few years. In this study, we discussed products that follow a Chen lifetime distribution. We discussed the ML and Bayes estimates to estimate the underlying parameters of two Chen lifetime distributions. Numerical results were obtained to compare the theoretical performance results. Some points are observed from numerical results, which are summarized as follows.
From the results in Tabs. 1 and 2, show that the balanced joint progressive type-II censoring procedure provides better excellent results for products have Chen lifetime distribution.
Estimation results under the Bayes method and informative prior distribution provide better estimation than ML and non-informative prior methods according to the MSE.
For non-informative priors, there are no significant differences between MLEs and Bayes estimates.
The effective sample size m can be increased by reducing the MSEs and interval lengths.
Acknowledgement: The researcher would like to thank LetPub (www.letpub.com) for its linguistic assistance during the preparation of this manuscript. This study was funded by Taif University Researchers Supporting Project number (TURSP-2020/279), Taif University, Taif, Saudi Arabia.
Funding Statement: Taif University.
Conflicts of Interest: The authors declare that they have no conflicts of interest to report regarding the present study.
1 N. Balakrishnan and D. Kundu. (2013). “Hybrid censoring: Models, inferential results and applications,” Computational Statistics & Data Analysis, vol. 57, no. 1, pp. 166–209. [Google Scholar]
2 G. Herd. (1956). “Estimation of the parameters of a population from a multi-censored sample,” Ph.D. dissertation. Iowa State University, USA. [Google Scholar]
3 A. Cohen. (1963). “Progressively censored samples in life testing,” Technometrics, vol. 5, no. 3, pp. 327–339. [Google Scholar]
4 N. L. Johnson. (1966). “Life testing and early failure,” Technometrics, vol. 8, no. 3, pp. 539–545. [Google Scholar]
5 U. V. R. Rao, I. R. Savage and M. Sobel. (1960). “Contributions to the theory of rank order statistics: The two-sample censored case,” The Annals of Mathematical Statistics, vol. 31, no. 2, pp. 415–426. [Google Scholar]
6 K. Mehrotra and G. Bhattacharyya. (1982). “Confidence intervals with jointly type-II censored samples from two exponential distributions,” Journal of the American Statistical Association, vol. 77, no. 378, pp. 441–446. [Google Scholar]
7 N. Balakrishnan and A. Rasouli. (2008). “Exact likelihood inference for two exponential populations under joint type-II censoring,” Computational Statistics & Data Analysis, vol. 52, no. 5, pp. 2725–2738. [Google Scholar]
8 A. Rasouli and N. Balakrishnan. (2010). “Exact likelihood inference for two exponential populations under joint progressive type-II censoring,” Communications in Statistics–-Theory and Methods, vol. 39, no. 12, pp. 2172–2191. [Google Scholar]
9 A. Shafay, N. Balakrishnan and Y. Abdel-Aty. (2014). “Bayesian inference based on a jointly type-II censored sample from two exponential populations,” Journal of Statistical Computation and Simulation, vol. 84, no. 11, pp. 2427–2440. [Google Scholar]
10 B. Al-Matrafi and G. A. Abd-Elmougod. (2017). “Statistical inferences with jointly type-II censored samples from two rayleigh distributions,” Global Journal of Pure and Applied Mathematics, vol. 13, no. 12, pp. 8361–8372. [Google Scholar]
11 A. Algarni, A. Almarashi, G. A. Abd-Elmougod and Z. A. Abo-Eleneen. (2020). “Two compound rayleigh lifetime distributions in analyses the jointly type-II censoring samples,” Journal of Mathematical Chemistry, vol. 58, no. 1, pp. 950–966. [Google Scholar]
12 S. Mondal and D. Kundu. (2019). “A new two sample type-II progressive censoring scheme,” Communications in Statistics-Theory and Methods, vol. 48, no. 10, pp. 2602–2618. [Google Scholar]
13 S. Mondal and D. Kundu. (2020). “Bayesian inference for Weibull distribution under the balanced joint type-II progressive censoring scheme,” American Journal of Mathematical and Management Sciences, vol. 39, no. 1, pp. 56–74. [Google Scholar]
14 Z. Chen. (2000). “A new two-parameter lifetime distribution with bathtub shape or increasing failure rate function,” Statistics & Probability Letters, vol. 49, no. 2, pp. 155–161. [Google Scholar]
15 J. Wu, H. Lu, C. Chen and C. Wu. (2004). “Statistical inference about the shape parameter of the new two-parameter bathtub-shaped lifetime distribution,” Quality and Reliability Engineering International, vol. 20, no. 6, pp. 607–616. [Google Scholar]
16 D. Kundu and A. Joarder. (2006). “Analysis of type-II progressively hybrid censored data,” Computational Statistics & Data Analysis, vol. 50, no. 10, pp. 2509–2528. [Google Scholar]
17 N. Metropolis, A. W. Rosenbluth, M. N. Rosenbluth, A. H. Teller and E. Teller. (1953). “Equation of state calculations by fast computing machines,” Journal of Chemical Physics, vol. 21, no. 6, pp. 1087–1092. [Google Scholar]
18 N. Balakrishnan and R. A. Sandhu. (1995). “A simple simulational algorithm for generating progressive type-II censored samples,” American Statistician, vol. 49, no. 2, pp. 229–230. [Google Scholar]
 | This work is licensed under a Creative Commons Attribution 4.0 International License, which permits unrestricted use, distribution, and reproduction in any medium, provided the original work is properly cited. |