DOI:10.32604/cmc.2021.012850
| Computers, Materials & Continua DOI:10.32604/cmc.2021.012850 | |
| Article |
Information Theoretic Weighted Fuzzy Clustering Ensemble
1Department of Electronic Information Engineering, School of Information Engineering, Wuhan University of Technology, Wuhan, China
2School of Information Engineering, Wuhan University of Technology, Wuhan, China
3School of Information Engineering, Wuhan Huaxia University of Technology, Wuhan, China
4School of Mathematics, Thapar Institute of Engineering and Technology, Deemed University, Patiala, Punjab, India
5Department of Computer Science, Dehdasht Branch, Islamic Azad University, Dehdasht, Iran
6Institute of Research and Development, Duy Tan University, Da Nang, 550000, Vietnam
7Faculty of Information Technology, Duy Tan University, Da Nang, 550000, Vietnam
8Department of Computer Science, Nourabad Mamasani Branch, Islamic Azad University, Mamasani, Iran
9Fractional Calculus, Optimization and Algebra Research Group, Faculty of Mathematics and Statistics, Ton Duc Thang University, Ho Chi Minh City, Vietnam
10Fakulti Teknologi dan Sains Maklumat Universiti Kebangsaan Malaysia, 43600 UKM Bangi, Selangor, Malaysia
*Corresponding Author: Hamid Parvin. Email: parvin@iust.ac.ir
Received: 14 July 2020; Accepted: 19 August 2020
Abstract: In order to improve performance and robustness of clustering, it is proposed to generate and aggregate a number of primary clusters via clustering ensemble technique. Fuzzy clustering ensemble approaches attempt to improve the performance of fuzzy clustering tasks. However, in these approaches, cluster (or clustering) reliability has not paid much attention to. Ignoring cluster (or clustering) reliability makes these approaches weak in dealing with low-quality base clustering methods. In this paper, we have utilized cluster unreliability estimation and local weighting strategy to propose a new fuzzy clustering ensemble method which has introduced Reliability Based weighted co-association matrix Fuzzy C-Means (RBFCM), Reliability Based Graph Partitioning (RBGP) and Reliability Based Hyper Clustering (RBHC) as three new fuzzy clustering consensus functions. Our fuzzy clustering ensemble approach works based on fuzzy cluster unreliability estimation. Cluster unreliability is estimated according to an entropic criterion using the cluster labels in the entire ensemble. To do so, the new metric is defined to estimate the fuzzy cluster unreliability; then, the reliability value of any cluster is determined using a Reliability Driven Cluster Indicator (RDCI). The time complexities of RBHC and RBGP are linearly proportional with the number of data objects. Performance and robustness of the proposed method are experimentally evaluated for some benchmark datasets. The experimental results demonstrate efficiency and suitability of the proposed method.
Keywords: Fuzzy clustering ensemble; cluster unreliability; consensus function
Data mining [1–24] involves many tasks. One of the most important tasks in data mining is clustering [25–29]. According to different similarity criteria implemented by various clustering algorithms in the context of unsupervised learning, different objective functions are targeted [30]. According to “no free lunch” theory, there is no dominant clustering method [22,23]. Therefore, the idea of combining clustering, which is also called cluster (or clustering) ensemble, emerged. In a clustering ensemble, some of the basic partitions are combined to acquire a better solution capable of managing all objectives of different partitions which sometimes are contradictory [28–30]. Cluster ensemble offers many advantages, among which the following can be mentioned: robustness to noise [29], capability of producing novel results [31–33], quality enhancement [29], knowledge reusability [30], multi-view clustering [33], stability, parallel/distributed data processing [30], finding number of real clusters, adaptability and heterogeneous data clustering.
The process of clustering ensemble consists of two related phases as shown in Fig. 1a. The first phase includes production of the diverse base clusterings through the basic clustering algorithm (s), and the second phase involves extracting the final clustering from the primary basic partitions using a consensus function. To improve the performance of the clustering ensemble in the first phase, a special attention should be paid to the ensemble diversity which determines the quality of the combination. If the quality of each voter is greater than a random voter, the quality of the combination is improved by increasing the ensemble diversity, where the combination can be any community like the ensemble clustering [33]. There are many approaches, which are used in production of primary basic partitions in order to acquire the desired diversity, such as: Different initializations of parameters [30], heterogeneous ensemble clustering methods [28], different subsets of the features [30], different subsets of objects [28], projection of the object subsets [28] and hybrid methods. In our proposed method, a basic clustering algorithm is implemented with different parameters to achieve the desired diversity. In the second phase, a consensus function is utilized to achieve the final clustering. Selection of the clusters with high quality is an NP hard problem because clustering is an unsupervised problem [33]. Several consensus functions are proposed to face this issue, each of which uses a specific approach and different information from the primary basic partitions achieved from phase one, and sometimes considers the initial characteristics of the data. Consensus ensemble methods are divided into the following classes: 1. intermediate space clustering ensemble methods [28], 2. methods based on the co-association matrix [33], 3. hyper-graph based methods [30], 4. expectation maximization clustering ensemble methods [32], 5. mathematical modeling (median partition) approaches [34], and 6. voting-based methods [35].

Figure 1: (a) The general procedure of a clustering ensemble method, and (b) The proposed approach steps
There are two types of clustering algorithms: (a) First, hard clustering algorithms in which a data object either is definitely assigned to a cluster or is not assigned to it at all and (b) Second, fuzzy clustering algorithms in which there are some data points that are not allocated to a specific cluster but they are allocated to all clusters with different membership degrees (for a data point, the summation of all membership degrees to all clusters should be one). The basis of fuzzy clustering algorithms is the basic fuzzy c-means (FCM) clustering algorithm [36].
Although soft (or fuzzy) clustering has more generality than crisp clustering, researches in soft clustering are in early stages and fuzzy clustering ensemble approaches have not been widely developed. Fuzzy clustering ensembles are proposed by a few researchers, (e.g., Punera et al. [37] have proposed soft versions of Cluster-based Similarity Partitioning Algorithm (CSPA), Meta CLustering Algorithm (MCLA) and Hybrid Bipartite Graph Formulation (HBGF) which are respectively named soft CSPA (sCSPA), soft MCLA (sMCLA) and soft HBGF (sHBGF)) but crisp clustering has more maturity. Some of the existing fuzzy clustering ensemble methods convert fuzzy clusters to hard clusters through some existing simple methods and then the hard consensus functions are used to compute the final partition. This conversion causes the loss of uncertainty information. This loss of uncertainty information causes some challenges in suggesting an efficient fuzzy consensus clustering from multiple fuzzy basic partitions.
Consensus process is highly dependent on the quality of the primary partitions so that the low-quality or even noisy primary partitions could adversely affect it. Improving performance of the consensus functions through quality-evaluation and weighting of the primary partitions is attended to confront with low-quality primary partitions based on the implicit assumption that all clusters have the same reliability value in the same base clustering [38]. This is usually performed by assigning a weight to each primary partition, which is considered to be an individual as a whole, without caring about the quality of its clusters. We have to confront different reliability values of clusters in the same clustering because real-world datasets are inherently complex and noisy. In some methods, it is needed to have access to the data features such as what was proposed by Zhong et al. [33]. Their method has investigated the reliability values of the clusters using the Euclidean distances between objects of the clusters and its efficiency is highly dependent on the distribution of the data in the dataset. However, in a clustering ensemble in its general formulation, we assume that we have not access to the original data features.
In this work, according to estimation of ensemble driven cluster unreliability and local weighting strategy, a new approach of fuzzy clustering ensemble is proposed as shown in Fig. 1b. In order to increase the consensus performance, a locally weighted plan is achieved by integrating the validity and unreliability of the cluster. An entropic criterion is used to estimate unreliability of any fuzzy cluster based on relation of the cluster acceptability to the entire ensemble. The new metric is defined to estimate the fuzzy cluster unreliability and then the reliability values of the clusters are determined using an index named RDCI. Each cluster is assessed and weighted by its RDCI which evaluates the cluster using an effective indication provided by the crowd of diverse clusters in the ensemble. Then, a fuzzy weighted co-association matrix with the calculated weights based on the reliability, incorporates local acceptability into the conventional co-association (Co) matrix and is treated as a summary for the ensemble of diverse clusters. After that, new consensus algorithms are proposed to achieve the final clustering. The new consensus algorithms include: (a) RBFCM and (b) RBGP which consider cluster reliabilities, and (c) RBHC which considers cluster pairwise acceptability.
The main contributions of the paper are summarized as follows. (I) We estimate an unreliability value per a fuzzy cluster in relation to other clusterings through the proposed method utilizing an entropic criterion. The entropic criterion considers only distribution of membership degrees of all objects to each primary fuzzy cluster while the access to the original data features is not needed; it has also no assumptions on data distribution. (II) The primary fuzzy clusters in the ensemble are assessed and weighted by proposing an RDCI which results in providing a reliability indication at the cluster-level with a contribution to the local weighting plan. (III) A new approach for fuzzy co-association matrix computation in the fuzzy cluster ensemble is proposed. (IV) New consensus functions are proposed to construct the final clustering according to estimation of the reliability–driven fuzzy cluster unreliability and local weighting strategy. (V) Finally, the derived experimental results demonstrate the performance and robustness superiority of the proposed fuzzy clustering ensemble approach to the state-of-the-art approaches.
The rest of the paper is organized as follows. In Section 2, the related literature is reviewed. Section 3 provides the background knowledge about entropy and clustering ensemble. The proposed approach of fuzzy clustering ensemble is described in Section 4 based on the cluster unreliability estimation and local weighting strategy. The experimental results are provided in Section 5, and finally the paper is concluded in Section 6.
Some of the most important ensemble clusterings include k means-based consensus clustering [28], spectral ensemble clustering [39] and infinite ensemble clustering [40]. The following works are also considered to be important researches in fuzzy clustering ensemble: sCSPA and sMCLA introduced in [37] as the fuzzy extension versions of CSPA and MCLA are proposed in [30]. sHBGF is also proposed as a fuzzy version of HBGF [31].
To extract the final fuzzy clustering out of a fuzzy clustering ensemble, an explicit objective function is proposed in [41] based on the new contingency matrix. In order to accurately and efficiently extract the final clustering in this approach which is a parallelizable algorithm and capable of being used for big data clustering, a flexible utility function is employed to change fuzzy consensus clustering into a weighted piecewise FCM-like iterative.
Vote-based merging algorithm (VMA) as a fuzzy clustering ensemble method which was proposed in [42], calculated the final clustering based on the membership matrix averaging in each clustering. Since all the base clusters in this method have to be relabeled, VMAs would be among time-consuming algorithms. An information theoretic kmeans (ITK) was introduced by Dhillon et al. [43].
In [34], the clusters labels are shown as a 0–1 bit string where the goal is to obtain the final fuzzy clustering which is a membership matrix any of whose members shows the membership degree of a data object to a cluster. Accordingly, they introduce the Fuzzy String Objective Function (FSOF) which tries to minimize the summation of distances between centers of the initial clusters and the final clusters. Since the final clustering was fuzzy, some constraints were added to the objective function which created a non-linear optimization NP problem. They employed a genetic algorithm for its solution. Note that it is applicable while the base clusterings are crisp. Two consensus functions, i.e., Fuzzy String Cluster Ensemble Optimized by Genetic Algorithm numbers 1 and 2 (FSCEOGA1 and FSCEOGA2), were also proposed based on cross-over and mutation operators.
In order to enhance the stability of the fuzzy cluster analysis, a heterogeneous clustering ensemble has been proposed [44] in which basic fuzzy clustering algorithms are first utilized and then, final clustering is obtained using a FCM algorithm so that all clusters in the co-association matrix have equal participation weights. To achieve the consensus clustering from fuzzy clustering ensembles, a voting mechanism is used in [35]. The work includes disambiguation and voting procedures. Disambiguation is a phase in which Hungarian algorithm [45] with time complexity of  (
( is (average) number of clusters in each clustering) is used for re-labeling problem. The voting phase is implemented to achieve the final consensus clustering. There are many voting phases such as confidence-based voting methods (including sum voting rule and product voting rule) and positional-based voting methods (including Borda voting rule and Copeland voting rule). Time complexity of these voting rules is
  where
where  , M and
  are (average) number of the clusters in each clustering, number of data objects and number of base clusterings respectively. There exist many different consensus functions depending on direct or repetitive combination of re-labeling and voting phases.
According to the particle swarm optimization (PSO) which has the capability of finding fuzzy and crisp clusters [46,47], a method for construction of a fuzzy clustering ensemble is proposed in [46]. It creates initial clusters through parameter change; and then, using pruning process,  clusters are chosen from the
  initial clusterings so that
  where c is the number of the clusters in all of the
  initial clusterings. For pruning process, one of the internal cluster validity indices such as Ball–Hall, Caliński et al. [48], Dunn index [49], Silhouette index [50] or Xie-Beni [51] is selected to evaluate the fitness of primary basic clusters; and then, one of the genetic selection mechanisms such as tournament or roulette wheel is used to choose the elite clusters. Final clustering is subsequently achieved by use of the consensus function through PSO algorithm. Unlike other PSO-based methods in which each particle represents a clustering, each particle represents a cluster in this method.
Through the following definitions, we introduce the general formulation of data, fuzzy clustering ensemble and entropy in this paper. Note that the notations implemented in this work are presented here. An object (or data point) is a tuple denoted by  . It is also a vector where
  represents the j-th attribute from i-th data. Also,
  is defined as j-th attribute of dataset,
  denotes size of the dataset dimensions (i.e., quantity of the attributes), and
  shows the dataset size (i.e., quantity of the data points).
  is a
is a  matrix which represents the fuzzy partition defined on dataset x, where
  and n is an integer indicating the number of clusters, and we have Eq. (1).
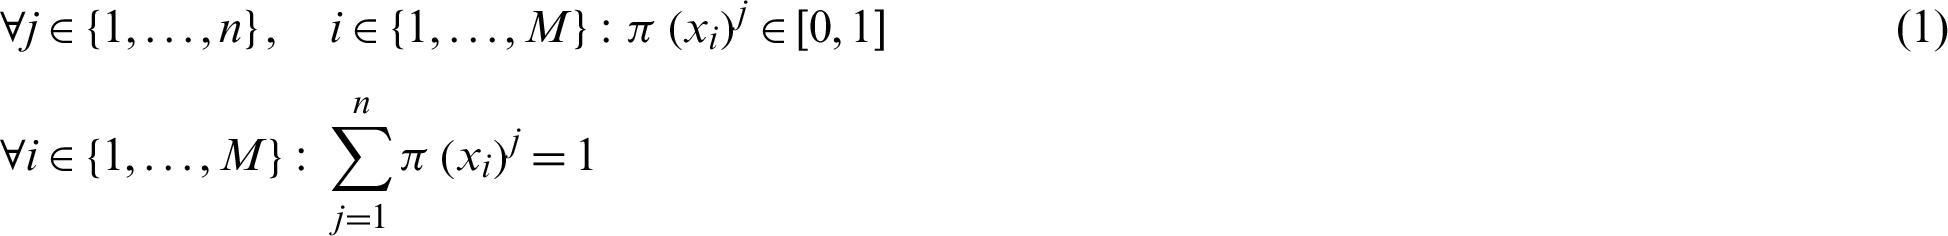
where  shows a real number indicating how much i-th data object belongs to the j-th cluster in partition
  which is
  .
.  denotes a clustering ensemble which includes
  primary partitions, i.e.,
  in which
  where,
  represents the m-th primary partition in
  ,
,  and nm are the i-th cluster and the number of the clusters in
  respectively. The set of all clusters in the ensemble is denoted by
  and defined as
  where
where  is the i-th cluster of the partition
  . Therefore, the number of all clusters in the base clusterings is denoted by c and is defined as
  . Let’s assume that z is a discrete random variable. The entropy is a measure of the unreliability related to a random variable. For a discrete random variable z whose domain, i.e., the set of the values for z, is denoted by Z, it is defined according to Eq. (2).

where  is the probability mass function of z and
  0 is always assumed to be 0 here.
  is the joint entropy as a measure of the unreliability associated with a set of two discrete random variables z and w. It is defined according to Eq. (3).

where  is the joint probability of two discrete random variables z and w. When z and w are independent random variables, the joint entropy is
  . Thus, for q independent random variables
  , the joint entropy is defined according to
  .
.
Block diagram of the proposed method is presented in Fig. 1b in which a new approach of fuzzy clustering ensemble is proposed based on estimation of the ensemble driven cluster unreliability and local weighting strategy. The proposed algorithm includes the following stages. First, we compute the acceptability of each cluster. Then, the unreliability of each cluster is estimated and after that weight of each cluster is determined. Next, the weighted co-association matrix is produced and finally, the consensus clustering is achieved.
4.1 Cluster Acceptability Computation
According to Fig. 1b and Eq. (4), the acceptability of each cluster over other clusters is computed which is equivalent to the computation of agreement probability between two clusters in different clusterings. Acceptability computation of cluster  (cluster
  ) over the cluster
  (cluster
  ), when
  is performed using Eq. (4).

4.2 Cluster Unreliability Estimation
As depicted in Fig. 1b, the next stage in the algorithm is unreliability estimation of the clusters. Using the entropy concept, as a measure for discrete random variables, unreliability is computed to be applied to the cluster labels in reliability computation of the clusters. It is a reasonable strategy because there is not information about original data features and their distribution. If cluster Ci does not belong to the base clustering  exactly, then, the clustering
  will partition the cluster; this means that the membership degree of data objects of Ci, is different from their membership degree in all clusters of
  and the clustering
  may not accept the membership degree of Ci data objects. Therefore, depending on how the data objects of Ci are clustered in
  , the unreliability (or entropy) of Ci with regards to
  is estimated by entropy concept presented by Eq. (2). Unreliability of the cluster
  (i.e., the i-th cluster in s-th clustering) with respect to clustering
  of the ensemble
  where
where  , is acquired using Eq. (5).

where  is the probability vector obtained according to
 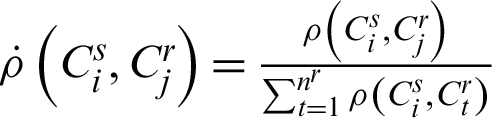 and the term
  is added to guarantee that
  is in range
  , where nr is the number of the clusters in
  ,
,  is the j-th cluster in
  and
and  is acquired according to Eq. (4). Since we have assumed that the partitions of the ensemble are independent [52], we can achieve the unreliability of a cluster Ci with respect to the
  base clusterings in ensemble
  by Eq. (6). It means the unreliability of cluster
  in ensemble clusterings
  is computed by Eq. (6).

where the term  1 is added to make
  in the range
  .
.
4.3 Cluster Reliability Computation
Weight of each cluster represents its reliability value which is computed according to the derived unreliability or entropy of that cluster in the clustering ensemble via an RDCI. For cluster  , RDCI as the weight of each cluster in a clustering ensemble
  with
with  base clusterings is defined as follows in Eq. (7).

where impact of the unreliability on clustering ensemble weight is adjusted by the non-negative parameter  . The best result is obtained when
  is 0.4. Since
  ,
,  lies in the interval
  for each
  . When the unreliability value of a cluster
  is minimized, i.e., when
  is zero, its RDCI is maximized, i.e.,
  is one.
4.4 Cluster-Wise Weighted Co-Association Matrix
In this stage, a fuzzy co-association matrix is derived regarding the reliability values of the clusters in the ensemble. Methods based on the co-association matrix are of the most common methods for combination of the base clusterings. Using the Evidence Accumulation Clustering (EAC) method, which was proposed in [32], individual data object clusterings in a clustering ensemble were projected into a new metric of pairwise similarity. However, this method could not suitably achieve the co-association matrix from fuzzy clusters. Thus, Evidence Accumulation Fuzzy Clustering (EAFC) is implemented as a new method to derive the co-association matrix. Eq. (8) is used to derive the fuzzy co-association clustering ensemble matrix

where xi and xj are the data objects,  and
and  are considered to be xy and x + y respectively. To make the
  matrix normal, we use
  . In Eq. (9), the weighted fuzzy co-association matrix is obtained by using the RDCI as a weight in calculation of the co-association matrix to consider the reliability of each cluster. Calculation of the weighted fuzzy co-association clustering ensemble matrix (WFCA) is performed using Eq. (9).

To make the  matrix normal, we use
  .
.
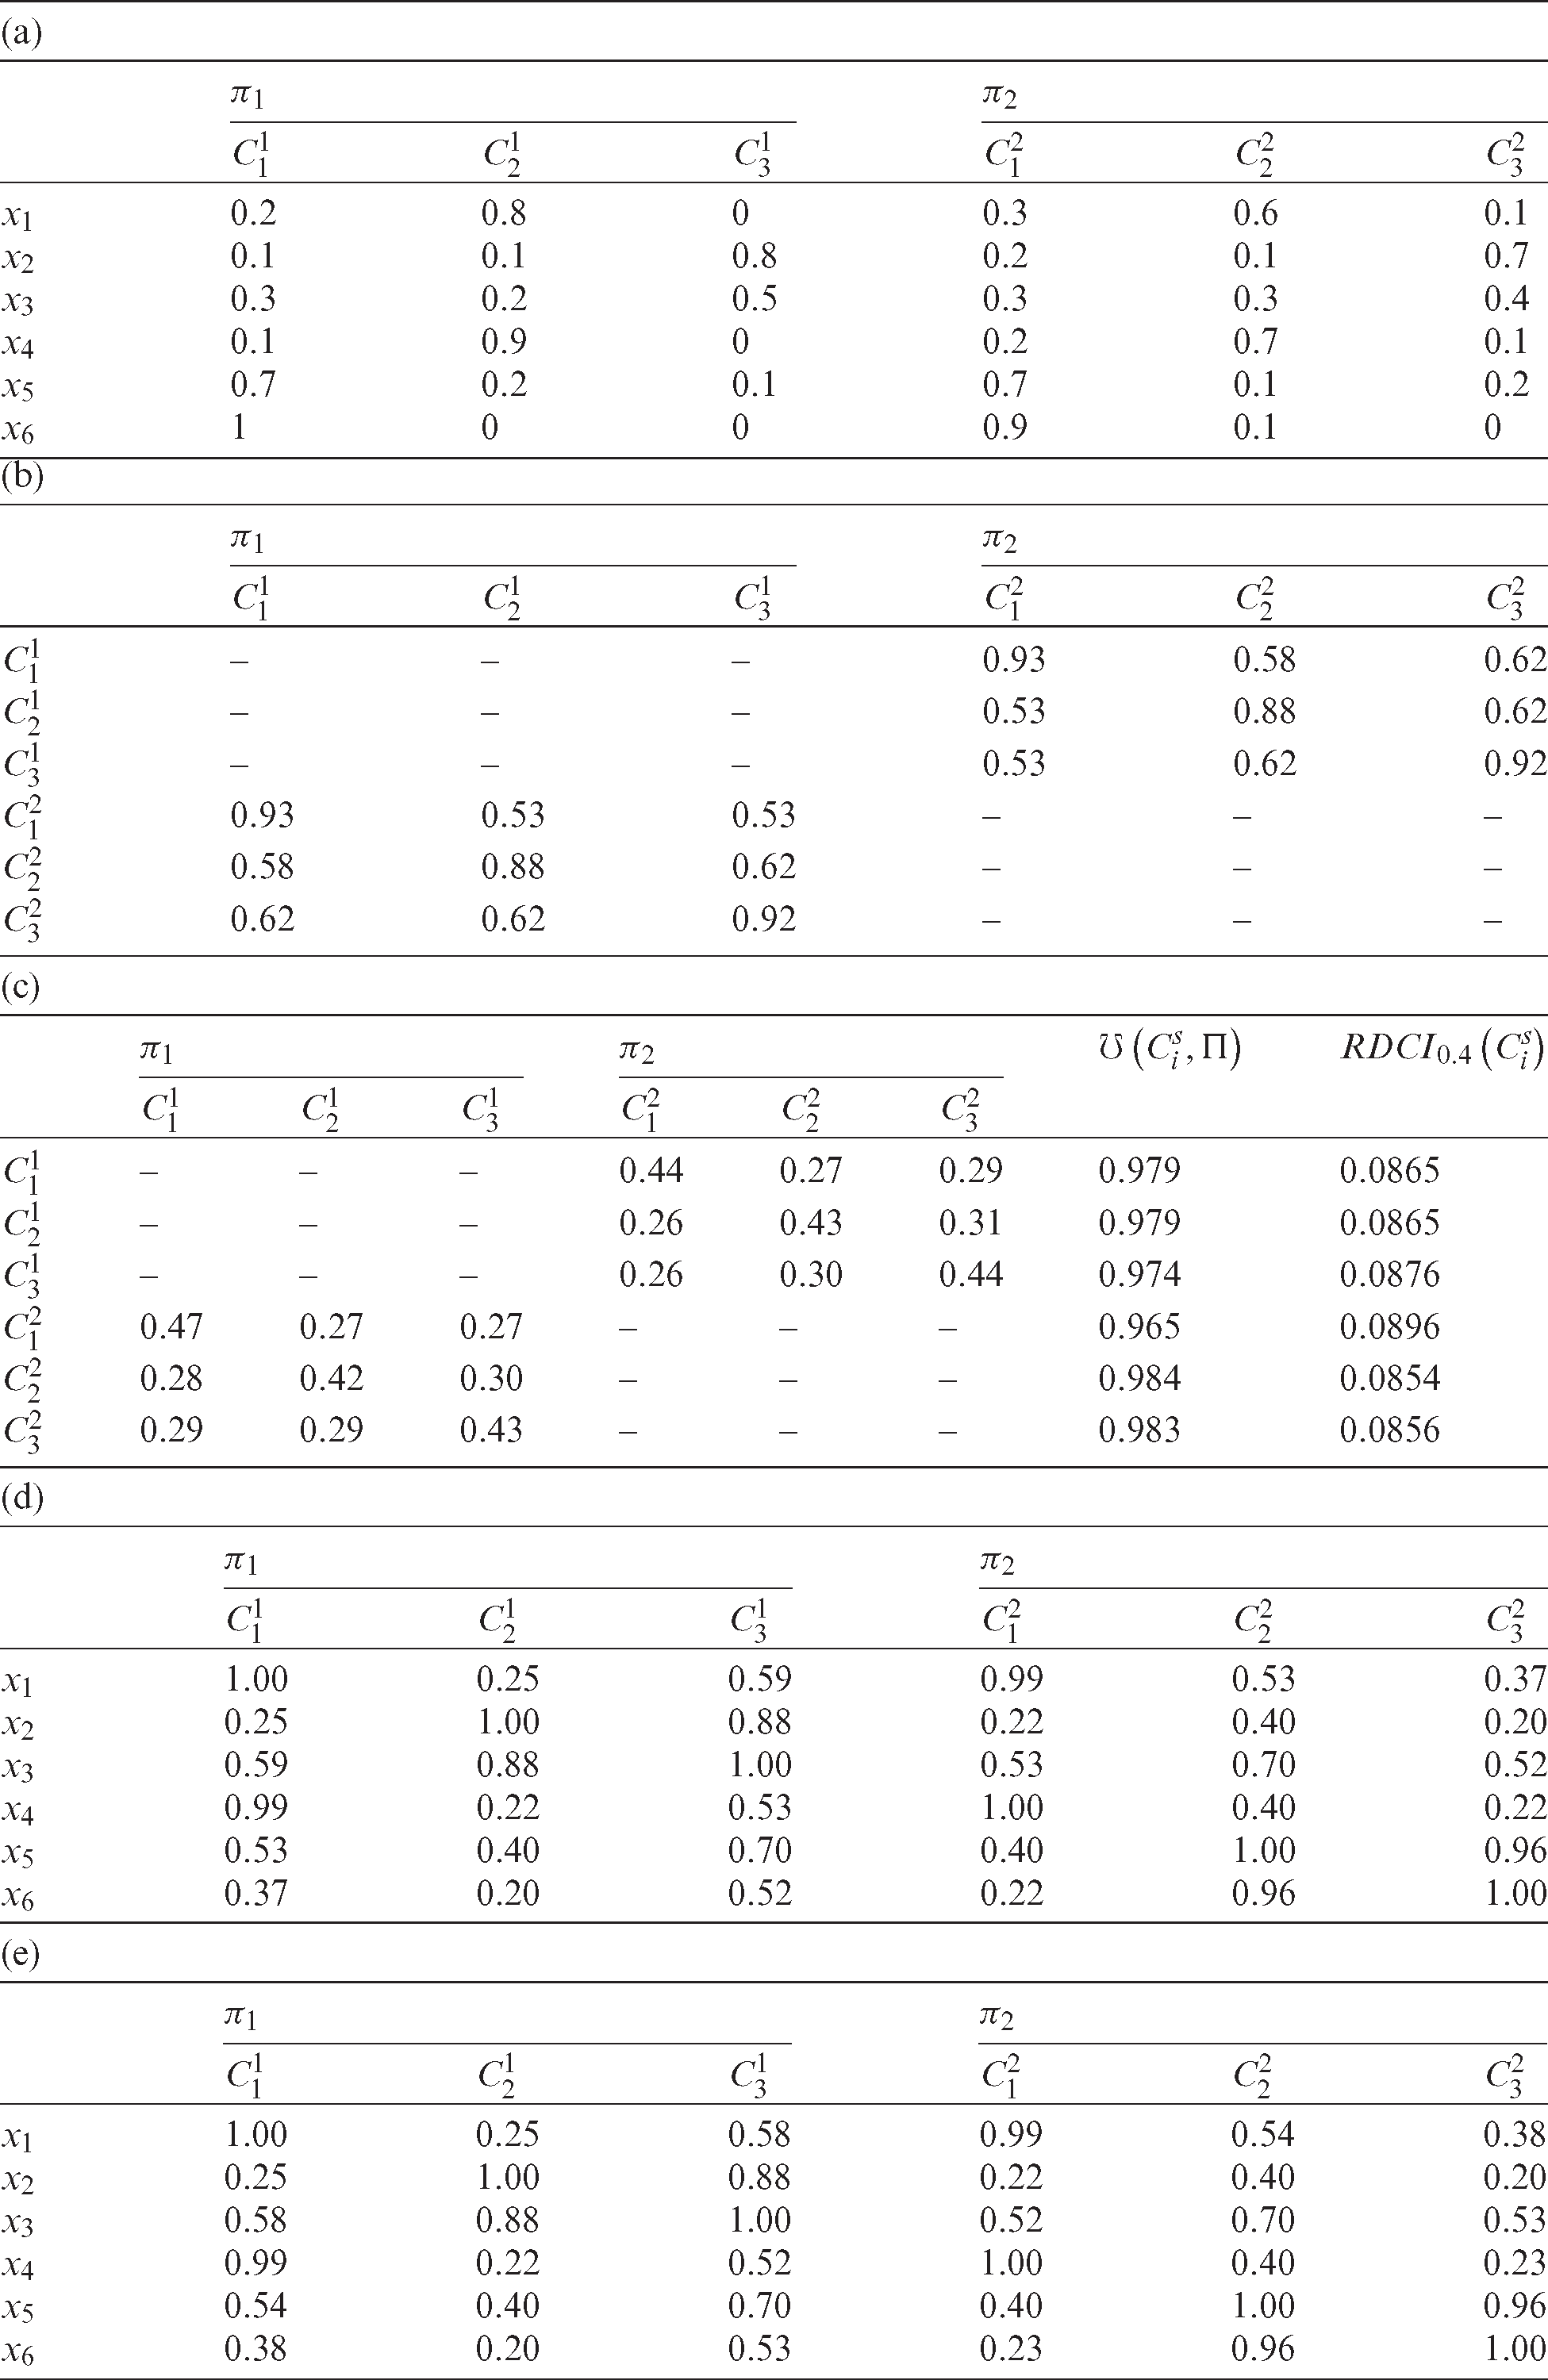
Toy example. Tab. 1a represents two fuzzy clusterings  and
and  (i.e.,
  ) on an assumptive dataset x with 6 data objects (i.e., M = 6). Tab. 1b represents the
  values of the fuzzy clusters in Tab. 1a. Tab. 1c shows
  values of the fuzzy clusters in Tab. 1a and their unreliability values. Tab. 1c also contains the corresponding RDCI values of fuzzy clusters. Using Eq. (8), the co-association matrix FCA of
  and
and  from Tab. 1a is derived and shown in Tab. 1d. Tab. 1e exhibits the weighted co-association matrix of the fuzzy clustering ensemble presented in Tab. 1a regarding the calculated RDCIs.
Table 1: An example for the proposed method
Final clustering computation, which is the last stage according to Fig. 1b, is performed through three proposed consensus algorithms in this section based on the following ways: (a) Using co-association matrix and a subsequent hierarchical clustering, (b) According to reliability computation of each cluster of the ensemble and a subsequent graph clustering, and (c) Based on the acceptability computation of each cluster over other clusters of the ensemble and subsequently applying of a metaheuristic algorithm.
4.5.1 WFCA-Based Consensus Function
When a cluster’s unreliability is a large value with respect to the base clusterings, we understand that the cluster is divided into some fragments of the data objects in the partitions of the ensemble. Here, a conclusion is to keep the clusters with large reliability values with respect to the clustering ensemble in the final ensemble of elite clusters. By considering reliability values of clusters in co-association matrix computation, and viewing it as a new similarity matrix between the data object pairs in the dataset, the consensus partition can be achieved by applying a simple FCM clusterer algorithm or a hierarchical clusterer algorithm over the new similarity matrix.
We need to calculate the weight of each cluster using Eq. (7) to achieve the final clustering from base clusterings  based on each cluster’s local reliability value in the ensemble. Therefore, to compute the entropy of each cluster in
  , the following steps must be followed: the acceptability of any cluster (denoted by p) in the ensemble
  is obtained by Eq. (4) and then, it is normalized. Then, the unreliability of each cluster is computed by Eq. (5) with respect to the clustering
  . Subsequently, the entropy of each cluster is calculated according to Eq. (6) in the ensemble. After computation of the RDCI, using Eq. (9), the weighted fuzzy co-association matrix of the clustering ensemble is acquired and then, it is normalized. For consensus function, a hierarchical clustering algorithm is implemented which is a widespread clustering technique whose typical input is a distance matrix d achieved by
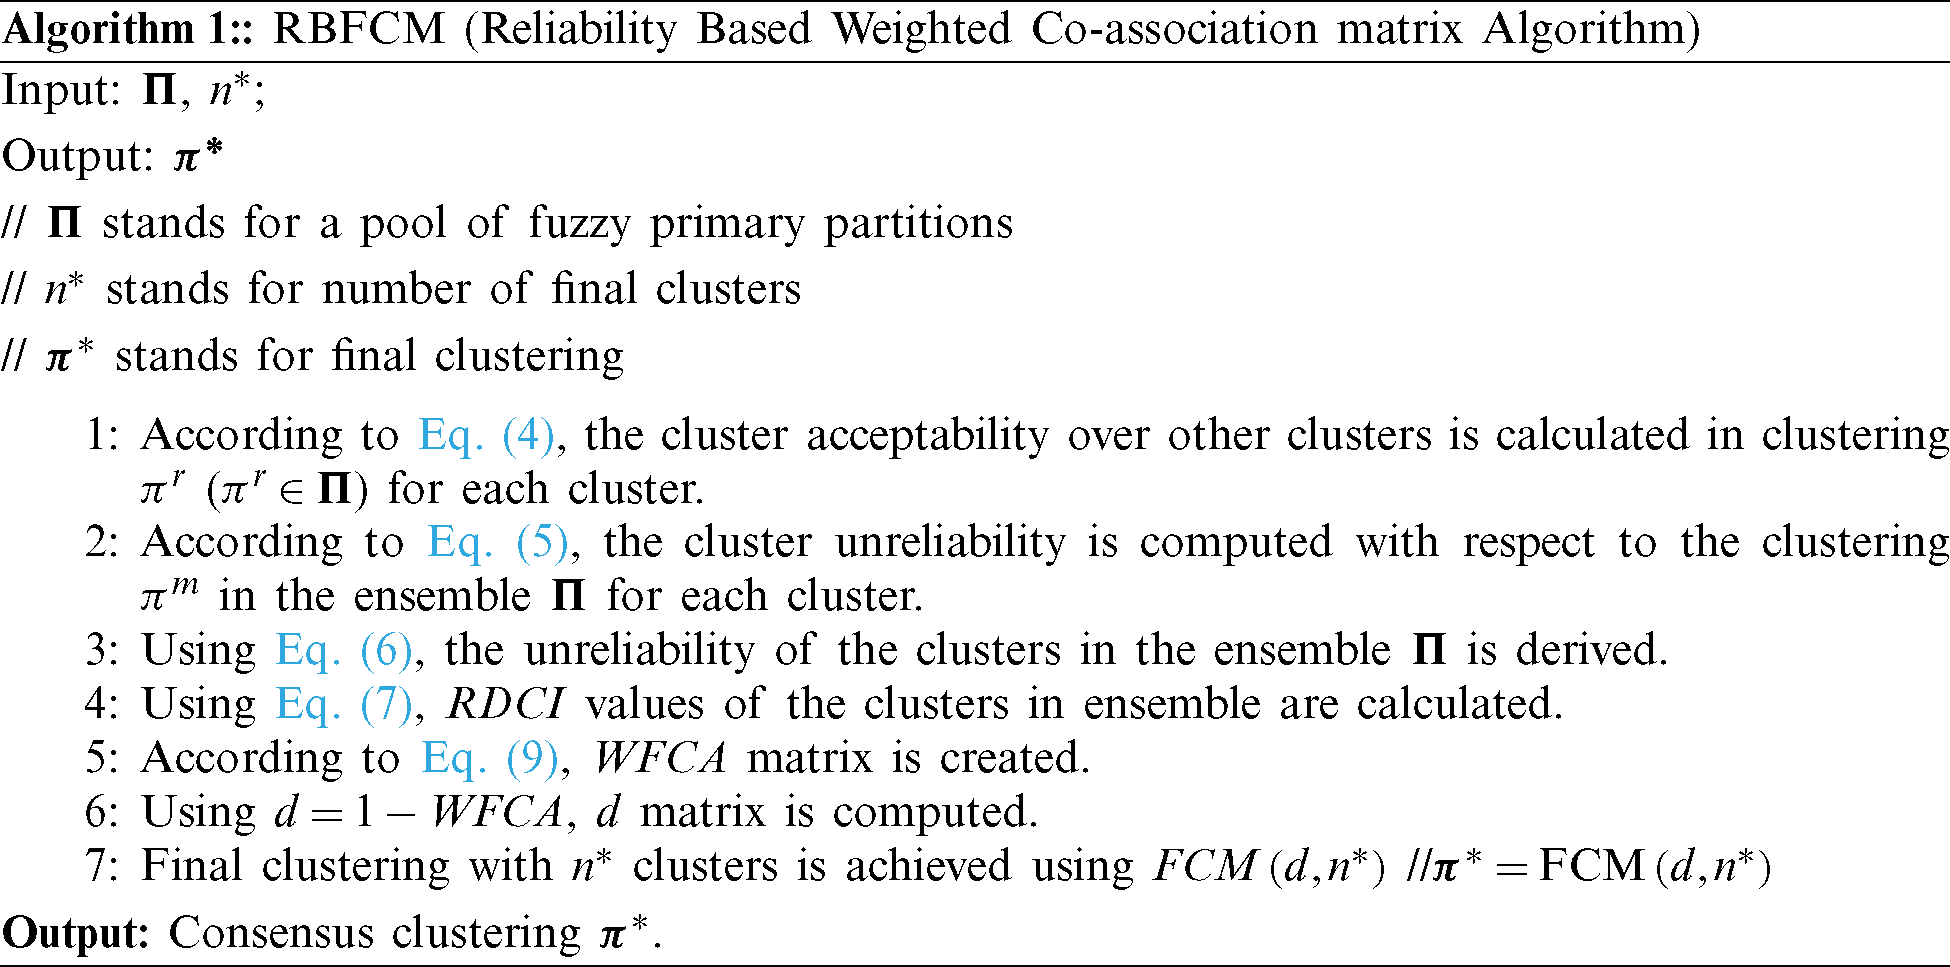
  . Also, for consensus function, a simple FCM clustering algorithm can be employed instead of the hierarchical clustering algorithm by considering the distance matrix d as an intermediate feature space. RBFCM algorithm with two inputs (primary clustering ensemble
  and
and  number of clusters in the consensus partition) is presented in detail as follows in Algorithm 1.
:
4.5.2 Reliability Based Graph Clustering Algorithm
According to the definition of the bipartite graph and its clustering in which all of clusters and data points are considered to be its nodes, RBGC consensus function is proposed. In order to have an edge between two vertices, they have to be different. Thus, if one node is a data object and the other is a cluster, an edge could be developed. Weight of an edge located between a data object  and a cluster
  is given by Eq. (10).

where  is given by Eq. (7) and
  is a real number in
  which indicates how much data object xi belongs to in cluster vj. The result of application of RDCIs is, in addition of considering the belong-to relationship between objects and clusters by bipartite graph, the reliability values of clusters are reflected. In order to obtain the consensus clustering, after the weighted bipartite graph was constructed, some basic graph partitioning algorithms such as METIS [53] are utilized to divide the mentioned weighted bipartite graph into
  clusters, where
  is the quantity of the desired clusters in the consensus partition and the consensus graph partition is considered to be consensus partition. Algorithm 2 shows RBGP algorithm in detail.


:
4.5.3 Reliability Based Hyper Clustering Algorithm
In RBHC algorithm (presented in Algorithm 3) with the idea of merging similar clusters in an approach which is faster than other two methods (it can be experimentally proved later in Section 5.4), the cluster acceptability over other clusters is considered to be pairwise cluster similarity for each cluster. Pairwise similarity of the clusters is the acceptability of a fuzzy cluster over other clusters.

:
Using Eq. (4), acceptability (p) of each cluster is derived over other clusters in the ensemble  and the pairwise cluster acceptability matrix is obtained which could be clustered into a number of hyper-clusters by the basic clustering algorithms such as k means. After that, depending on the membership scheme (membership value function), the amount that any data point belongs to each hyper-cluster is achieved according to the membership values of the data object to the primary clusters in that hyper-cluster. There are three cases for member scheme. First, the case in which membership scheme is max, membership degree of an arbitrary data object xl in each hyper-cluster is the maximum membership degrees of the data object in all clusters of the hyper-cluster. Second case is when the membership scheme is min in which the minimum of membership degree of an arbitrary data point xl to the base clusters in a hyper-cluster is achieved and the minimum achieved value is considered to be membership degree of the data object in that hyper-cluster. The third case is when membership scheme is sum, where the membership degrees of an arbitrary data object xl in each hyper-cluster is the average of the data object membership degrees in all clusters of the hyper-cluster. Finally, data object membership degrees of each hyper-cluster is divided to sum of the data object membership degrees in all hyper-clusters in order to set this sum to 1. The following notations are used in this paper:
  is a hyper cluster,
  represents the number of base clusters in
  , membership degree of xl in base cluster of Cj is shown by
  , and the membership degree of xl in hyper-cluster
  is shown by
  which is obtained according to Eq. (11).

where  is the membership degree of the data object xl in hyper-cluster
  which is calculated by scheme function. We can use different basic clustering algorithms depending on their applications to accomplish the clustering task on the primary clusters. As an example, we can replace kmeans clusterer algorithm by Kernelized FCM clusterer algorithm when we need to extract the clusters with different shapes. We can use this algorithm to generate the final fuzzy partition which benefits the smaller computation time in comparison with other consensus algorithms. It will be analyzed in Section 5.4.
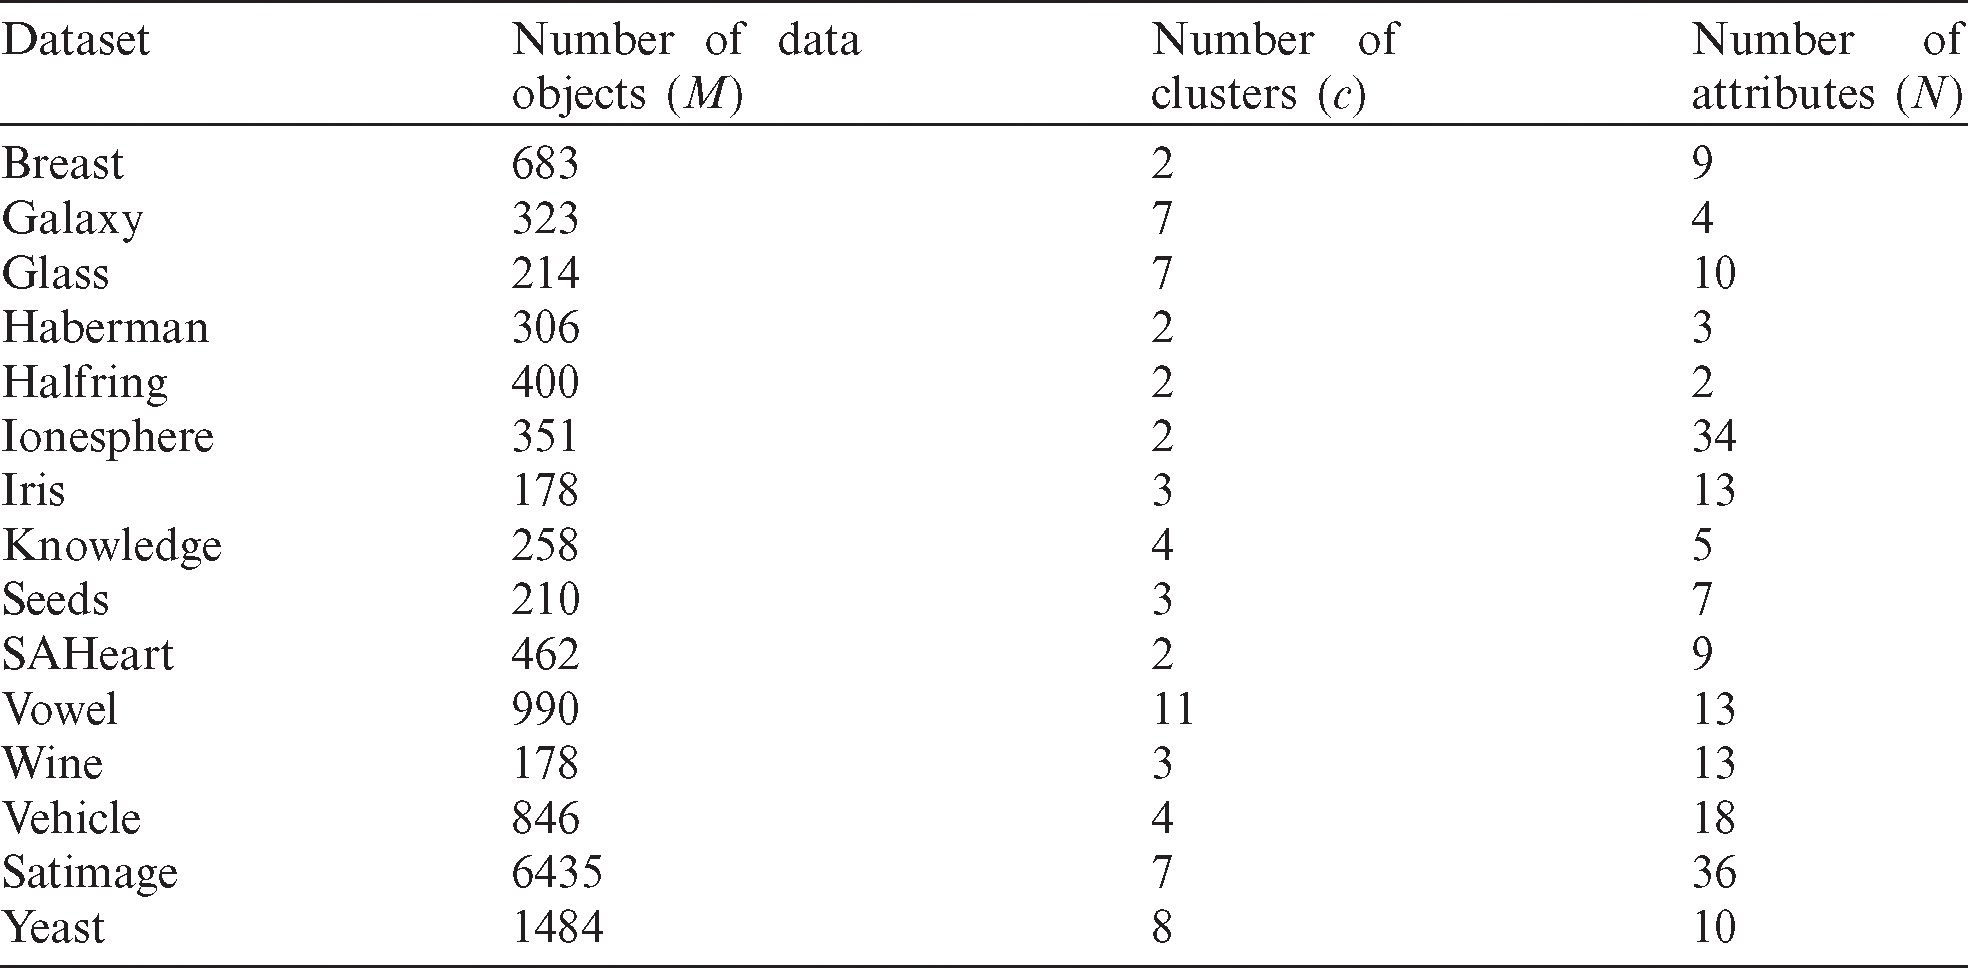
In this paper, several datasets are selected to evaluate the robustness and performance of the proposed fuzzy clustering ensemble approach. Here, for robustness and performance evaluation, we have selected several datasets from UCI machine learning datasets [54], “Galaxy” dataset described in [55] and handmade experimental dataset from a well-known HalfRing dataset as described in Tab. 2.
Table 2: Specifications of the used datasets
5.2 Performance Evaluation Criteria
Clustering performance is evaluated using the accuracy (AC) and normalized mutual information (NMI) criteria operating on the crisp clusterings and also the XB and FS criteria operating on the fuzzy clusterings. In the following, a general description on these criteria is provided.
The accuracy measure [28] used for clustering performance evaluation, is one of the most widespread evaluation criteria which creates a sound indication between the final clustering and the ground-truth labels (the prior labeling information) of the examined dataset. When the AC values are larger, it means that better clustering results are achieved. NMI is another criterion for evaluating clustering performance which is the normalized mutual information between a pair of partitions [30]. Similar to AC metric, a larger NMI value indicates a better clustering result. A fuzzy partition should be converted to a crisp partition before being given to AC and NMI metrics, because these metrics are designed to operate on the crisp partitions. Another criterion for evaluating fuzzy partition  is XB criterion proposed in [47] and modified in [51]. Another criterion is proposed for evaluating fuzzy clustering named FS. A good clustering result obtains a small FS value [51].
5.3 Base Clustering Generation
By construction of the base clusterings through the FCM clustering algorithm, consensus performance is evaluated over various ensembles. Different numbers of clusters for the FCM method are randomly chosen in the interval  ; therefore, a diverse set of base clusterings could be made, where M is the data objects number in the under test dataset. The base partitions should be constructed for each dataset before applying all methods to a same set of base partitions. For the considered methods, the performance evaluation, robustness assertion and execution-time are respectively measured for the ensemble size
  , 20 and 10. The proposed approach and the state-of-the-art fuzzy clustering ensembles are assessed using their performance criteria and average robustness criterion (in terms of AC) over 100 runs in the simulation environment (MATLAB) to provide a confident and fair comparison.
Achieving a more robust and consistent consensus clustering is the main purpose in a clustering ensemble using combination of several primary partitions. We have compared three proposed consensus algorithms RBFCM, RBGP and RBHC (RBHC contains three versions: (a) RBHC-max, (b) RBHC-sum and (c) RBHC-min) with the state of the art methods, i.e., ITK, sCSPA, sHGPA, sMCLA, sHBGF and the FSCEOGA1 clustering ensemble methods. Performances of the resultant consensus partitions in the proposed and baseline methods are determined by the criteria AC, NMI, XB and FS. Note that in each dataset, number of the clusters is the same as the number of them in pre-defined ground truth labels.
Here, each of the proposed methods and the baseline methods are executed 100 times. Tabs. 3–6 respectively exhibit the average values of 100 runs for AC, NMI, XB and FS criteria where the bolded value in each row is the best acquired performance of each dataset among all of the algorithms. The average performance of all algorithms is shown in the last column for each dataset, and in the last row, performance of each algorithm averaged over all datasets is shown. Because the FSCEOGA1 and ITK are computationally expensive, these methods cannot handle large datasets because of their large execution time. For this reason (i.e., this method is computationally expensive), the performance results of FSCEOGA1 method are presented on 100 different subsamples on the datasets possessing large numbers of data objects including Satimage, Yeast, Vehicle and Vowel. ITK is also a computationally expensive method which makes us present its performance results on the Satimage and Yeast datasets as averaged on 100 different subsamples.
The results of the proposed and other consensus algorithms for different datasets are provided in Tabs. 3–6. From Tab. 3, we can observe that RBGP, RBHC-min and RBFCM outperform other algorithms on five, one and nine datasets respectively while other algorithms do not outperform the rest in any datasets. We can also see that the proposed RBFCM outperforms the other cluster ensemble algorithms in terms of the averaged AC value.
Table 3: Performance comparison of different algorithms in terms of accuracy
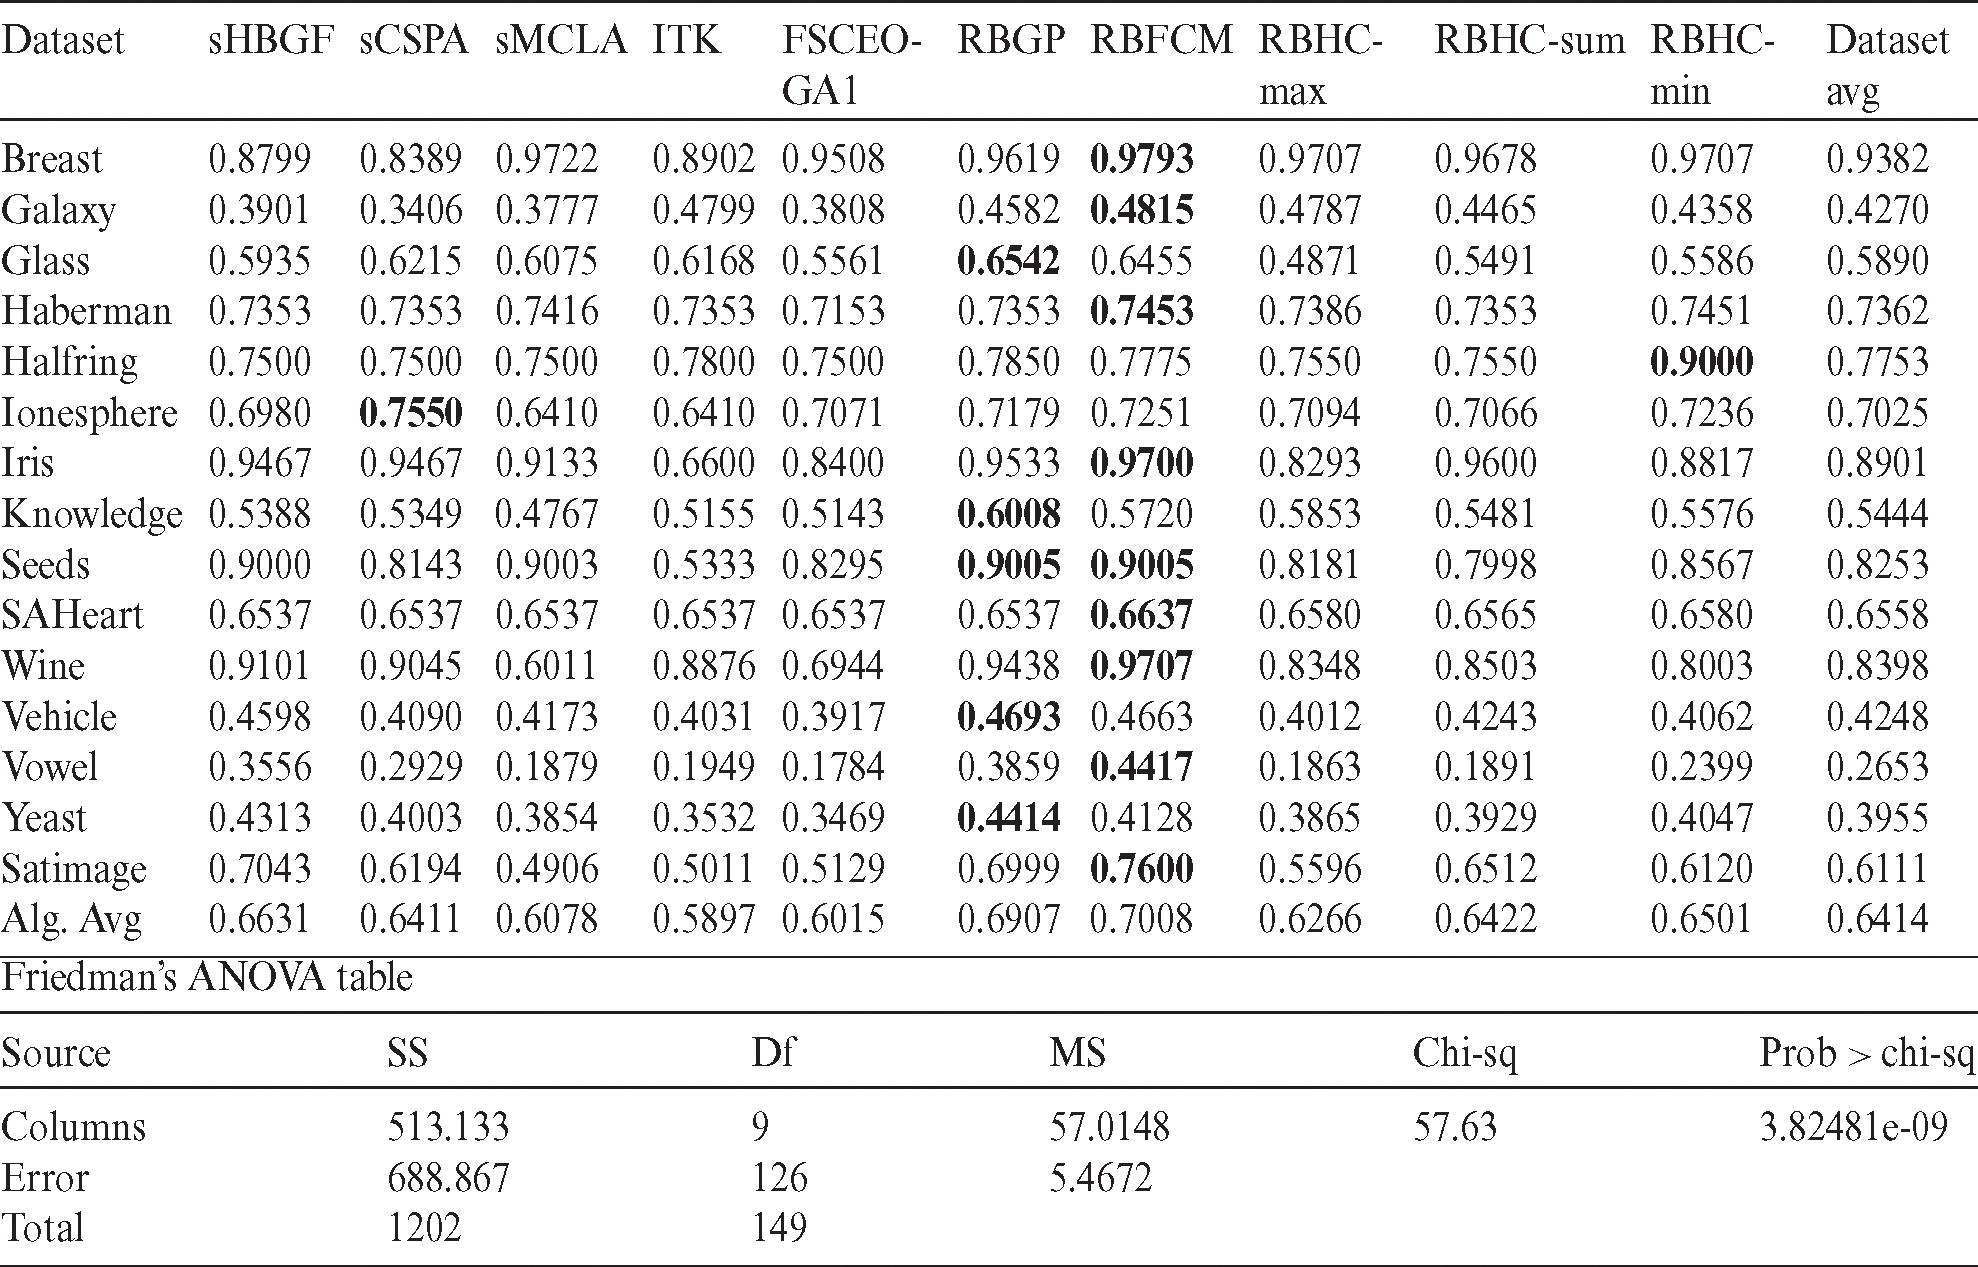
Table 4: Performance comparison of different algorithms in terms of NMI
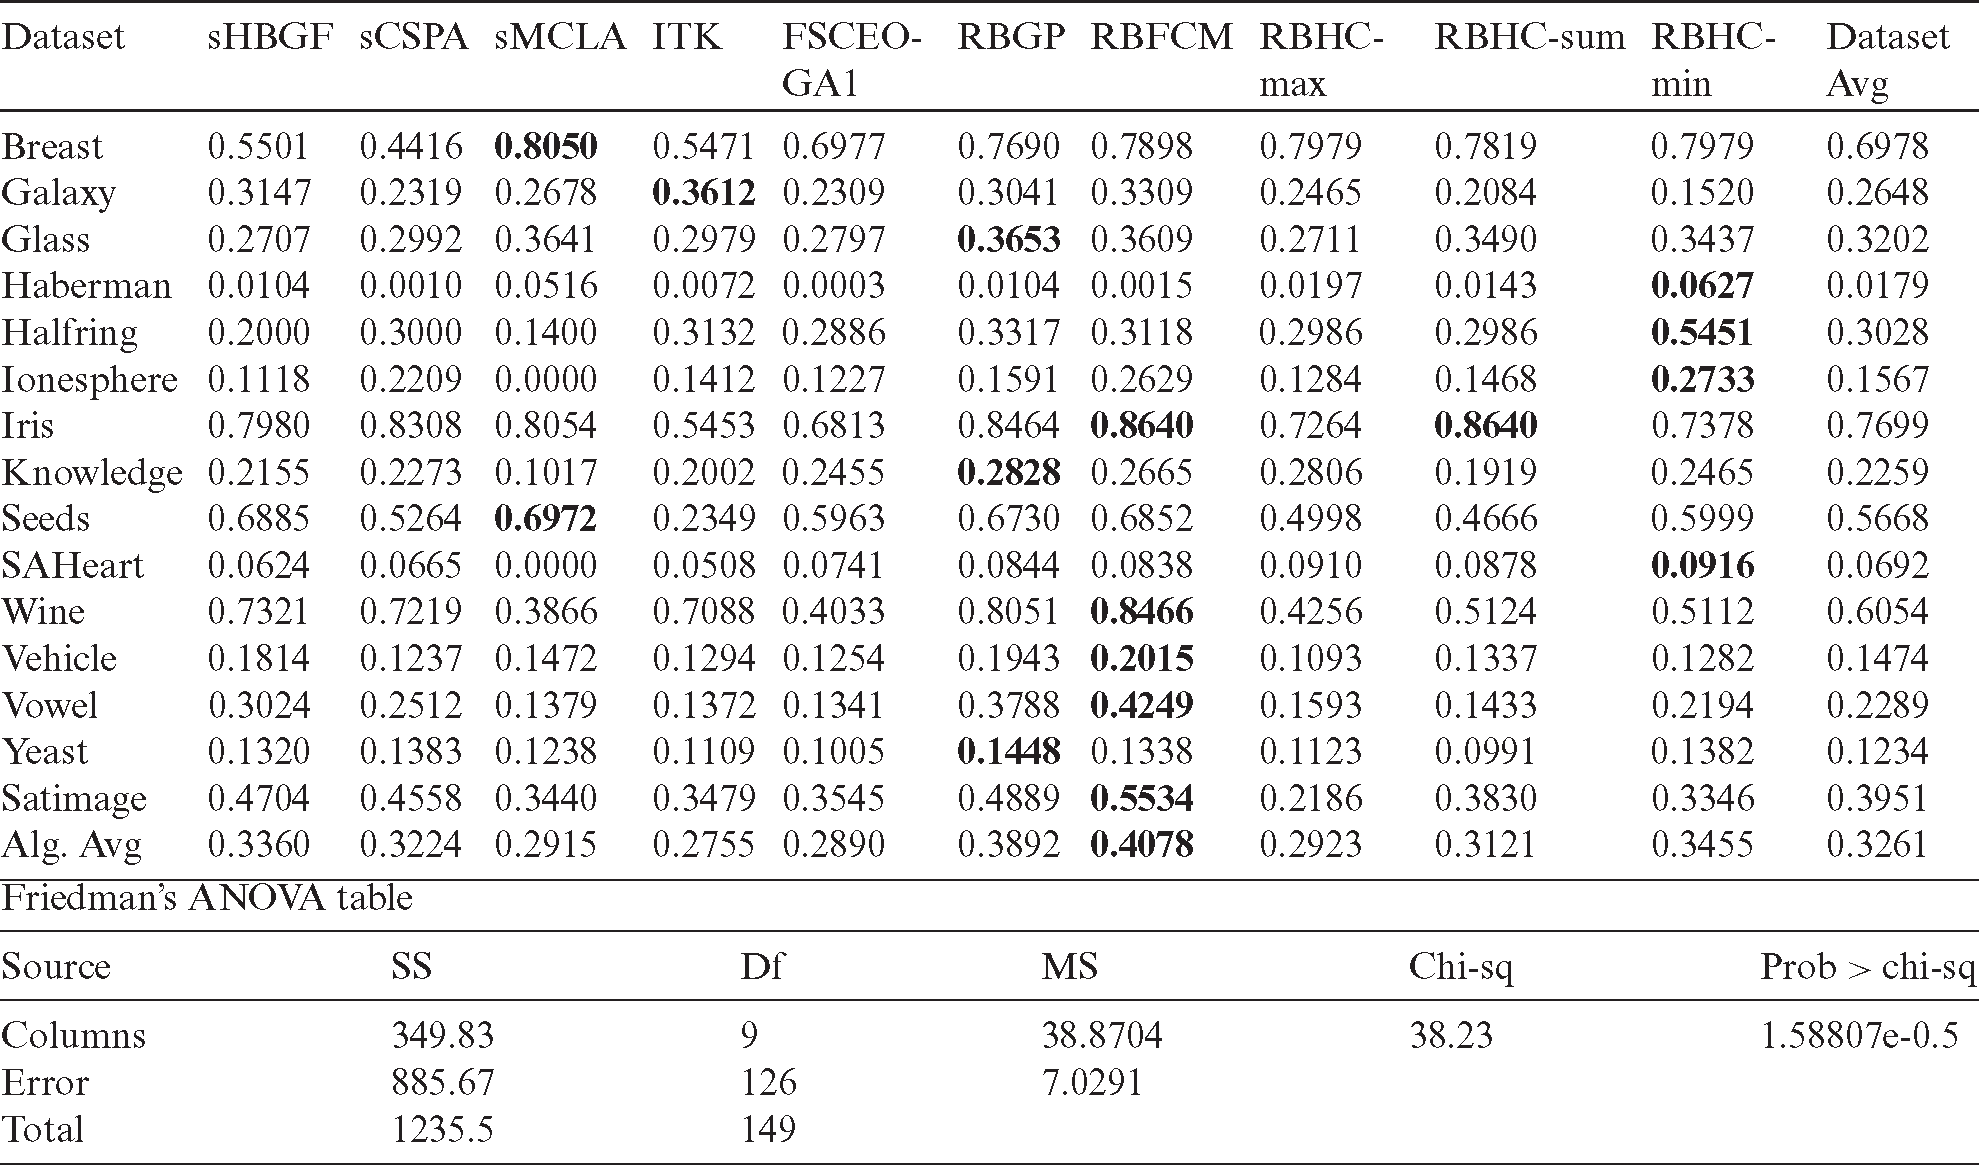
Table 5: Performance comparison of different algorithms in terms of XB
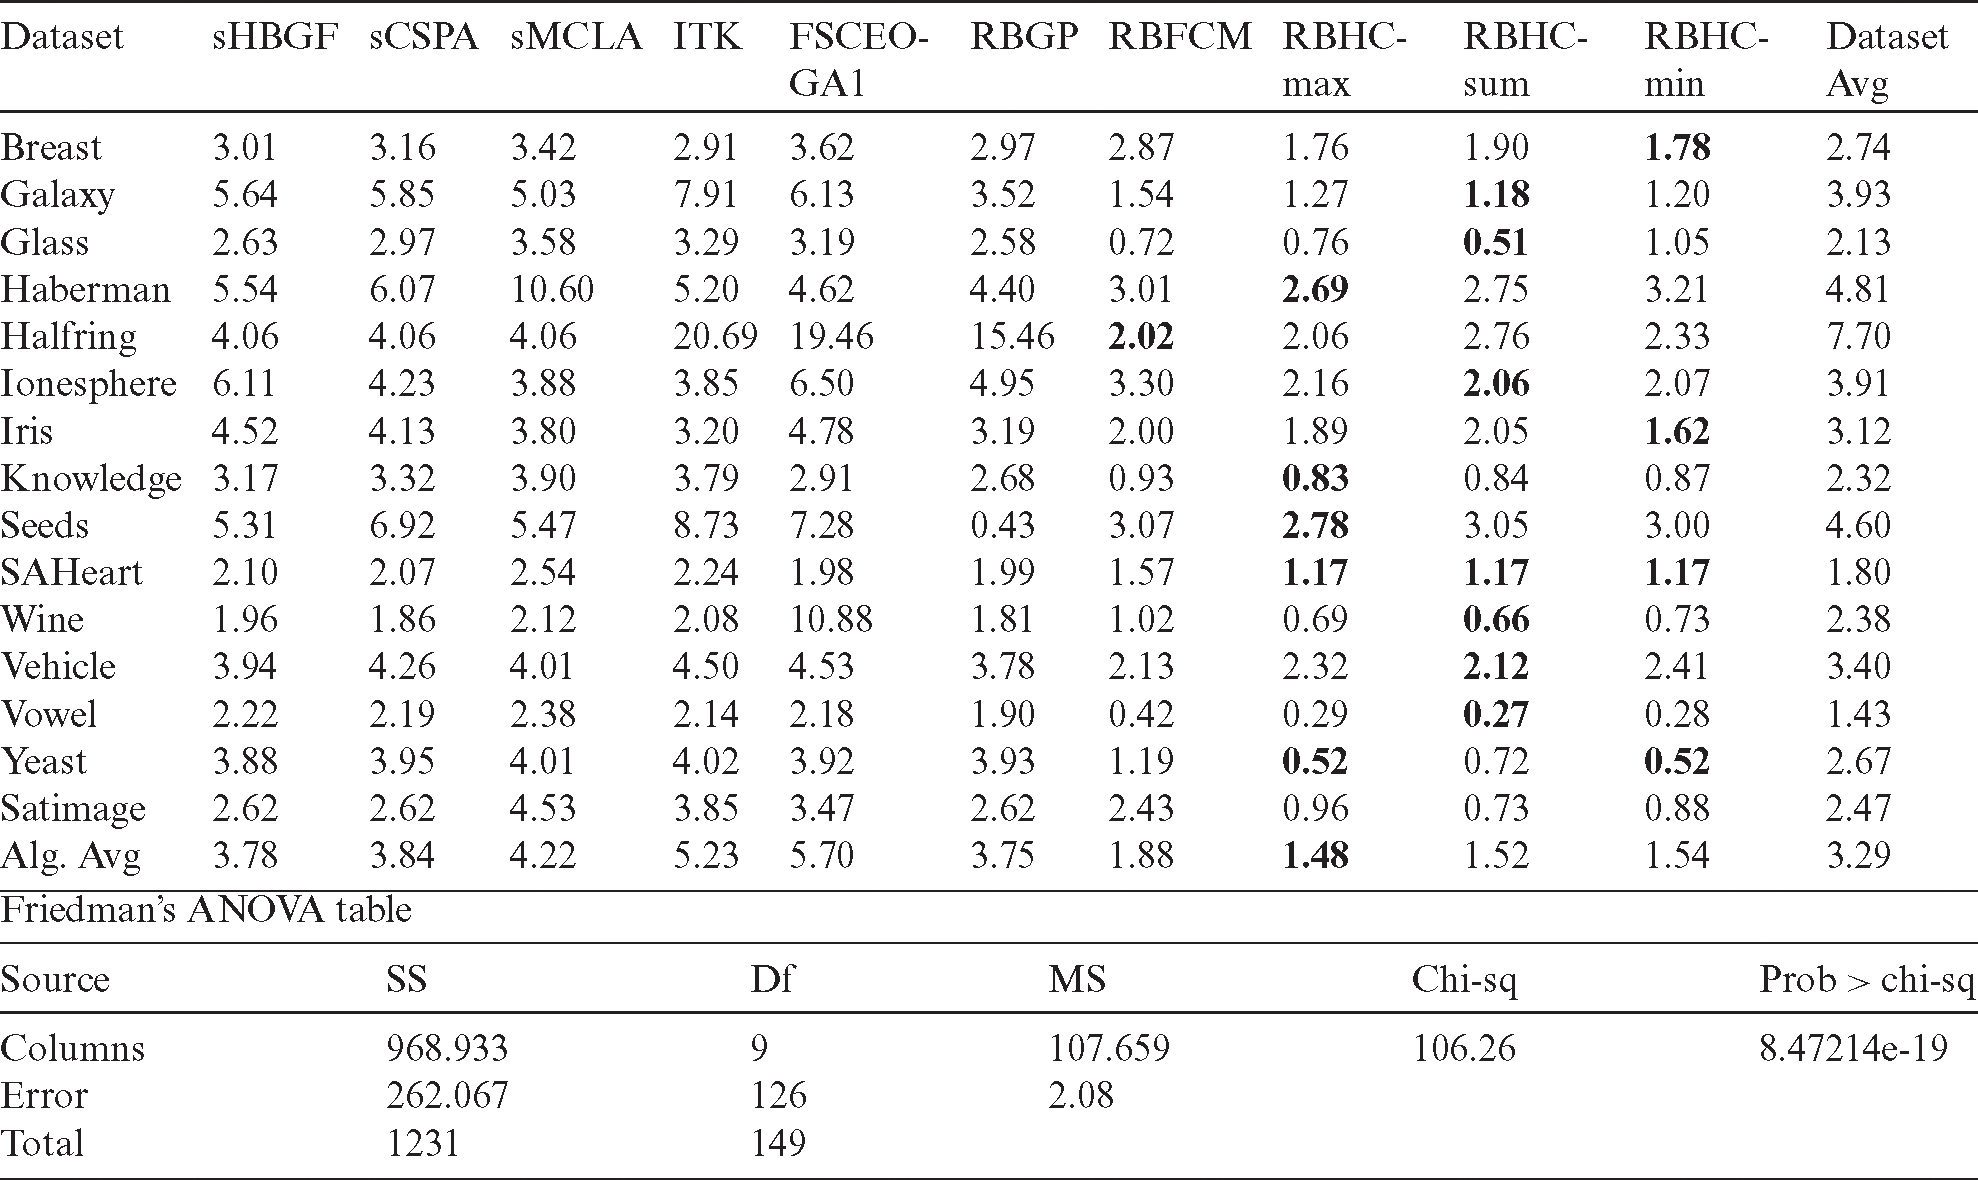
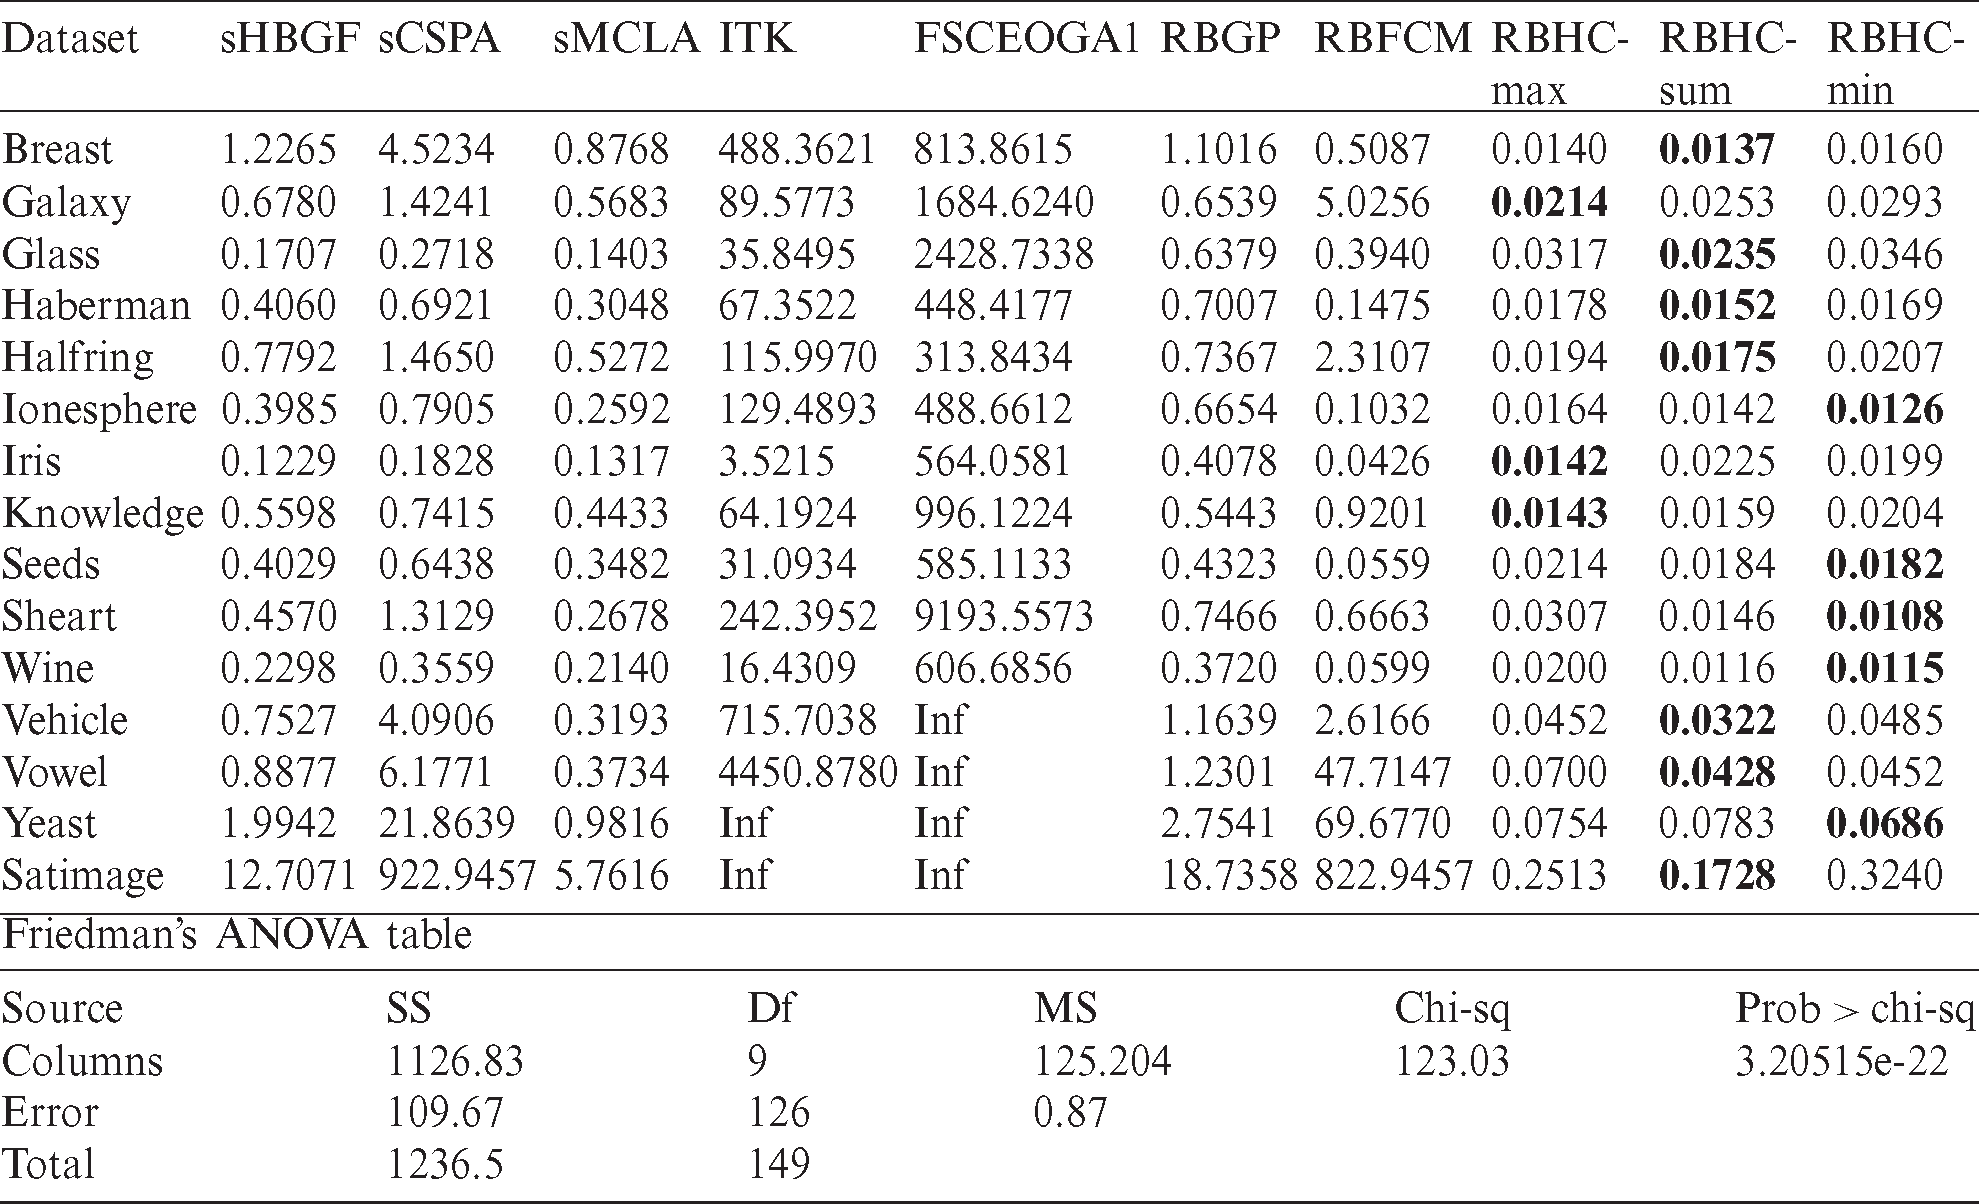
Table 6: Performance comparison of different algorithms in terms of FS

From Tab. 4, we can see that RBGP, RBHC-min, RBFCM outperform the other algorithms on three, four and five datasets. It is also obvious that RBHC-sum, sMCLA and ITK outperform the other algorithms on one, two and one datasets respectively. The averaged performance values on all datasets show that RBFCM algorithm achieves the best performance and RBGP has the next best performance in terms of the averaged NMI value.
Tab. 5 shows that RBHC-sum, RBHC-max and RBHC-min outperform the other algorithms on eight, five and four datasets, respectively while RBFCM outperforms the other algorithms on one dataset. It is also observable that the best averaged XB is achieved by RBHC-max. Also, the proposed RBHC algorithm outperforms the other algorithms on most of the datasets. Using Tab. 6, we can see that, among all algorithms on all datasets, the RBHC methods achieve the best results.
Robustness is a fundamental property for machine learning algorithms, which measures the learning algorithms’ tolerance against perturbations (i.e., noises). In order to assess the performance (here, the performance is only accuracy) robustness of the proposed methods as a fundamental property which measures the algorithms’ tolerance against perturbations, five infected datasets with 5% to 20% noise ratios are selected from KEEL-dataset repository including Glass, Ionesphere, Iris, SAHeart, and Wine [56]. The datasets are infected with 5% to 20% noise ratios and the ensemble size of this evaluation is  . Fig. 2 shows the accuracies of the proposed methods against baseline methods of sCSPA, sMCLA, sHBGF and ITK; it is worthy to be mentioned that the accuracies are averaged on all of the infected datasets here. We can conclude from Fig. 2 that RBGP, RBFCM and sHBGF are respectively the most robust methods against the noises in the infected datasets. We can also see that compared with these three methods, RBHC-sum has a lower accuracy but higher robustness.
In Tab. 7, the execution time of the proposed methods is compared with the other related methods for ensemble size of  over all of our 15 datasets. The execution time per consensus clustering in all algorithms is computed. It is obvious that among the baseline algorithms, FSCEOGA1, and ITK have longer execution times respectively. Since time complexity is quadratic in terms of number of data objects, co-association based algorithms (sCSPA, RBFCM) are with longer execution times after FSCEOGA and ITK. We can also conclude that considering both the performance and the computational cost, RBHC has better performance than the other algorithms because for most of the datasets, it has a shorter average execution time per consensus with sum membership scheme.
Table 7: Consumed times of the different algorithms in terms of second
Here, performance assessment of the proposed method is carried out through statistical analysis to assure that the results are not accidental. It is assumed that the data are with normal distribution or homogeneous variance and multiple variables are similar to those in [57] for non-parametric Friedman test [58].

Figure 2: Averaged accuracy of different methods on all of the infected datasets
Implementing Friedman test [59], we have provided the experimental results in Tabs. 3–7 subject to null hypothesis. The last row of Tab. 3 shows the experimental results according to Friedman test in Tab. 3 where the hypothesis of equal mean rank (in terms of accuracy) is rejected, because of the significant difference shown by probability-value of 3.82E-09. We can also observe that RBFCM, RBGP, sHBGF and RBHC-min are respectively with the highest accuracy scores while ITK has the lowest score. The last rows of Tabs. 4–7 exhibit respectively the Friedman tests of the experimental results for data of Tabs. 4–7. The equal mean rank null hypothesis of the NMI (the XB, the FS and the consumed time) is rejected due to the significant difference provided by probability-value of 1.59E-05 (8.47E −19, 3.02E −16 and 3.21E −22).
Time complexity of RBFCM algorithm is analyzed according to Algorithm 1 which results in complexity of  , where c is the quantity of all of the fuzzy clusters in the primary partitions,
  is number of consensus clusters, t represents quantity of the iterations that the FCM needs to converge and M stands for the dataset size. The co-association matrix computation is performed using the term c2 corresponding to lines 1 to 4 of Algorithm 1. The term cM2 from line 5 and the term
  are related to the time complexity of the FCM. For RBGP, the time complexity is acquired as
  using Algorithm 2, where the terms c2 and Mc are related to bipartite graph construction corresponding to lines 1 to 4, and line 5 respectively. The term
  is also the METIS time complexity with the ensemble size of corresponding line 6. Algorithm 3 is used for the time complexity calculation of RBHC which is derived as
  , where
  , c2 and
  (k means’ time complexity) are related to lines 3 and 1 and 2 respectively. In comparison with the other algorithms, RBHC is more efficient in reality, because of the rapid growth of the majority term, i.e.,
  , provided that
  , and
, and  .
.
Based on fuzzy cluster unreliability estimation, a novel fuzzy clustering ensemble approach was proposed in this paper. Cluster unreliability was estimated according to an entropic criterion using the cluster labels in the entire ensemble. After that, based on the cluster unreliability and local weighting strategy, a new RDCI measure was proposed that is independent on features of the original data and is without any pre-assumption on data distribution. In order to promote the conventional co-association matrix, a local weighting scheme was proposed through the RDCI weight (WFCA) which determines how much amount each primary fuzzy cluster should contribute in construction of the co-association matrix; indeed, it should be with respect to its reliability in the ensemble. Three algorithms of RBFCM, RBGP and RBHC (suitable for large datasets) were proposed that respectively achieve the final clustering from WFCA matrix, the final clustering with respect to the reliability of each cluster and the final clustering by computing the acceptability of each cluster over other clusters of the ensemble. In comparison to other fuzzy clustering ensemble methods, the proposed approach has shown performance improvement and more robustness against noisy datasets through experimental results over fifteen datasets. We concluded that RBHC and RBGP algorithms are appropriate for large datasets because they are linear to the number of data points and have good performance comparison to other fuzzy clustering ensemble methods. It was shown in the paper that RBHC is the best method in terms of time complexity and performance, while RBGP is the best in terms of performance and robustness. RBFCM was also relatively the best in terms of performance. For future works, challenging high dimension datasets in RBFCM and missing values in a dataset can be considered to be problems to be solved. As other challenges for future studies, we can address the diversity impact of the proposed method and its performance in different sampling mechanisms.
Author Contributions: LPY and YXW designed the study and equally contributed the paper as the first author. HG supervised the hypothesis and experiments. LY and YW wrote the manuscript; LY, YW, HP, and KHP edited the manuscript with help from HG and ZM; AB carried out the analyses, implementation of the codes, and the statistical analyses. HP, and KHP generated all figures and tables. All authors have read and approved the final version of the paper.
Funding Statement: The author(s) received no specific funding for this study.
Conflicts of Interest: The authors declare that they have no conflicts of interest to report regarding the present study.
References
1. M. Maleki, J. E. Contreras-Reyes and M. R. Mahmoudi. (2019). “Robust mixture modeling based on two-piece scale mixtures of normal family,” Axioms, vol. 8, no. 2, pp. 38.
2. A. R. Zarei, A. Shabani and M. R. Mahmoudi. (2019). “Comparison of the climate indices based on the relationship between yield loss of rain-fed winter wheat and changes of climate indices using GEE model,” Science of the Total Environment, vol. 661, pp. 711–722.
3. M. R. Mahmoudi, M. H. Heydari and Z. Avazzadeh. (2018). “On the asymptotic distribution for the periodograms of almost periodically correlated (cyclostationary) processes,” Digital Signal Processing, vol. 81, pp. 186–197.
4. M. Maleki and M. R. Mahmoudi. (2017). “Two-piece location-scale distributions based on scale mixtures of normal family,” Communications in Statistics–-Theory and Methods, vol. 46, no. 24, pp. 12356–12369.
5. A. R. Nematollahi, A. R. Soltani and M. R. Mahmoudi. (2017). “Periodically correlated modeling by means of the periodograms asymptotic distributions,” Statistical Papers, vol. 58, no. 4, pp. 1267–1278.
6. M. Maleki, R. B. Arellano-Valle, D. K. Dey, M. R. Mahmoudi and S. M. J. Jalali. (2017). “A Bayesian approach to robust skewed autoregressive processes,” Calcutta Statistical Association Bulletin, vol. 69, no. 2, pp. 165–182.
7. M. R. Mahmoudi, M. Mahmoudi and E. Nahavandi. (2016). “Testing the difference between two independent regression models,” Communications in Statistics–Theory and Methods, vol. 45, no. 21, pp. 6284–6289.
8. J. J. Pan, M. R. Mahmoudi, D. Baleanu and M. Maleki. (2019). “On comparing and classifying several independent linear and non-linear regression models with symmetric errors,” Symmetry, vol. 11, no. 6, pp. 820.
9. M. R. Mahmoudi, M. H. Heydari and R. Roohi. (2019). “A new method to compare the spectral densities of two independent periodically correlated time series,” Mathematics and Computers in Simulation, vol. 160, pp. 103–110.
10. M. R. Mahmoudi, M. H. Heydari and Z. Avazzadeh. (2019). “Testing the difference between spectral densities of two independent periodically correlated (cyclostationary) time series models,” Communications in Statistics–Theory and Methods, vol. 48, no. 9, pp. 2320–2328.
11. M. R. Mahmoudi. (2018). “On comparing two dependent linear and nonlinear regression models,” Journal of Testing and Evaluation, vol. 47, no. 1, pp. 449–458.
12. M. R. Mahmoudi, M. Maleki and A. Pak. (2018). “Testing the equality of two independent regression models,” Communications in Statistics–Theory and Methods, vol. 47, no. 12, pp. 2919–2926.
13. S. B. Rodzman, S. Hasbullah, N. K. Ismail, N. A. Rahman, Z. M. Nor et al. (2020). “Fabricated and Shia Malay translated hadith as negative fuzzy logic ranking indicator on Malay information retrieval,” ASM Science Journal, vol. 13, no. 3, pp. 100–108.
14. M. M. Abdulnabi, R. Hassan, R. Hassan, N. E. Othman and A. Yaacob. (2018). “A fuzzy-based buffer split algorithm for buffer attack detection in internet of things,” Journal of Theoretical and Applied Information Technology, vol. 96, no. 17, pp. 5625–5634.
15. M. A. A. M. Zainuri, E. A. Azari, A. A. Ibrahim, A. Ayob, Y. Yusof et al. (2019). “Analysis of adaptive perturb and observe-fuzzy logic control maximum power point tracking for photovoltaic boost DC-DC converter,” International Journal of Advanced Trends in Computer Science and Engineering, vol. 8, no. 1.6, pp. 201–210.
16. Z. M. Rodzi and A. G. Ahmad. (2020). “Fuzzy parameterized dual hesitant fuzzy soft sets and its application in TOPSIS,” Mathematics and Statistics, vol. 8, no. 1, pp. 32–41.
17. A. M. S. Bahrin and J. M. Ali. (2020). “Hybrid fuzzy-disturbance observer for estimating disturbance in styrene polymerization process,” IOP Conference Series Materials Science and Engineering, vol. 778, no. 1, pp. 12089.
18. B. Choubin, M. Abdolshahnejad, E. Moradi, X. Querol, A. Mosavi et al. (2020). “Spatial hazard assessment of the PM10 using machine learning models in Barcelona,” Spain Science of the Total Environment, vol. 701, pp. 134474.
19. E. Dodangeh, B. Choubin, A. N. Eigdir, N. Nabipour, M. Panahi et al. (2020). “Integrated machine learning methods with resampling algorithms for flood susceptibility prediction,” Science of the Total Environment, vol. 705, pp. 135983.
20. B. Choubin, A. Mosavi, E. H. Alamdarloo, F. S. Hosseini, S. Shamshirband et al. (2019). “Earth fissure hazard prediction using machine learning models,” Environmental Researc, vol. 179, pp. 108770. [Google Scholar]
21. B. Choubin, M. Borji, A. Mosavi, F. Sajedi-Hosseini, V. P. Singh et al. (2019). “Snow avalanche hazard prediction using machine learning methods,” Journal of Hydrology, vol. 577, pp. 123929.
22. S. Shamshirband, E. J. Nodoushan, J. E. Adolf, A. A. Manaf, A. Mosavi et al. (2019). “Ensemble models with uncertainty analysis for multi-day ahead forecasting of chlorophyll a concentration in coastal waters,” Engineering Applications of Computational Fluid Mechanics, vol. 13, no. 1, pp. 91–101. [Google Scholar]
23. S. Qummar, F. G. Khan, S. Shah, A. Khan, S. Shamshirband et al. (2019). “A deep learning ensemble approach for diabetic retinopathy detection,” IEEE Access, vol. 7, pp. 150530–150539. [Google Scholar]
24. S. M. J. Jalali, S. Ahmadian, A. Khosravi, S. Mirjalili, M. R. Mahmoudi et al. (2020). “Neuroevolution-based autonomous robot navigation: A comparative study,” Cognitive Systems Research, vol. 62, pp. 35–43. [Google Scholar]
25. M. R. Mahmoudi, M. Mahmoudi and A. Pak. (2019). “On comparing, classifying and clustering several dependent regression models,” Journal of Statistical Computation and Simulation, vol. 89, no. 12, pp. 2280–2292. [Google Scholar]
26. A. R. Abbasi, M. R. Mahmoudi and Z. Avazzadeh. (2018). “Diagnosis and clustering of power transformer winding fault types by cross-correlation and clustering analysis of FRA results,” IET Generation, Transmission & Distribution, vol. 12, no. 19, pp. 4301–4309. [Google Scholar]
27. S. Golzari, M. N. Zardehsavar, A. Mousavi, M. R. Saybani, A. Khalili et al. (2019). “KGSA: a gravitational search algorithm for multimodal optimization based on k-means niching technique and a novel elitism strategy,” Open Mathematics, vol. 16, no. 1, pp. 1582–1606. [Google Scholar]
28. F. Rashidi, S. Nejatian, H. Parvin and V. Rezaie. (2019). “Diversity based cluster weighting in cluster ensemble: An information theory approach,” Artificial Intelligence Review, vol. 52, no. 2, pp. 1341–1368. [Google Scholar]
29. H. Niu, N. Khozouie, H. Parvin, H. Alinejad-Rokny, A. Beheshti et al. (2020). “An ensemble of locally reliable cluster solutions,” Applied Sciences, vol. 10, no. 5, pp. 1891. [Google Scholar]
30. A. Strehl and J. Ghosh. (2002). “Cluster ensembles–-A knowledge reuse framework for combining multiple partitions,” Journal of Machine Learning Research, vol. 3, no. 12, pp. 583–617. [Google Scholar]
31. X. Z. Fern and C. E. Brodley. (2004). “Solving cluster ensemble problems by bipartite graph partitioning,” in Proc. ICML, Banff, Canada, pp. 36. [Google Scholar]
32. A. L. N. Fred and A. K. Jain. (2002). “Data clustering using evidence accumulation,” Object Recognition Supported by User Interaction for Service Robots, vol. 4, no. 1, pp. 276–280. [Google Scholar]
33. C. Zhong, X. Yue, Z. Zhang and J. Lei. (2015). “A clustering ensemble: Two-level-refined co-association matrix with path-based transformation,” Pattern Recognition, vol. 48, no. 8, pp. 2699–2709. [Google Scholar]
34. H. Alizadeh, B. Minaei-Bidgoli and H. Parvin. (2013). “Optimizing fuzzy cluster ensemble in string representation,” International Journal of Pattern Recognition and Artificial Intelligence, vol. 27, no. 2, pp. 1350005. [Google Scholar]
35. X. Sevillano, F. Alías and J. C. Socoró. (2012). “Positional and confidence voting-based consensus functions for fuzzy cluster ensembles,” Fuzzy Sets and Systems, vol. 193, no. Supplement C, pp. 1–32. [Google Scholar]
36. J. C. Bezdek, R. Ehrlich and W. Full. (1984). “FCM: The fuzzy c-means clustering algorithm,” Computers & Geosciences, vol. 10, no. 2–3, pp. 191–203. [Google Scholar]
37. K. Punera and J. Ghosh. (2008). “Consensus-based ensembles of soft clustering,” Applied Artificial Intelligence, vol. 22, no. 7–8, pp. 780–810. [Google Scholar]
38. D. Huang, J. H. Lai and C. D. Wang. (2016). “Combining multiple clusterings via crowd agreement estimation and multi-granularity link analysis,” Neurocomputing, vol. 170, no. 11, pp. 240–250. [Google Scholar]
39. Z. Tao, H. Liu, S. Li, Z. Ding and Y. Fu. (2019). “Robust spectral ensemble clustering via rank minimization,” ACM Transactions on Knowledge Discovery from Data, vol. 13, no. 1, pp. 4:1–4:25. [Google Scholar]
40. H. Liu, M. Shao, S. Li and Y. Fu. (2018). “Infinite ensemble clustering,” Data Mining and Knowledge Discovery, vol. 32, no. 2, pp. 385–416. [Google Scholar]
41. J. Wu, Z. Wu, J. Cao, H. Liu, G. Chen et al. (2017). “Fuzzy consensus clustering with applications on big data,” IEEE Transactions on Fuzzy Systems, vol. 25, no. 6, pp. 1430–1445. [Google Scholar]
42. E. Dimitriadou, A. Weingessel and K. Hornik. (2002). “A combination scheme for fuzzy clustering,” International Journal of Pattern Recognition and Artificial Intelligence, vol. 16, no. 7, pp. 901–912. [Google Scholar]
43. I. S. Dhillon, S. Mallela and R. Kumar. (2003). “A divisive information-theoretic feature clustering algorithm for text classification,” Journal of Machine Learning Research, vol. 3, pp. 1265–1287. [Google Scholar]
44. E. Bedalli, E. Mançellari and O. Asilkan. (2016). “A heterogeneous cluster ensemble model for improving the stability of fuzzy cluster analysis,” Procedia Computer Science, vol. 102, no. 8, pp. 129–136. [Google Scholar]
45. H. W. Kuhn. (1955). “The Hungarian method for the assignment problem,” Naval Research Logistics, vol. 2, no. 1–2, pp. 83–97. [Google Scholar]
46. J. V. DeOliveira, A. Szabo and L. N. DeCastro. (2017). “Particle swarm clustering in clustering ensembles: Exploiting pruning and alignment free consensus,” Applied Soft Computing, vol. 55, no. 3, pp. 141–153. [Google Scholar]
47. X. L. Xie and G. Beni. (1991). “A validity measure for fuzzy clustering,” IEEE Transactions on Pattern Analysis and Machine Intelligence, vol. 13, no. 8, pp. 841–847. [Google Scholar]
48. T. Caliński and J. Harabasz. (1974). “A dendrite method for cluster analysis,” Communications in Statistics–Theory and Methods, vol. 3, no. 1, pp. 1–27. [Google Scholar]
49. J. C. Dunn. (1974). “Well-separated clusters and optimal fuzzy partitions,” Journal of Cybernetics, vol. 4, no. 1, pp. 95–104. [Google Scholar]
50. P. J. Rousseeuw. (1987). “Silhouettes: A graphical aid to the interpretation and validation of cluster analysis,” Journal of Computational and Applied Mathematics, vol. 20, pp. 53–65. [Google Scholar]
51. N. R. Pal and J. C. Bezdek. (1995). “On cluster validity for the fuzzy c-means model,” IEEE Transactions on Fuzzy Systems, vol. 3, no. 3, pp. 370–379. [Google Scholar]
52. S. Vega-Pons and J. Correa-Morris. (2011). “A survey of clustering ensemble algorithms,” International Journal of Pattern Recognition and Artificial Intelligence, vol. 25, no. 3, pp. 337–372. [Google Scholar]
53. G. Karypis and V. Kumar. (1998). “A fast and high quality multilevel scheme for partitioning irregular graphs,” SIAM Journal on Scientific Computing, vol. 20, no. 1, pp. 359–392. [Google Scholar]
54. S. C. Odewahn, E. B. Stockwell, R. L. Pennington, R. M. Humphreys and W. A. Zumach. (1992). “Automated star/galaxy discrimination with neural networks,” The Astronomical Journal, vol. 103, no. 1, pp. 318–331. [Google Scholar]
55. C. L. Blake and C. J. Merz. (1998). “UCI repository of machine learning databases,” . [Online]. Available: http://www.ics.uci.edu/mlearn/MLRepository.html. [Google Scholar]
56. A. F. Ernández, J. L. Uengo and J. D. Errac. (2011). “KEEL data-mining software tool: Data set repository,” Integration of Algorithms and Experimental Analysis Framework, vol. 17, no. 1, pp. 255–287. [Google Scholar]
57. J. Demšar. (2006). “Statistical comparisons of classifiers over multiple data sets,” Journal of Machine Learning Research, vol. 7, no. 1, pp. 1–30. [Google Scholar]
58. M. Friedman. (1937). “The use of ranks to avoid the assumption of normality implicit in the analysis of variance,” Journal of the American Statistical Association, vol. 32, no. 200, pp. 675–701. [Google Scholar]
59. R. I. Iman and J. M. Davenport. (1980). “Approximations of the critical region of the fbietkan statistic,” Communications in Statistics-Theory and Methods, vol. 9, no. 6, pp. 571–595. [Google Scholar]
 | This work is licensed under a Creative Commons Attribution 4.0 International License, which permits unrestricted use, distribution, and reproduction in any medium, provided the original work is properly cited. |